Stocks and the USD have essentially chopped sideways over the last 24 hours and I’m wondering if this will remain the pattern until after Friday’s NFP. The U/J has been ranging within a daily chart triangle since December and within the daily Cloud since mid January and I’m wondering if this pair may have been trying to tell us that some FX choppiness was heading our way!
There have been some huge FX moves over recent weeks but many of these have been sharp, news-driven moves not that are not as easily picked up by longer time frame trend-trading systems. In hindsight, I now wonder whether the range-bound nature of the huge USD/JPY pair may have been some kind of a warning? I have been noting in my posts how shorter time frame trading off 30 min charts during the US session has often offered better trading opportunities and this may remain the case until the U/J breaks out. I will keep tabs on any such correlation on this front!
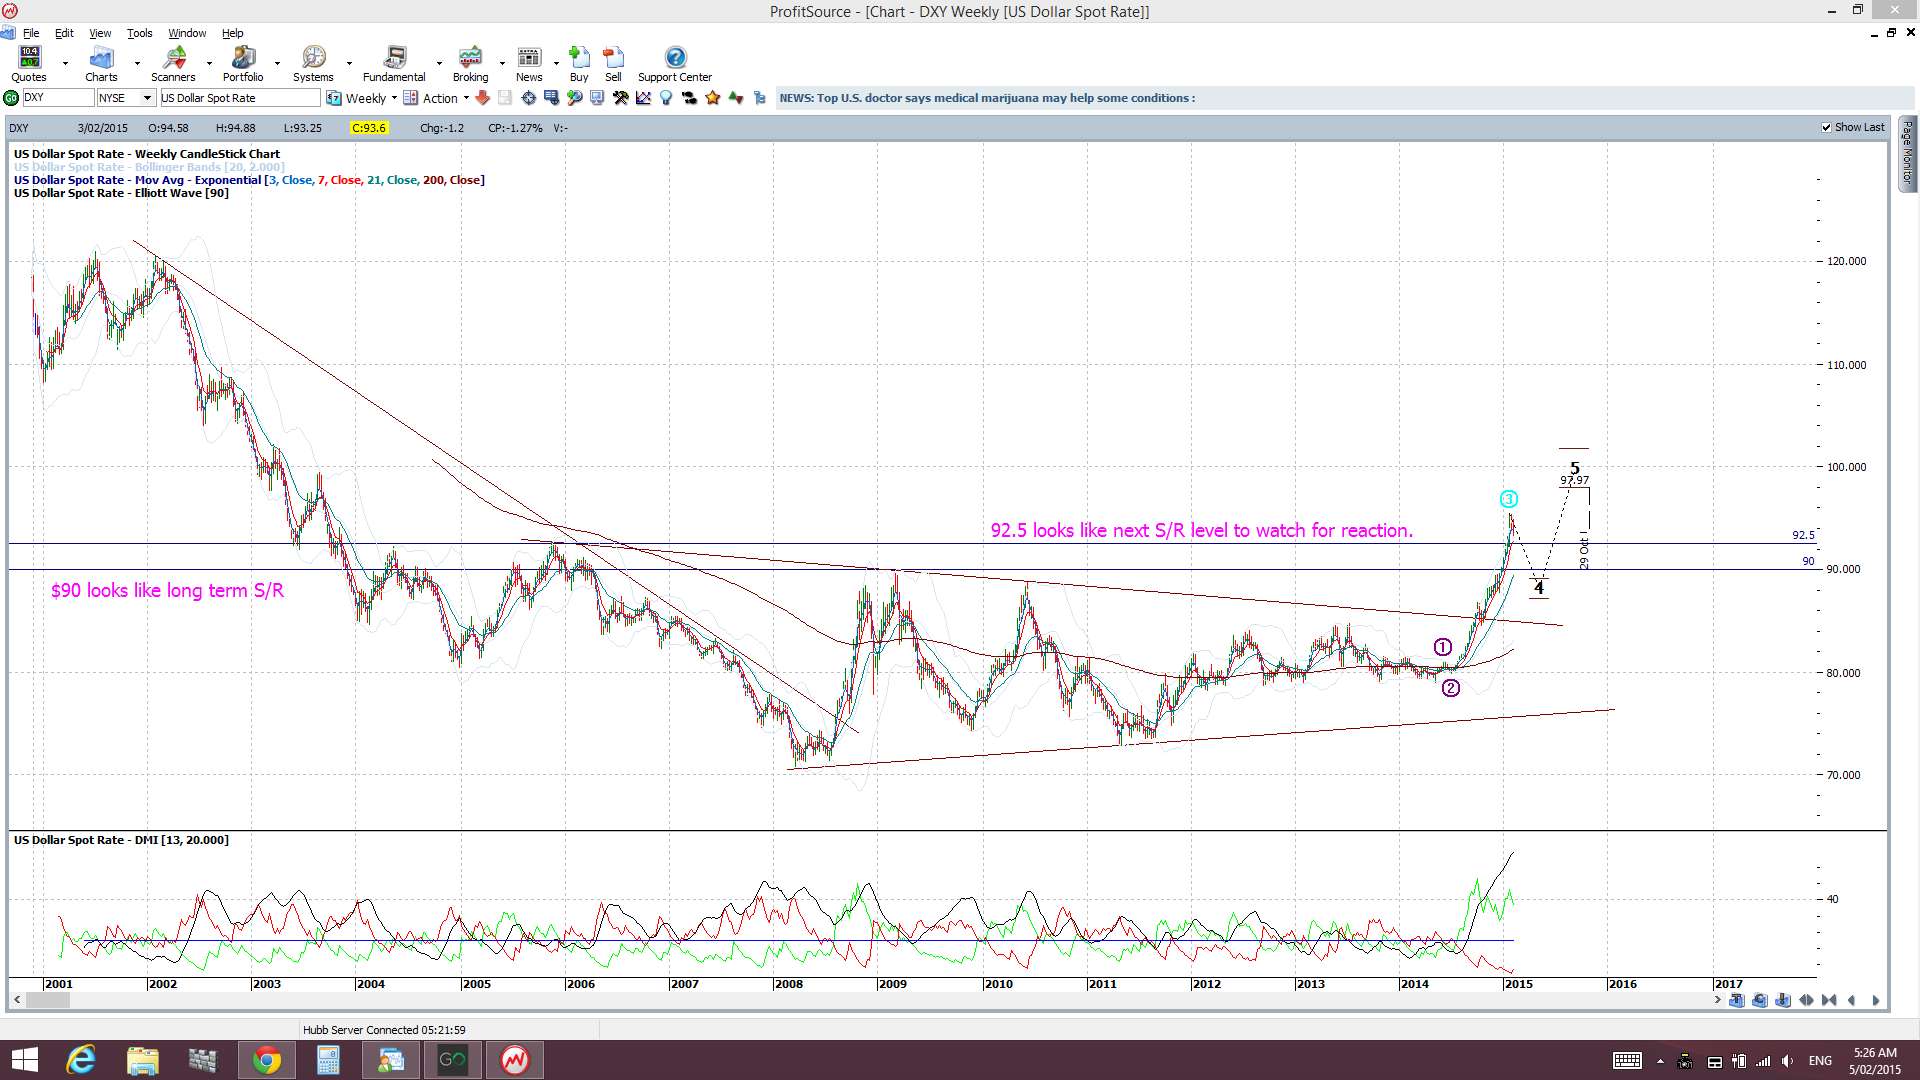
USDX weekly (longer time frame chart): the USD is still trading above the broken 92.50 level but a test of this region to see if previous resistance has turned to support looks likely.
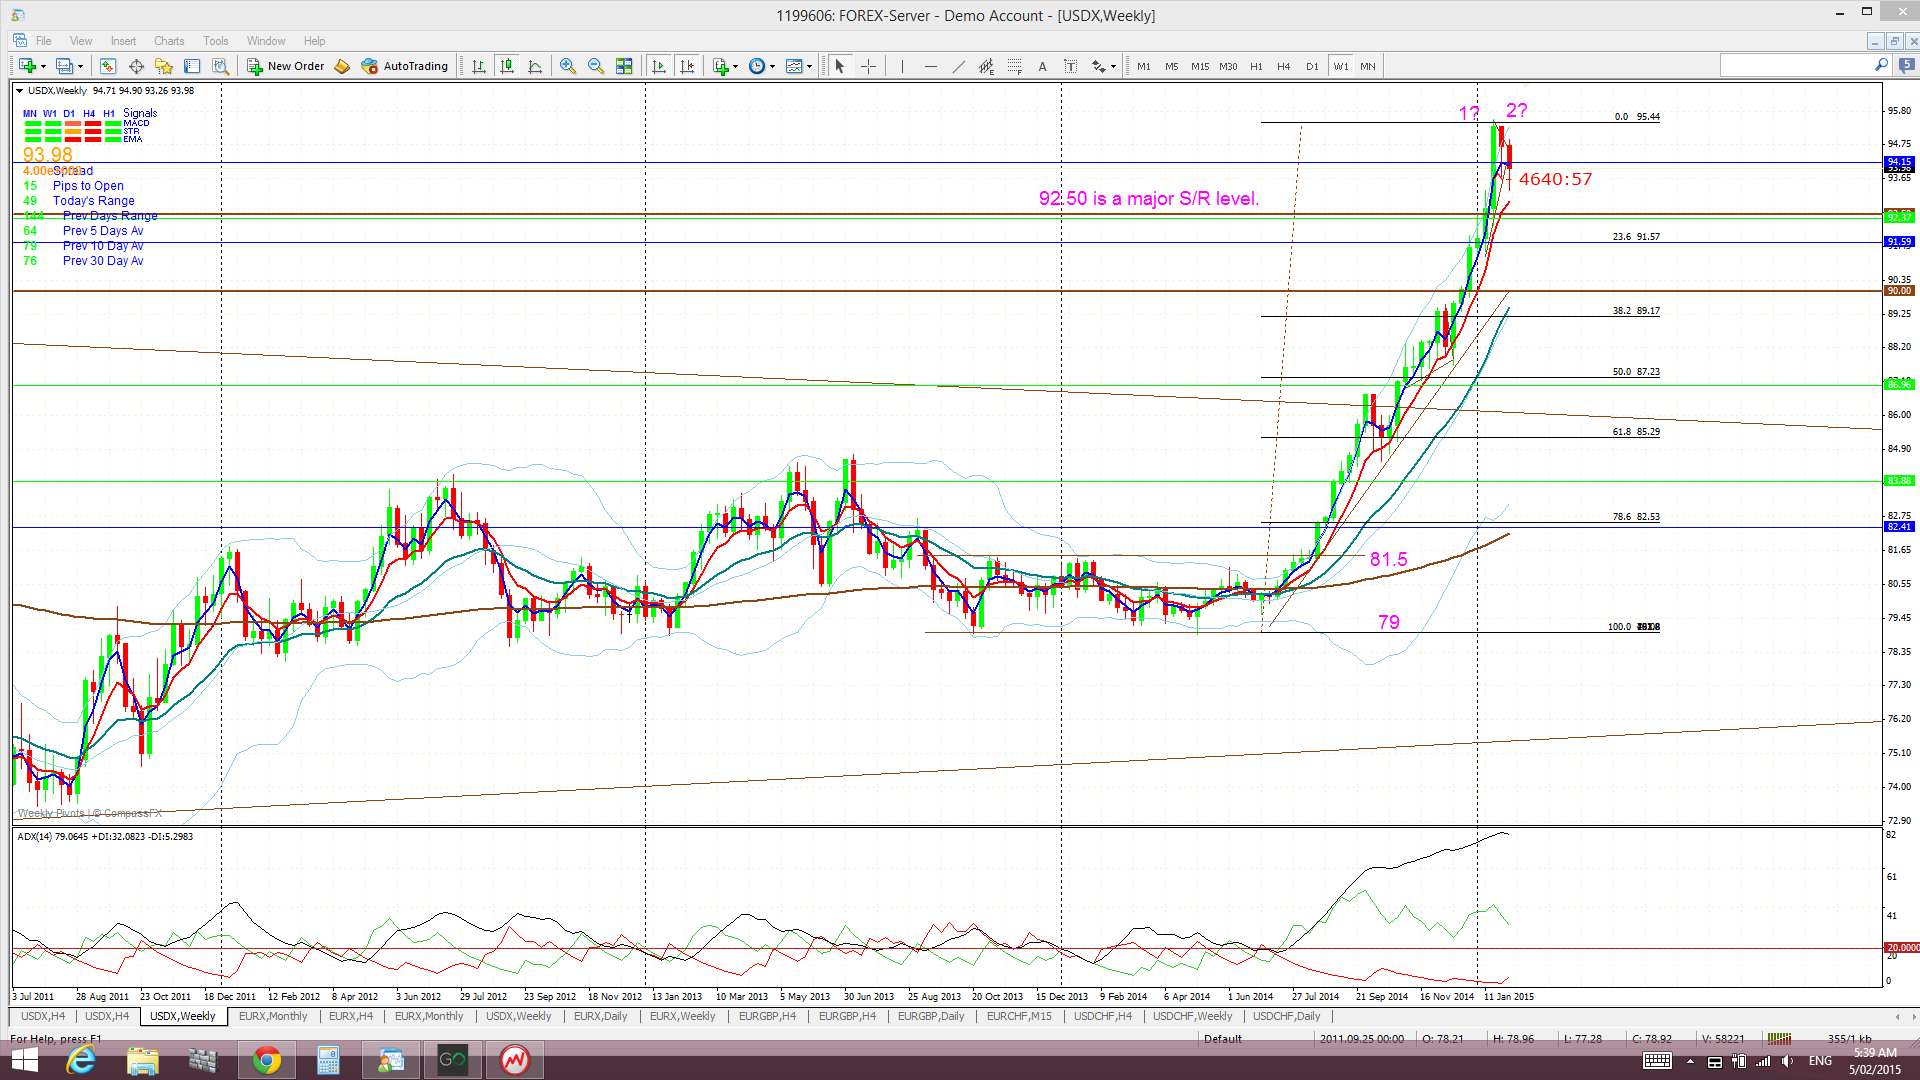
USDX weekly (MT4 chart): I suspect that USD pair choppiness might continue until there is clarity here about whether the USD is in pullback mode or in consolidation and test of 92.50 before bullish continuation mode. I still see the 61.8% fib and broken trend line confluence area as a possible target for any pullback:
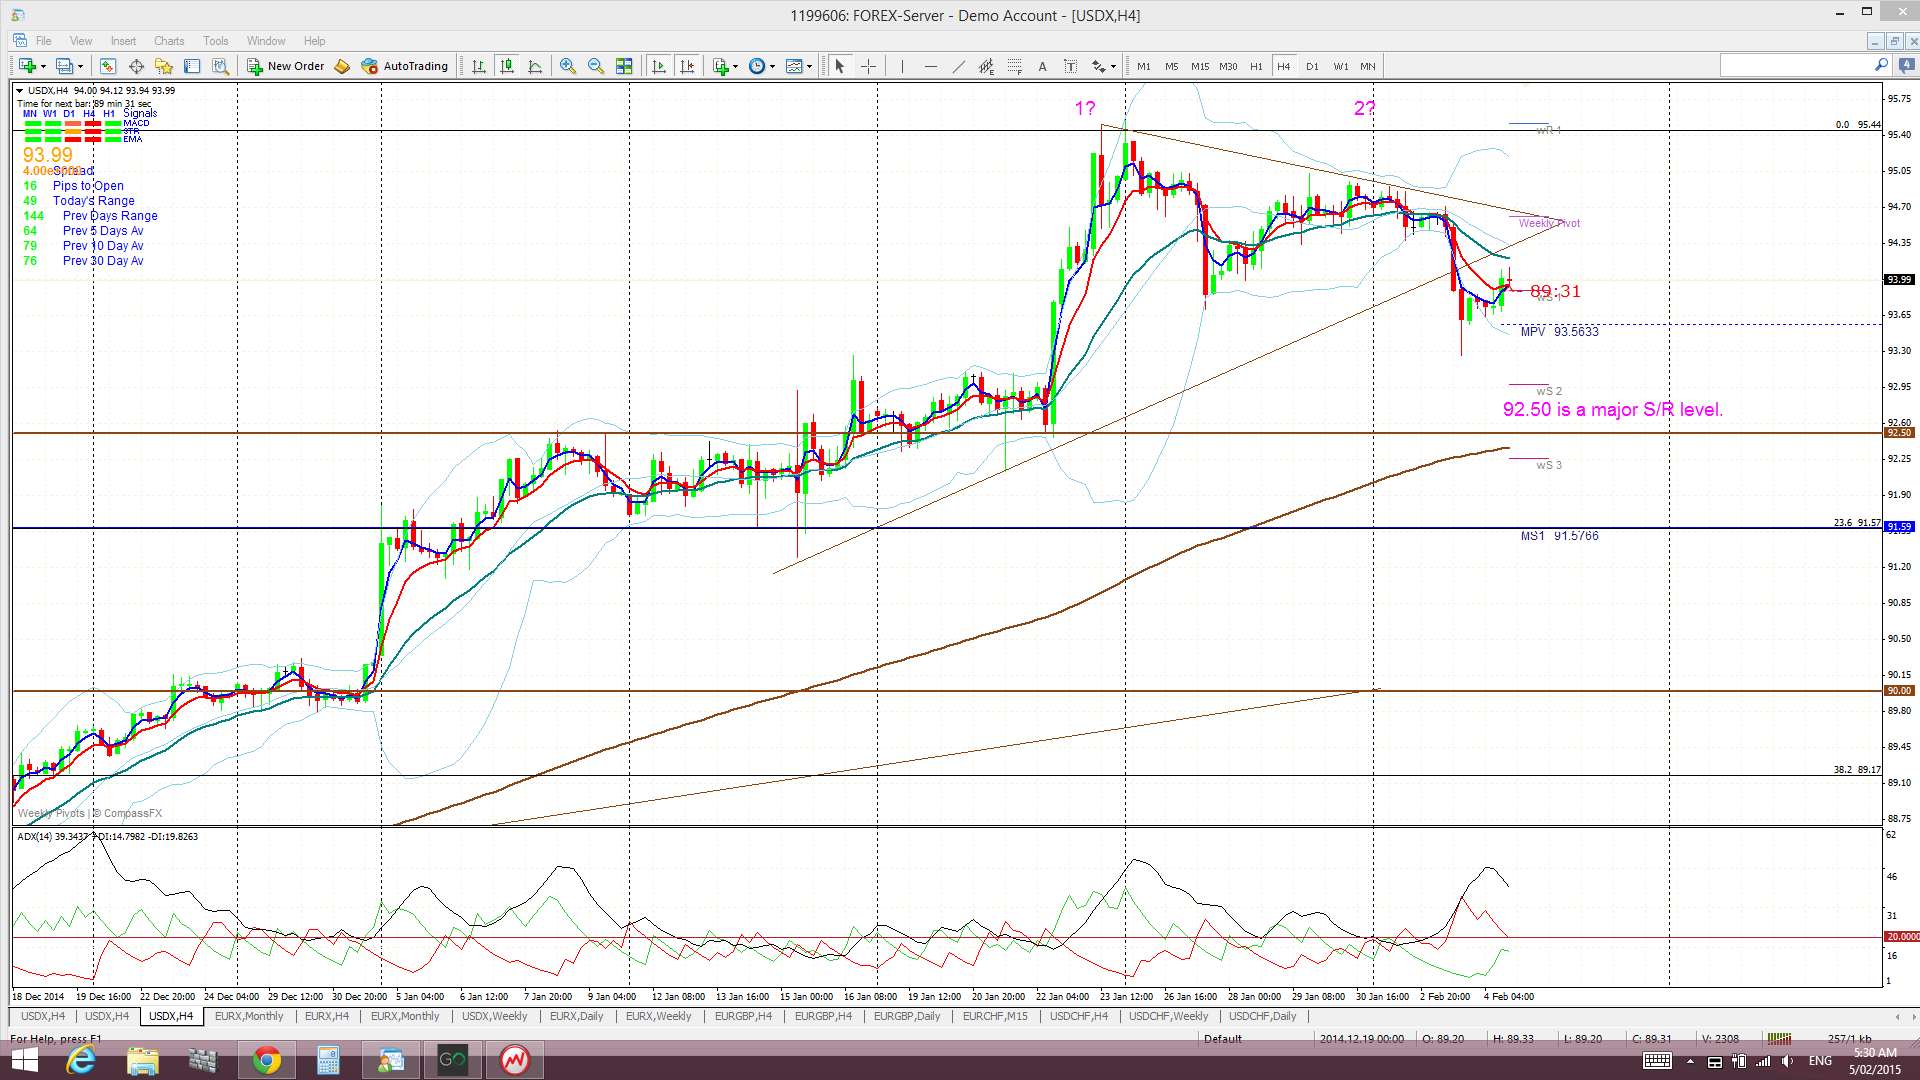
USDX 4hr: triangle breakdown BUT little follow through:
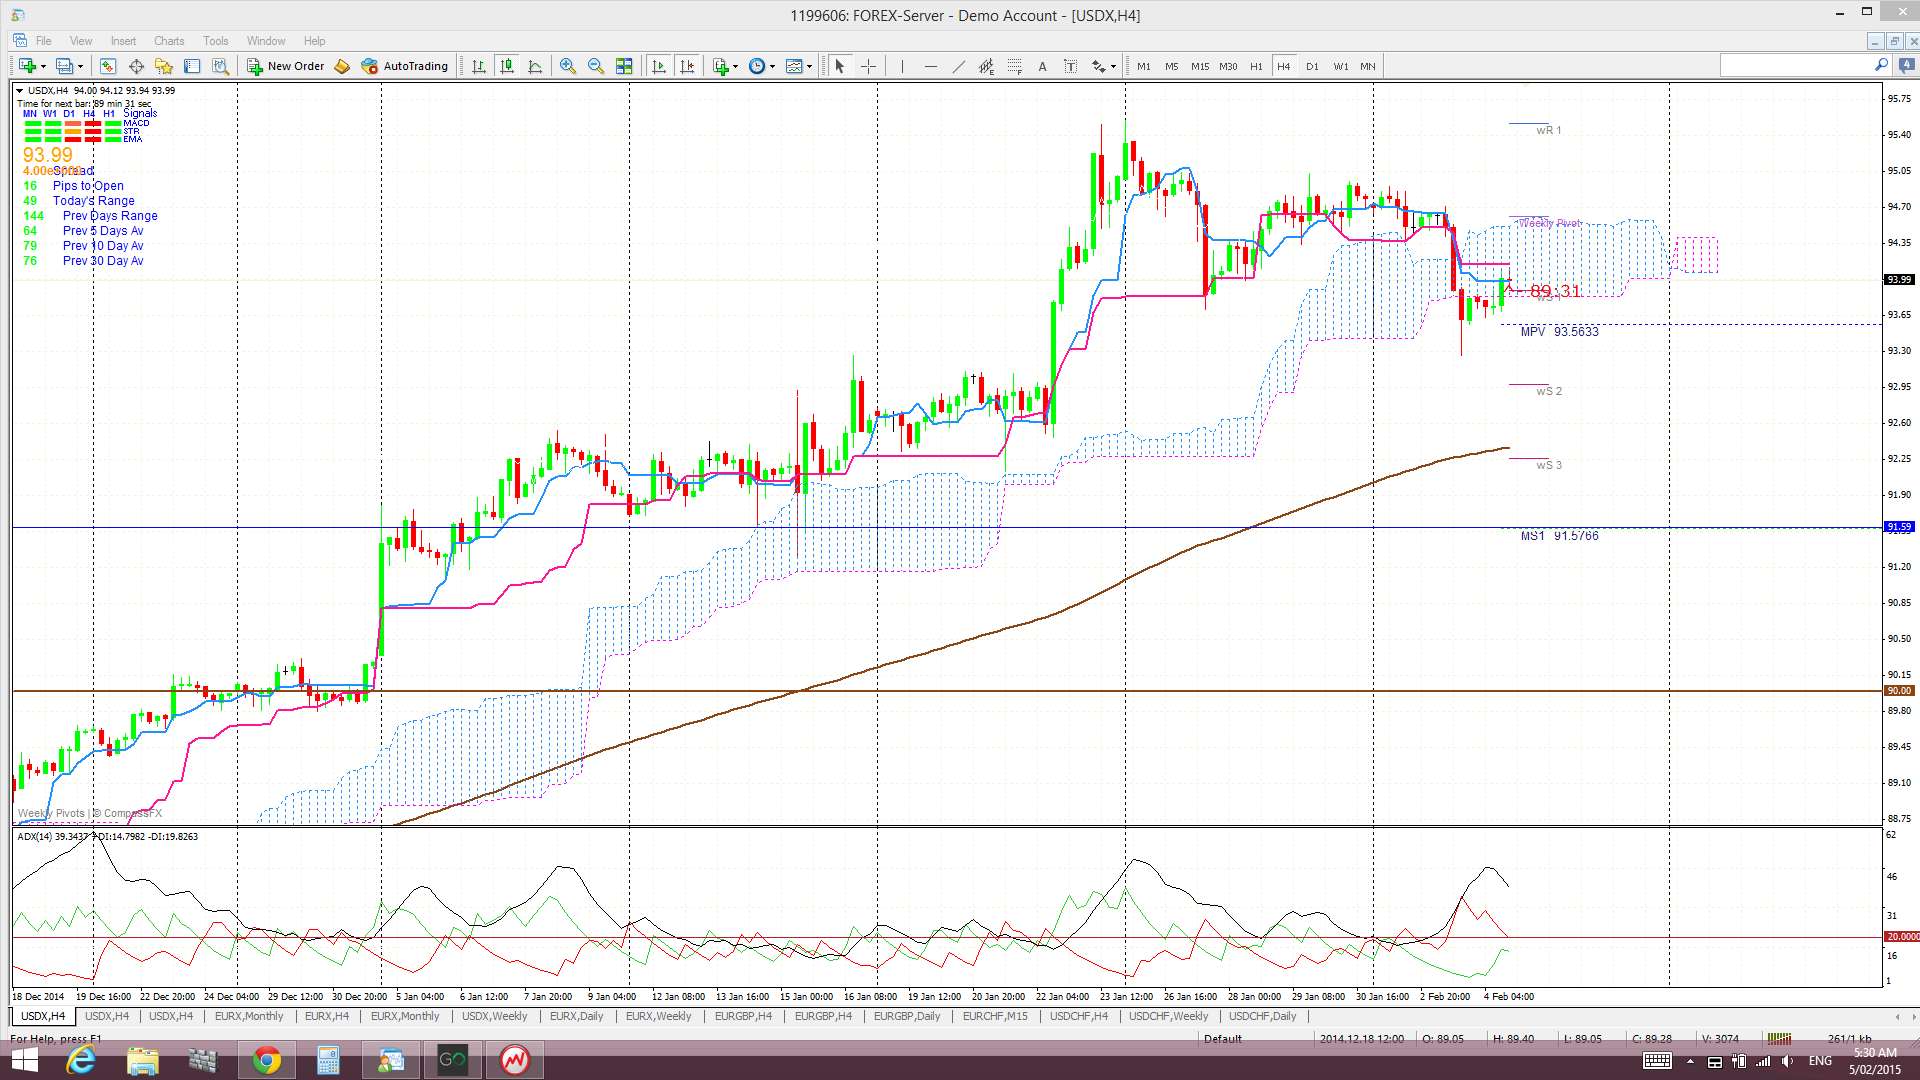
USDX 4hr Cloud: the index is still below the 4hr Cloud which is short term bearish:
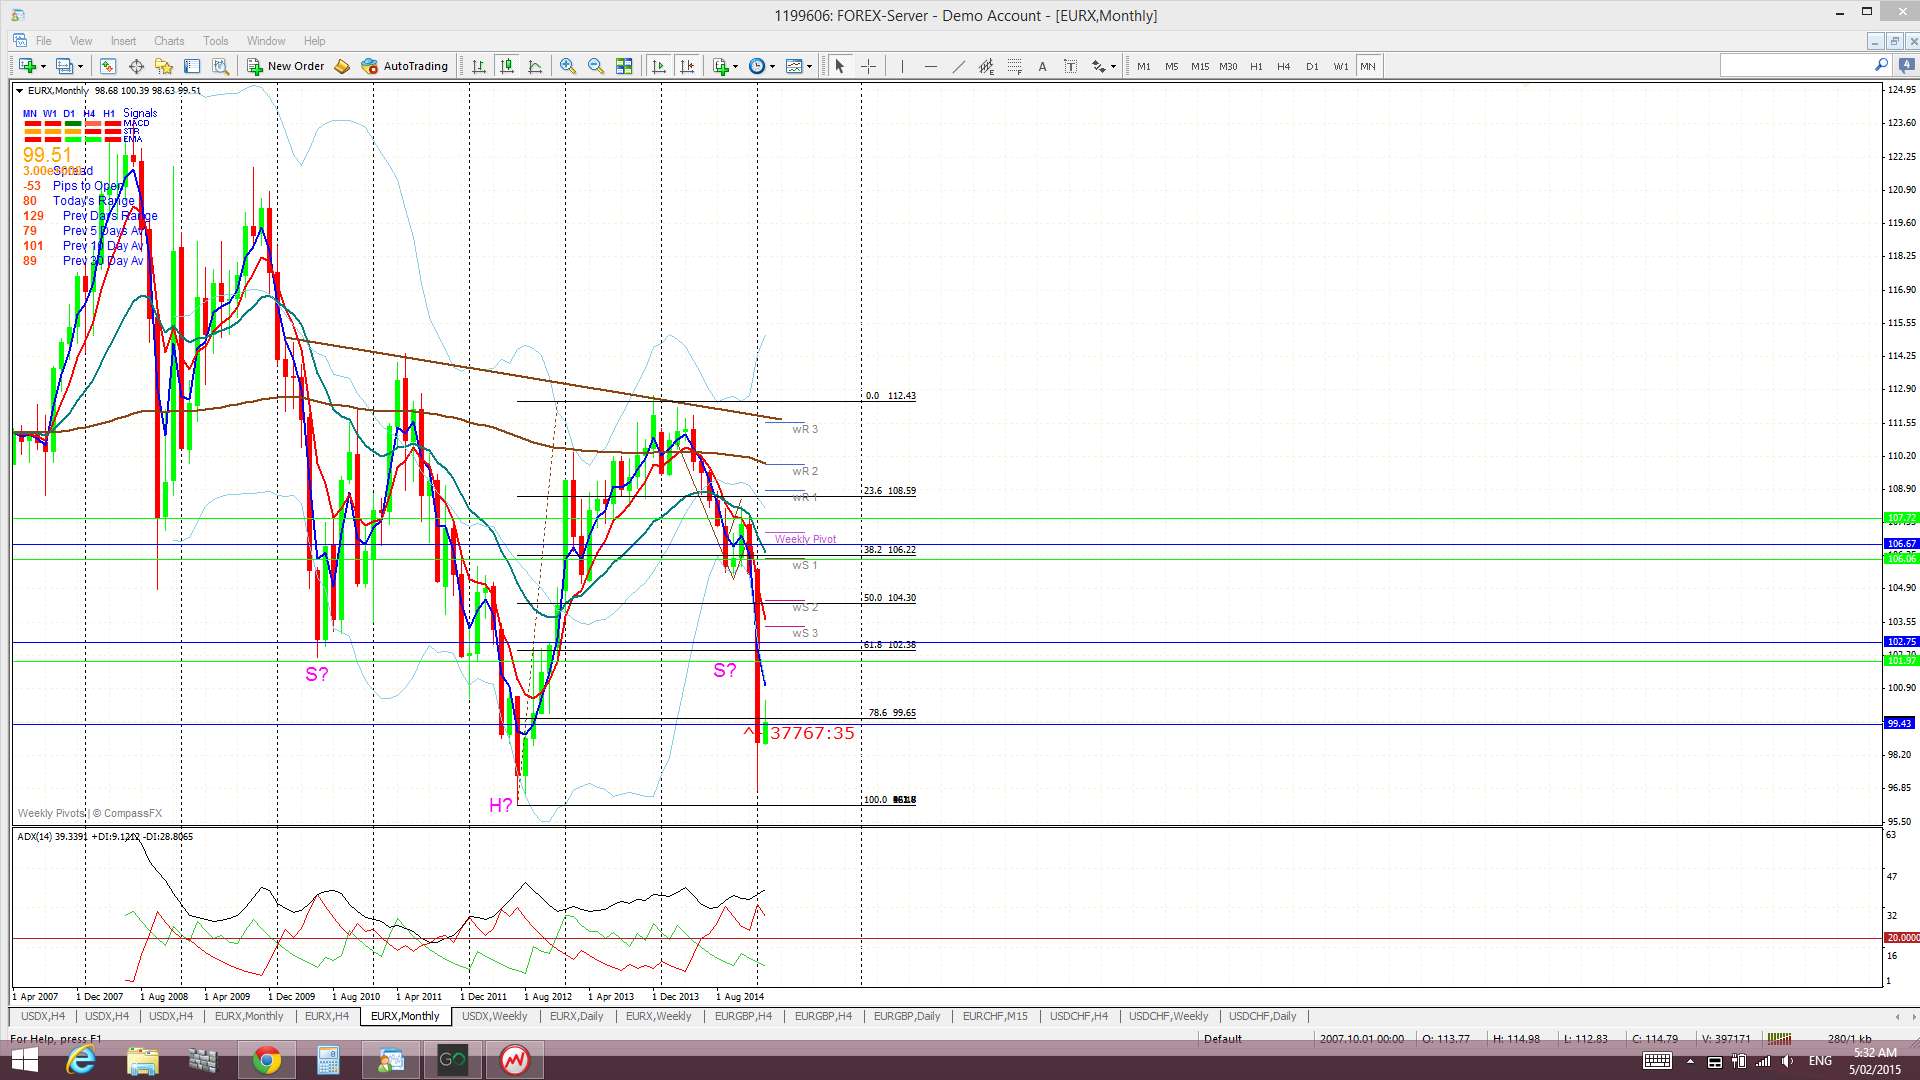
EURX monthly: This potential ‘inverse H&S’ is still in contention:
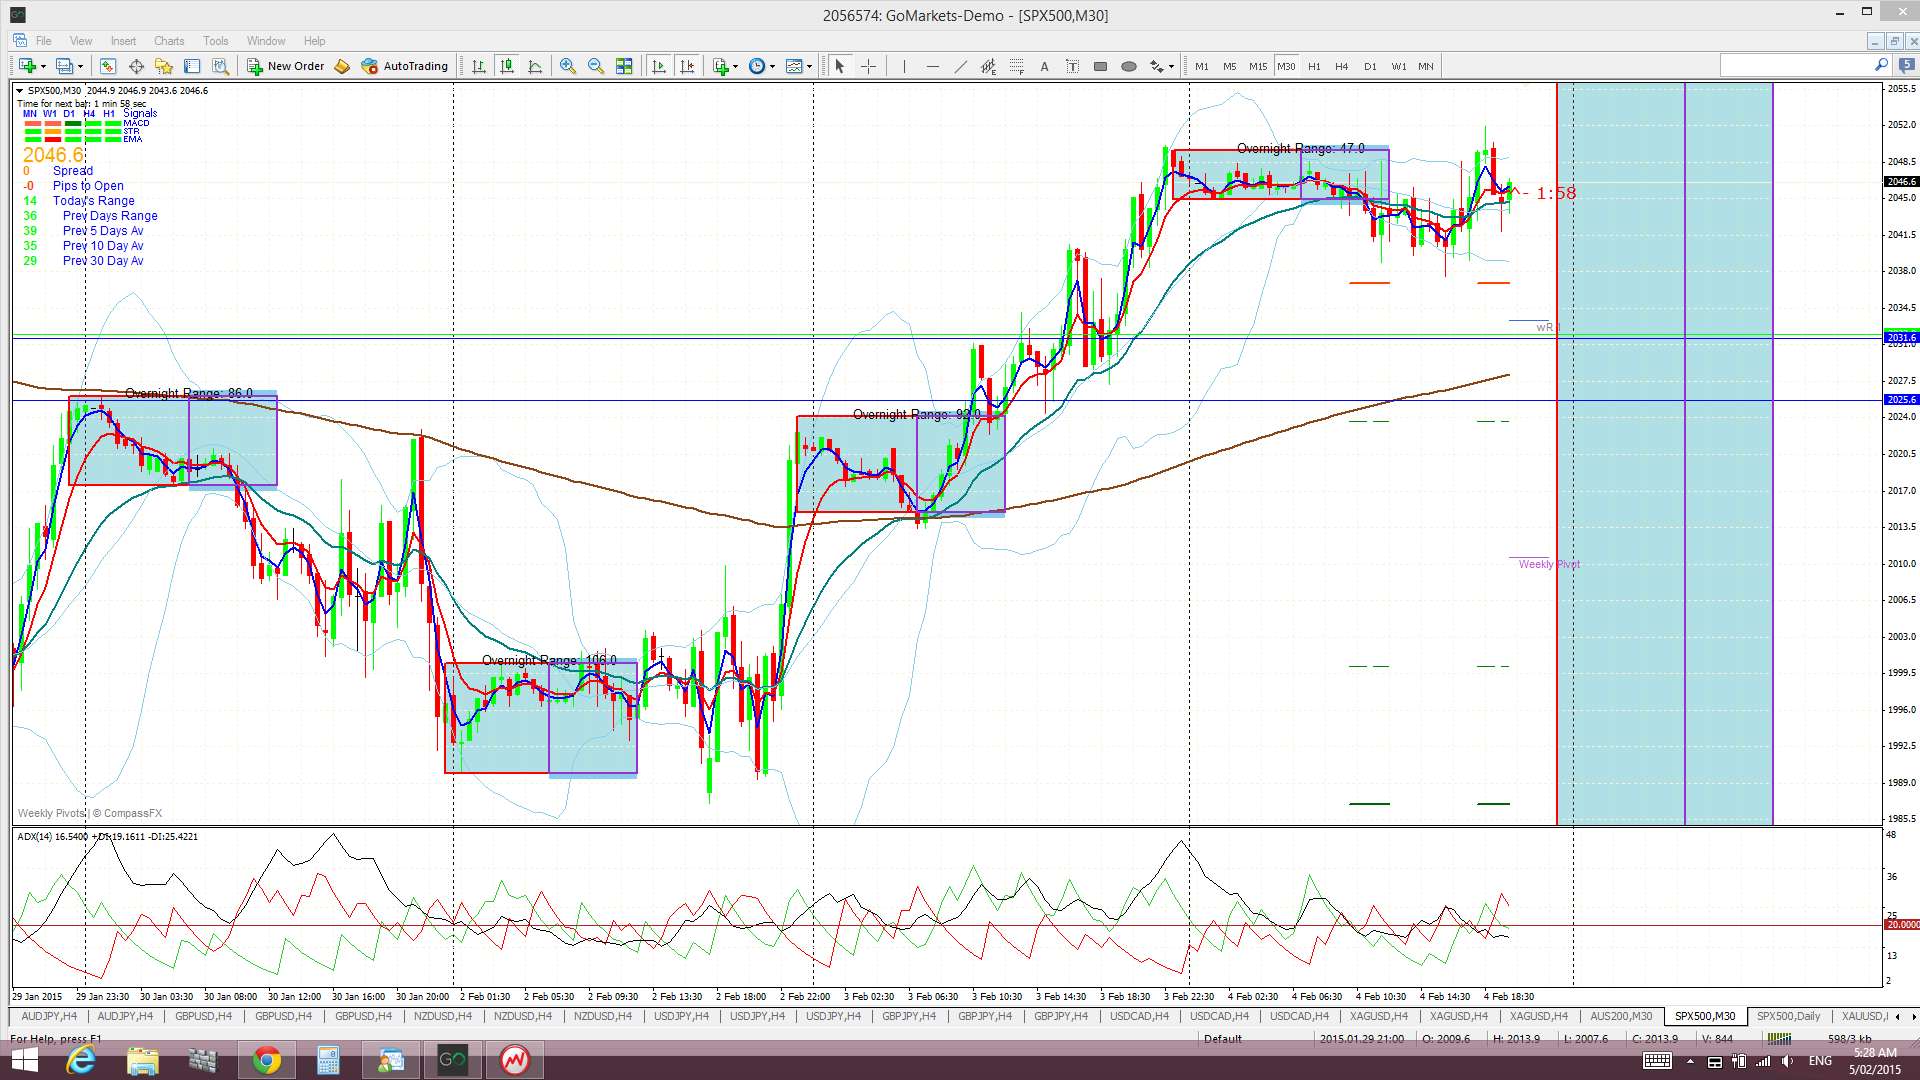
S&P500: a choppy US session. Oil weakness is being suggested as the cause:
TC Signals: only one of the three was positive.
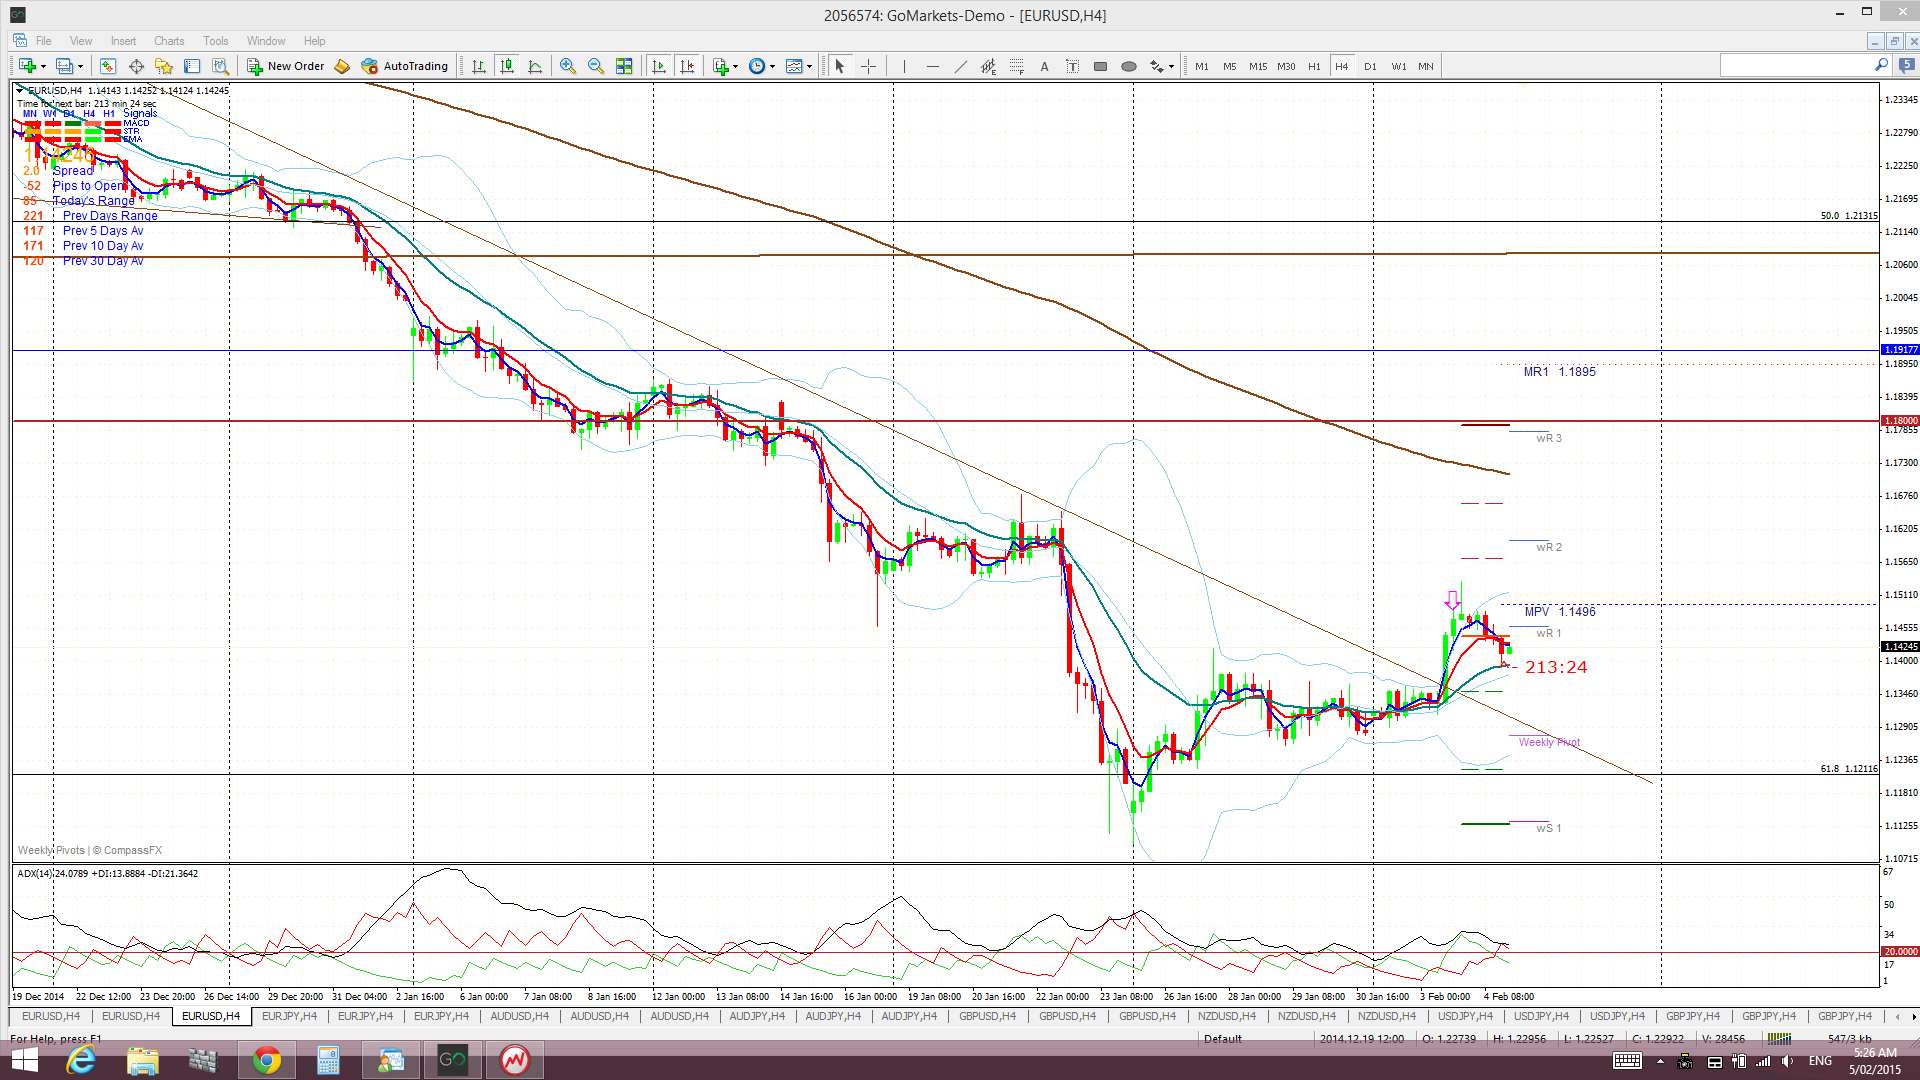
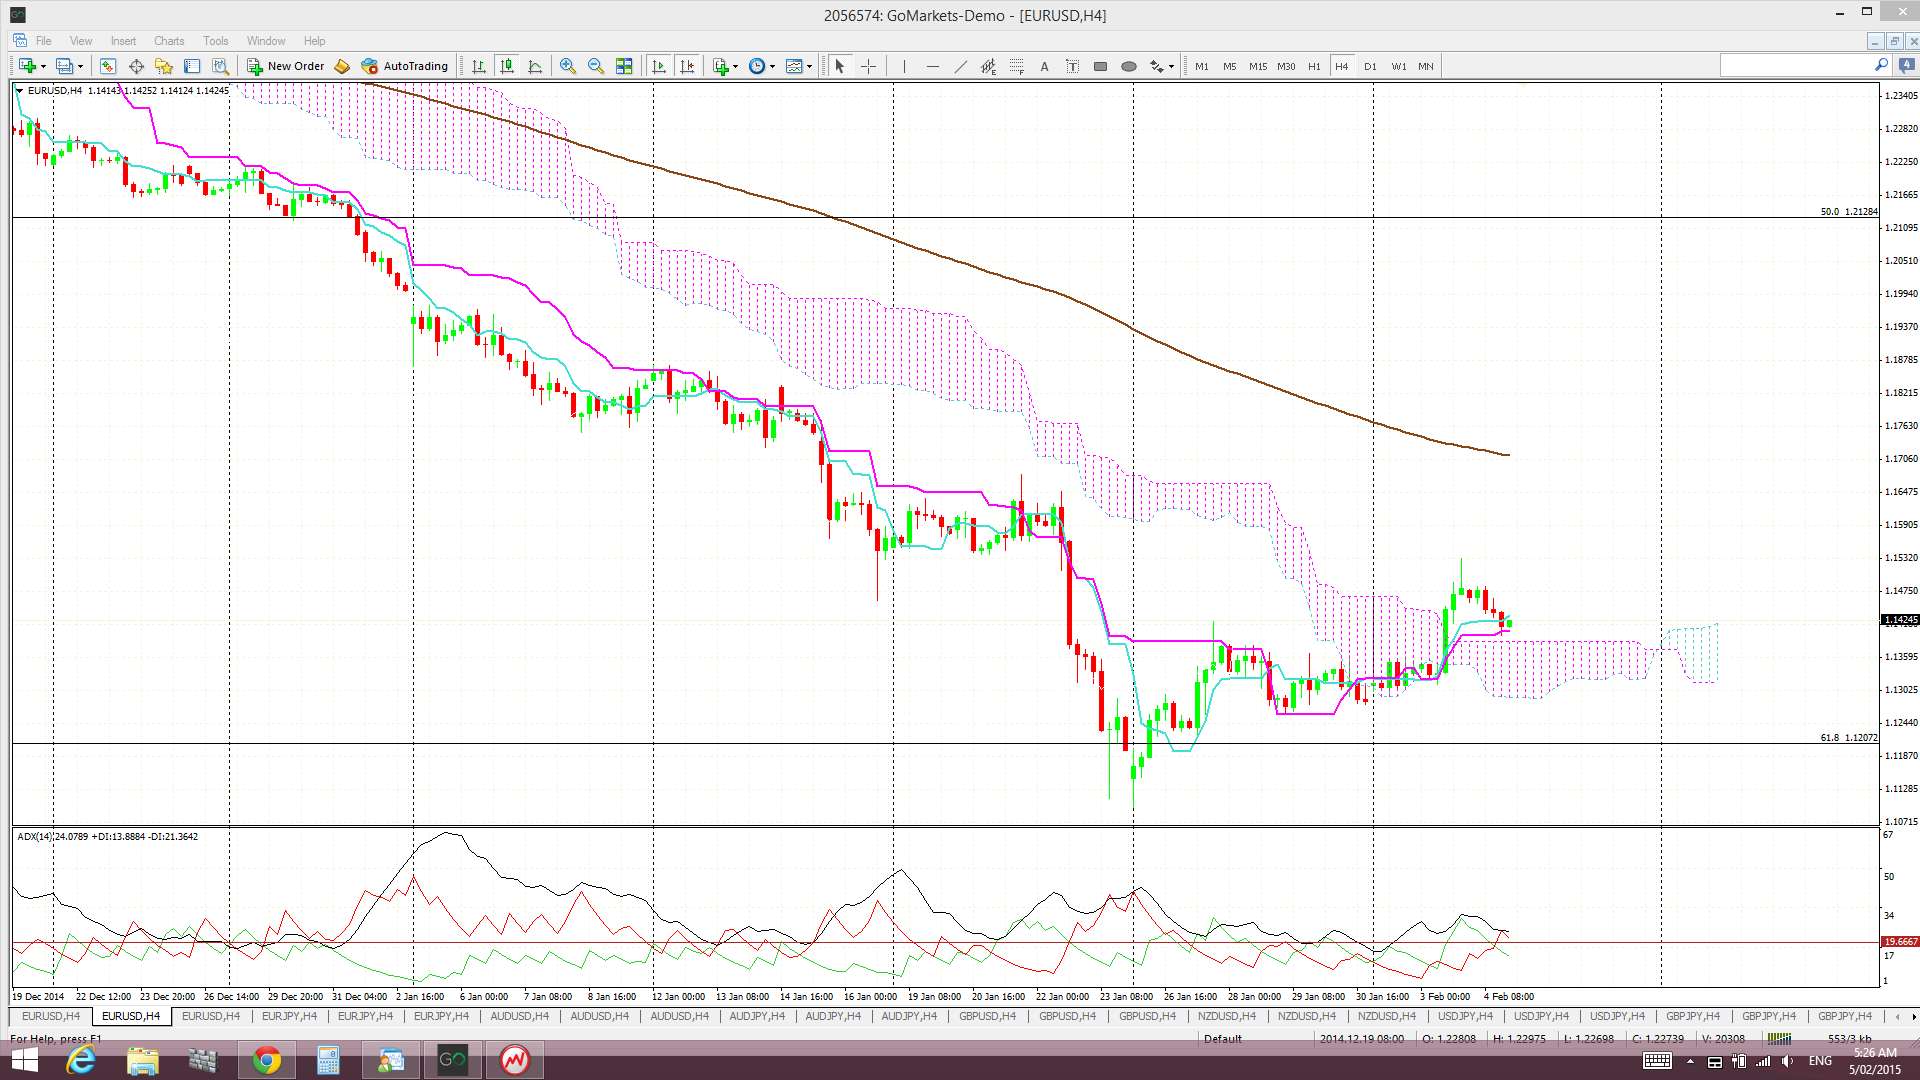
E/U: the signal has now closed off for a loss of 100 pips yet the E/U is still above 4hr Cloud support:
E/J: ditto here:
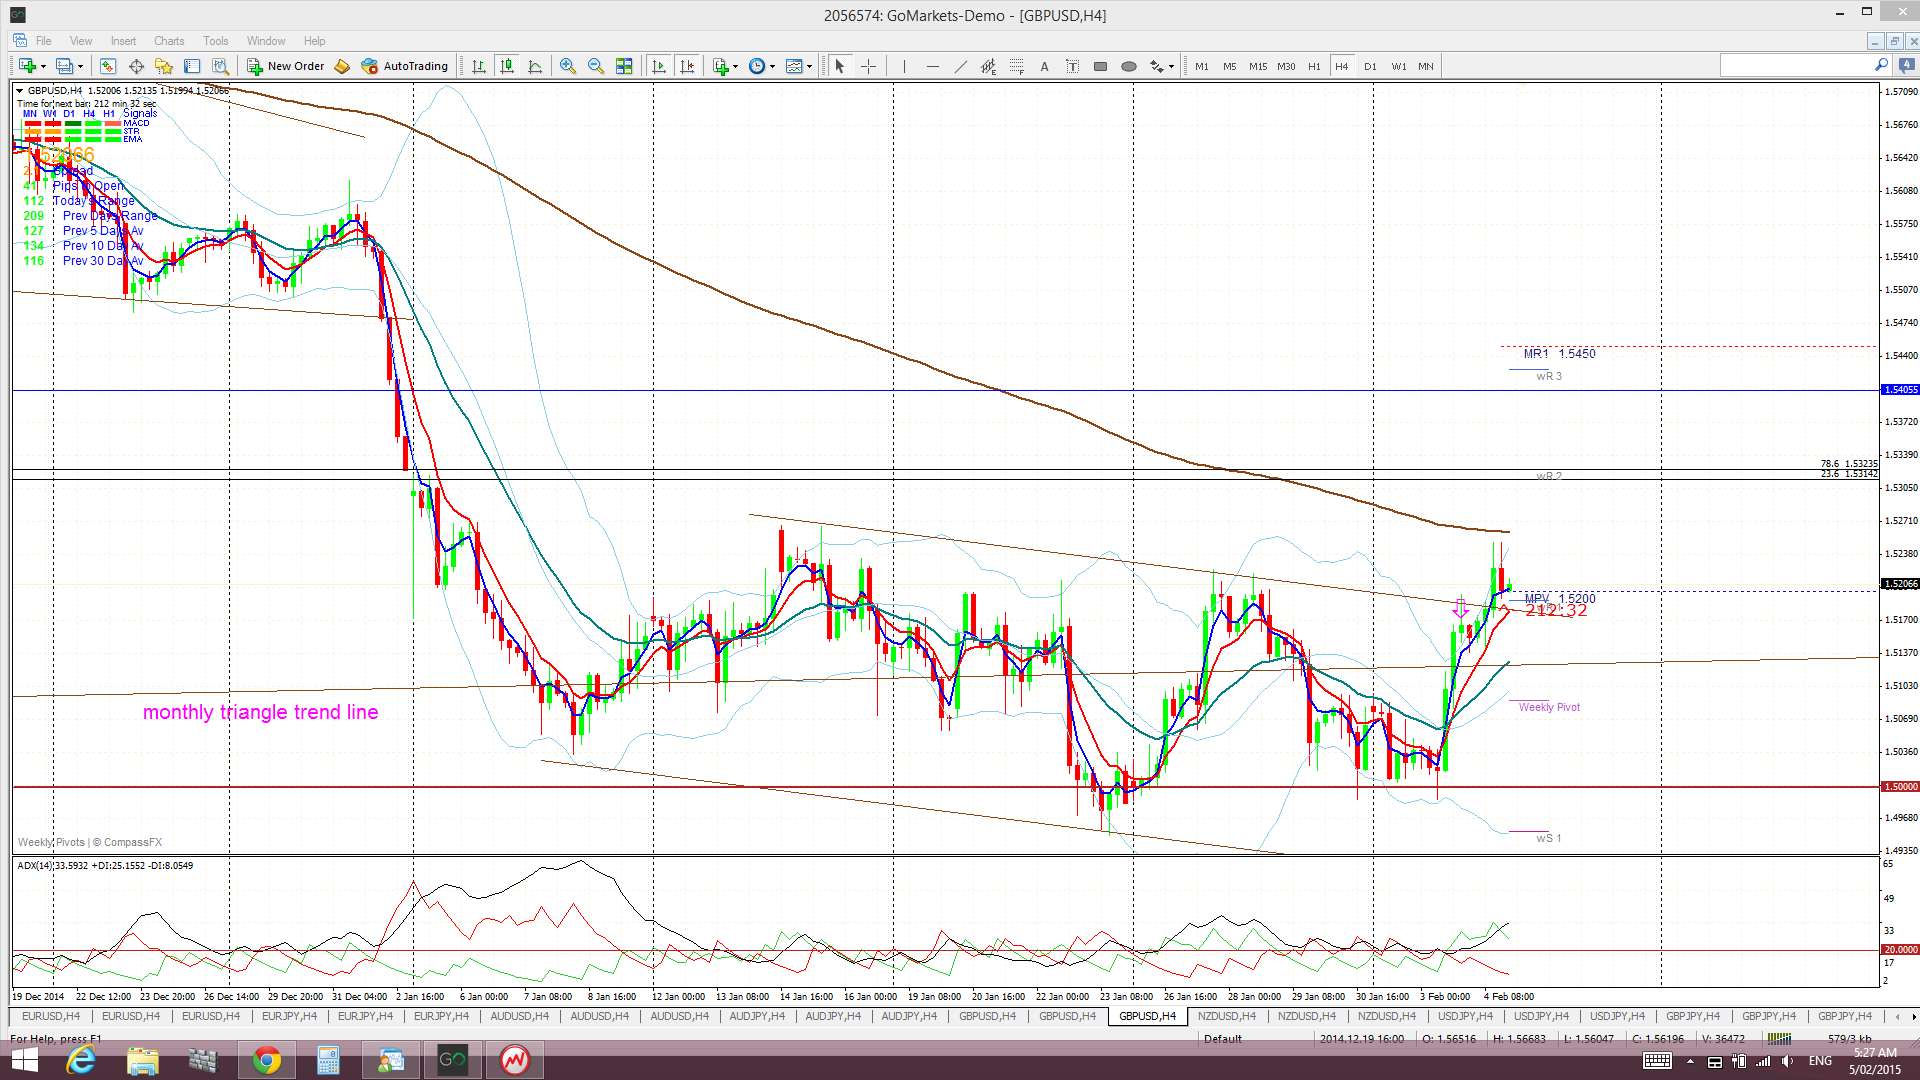
Cable: this signal evolved and the pair has also broken up thorough a recent resistance trend line and is still above the 4hr Cloud. I’m not chasing this trade at the moment as there is GBP Interest Rate news tonight. However, I’ll see if the there is follow through after the news. The hold above 1.50 remains bullish:

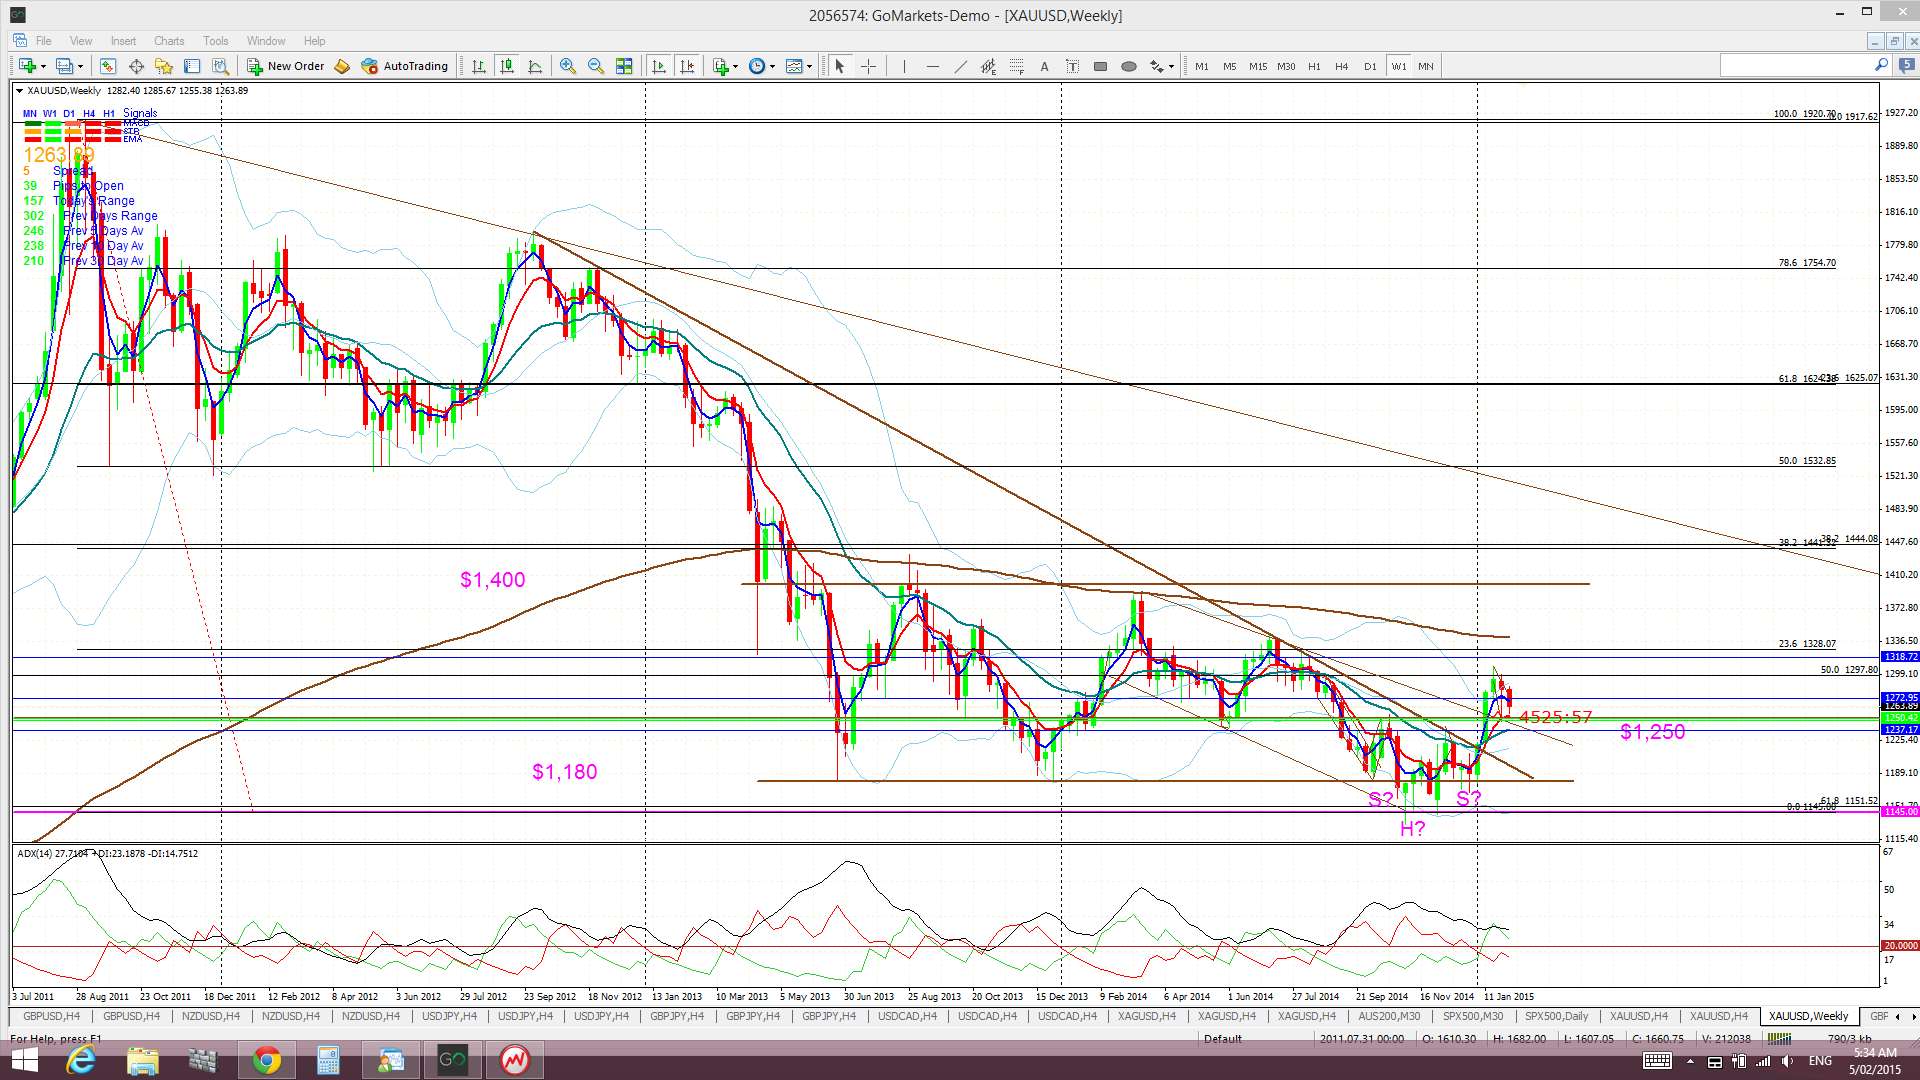
Gold: the weekly chart reminds us of the importance of the $1,250 level and price is hovering above that for now. Continued USD weakness should help to support Gold BUT if stocks remain more popular, from a yield potential, then the pathway here might not be so clear:
Gold weekly: $1,250 still key S/R:
Gold 4hr: price appears to be consolidating within a Flag of sorts BUT there is no momentum:
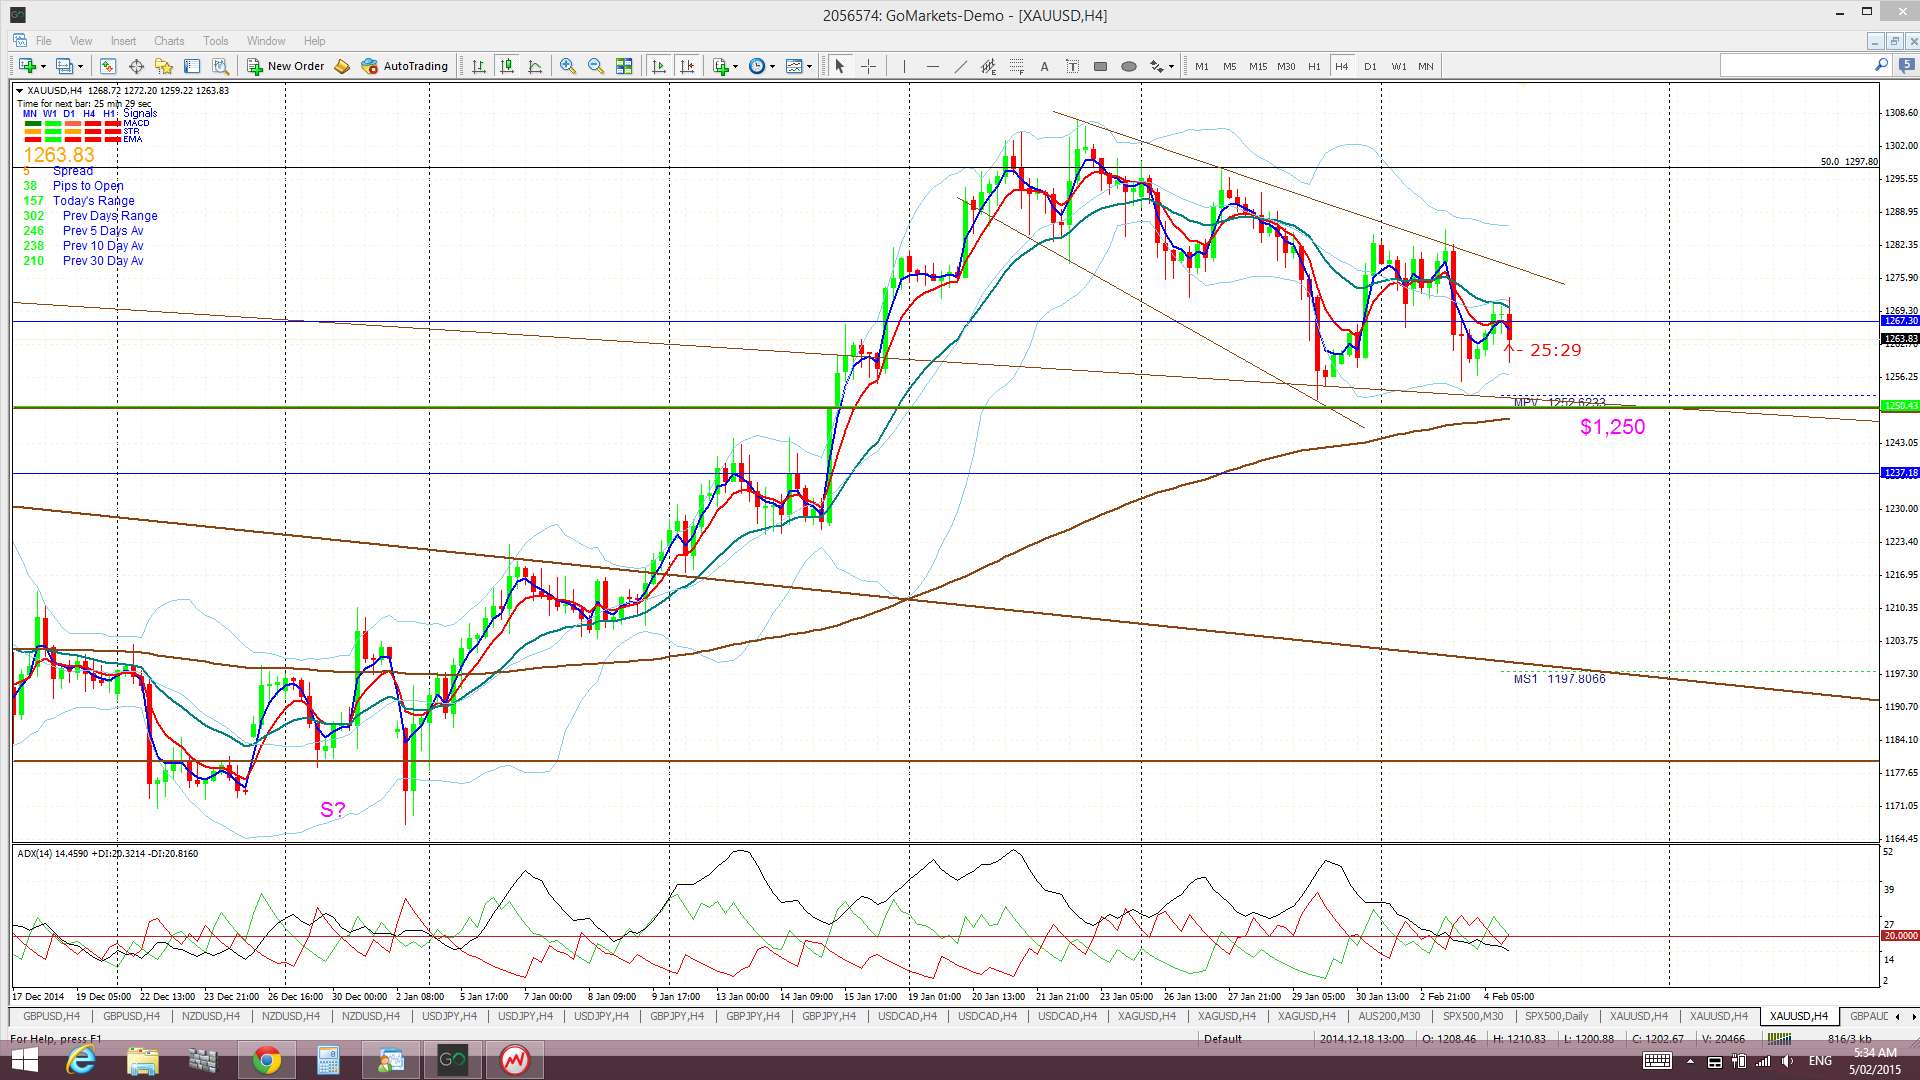
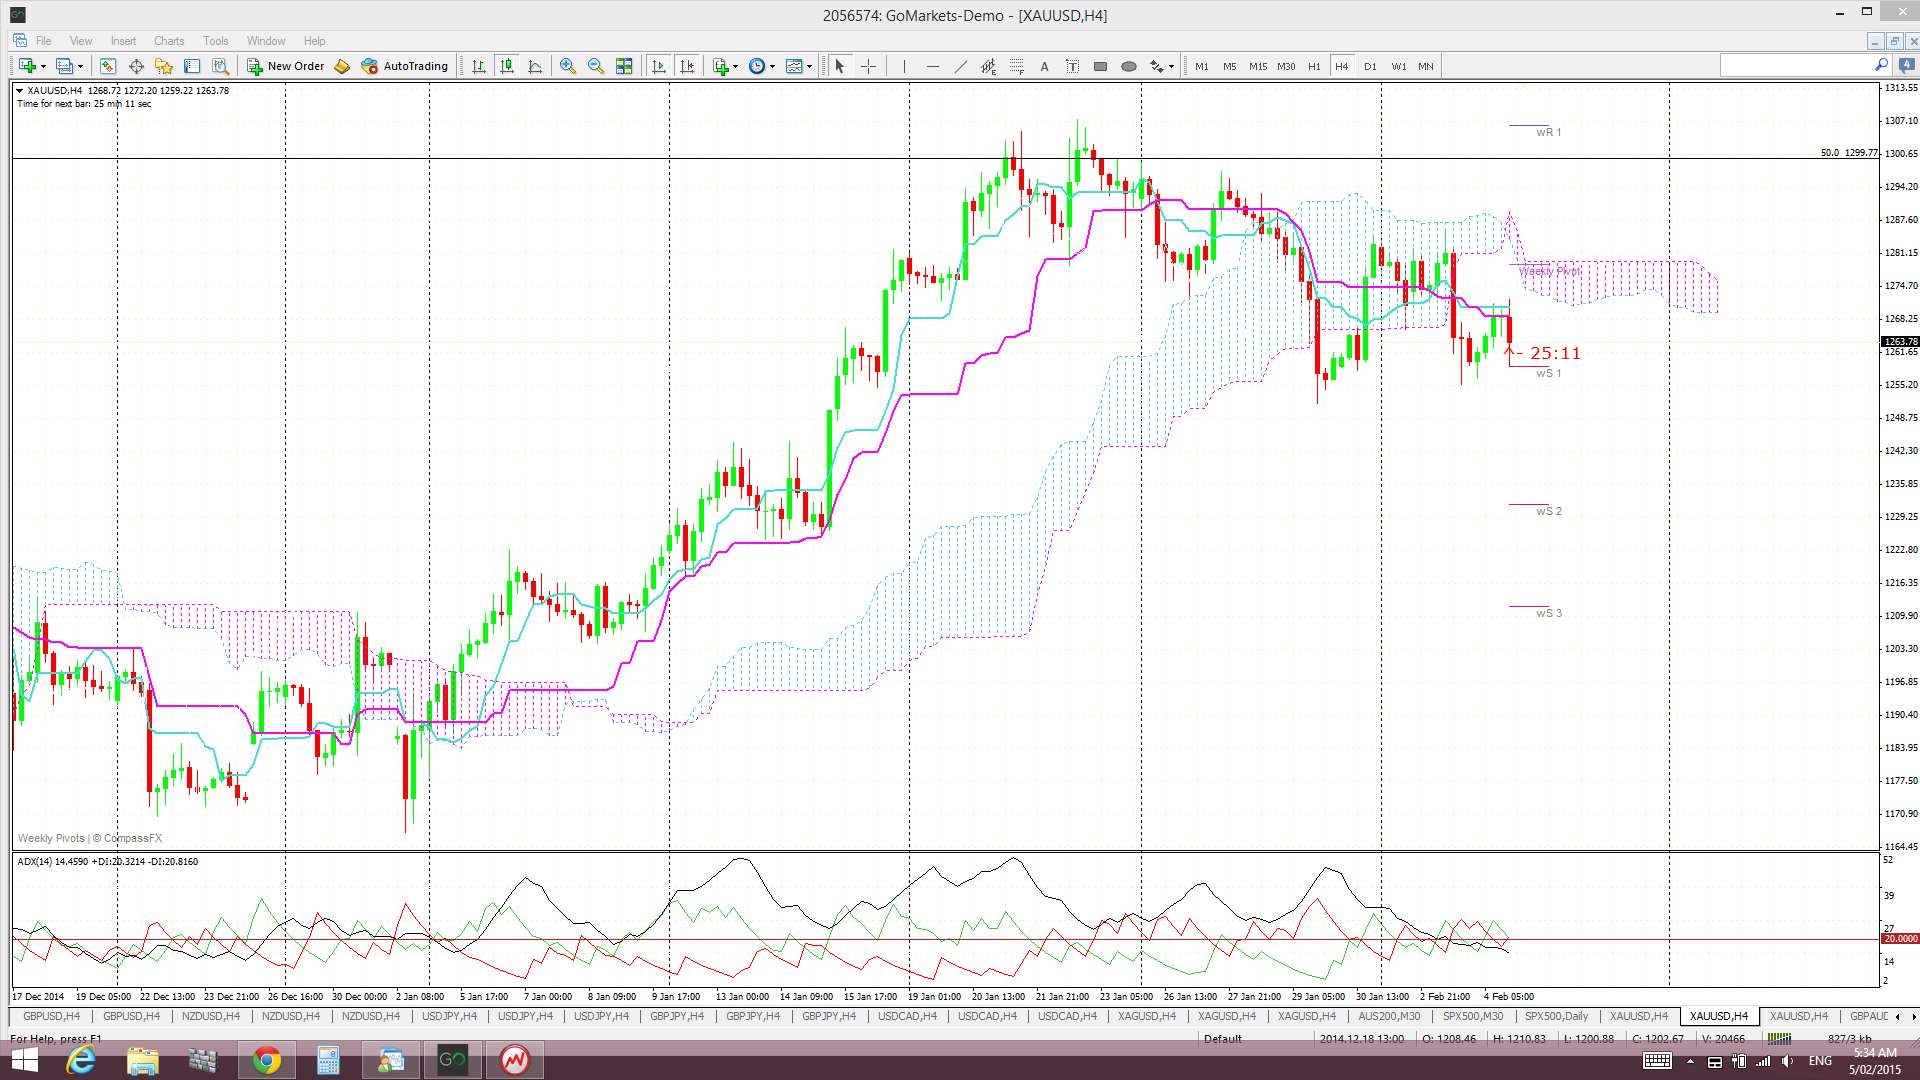
Gold 4hr Cloud: price is below the 4hr Cloud which is short term bearish:
Other FX:
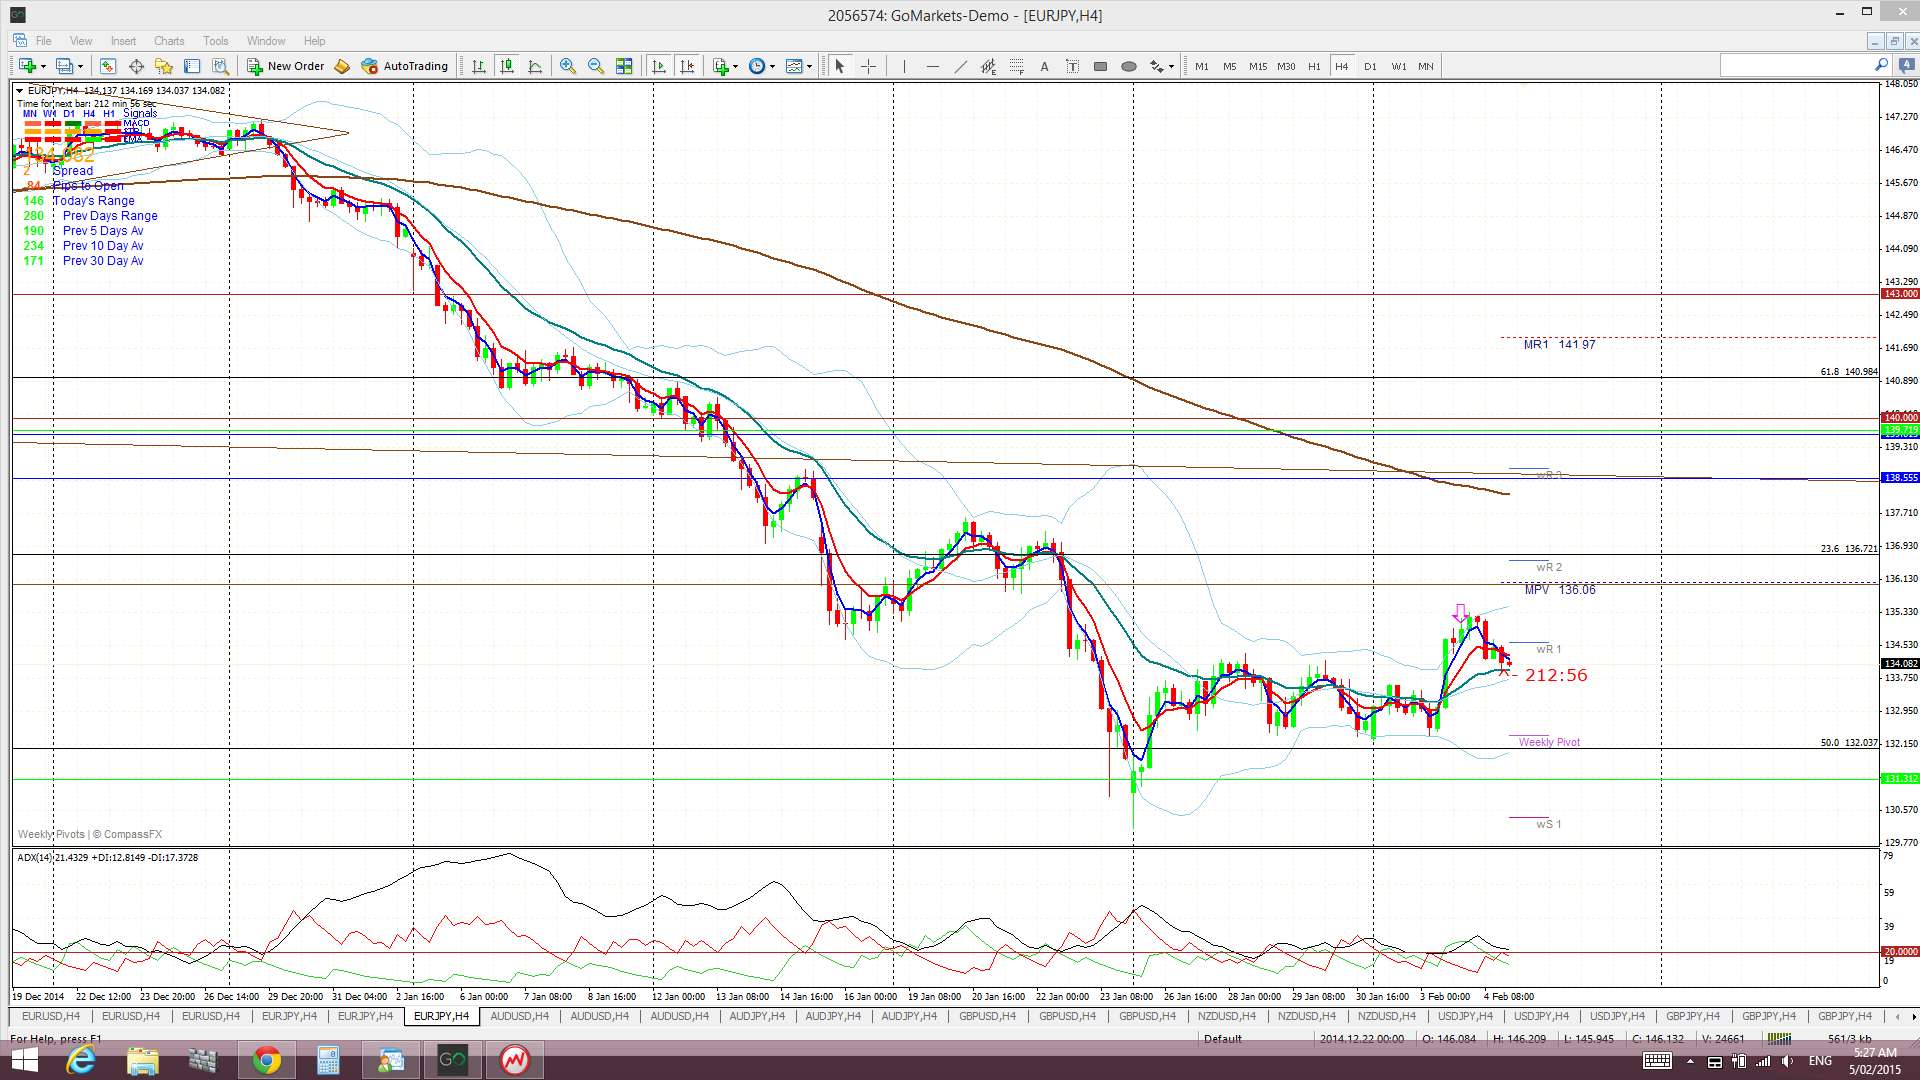
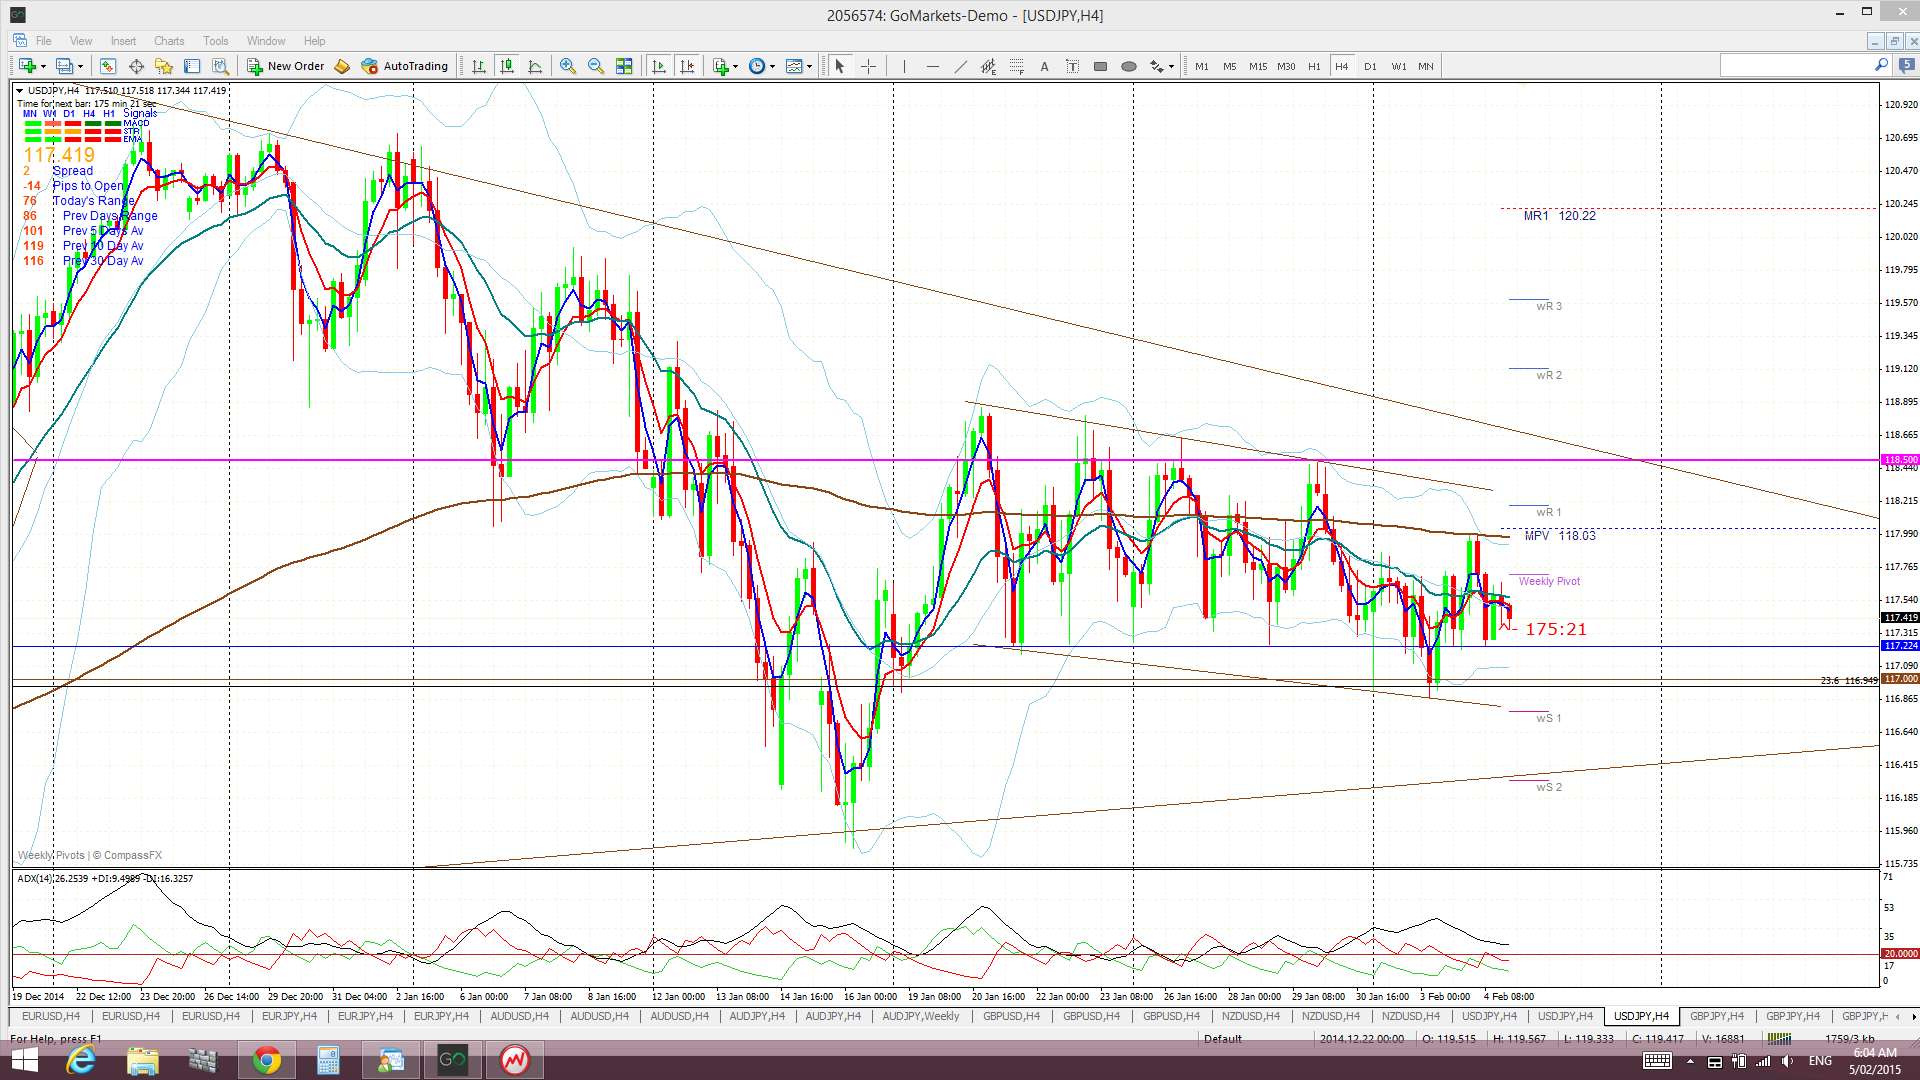
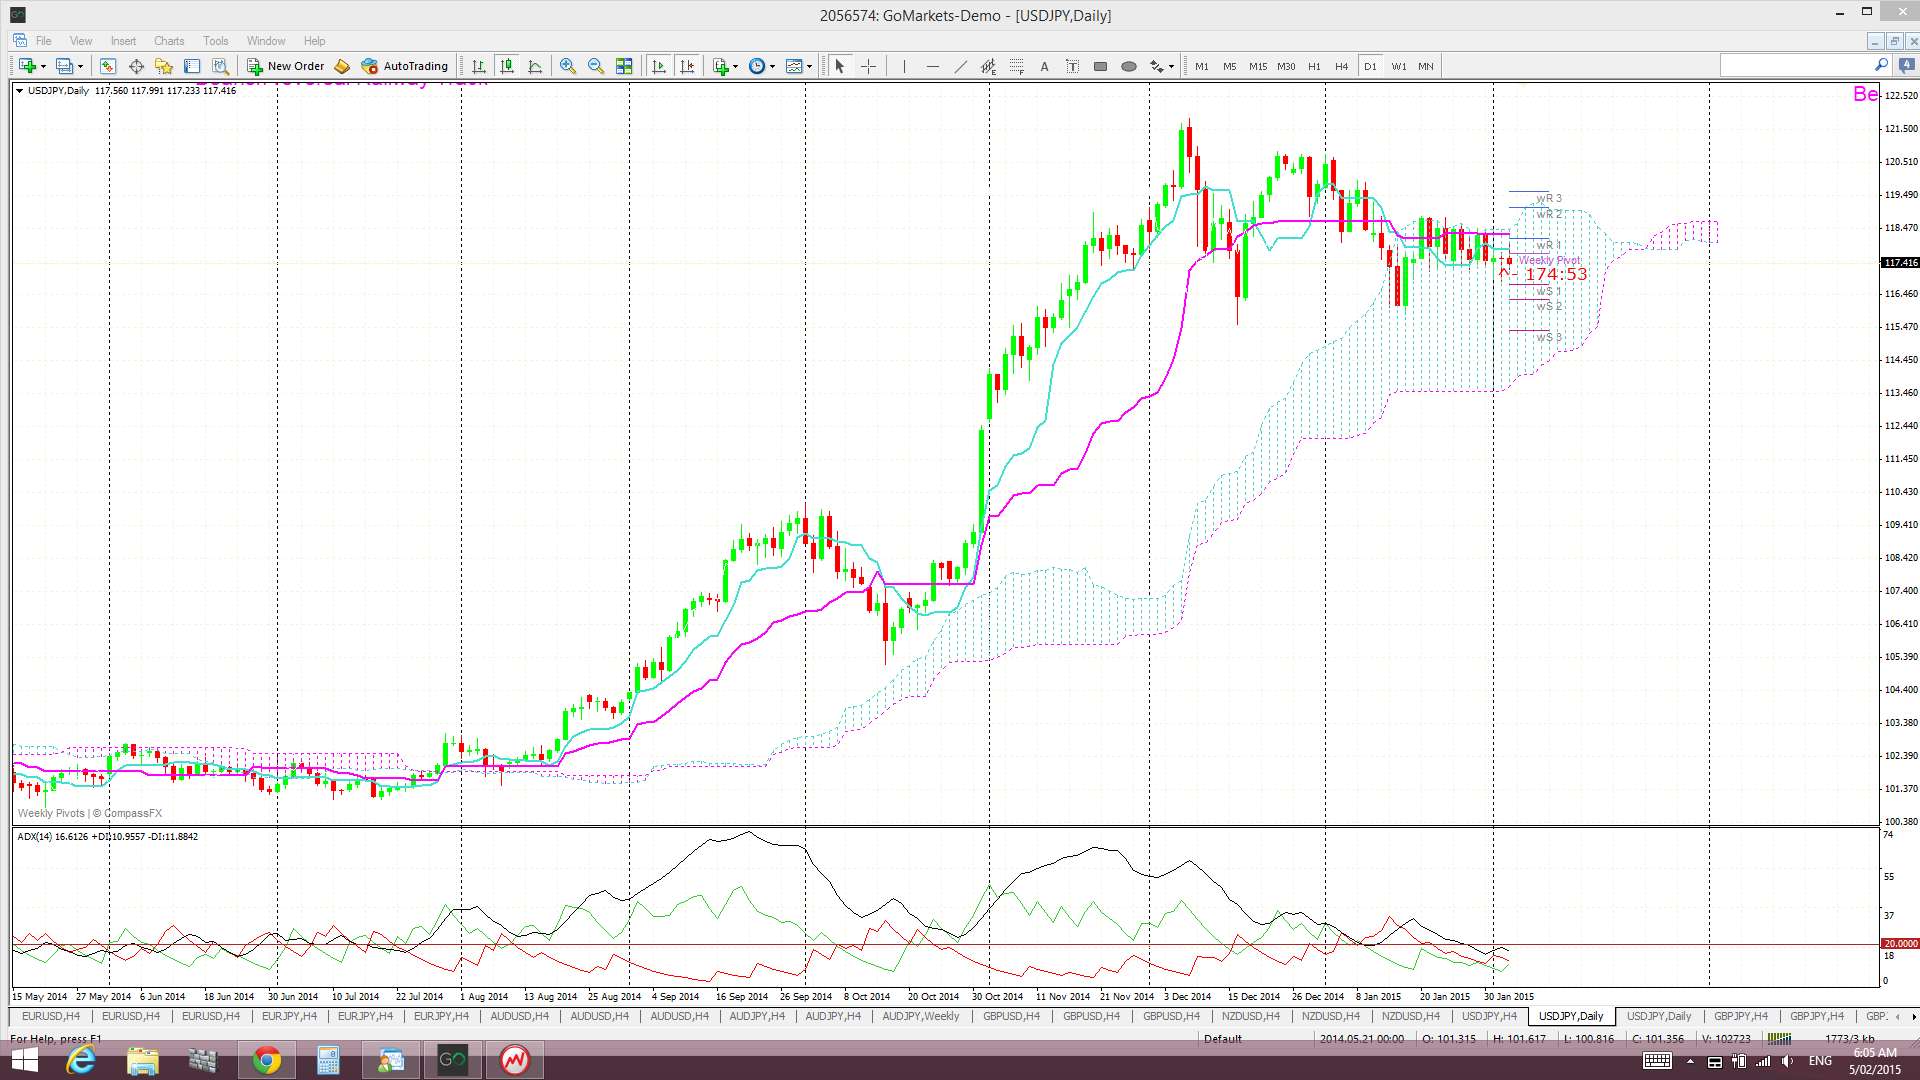
U/J: is still within the daily chart triangle, the 4hr chart channel and the daily Cloud. The rang-bound nature here may serve as bit of a warning to longer time frame trend-trading off other USD and JPY pairs!
U/J 4hr: chopping around within a channel pattern now:
U/J daily: the daily triangle is still in play here:
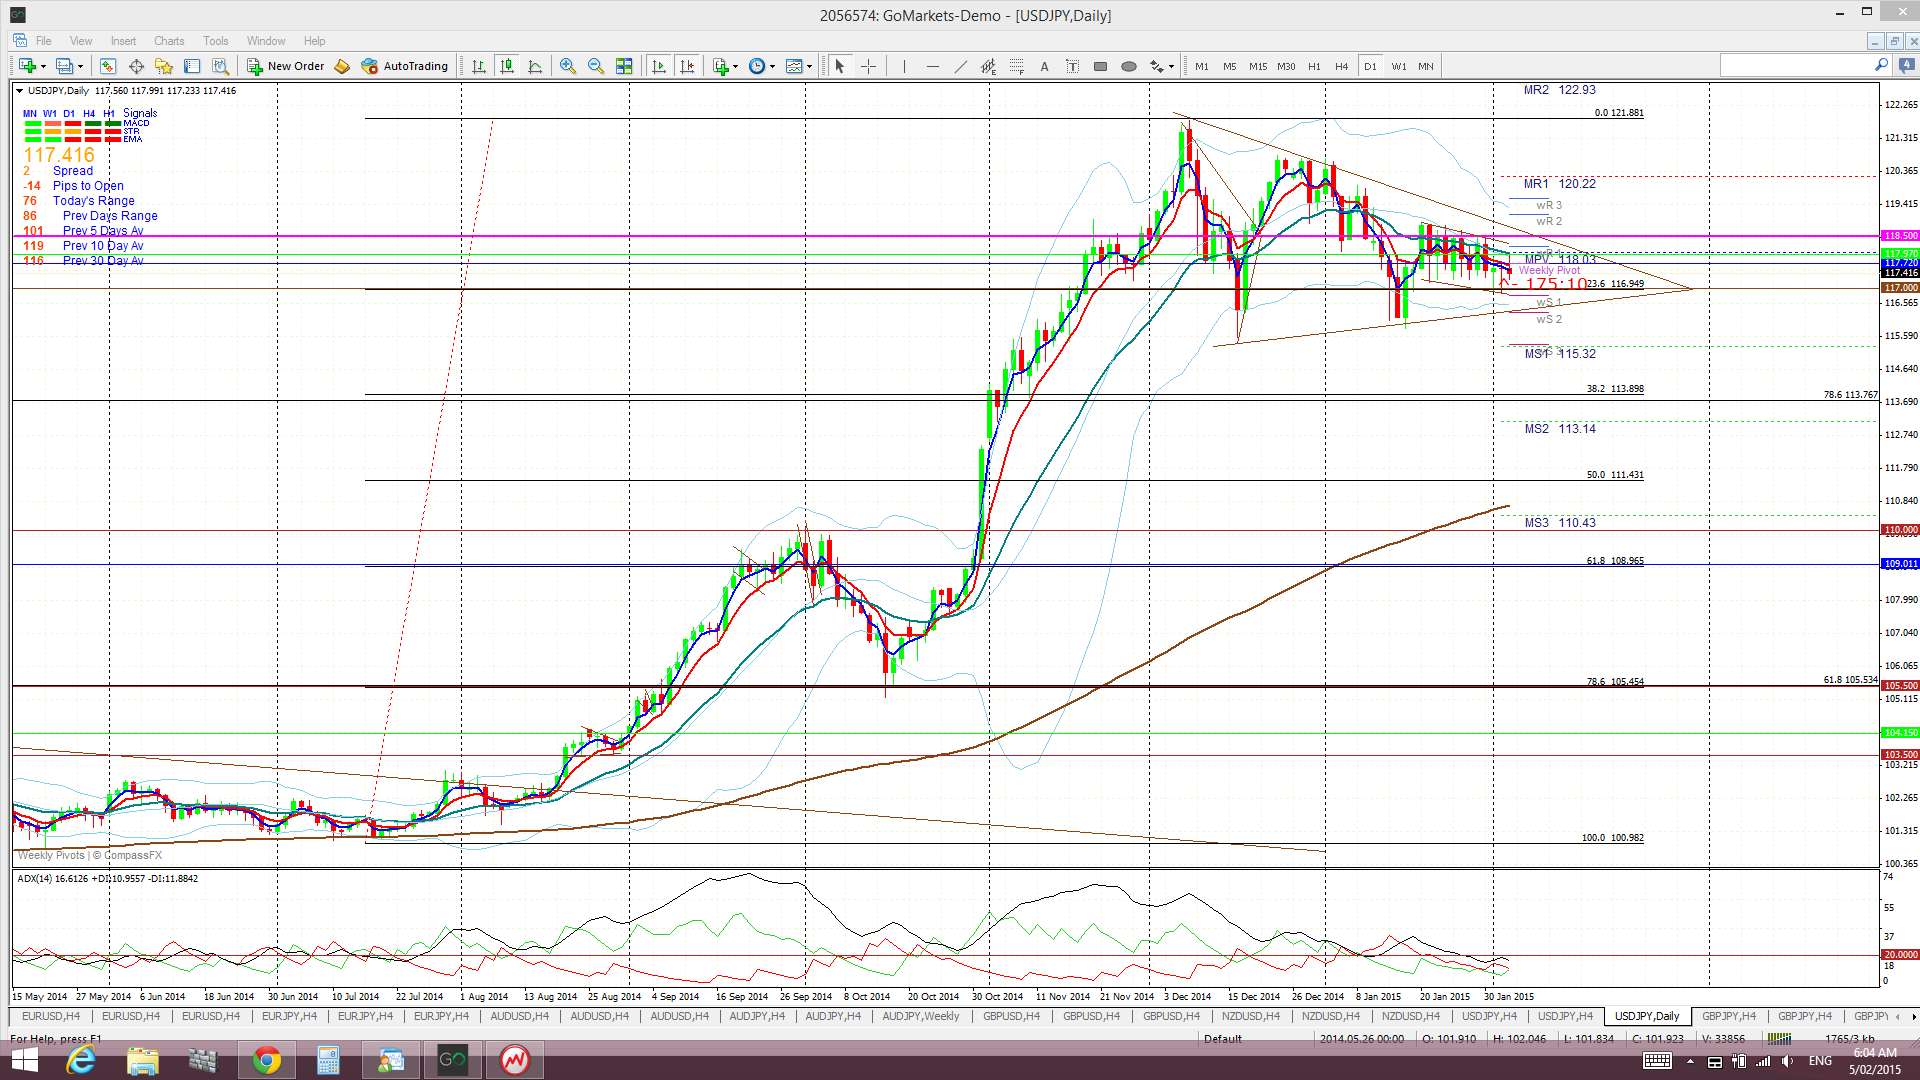
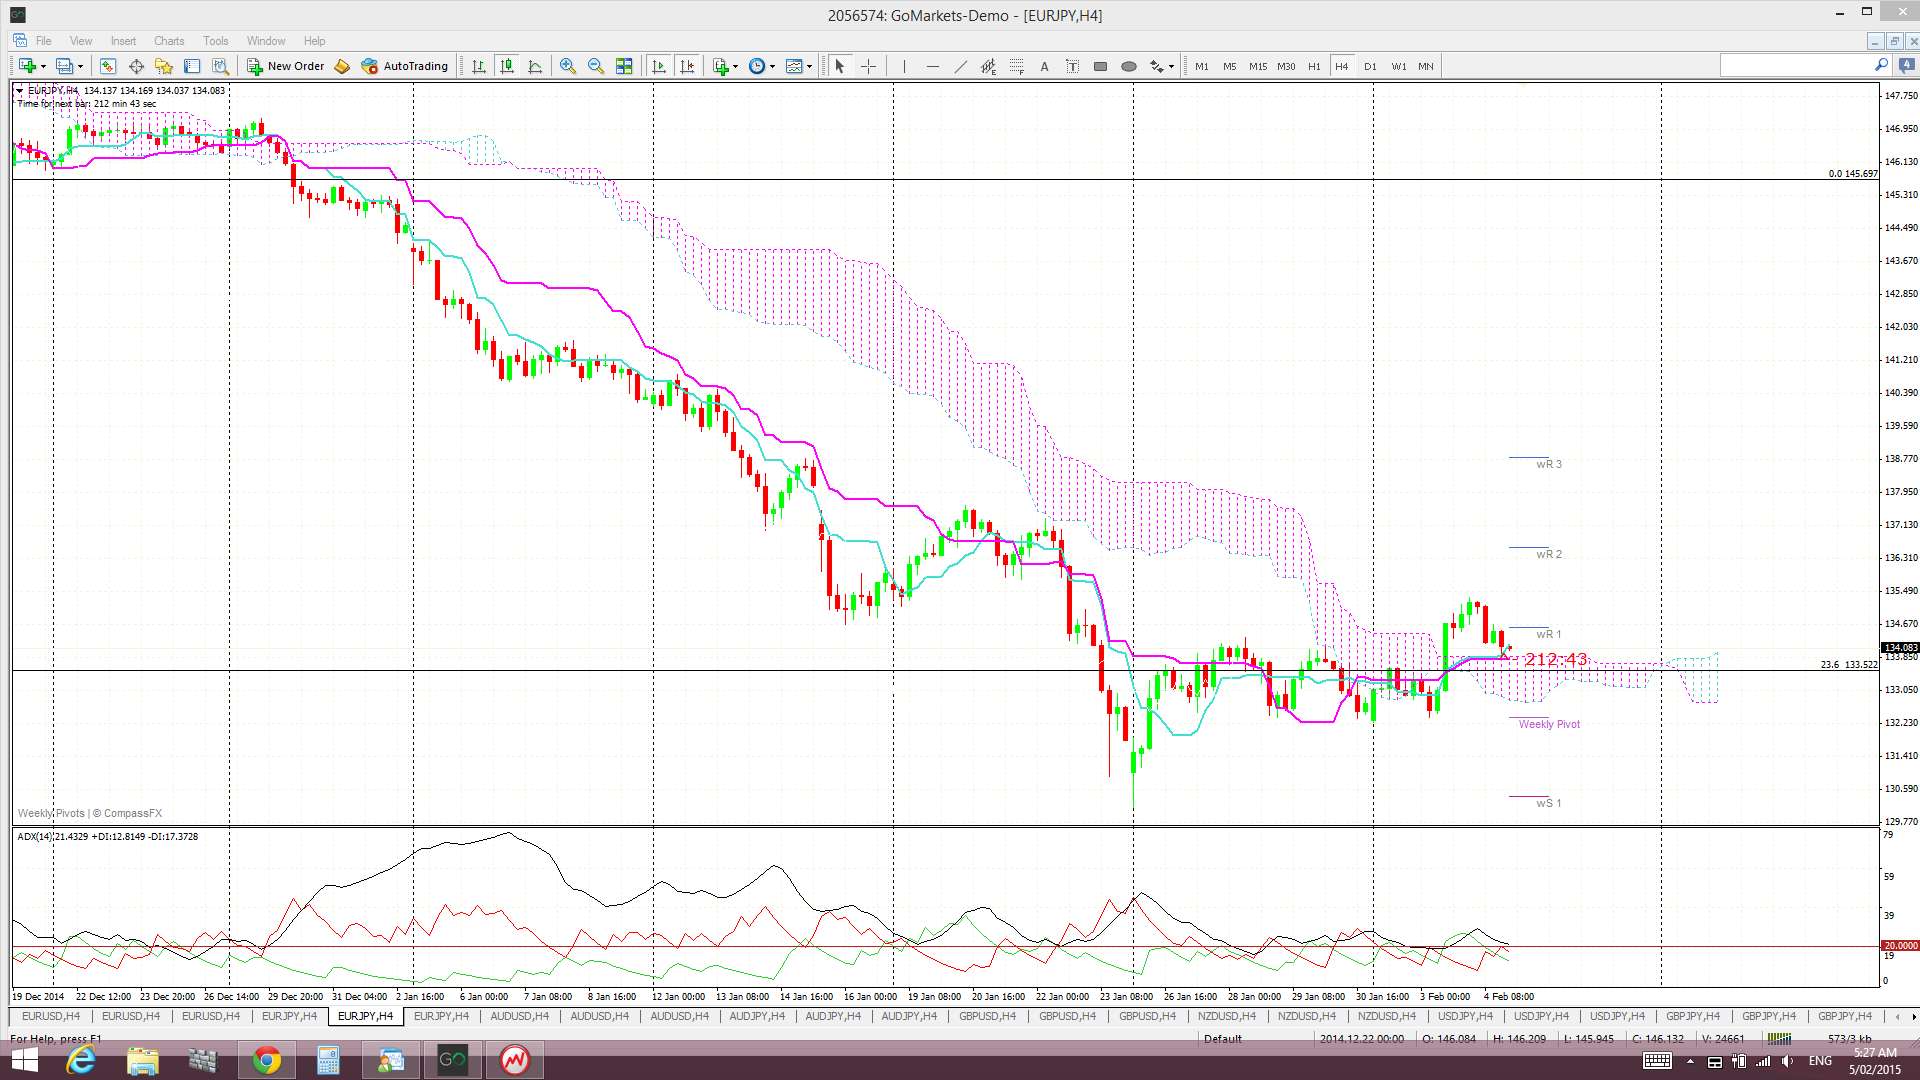
U/J daily Cloud: price is still within the daily Cloud. Maybe we need to see the U/J break free from the daily Cloud to give an FX ‘green light’ for trend trading all other pairs?
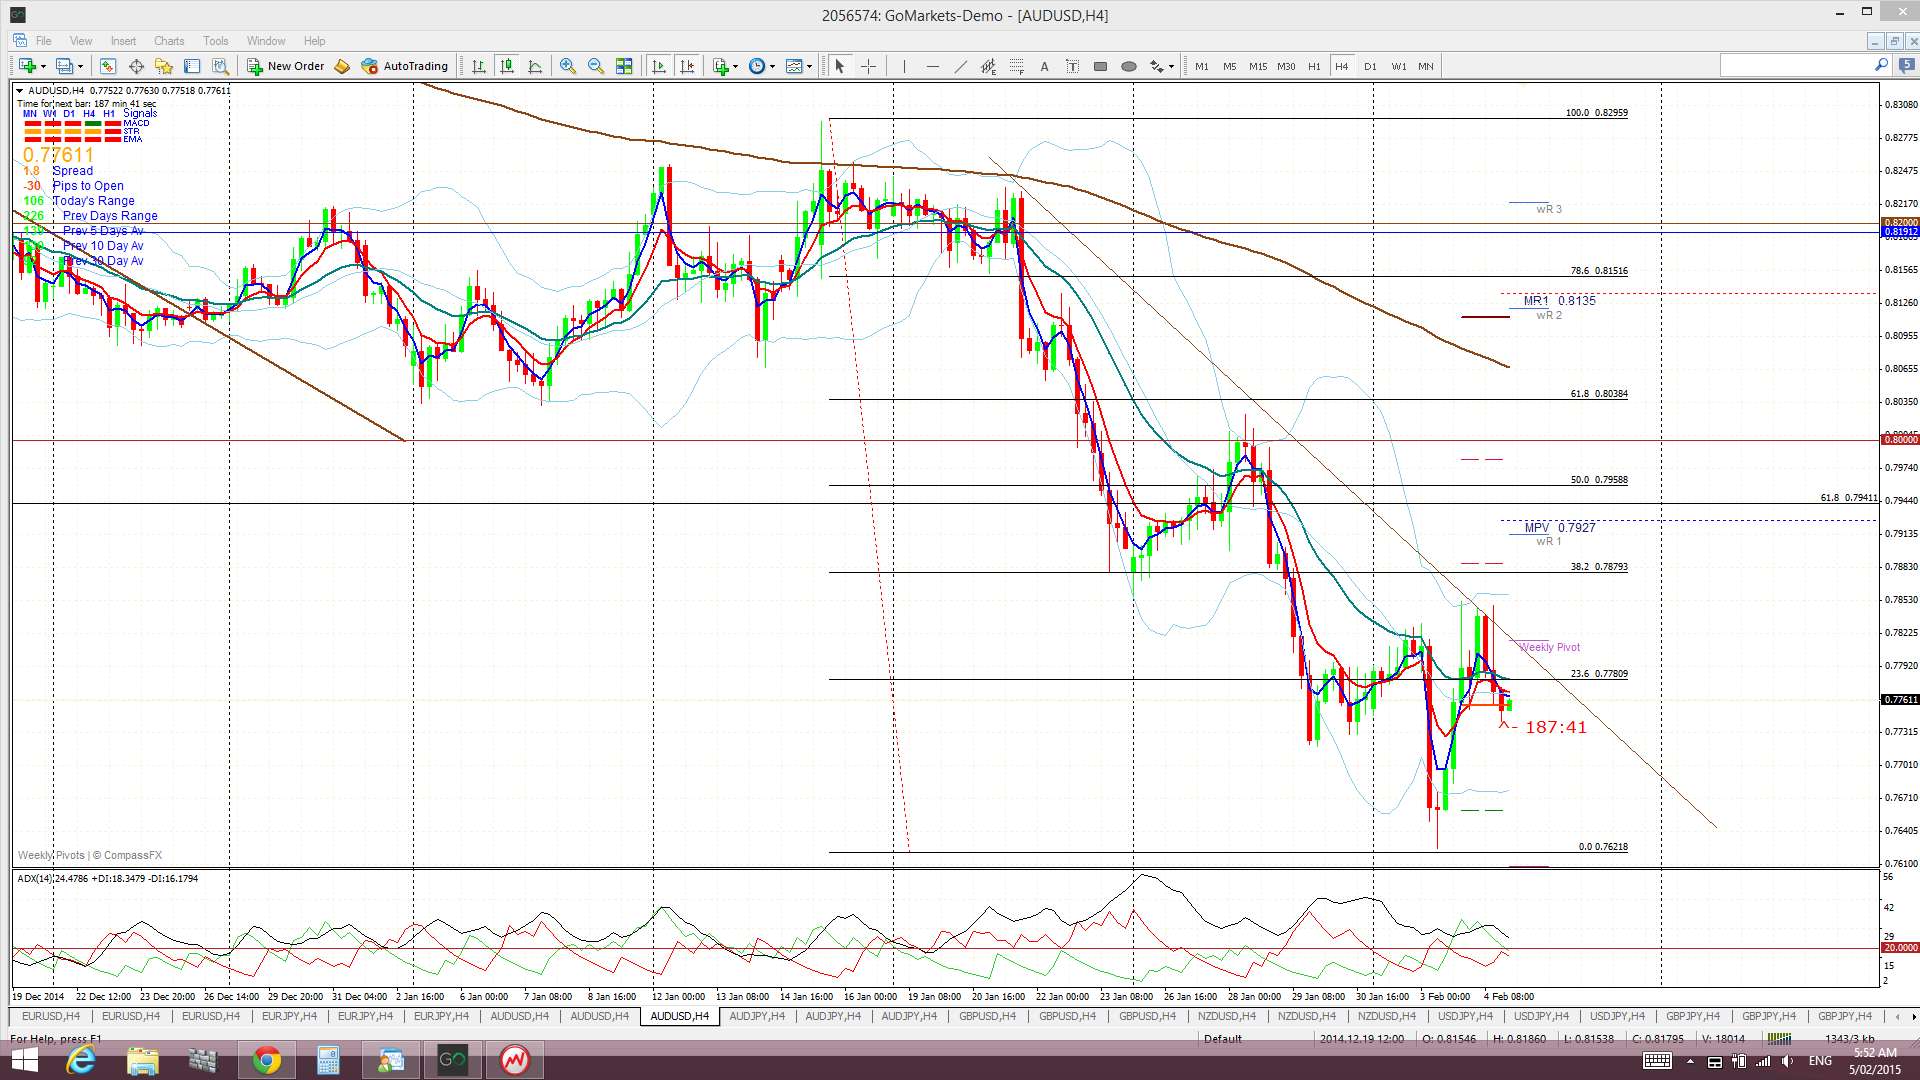
A/U: still back near where it opened for the week and under a recent bear trend line:
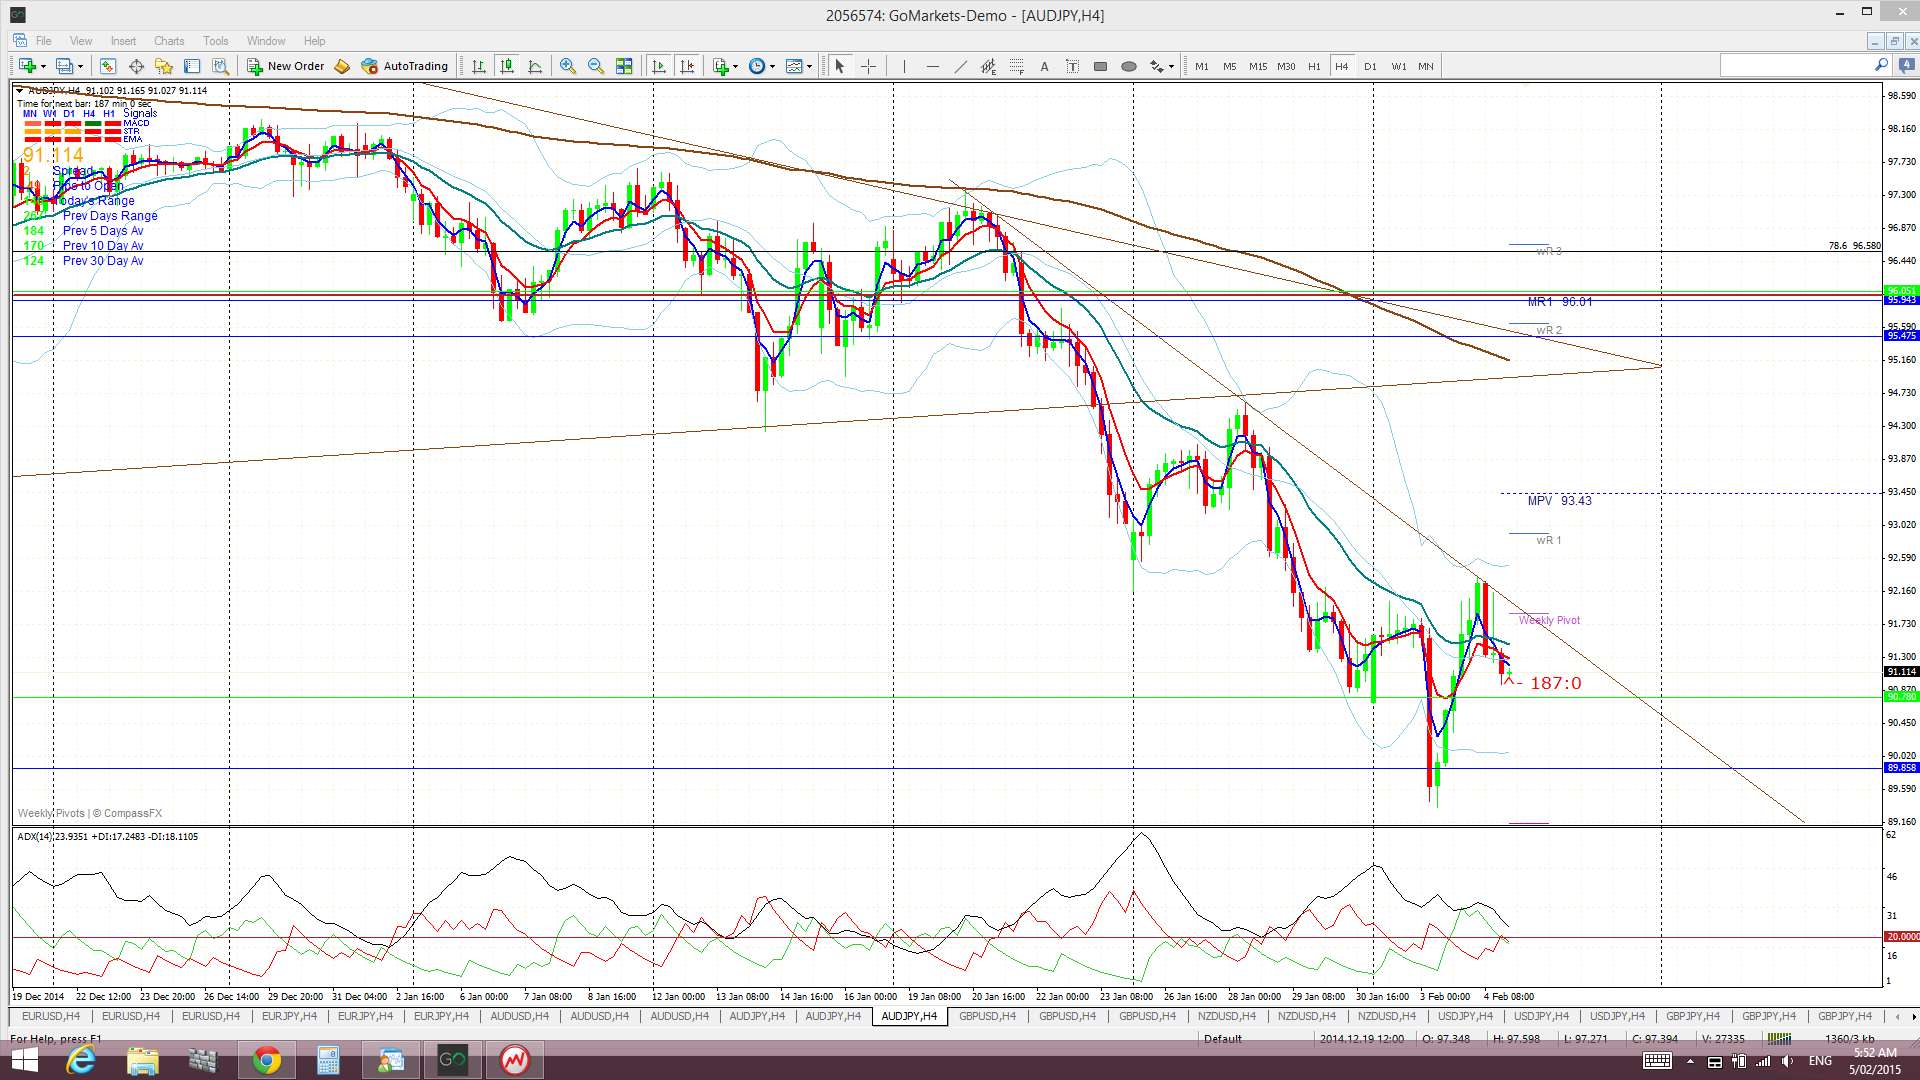
A/J: ditto here.
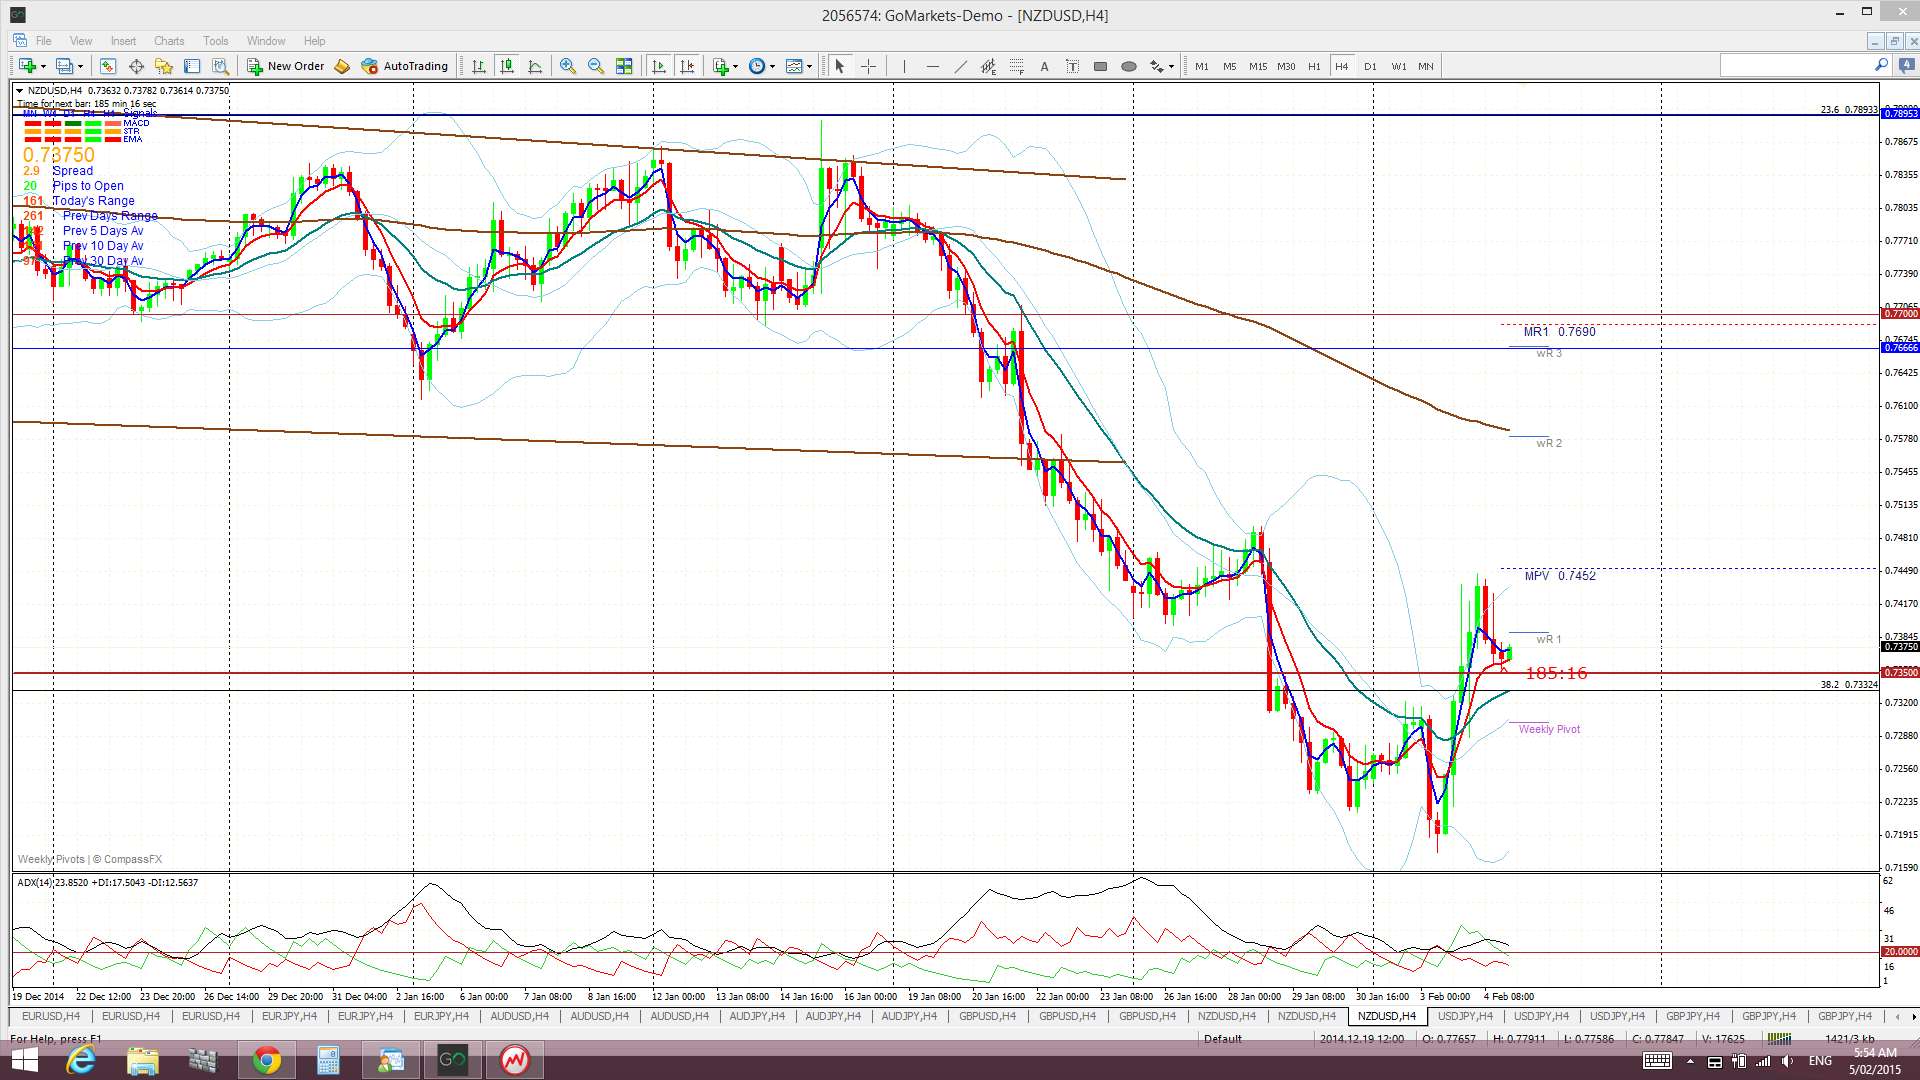
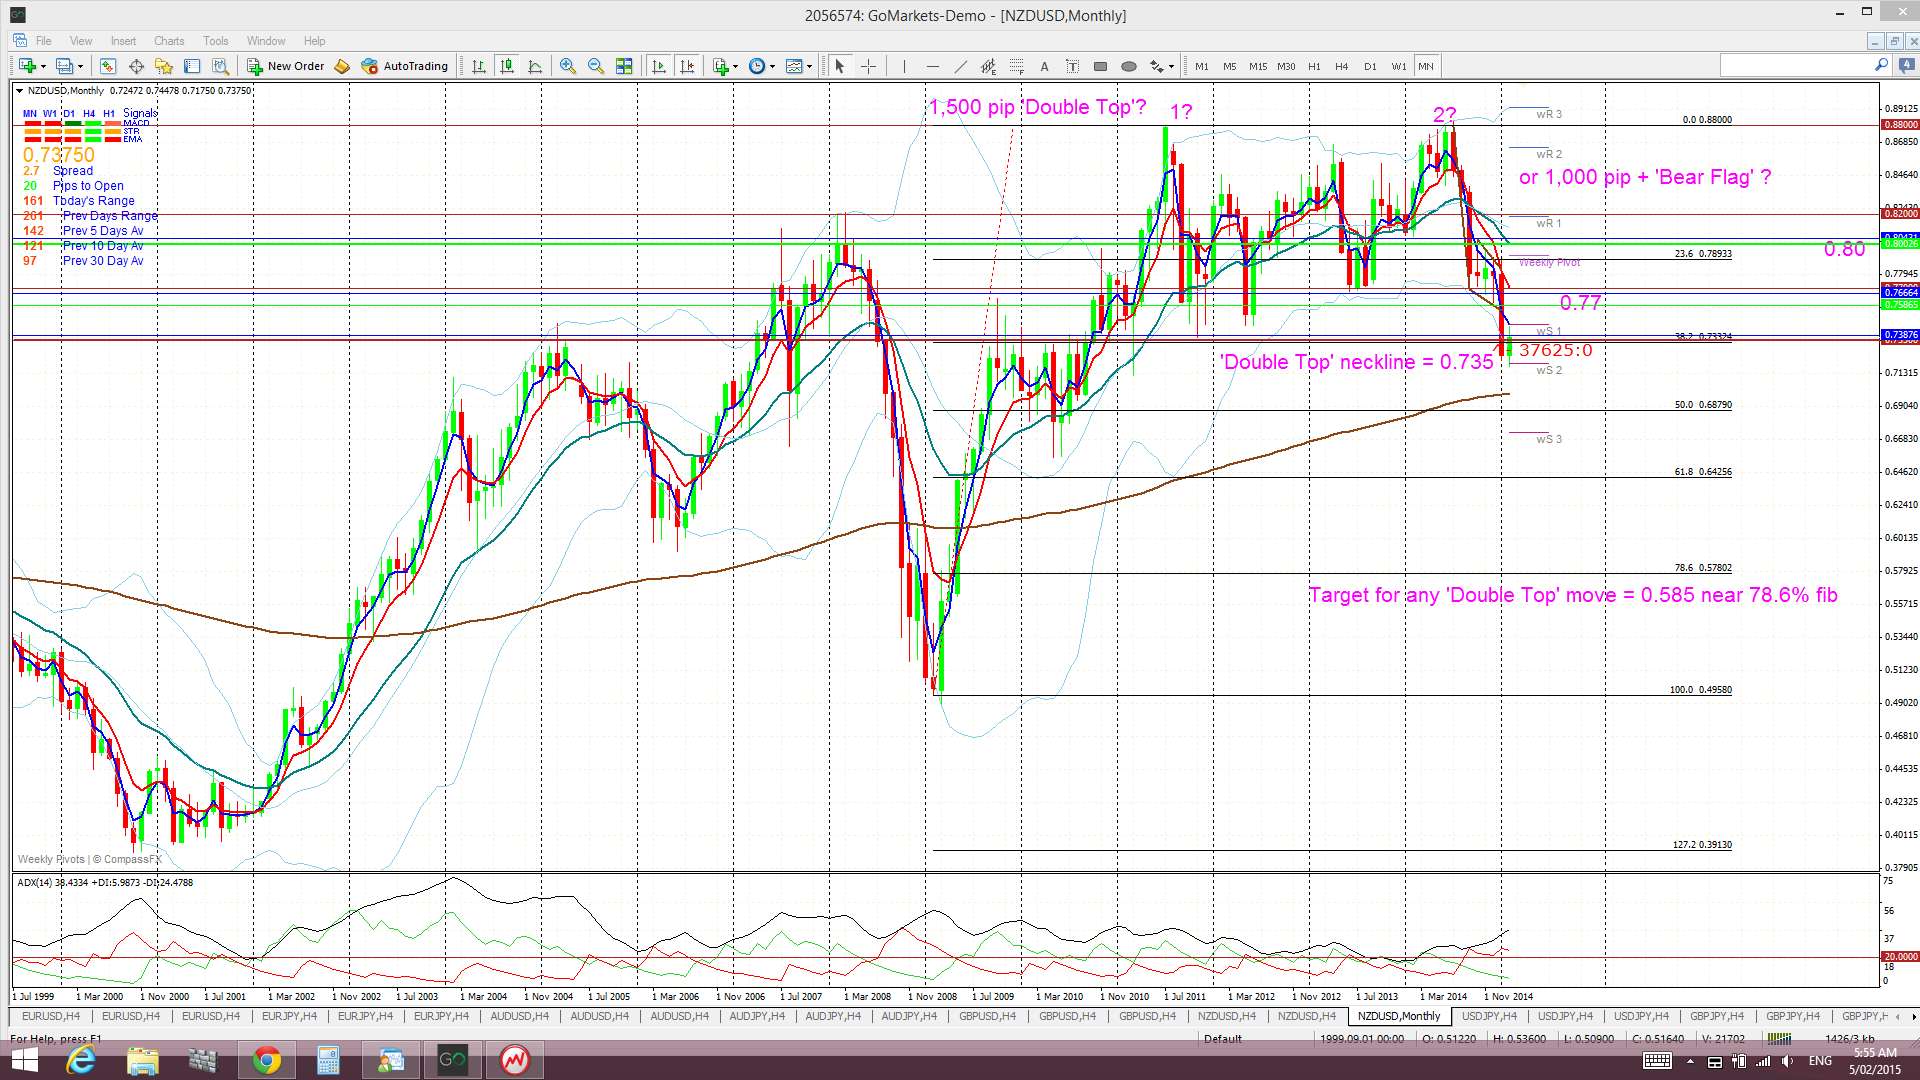
Kiwi: this pair isn’t straying too far from the 0.735 S/R level. This importance of this level is best seen on the monthly chart. The Kiwi had looked like it had started a weekly chart Bear Flag move worth 1,000 pips BUT there is a potential monthly chart ‘Double Top’ move brewing worth up to 1,500 pips.
Kiwi 4hr: not straying too far from 0.735:
Kiwi weekly: a 1,000 pip Bear Flag started here?
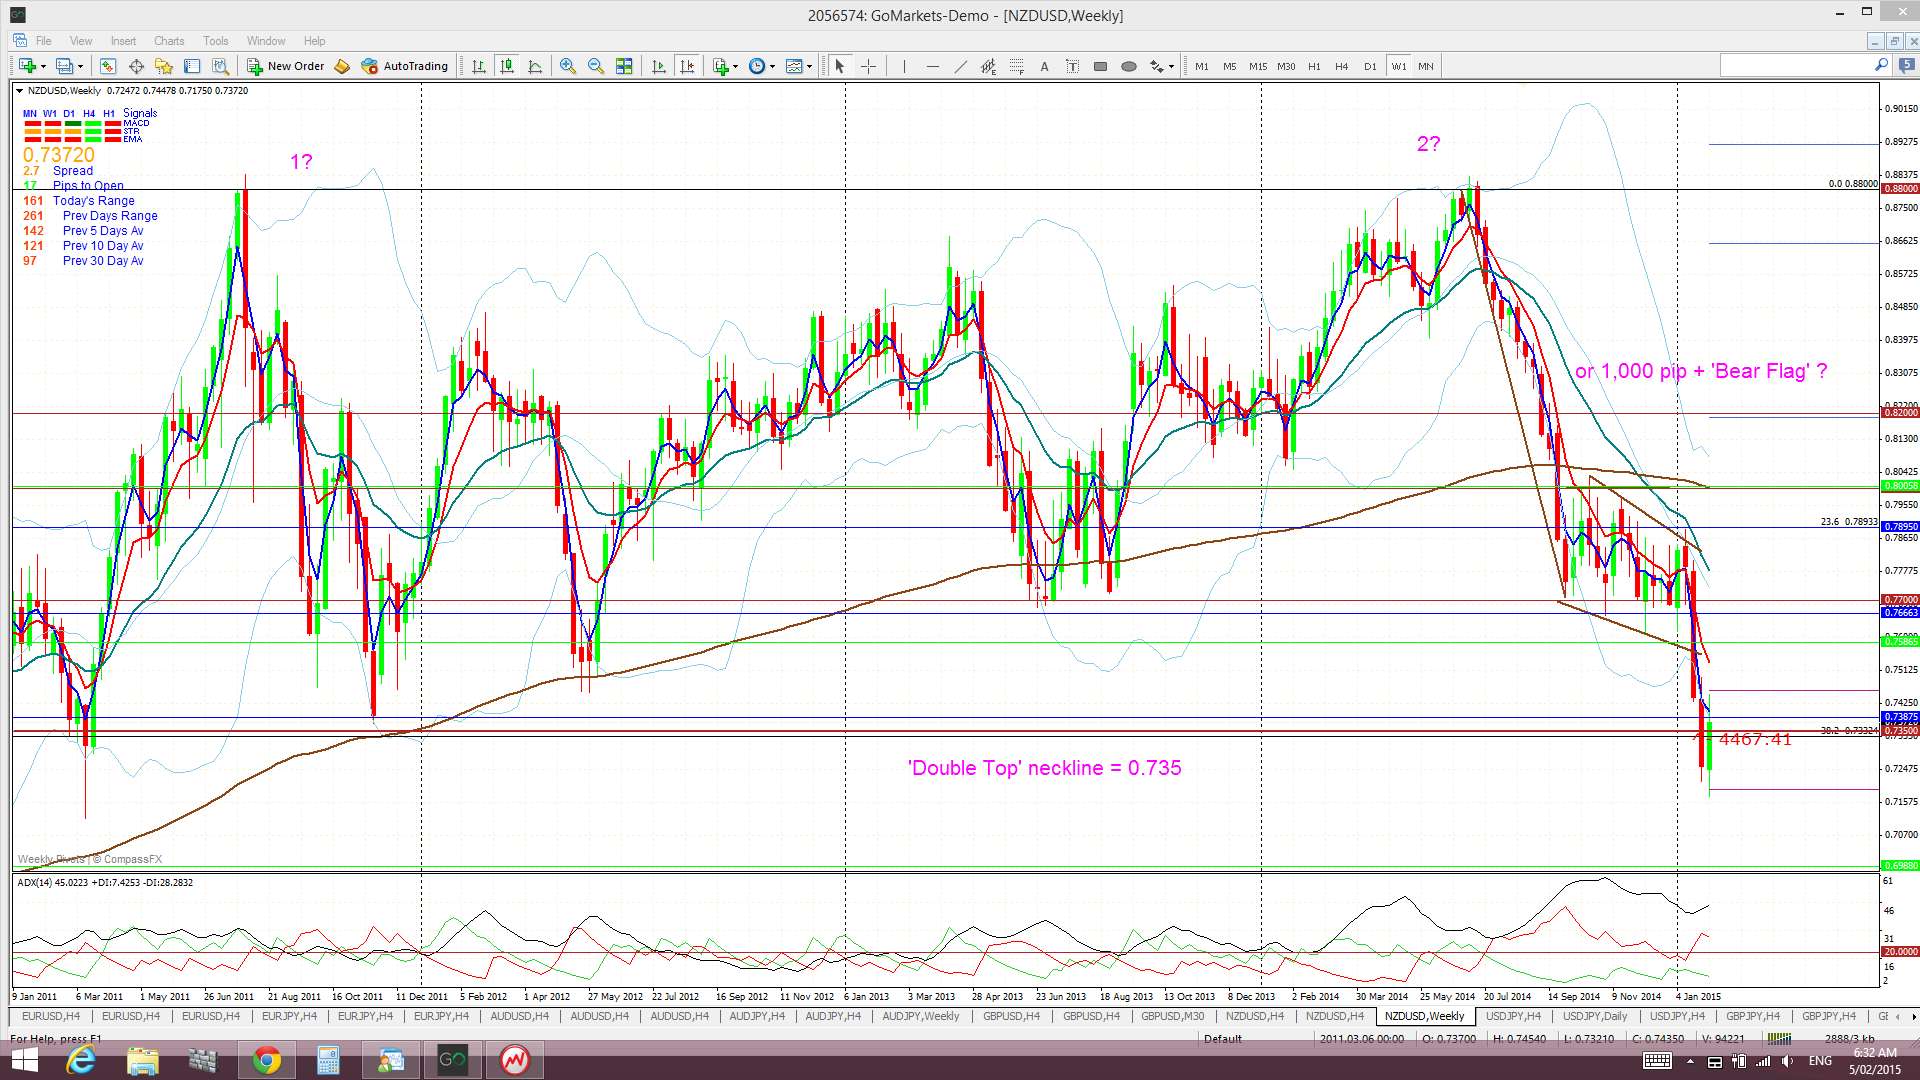
Kiwi monthly: Or a 1,500 pip ‘Double Top’? The neck line of this ‘Double Top’ is at 0.735 and hence the reason price is busily testing this level this week. If USD strength returns then this bearish pattern is a bit of a no-brainer BUT the situation with the USD isn’t clear just yet and so I am waiting here. This is a monthly chart pattern and so one daily close either side of this 0.735 might not necessarily be any guarantee. Maybe any new trend signal off the 4hr chart will help to give some clue here but they are lacking for the time being. Traders are well advised to keep tabs on the USD index as well for guidance here:
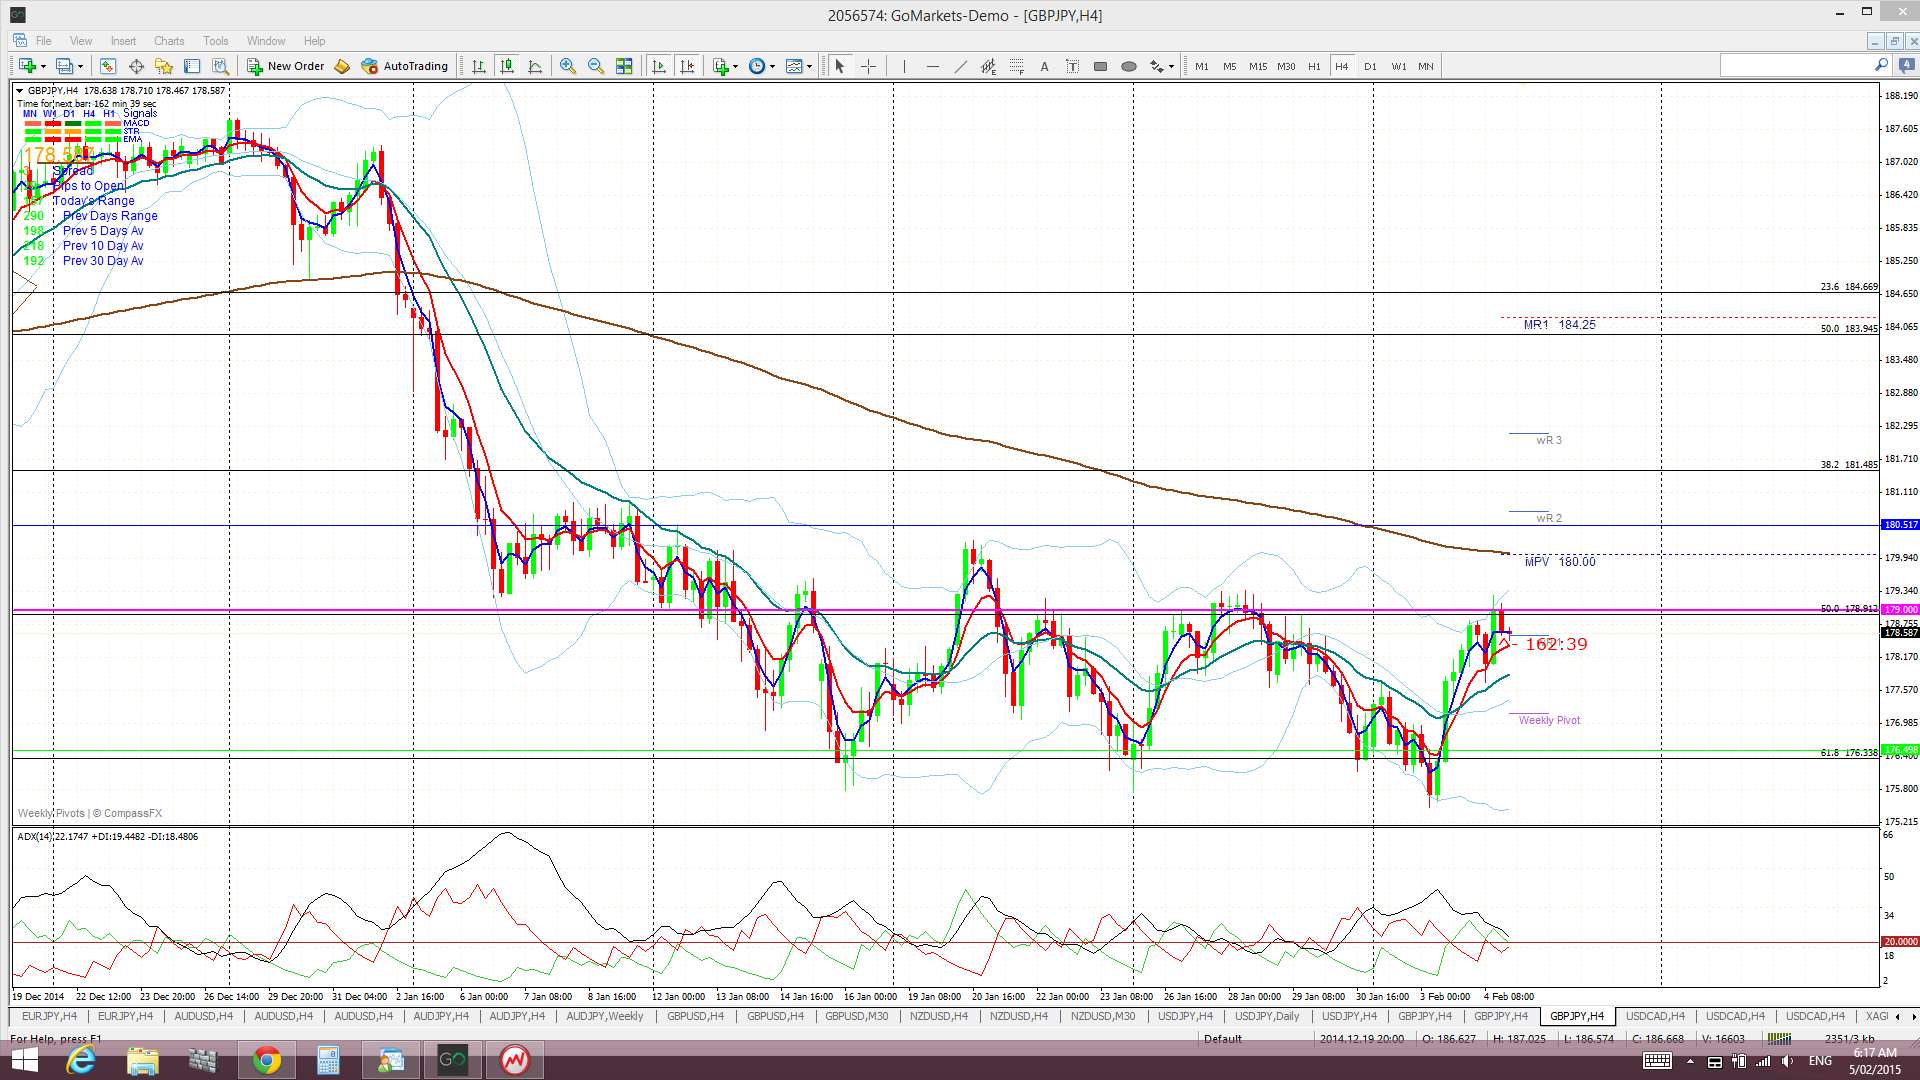
GBP/JPY: chopping around within the trading channel again:
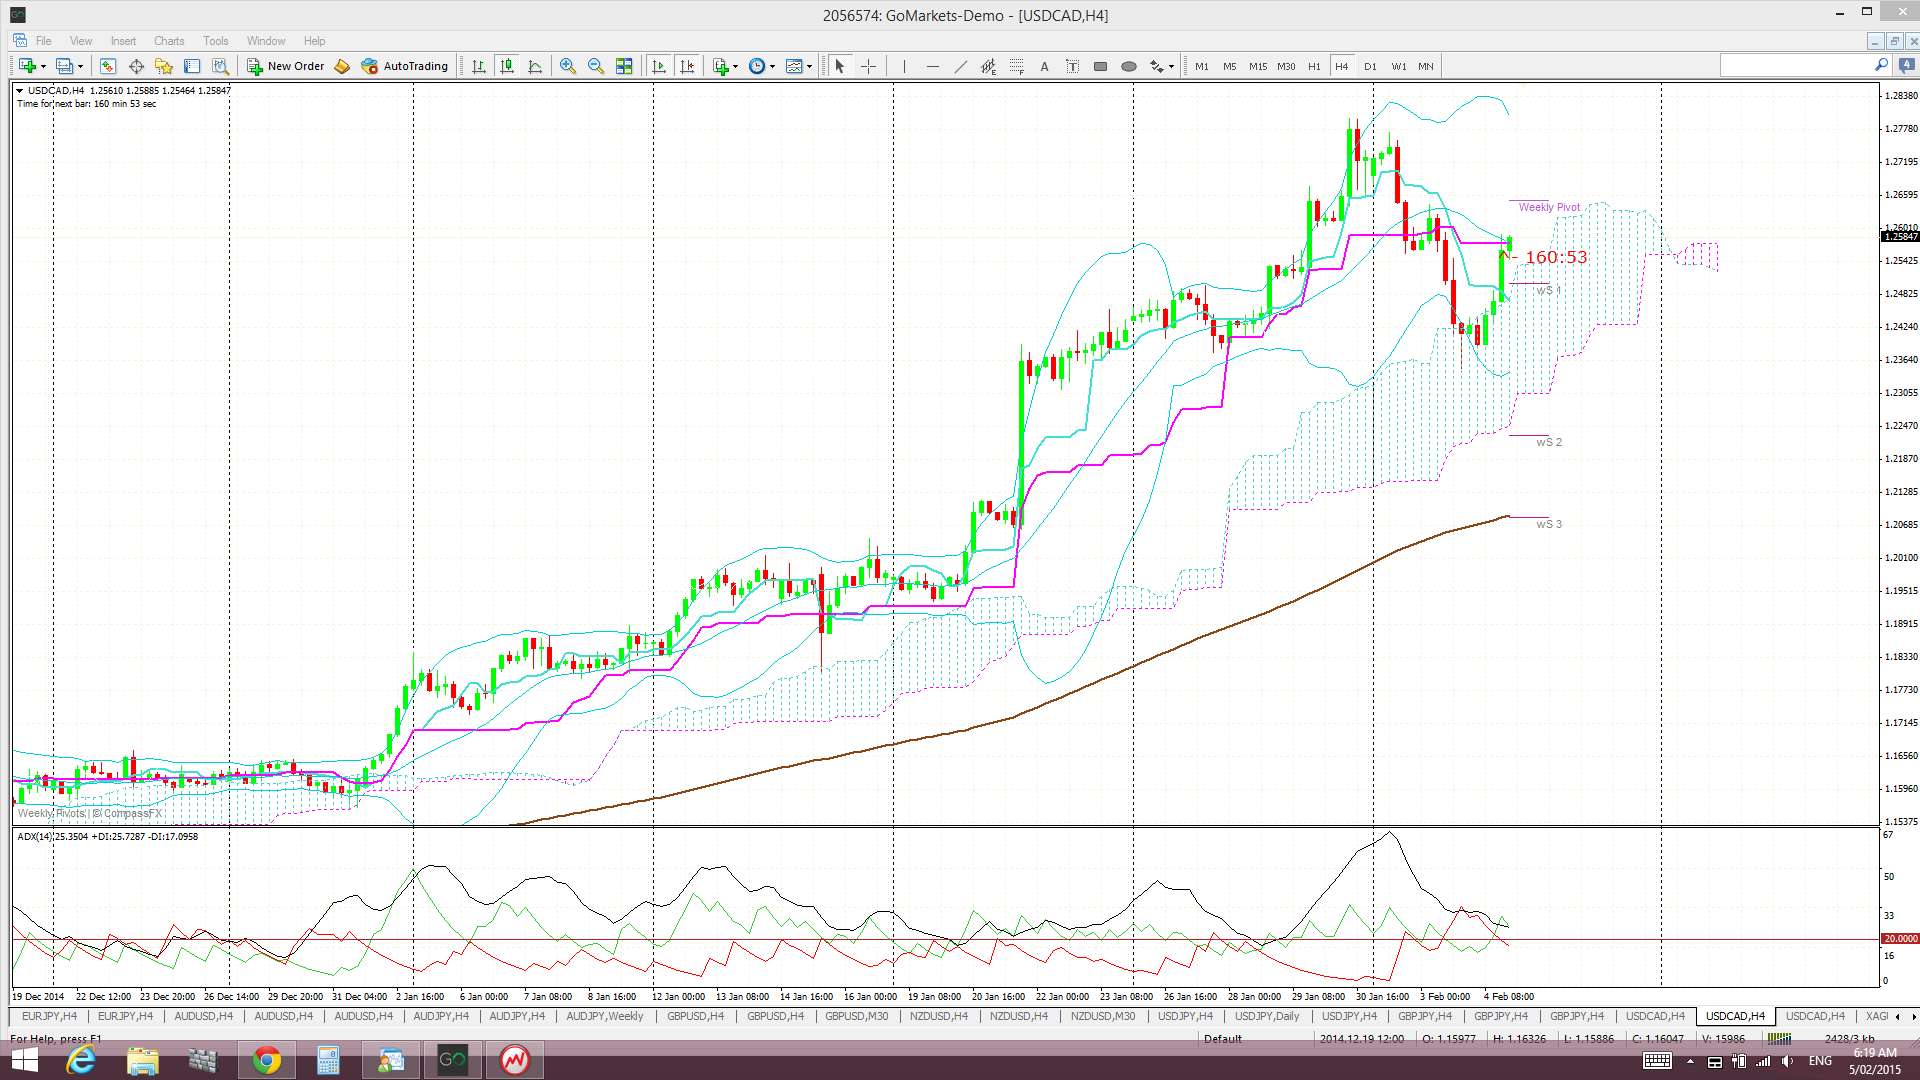
Loonie: back a bit higher with the steadying of the USD and the dip with Oil price. Note how price bounced up off the 4hr Cloud:

EUR/GBP: I’m still looking for a test of the 0.77 breakout level:

The post Pre-NFP chop started and has the U/J been trying to tell us something? appeared first on www.forextell.com.