Traders are anxiously waiting to see what FOMC brings on Thursday but there are some technical patterns evolving ahead of this key news release. It might pay to watch for any trend line breakouts that trigger along with increased momentum.
NB: I am away for the next 24 hours and so won’t be updating.
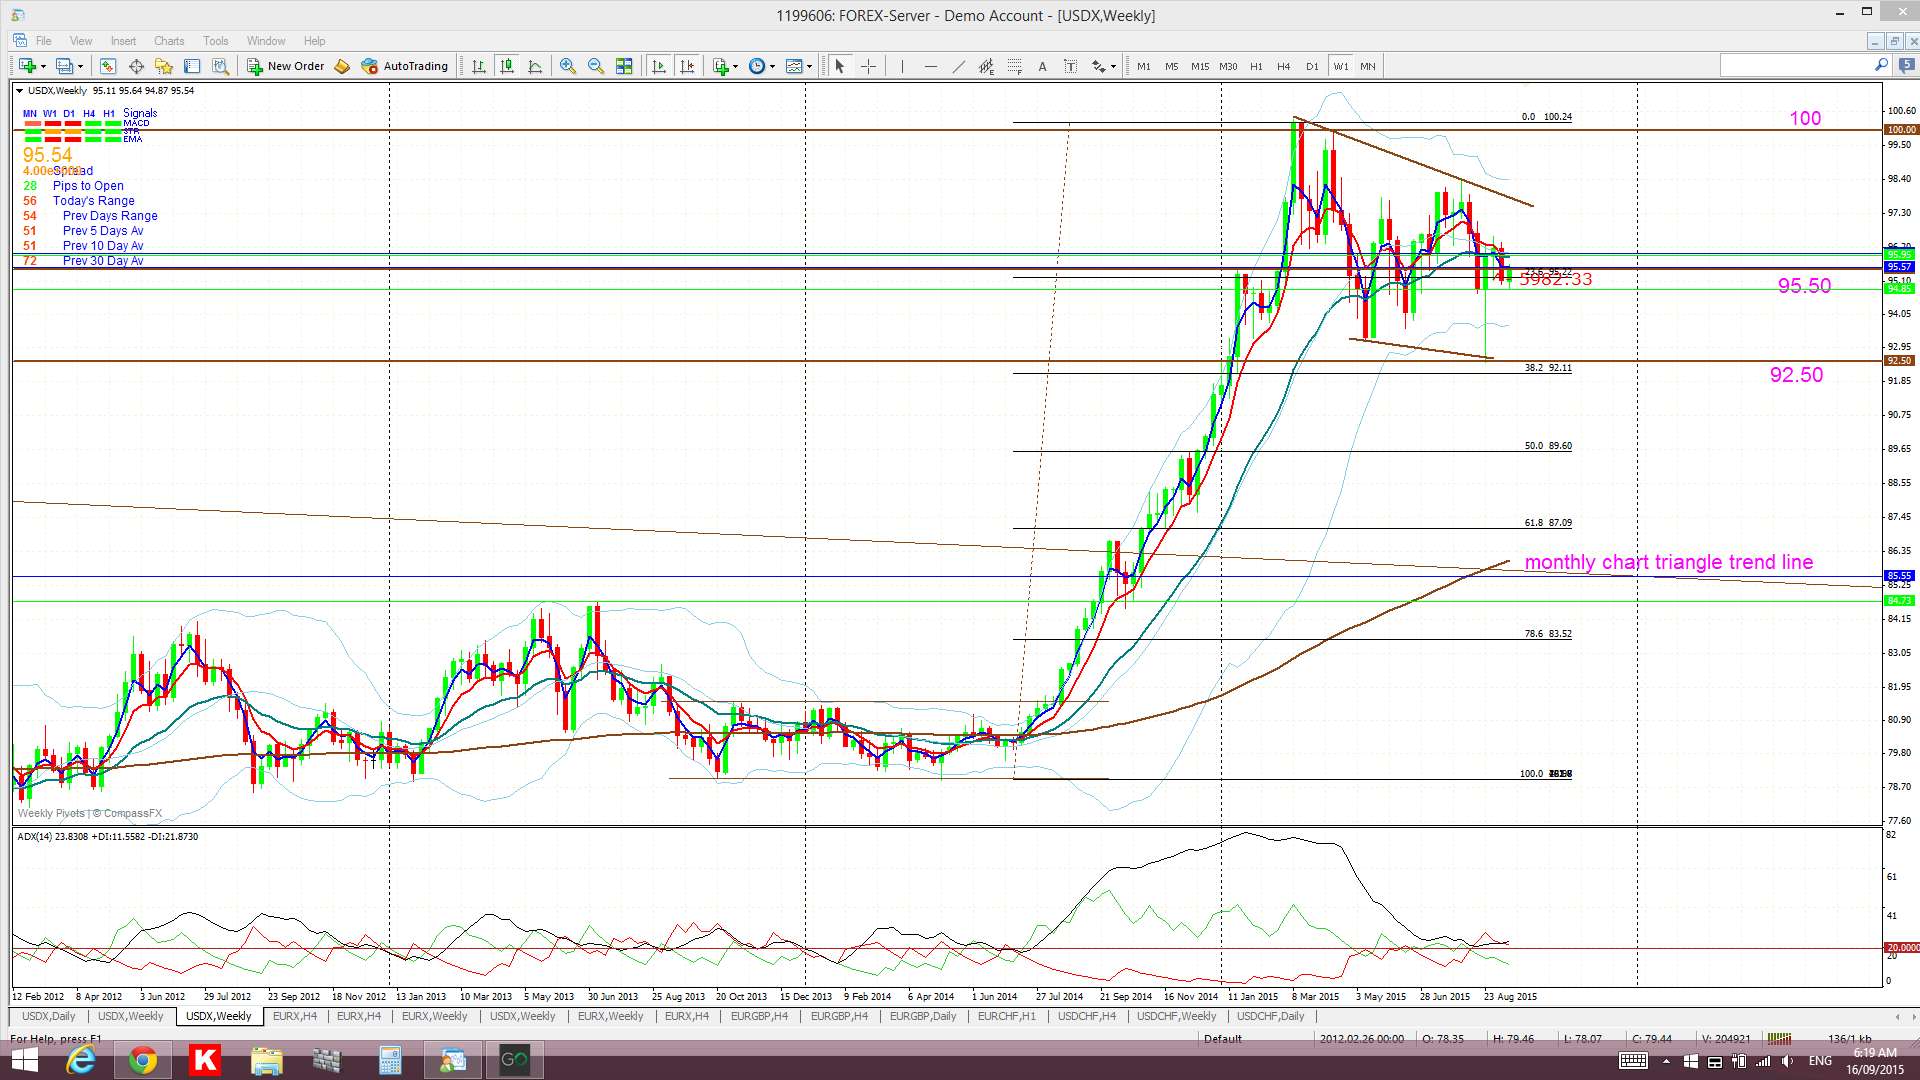
USDX weekly: watch Flag trend lines:
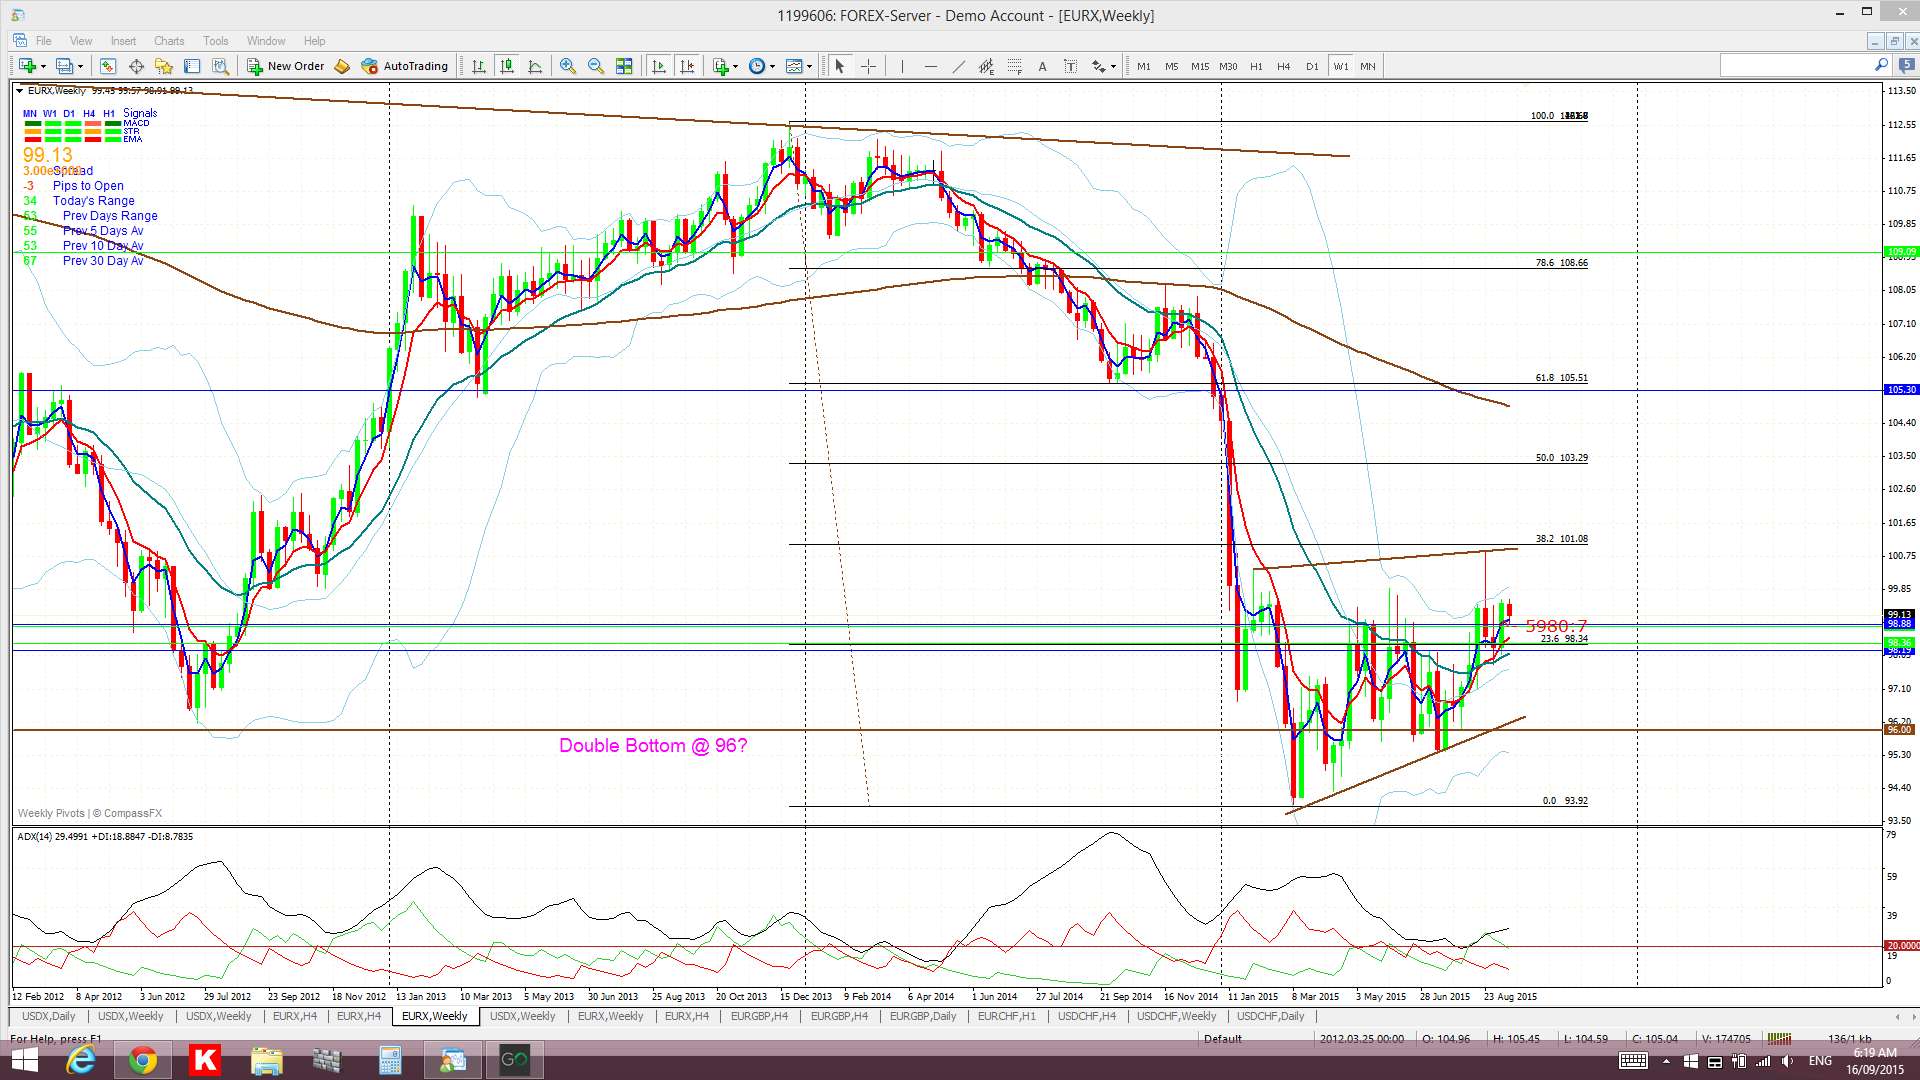
EURX weekly: ditto here:
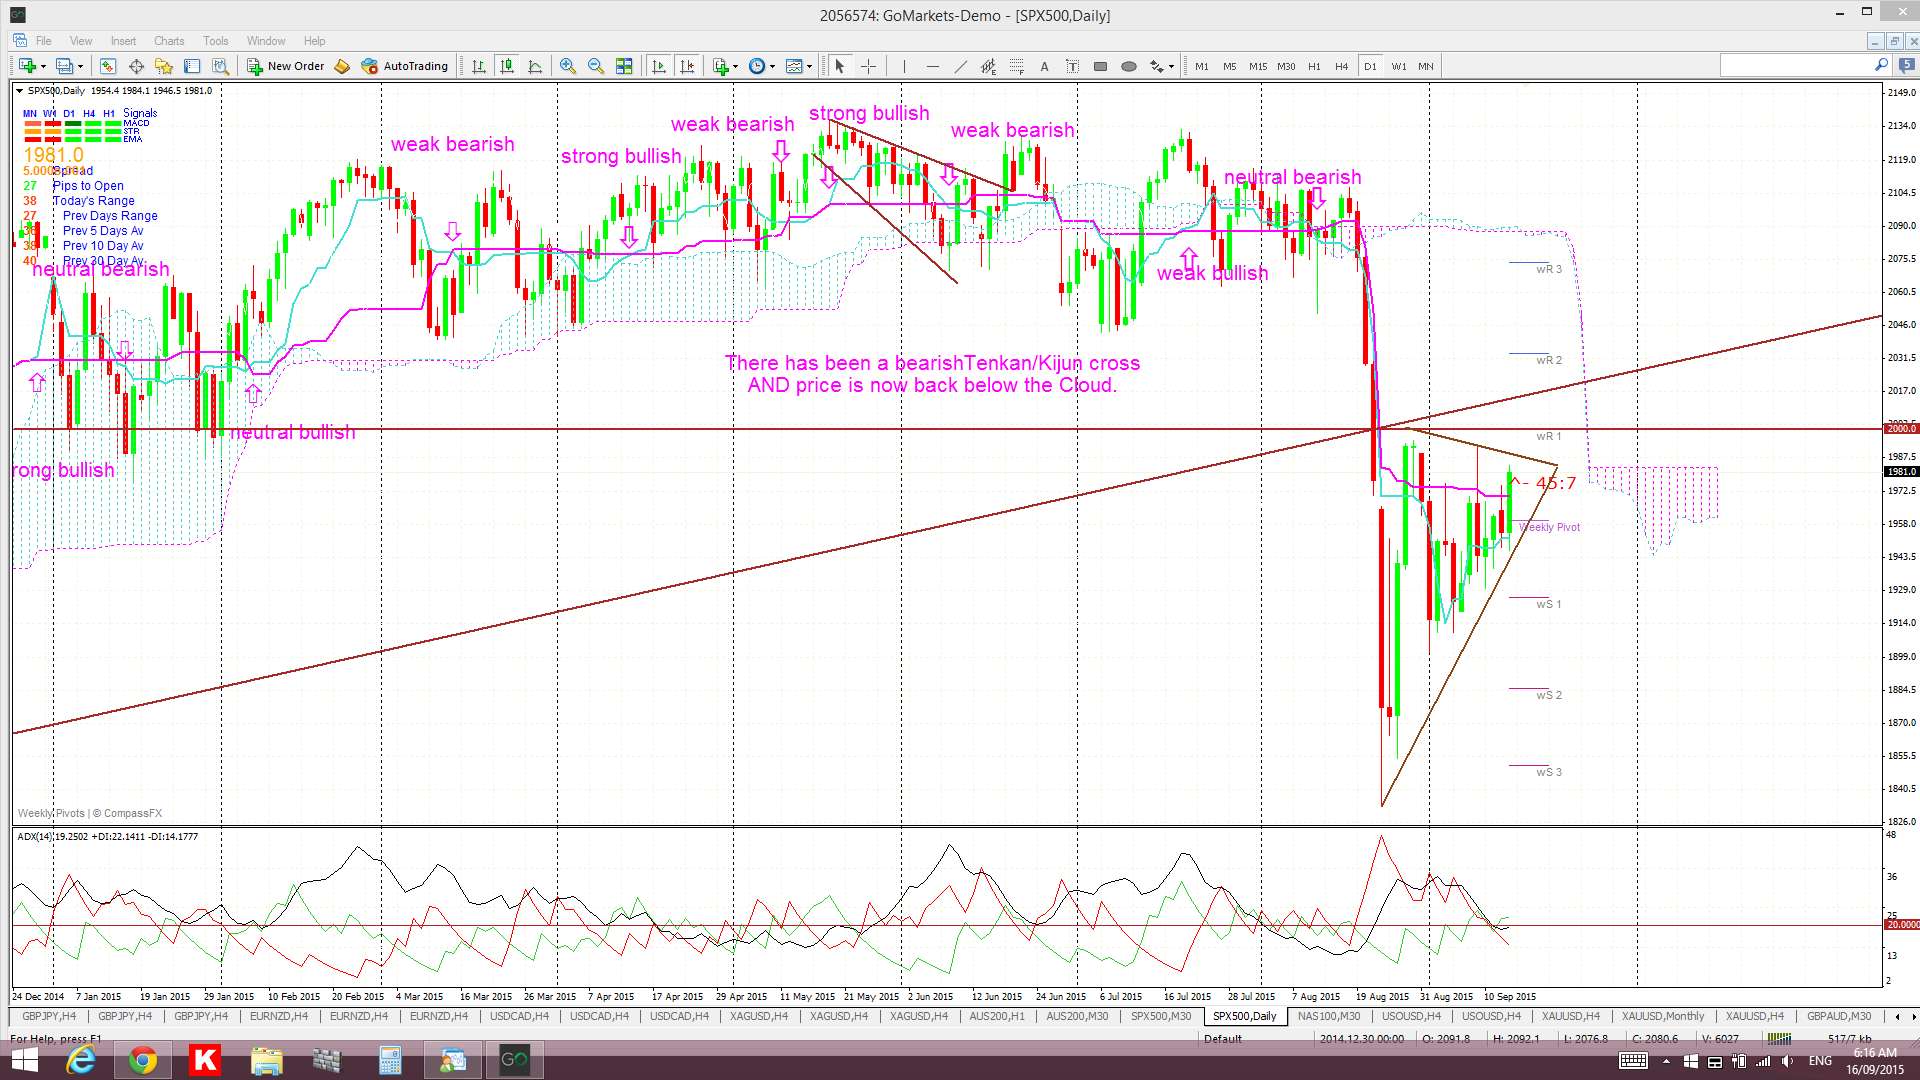
S&P500 daily: ditto here. Keep an eye on any close and hold back above 2,000. I wrote a separate article about the S&P500 and the 2,000 level yesterday.
Forex:
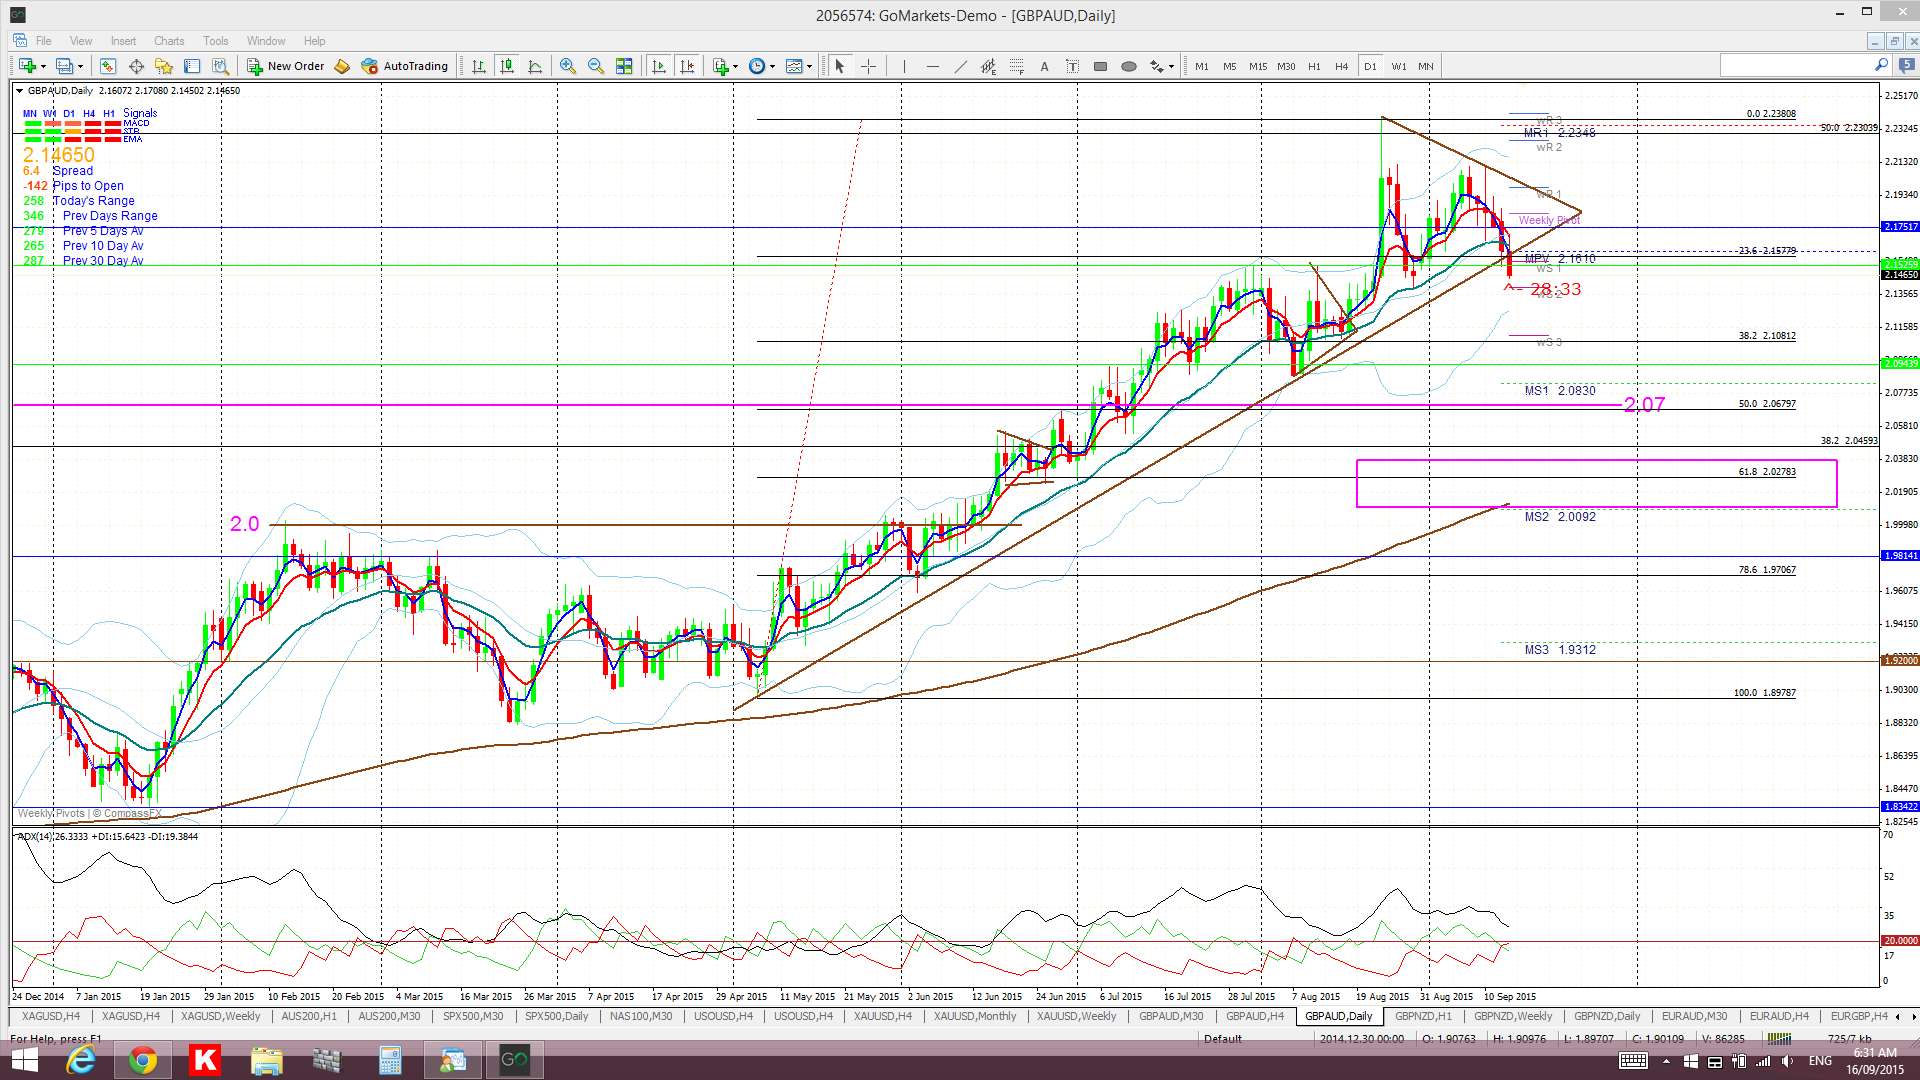
GBP/AUD daily: I suggested yesterday to keep an eye on this pair. We’ve got a trend line break evolving here now and so watch for any continuation move down to 2.07 as this is previous S/R and the 50% fib of the recent swing high move. However, looking at the chart below shows even more support a bit lower and down at the 61.8% fib and daily 200 EMA near the earlier S/R region of of 2.0:
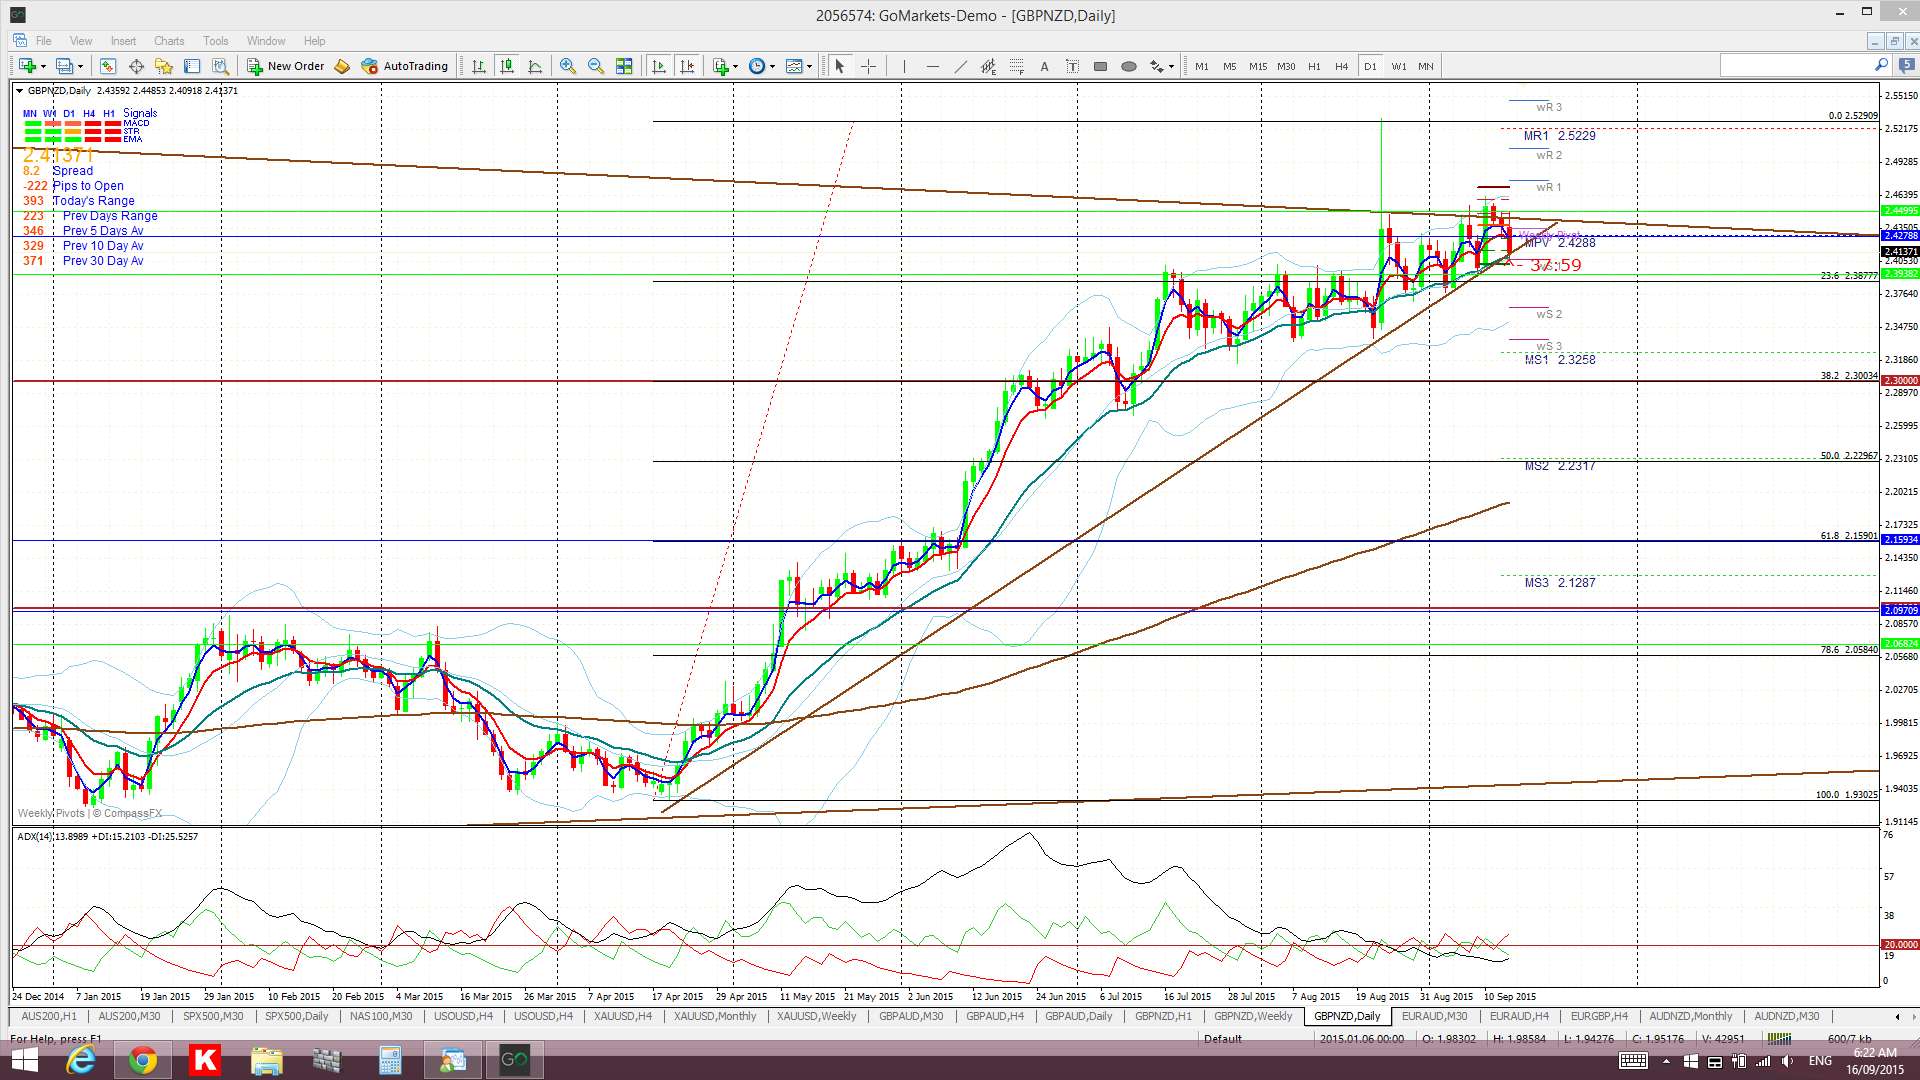
GBP/NZD daily: these trend lines are worth keeping an eye on too:
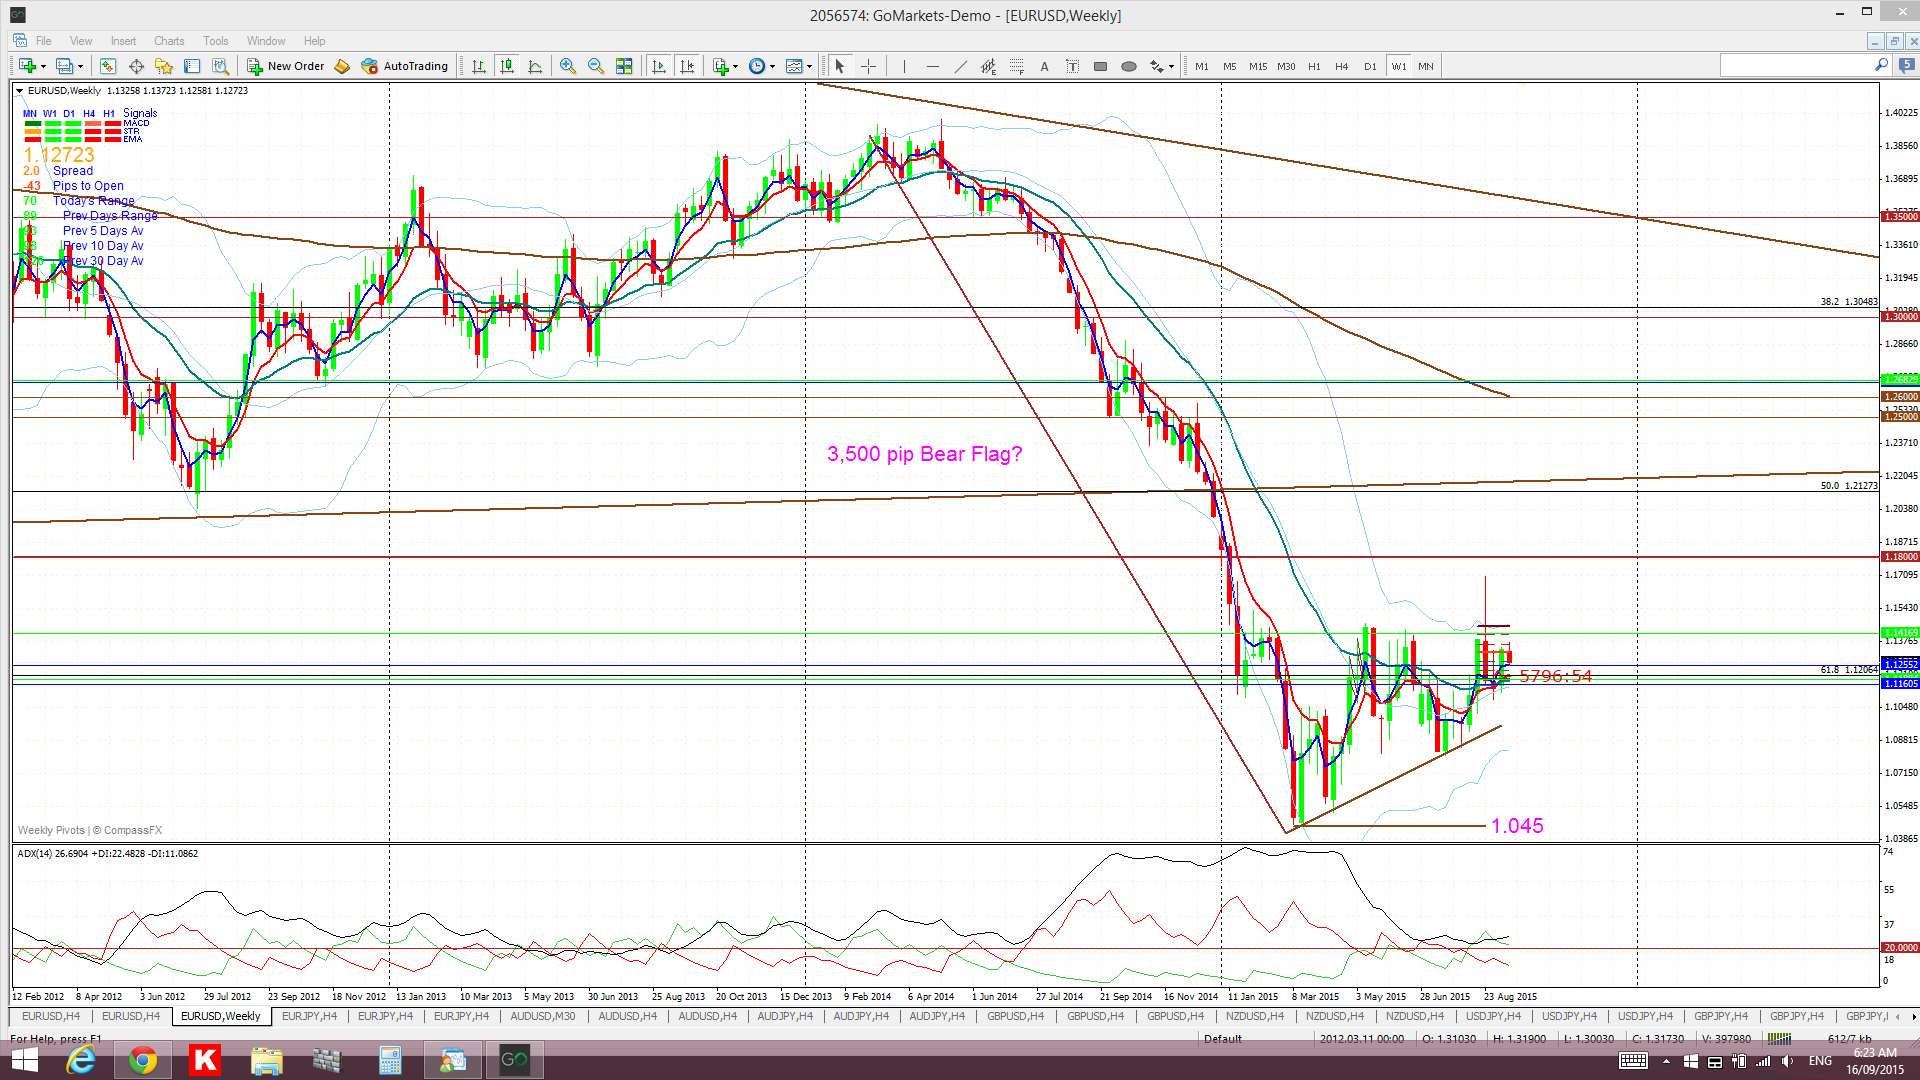
E/U weekly: watch the Flag trend lines here too. In particular, watch for any close back above 1.18 and also for any close below 1.045:
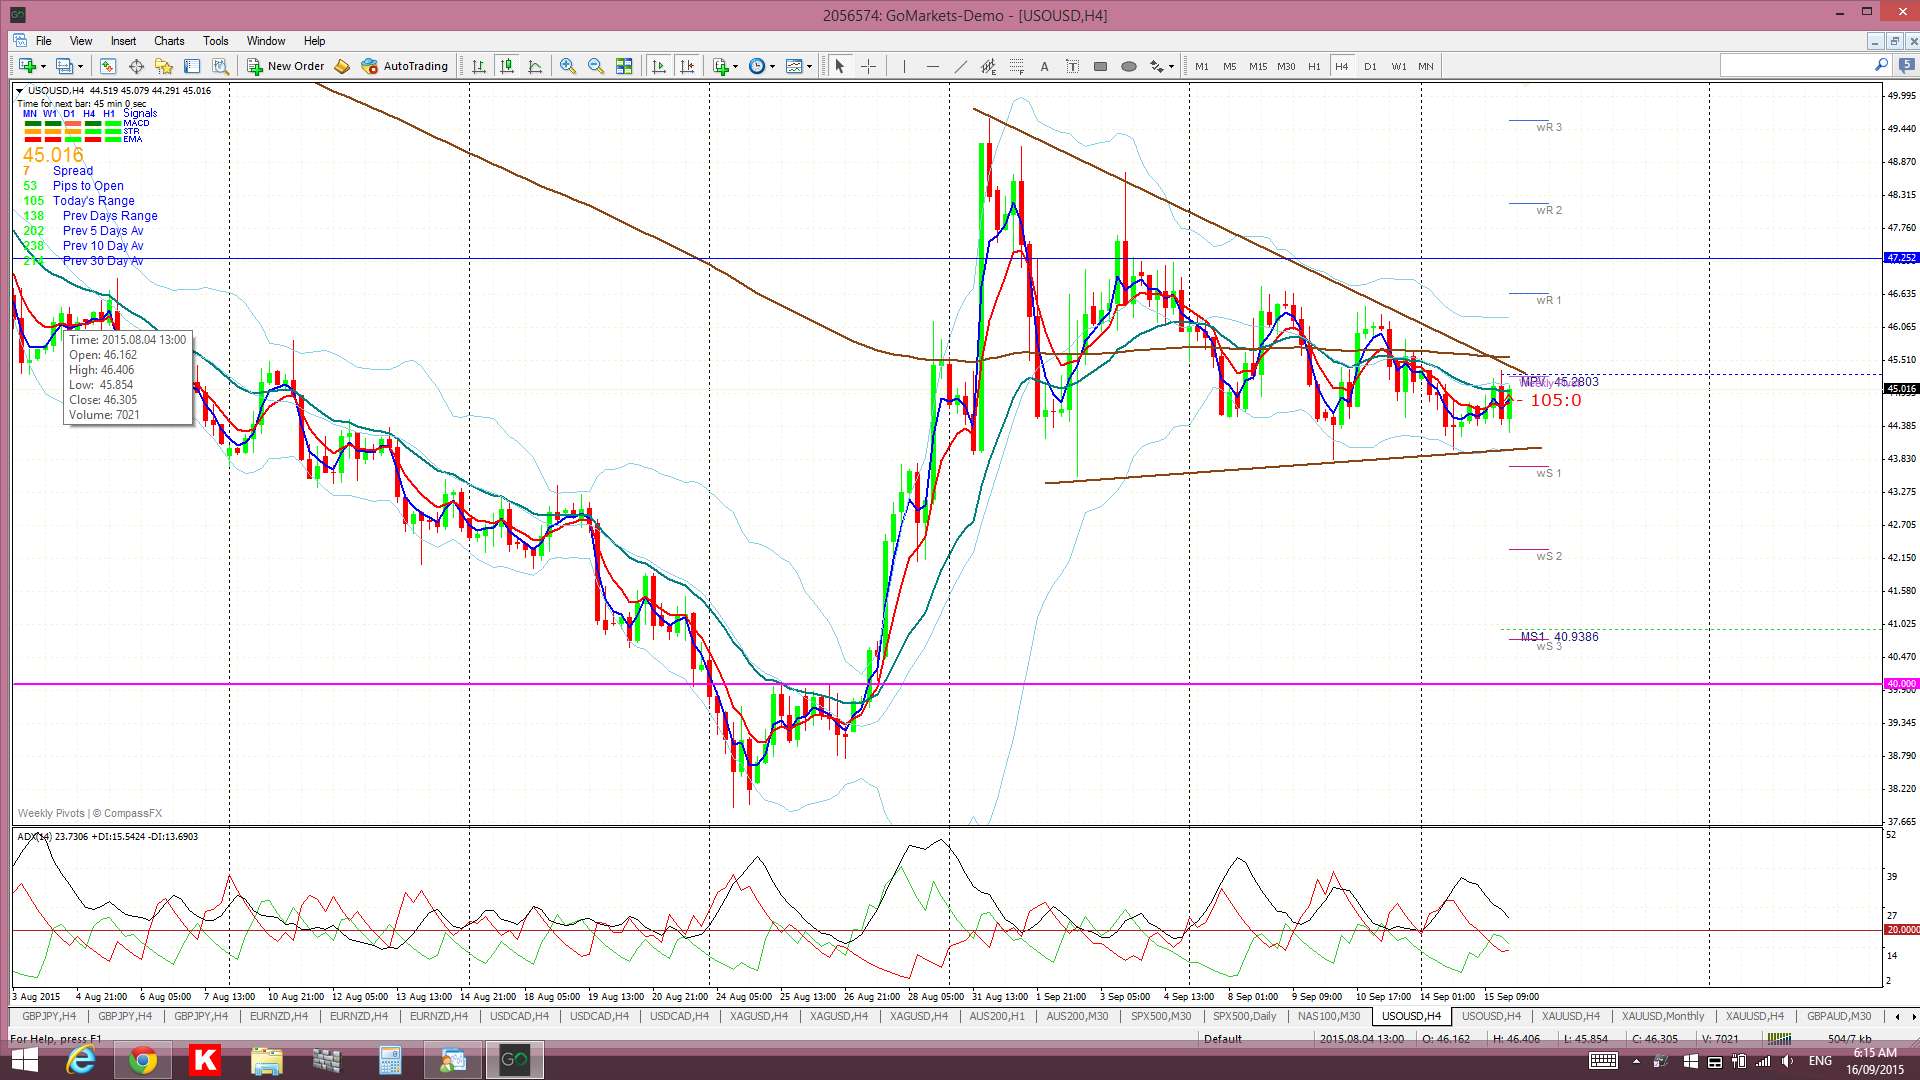
Oil 4hr: watch the triangle trend lines here:
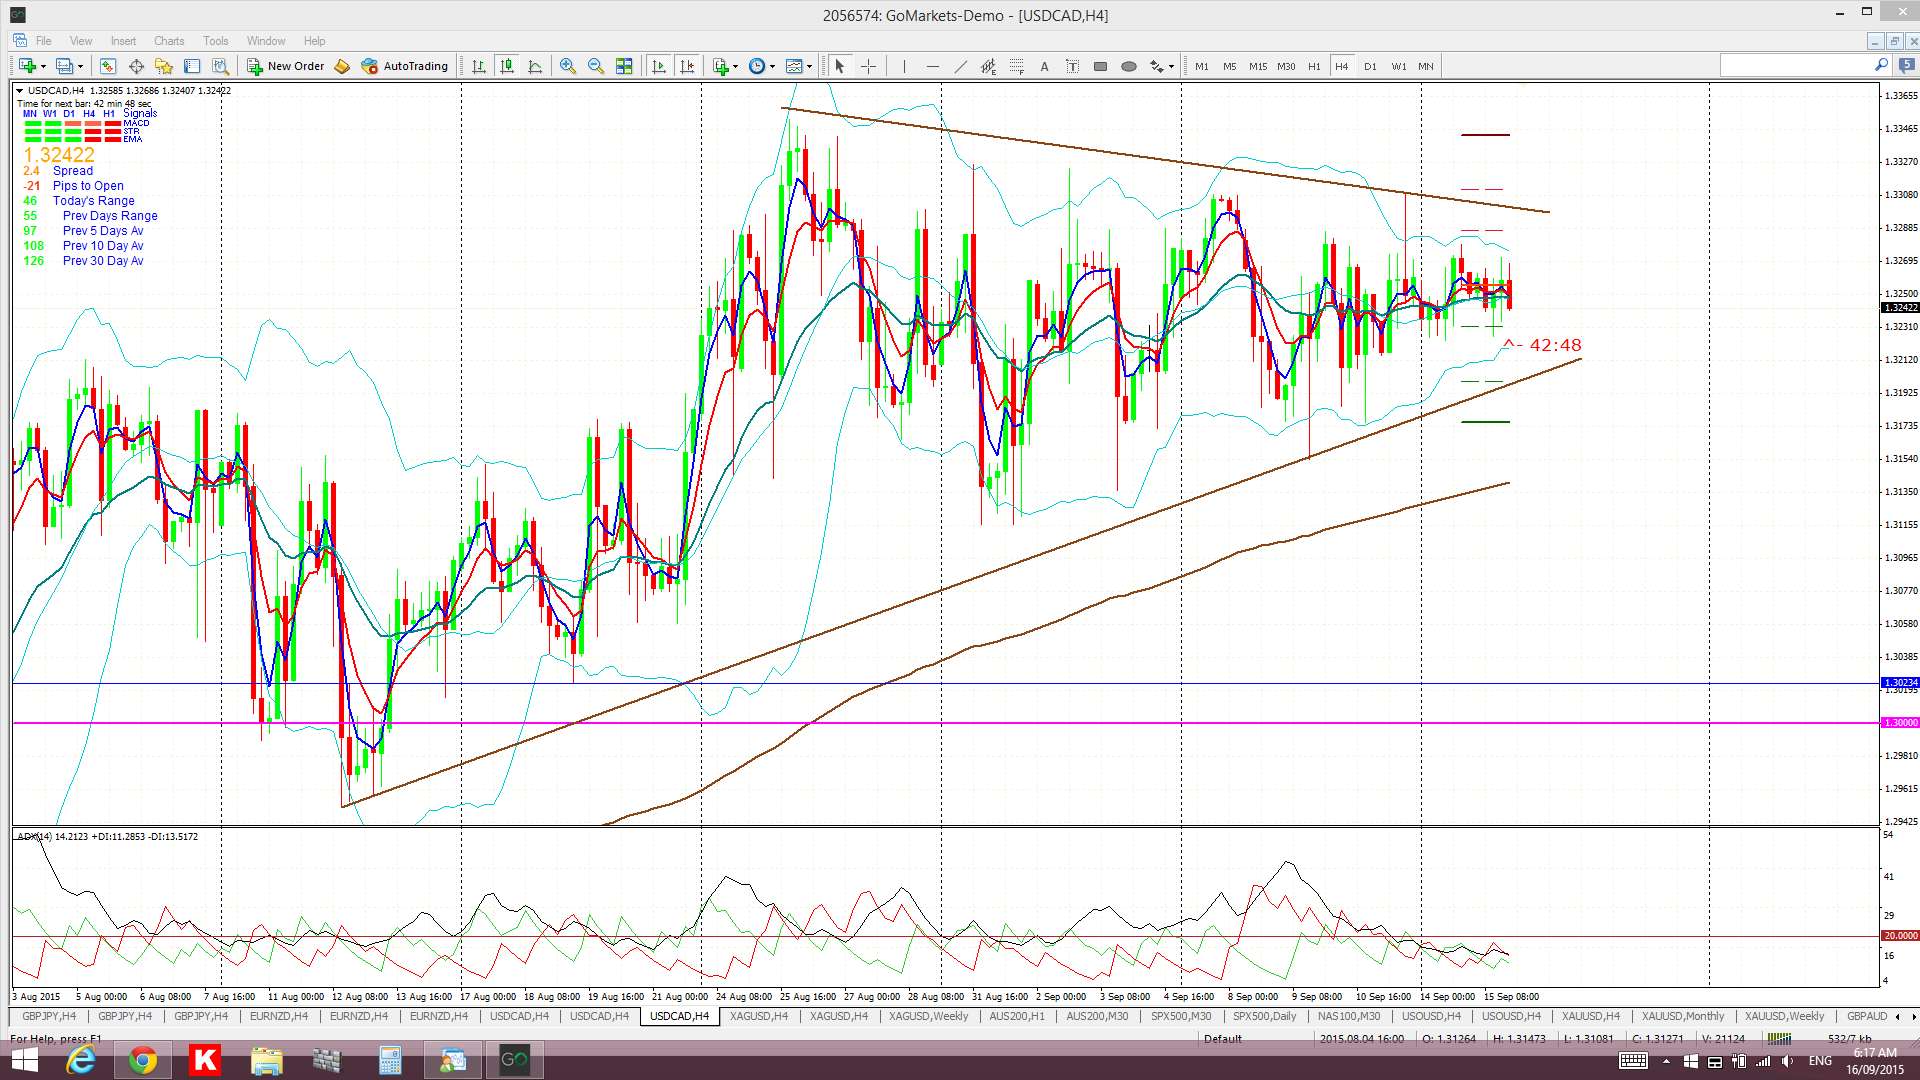
USD/CAD 4hr: this is closely related to the Oil chart above. Note the ADX and current absence of momentum:
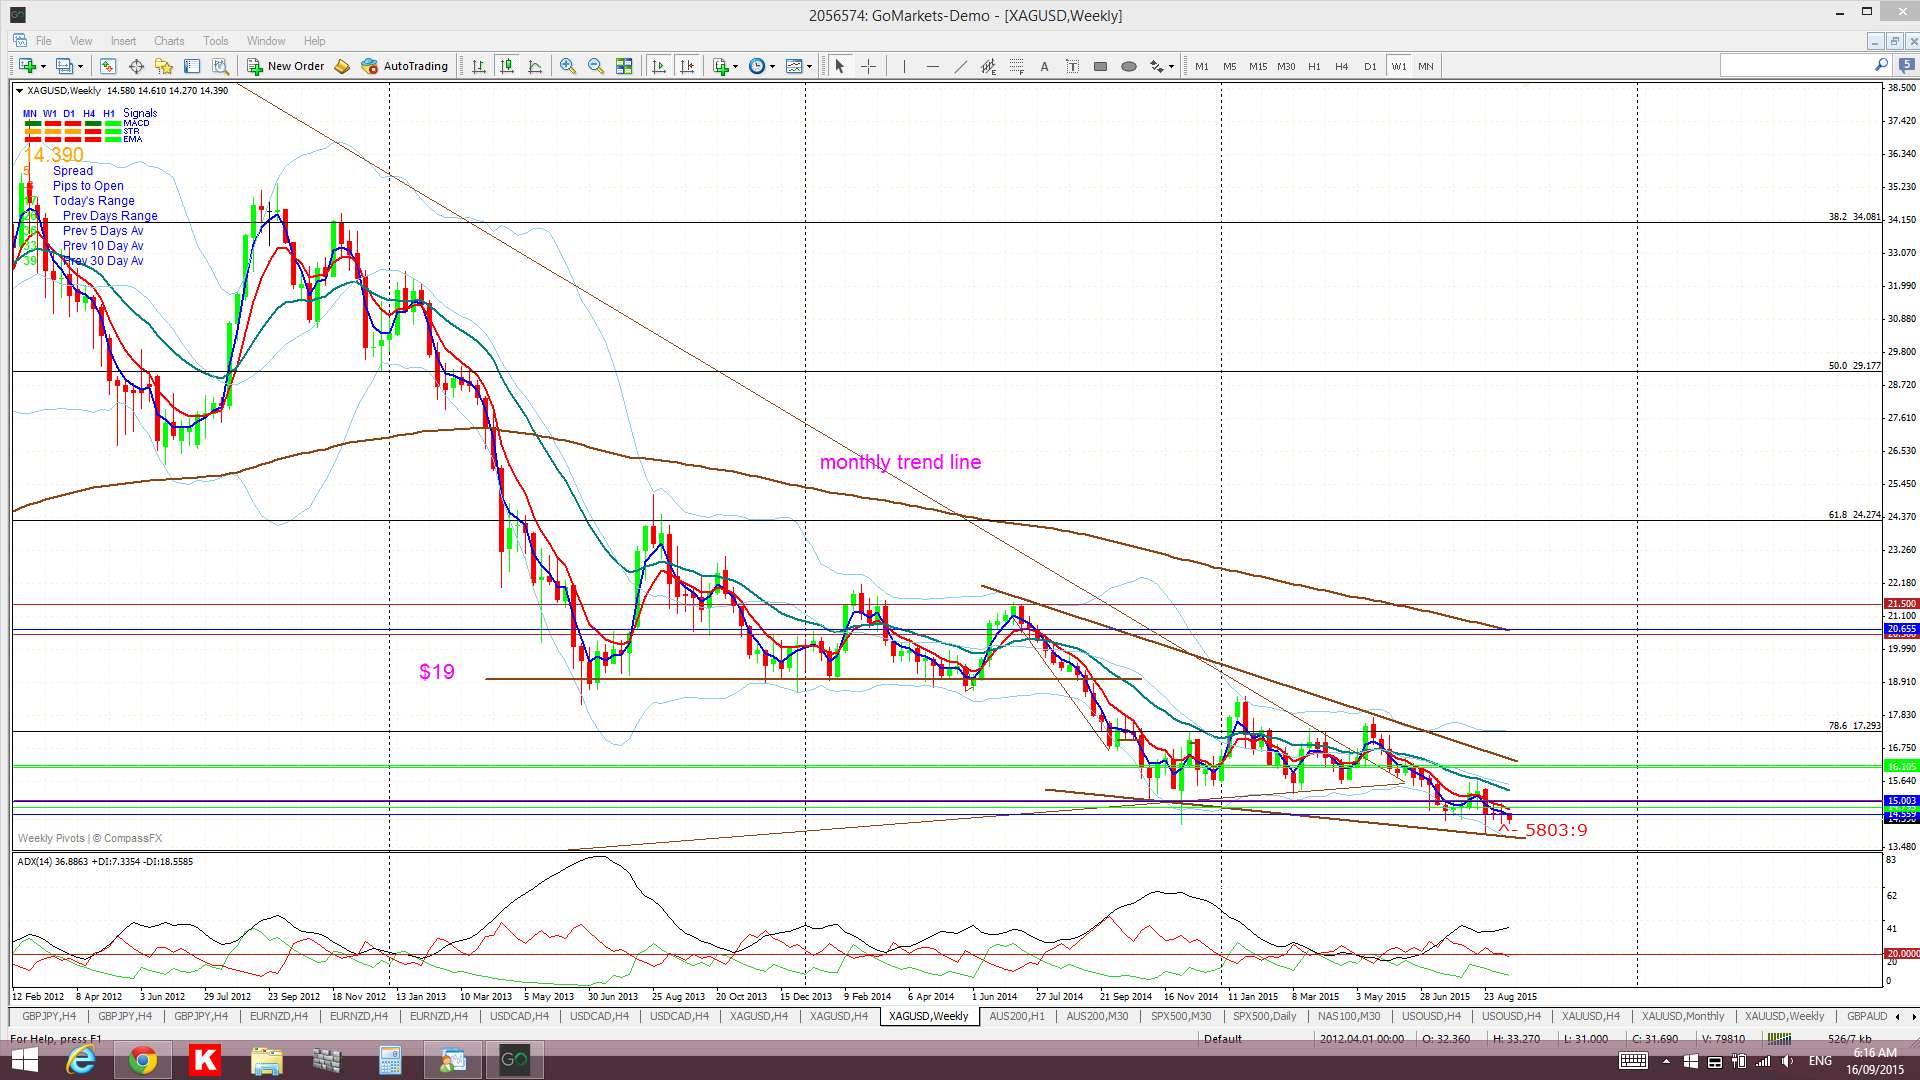
Silver weekly: watch the descending wedge trend lines:
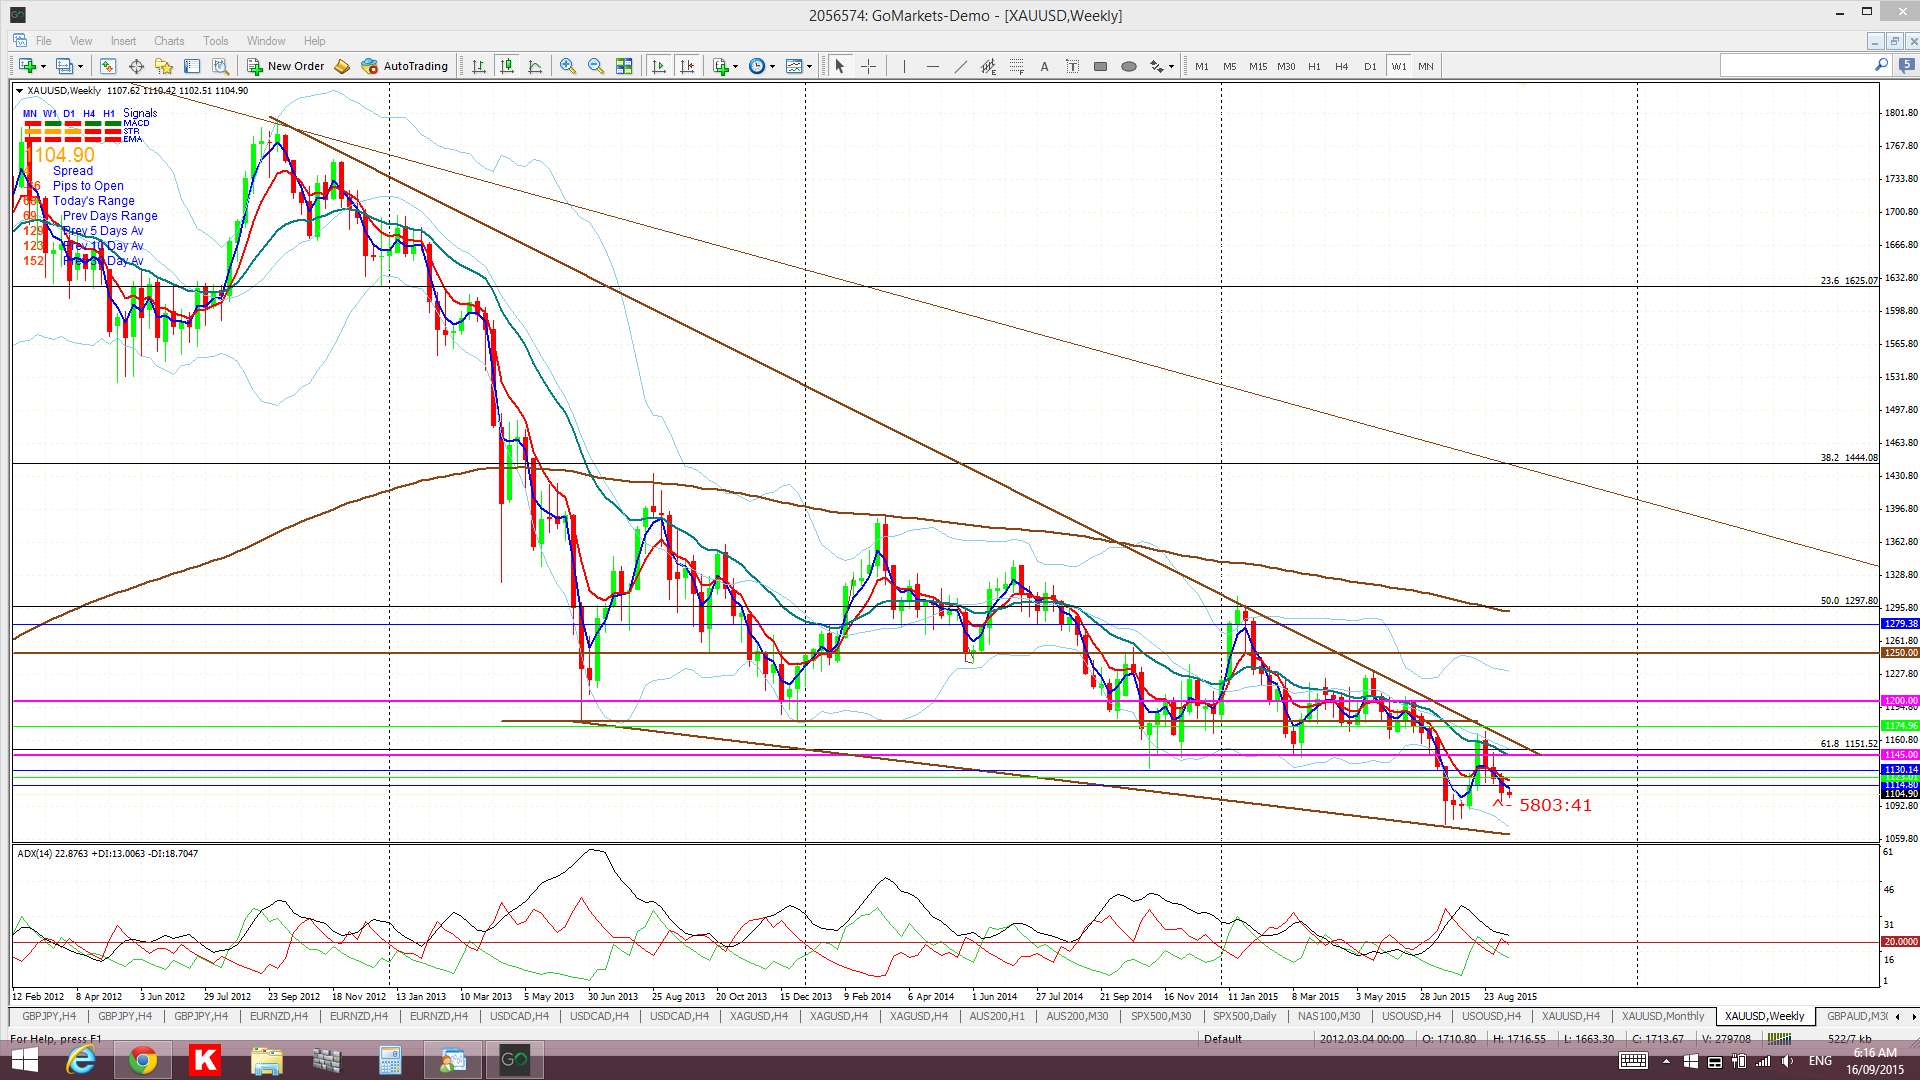
Gold weekly: ditto here:
<
p style=”text-align: justify”>
The post Technical patterns ahead of FOMC. appeared first on www.forextell.com.