Last week: was another great week for trading momentum-based trend line breakouts with the pip tally reaching over 6,800 pips. This is a rather simple strategy that involves checking charts for any consolidation-style patterns and then watching for any momentum-based trend line breakouts. Zooming in on the shorter time frame charts for early clues about breakout moves and/or bounce moves within these patterns has been productive as well. More charts are setting up with consolidation patterns for the week ahead so check them out, free of charge, here in this post!
The breakout moves from last week were summarised in previous posts here and here but this is the final pip tally:
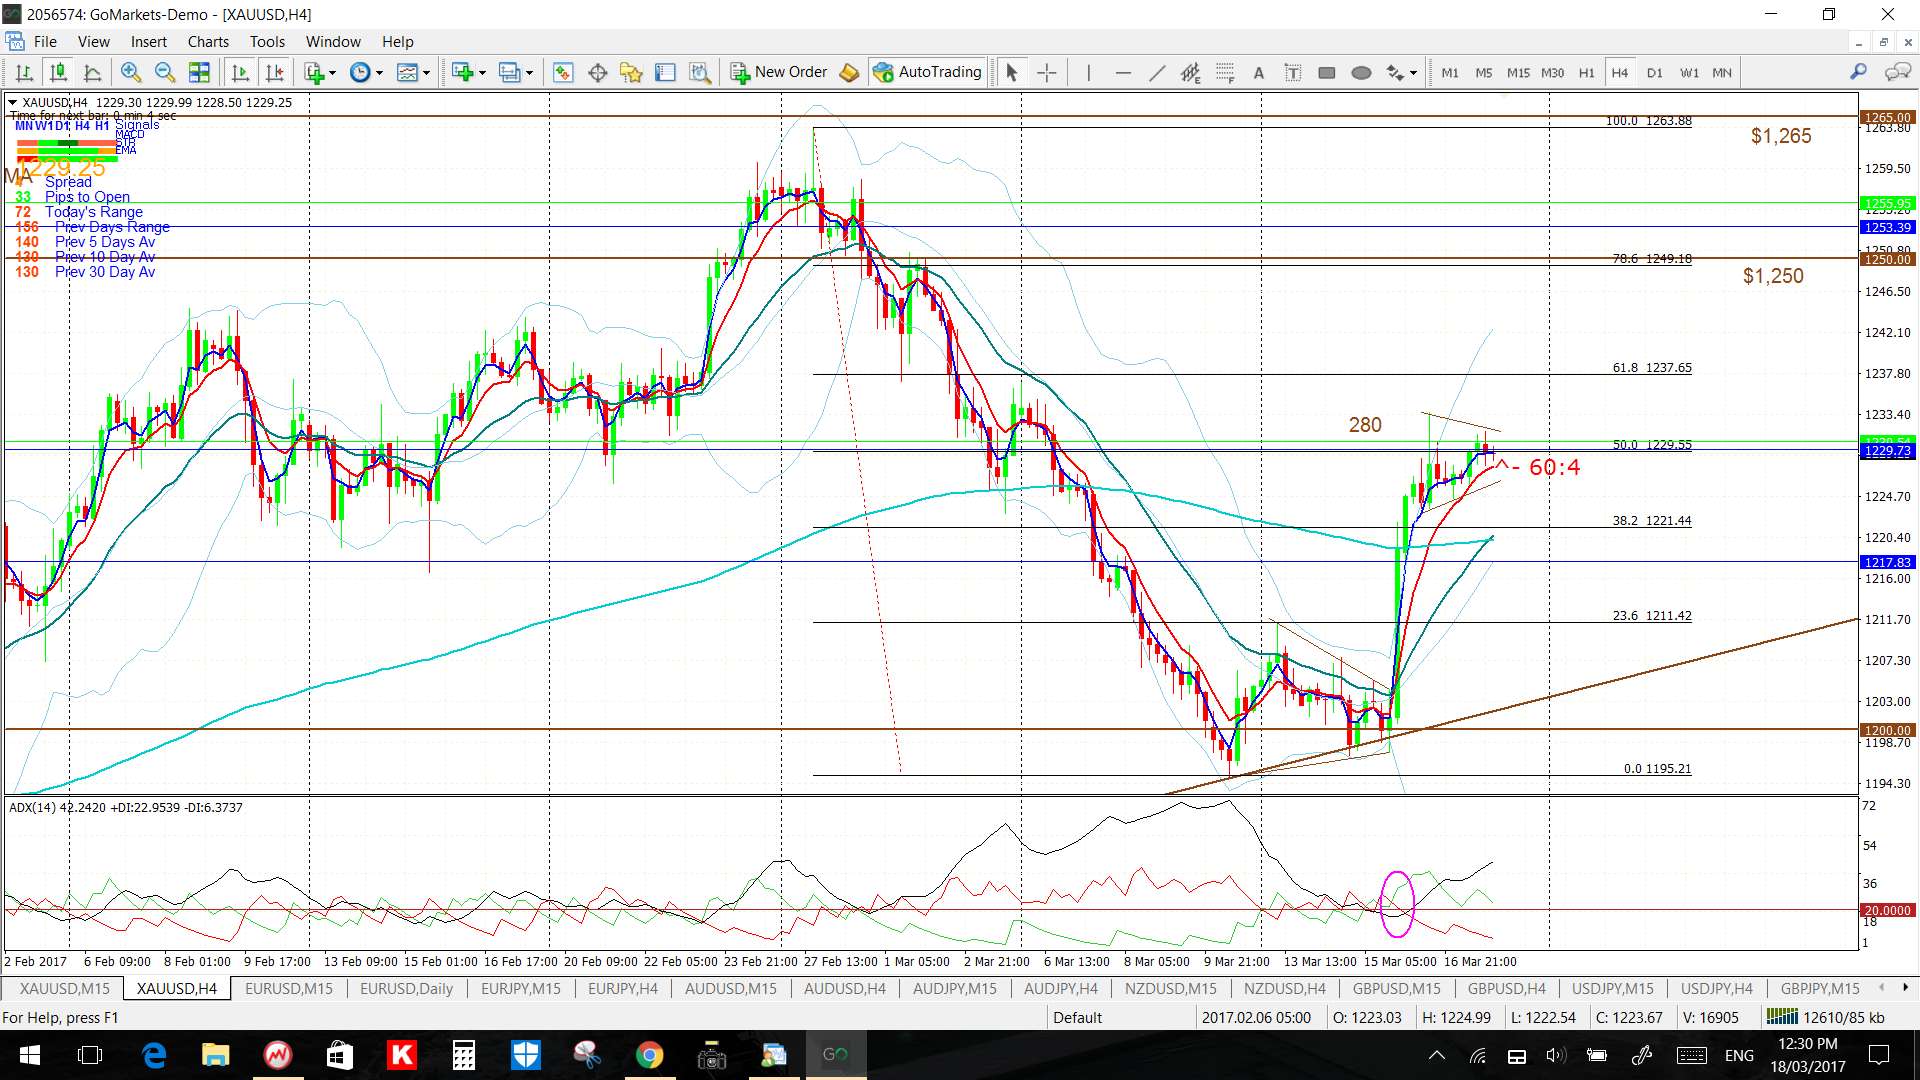
- Gold: 280 pips.
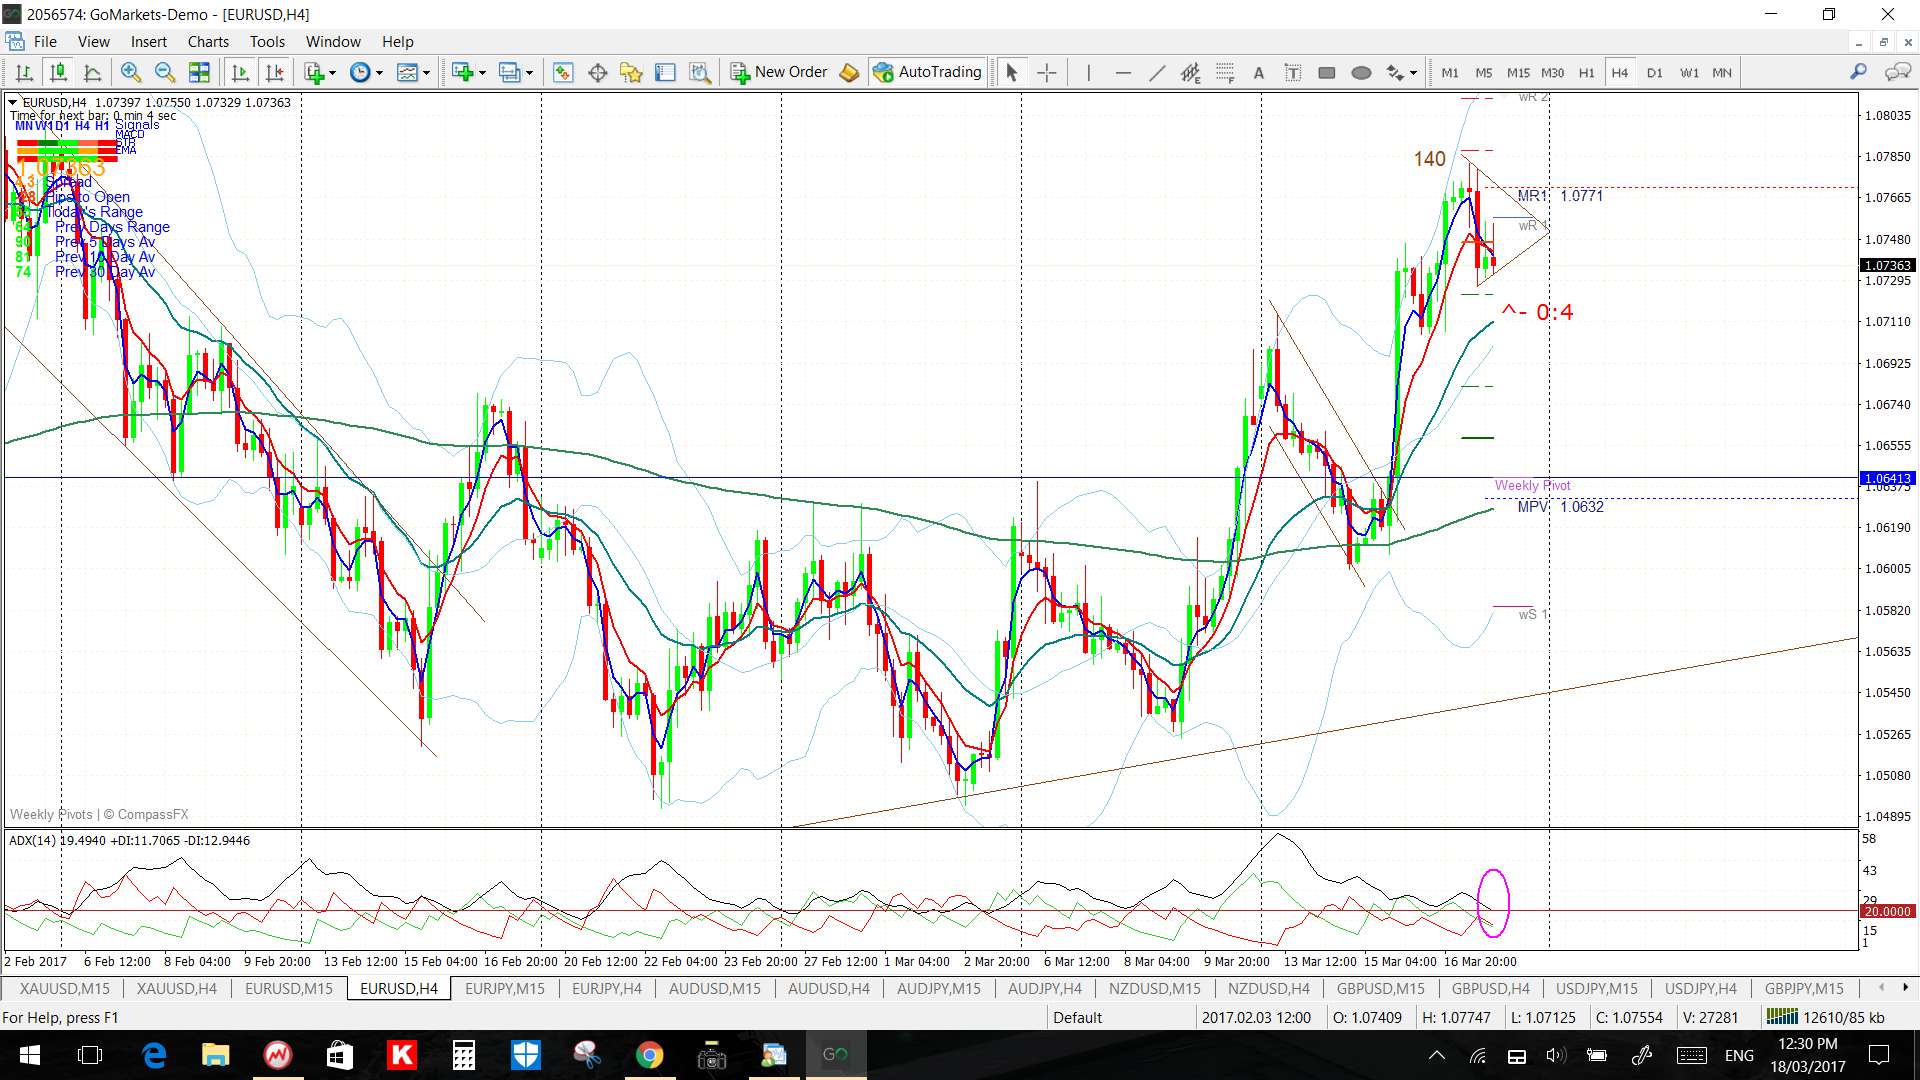
- EUR/USD: 140 pips.
- AUD/USD: 150 pips.
- AUD/JPY: 40 pips .
- GBP/USD: 240 pips.
- USD/CAD: 130 pips.
- GBP/AUD: 80 pips.
- EUR/AUD: 100 pips.
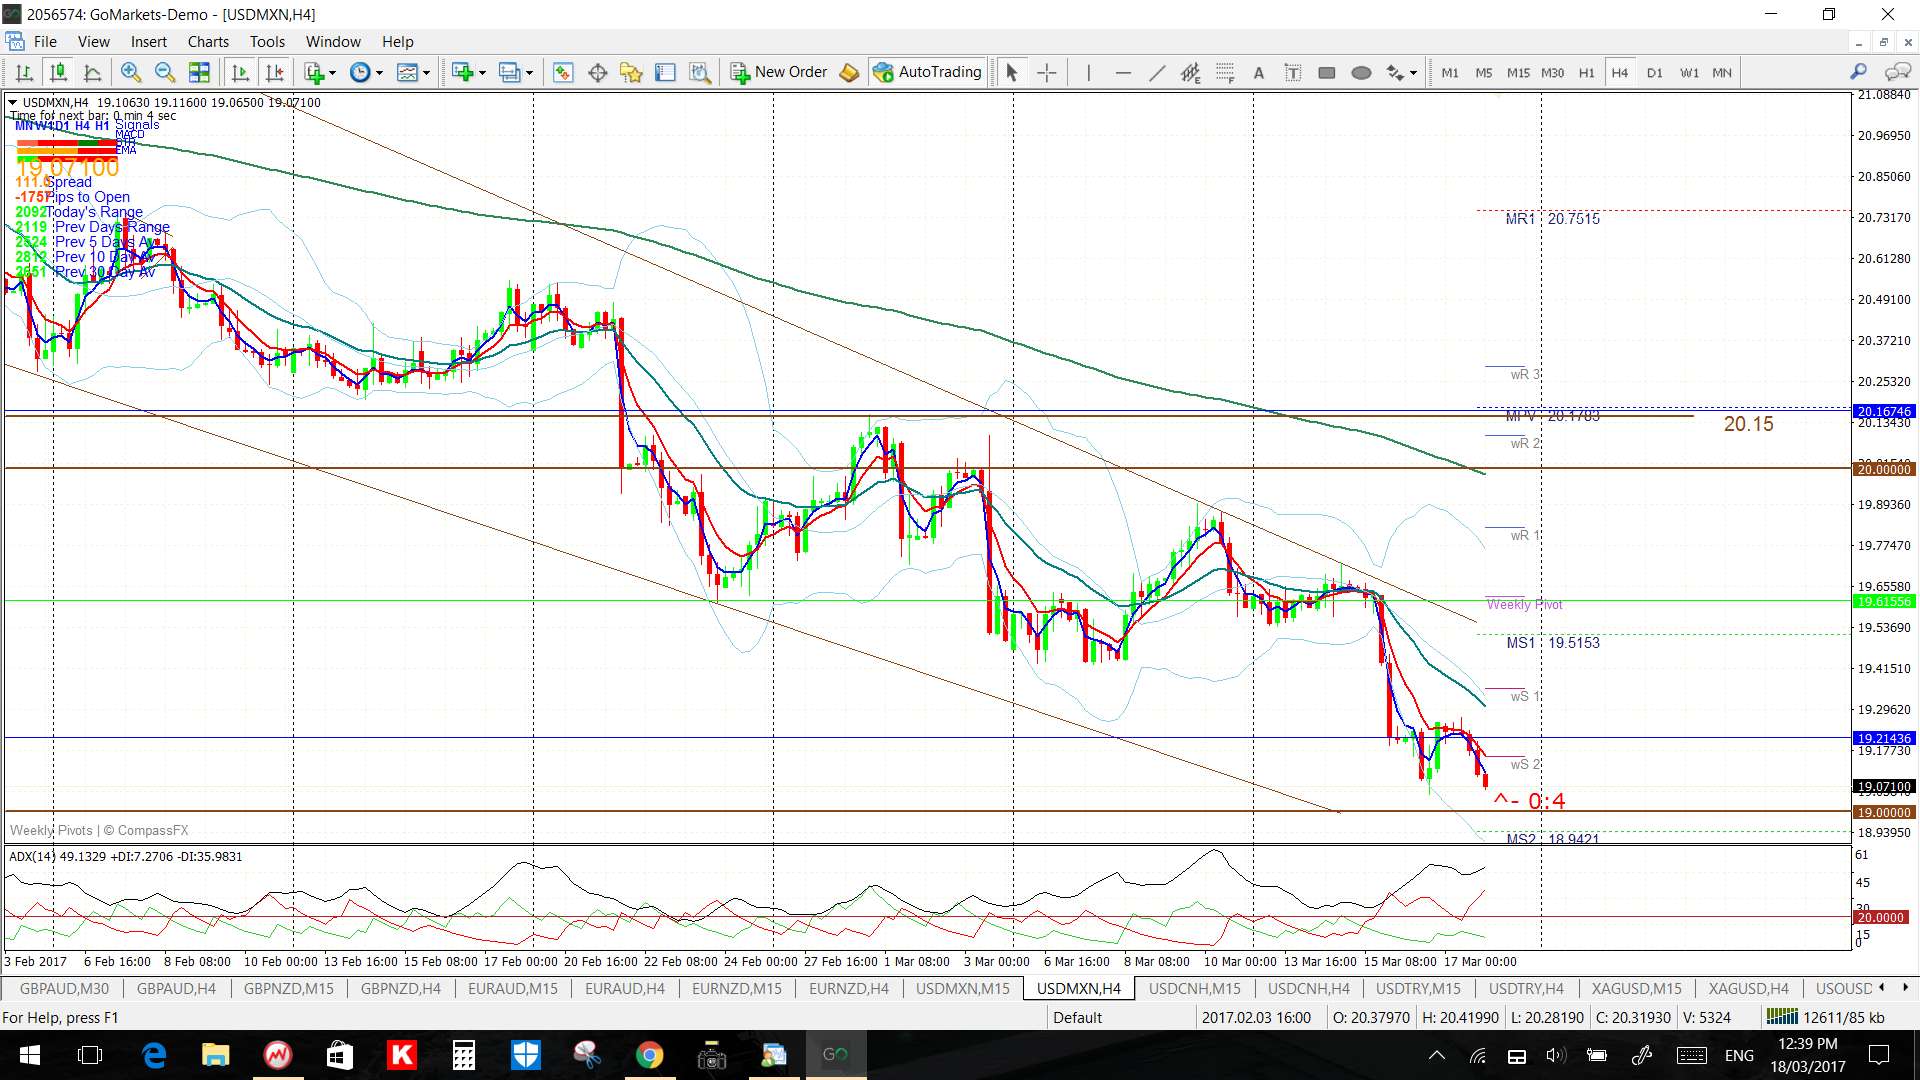
- USD/MXN: 4,000 pips off a 15 min chart b/o move.
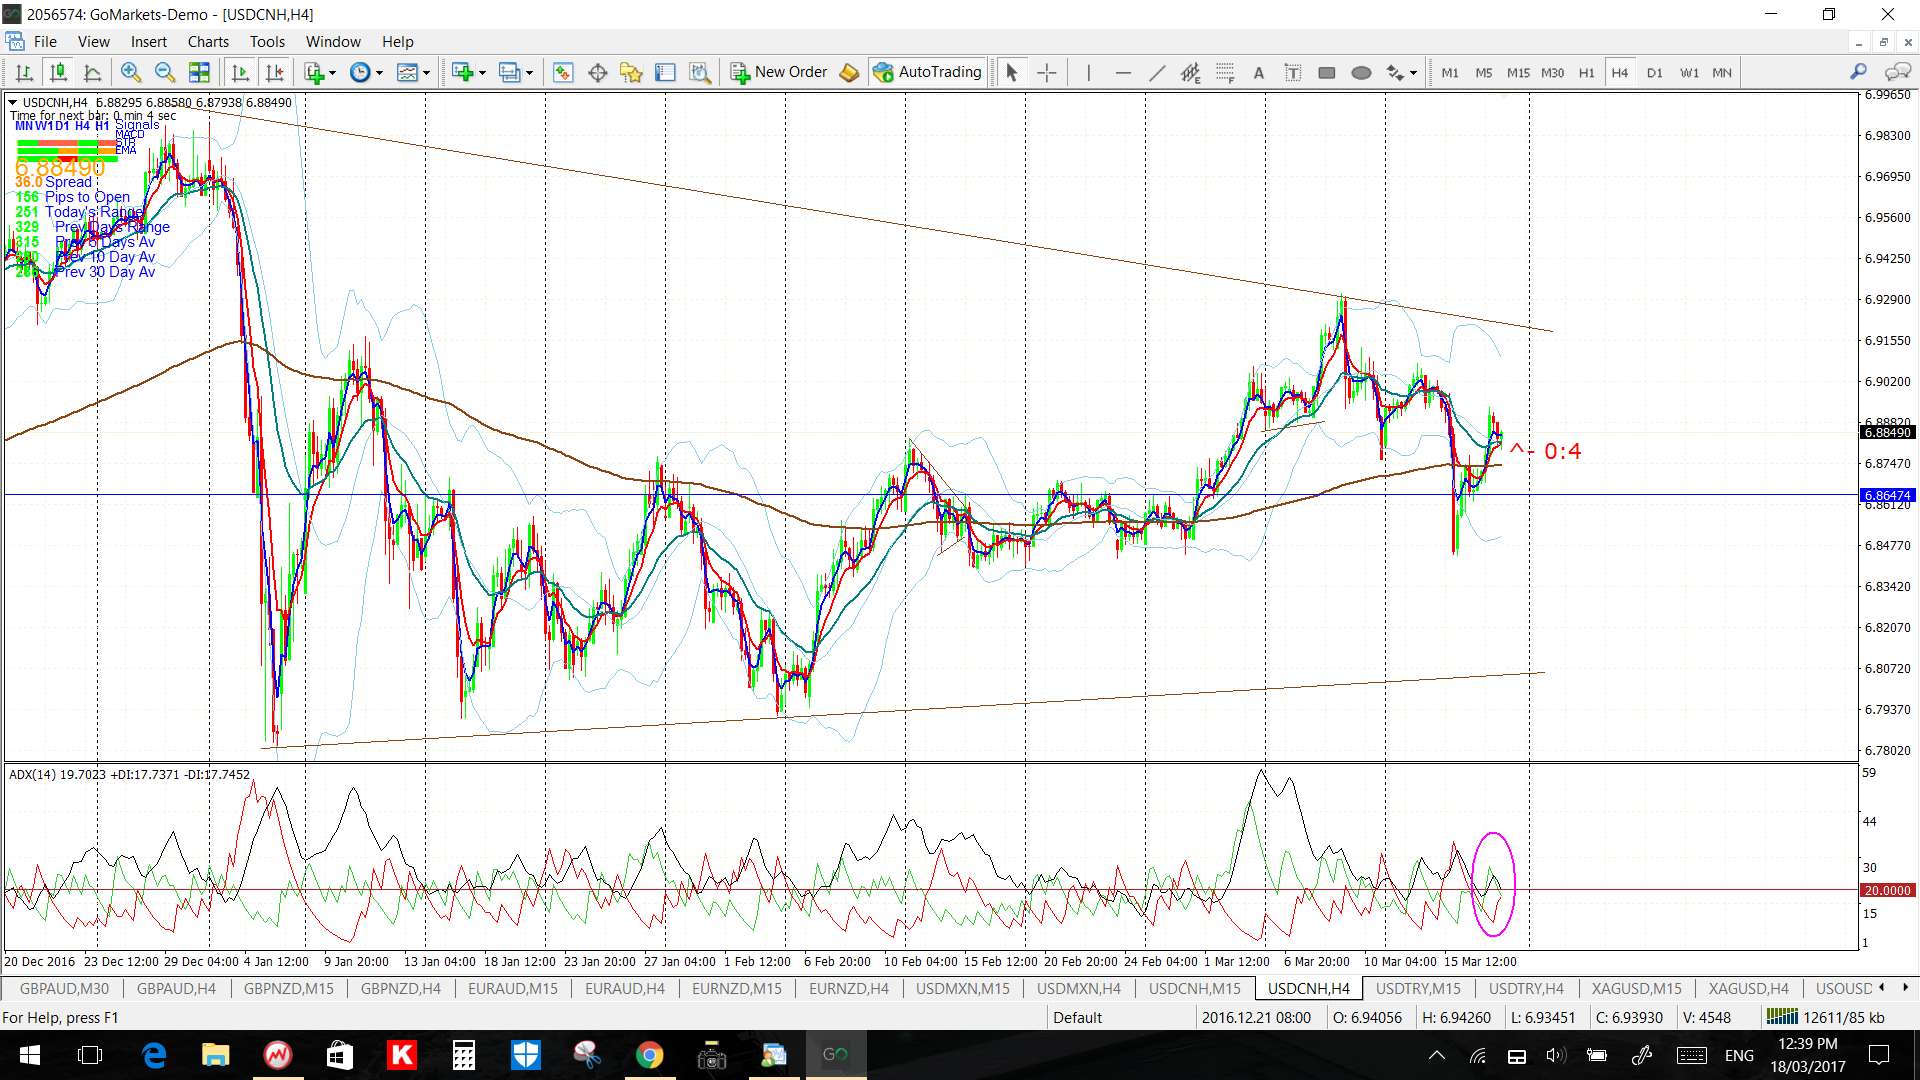
- USD/CNH: 550 pips off a 15 min chart b/o move.
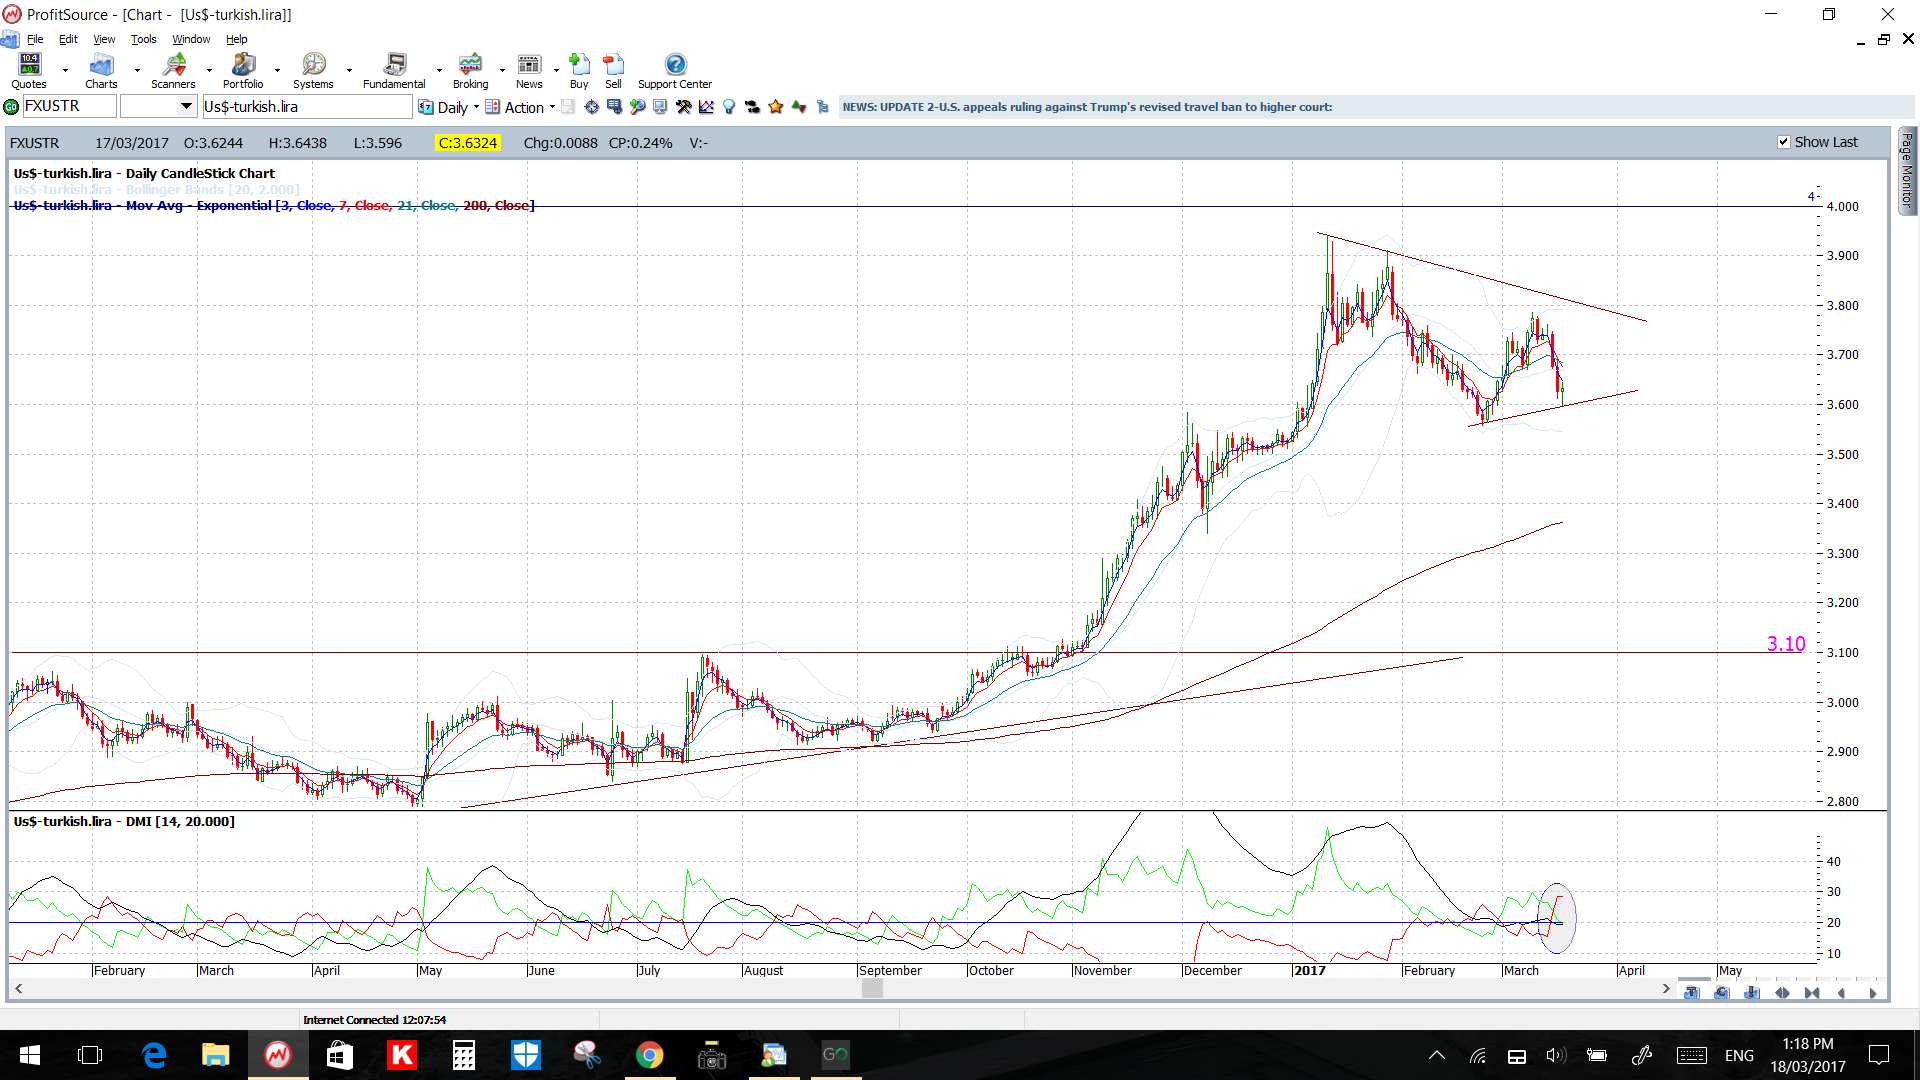
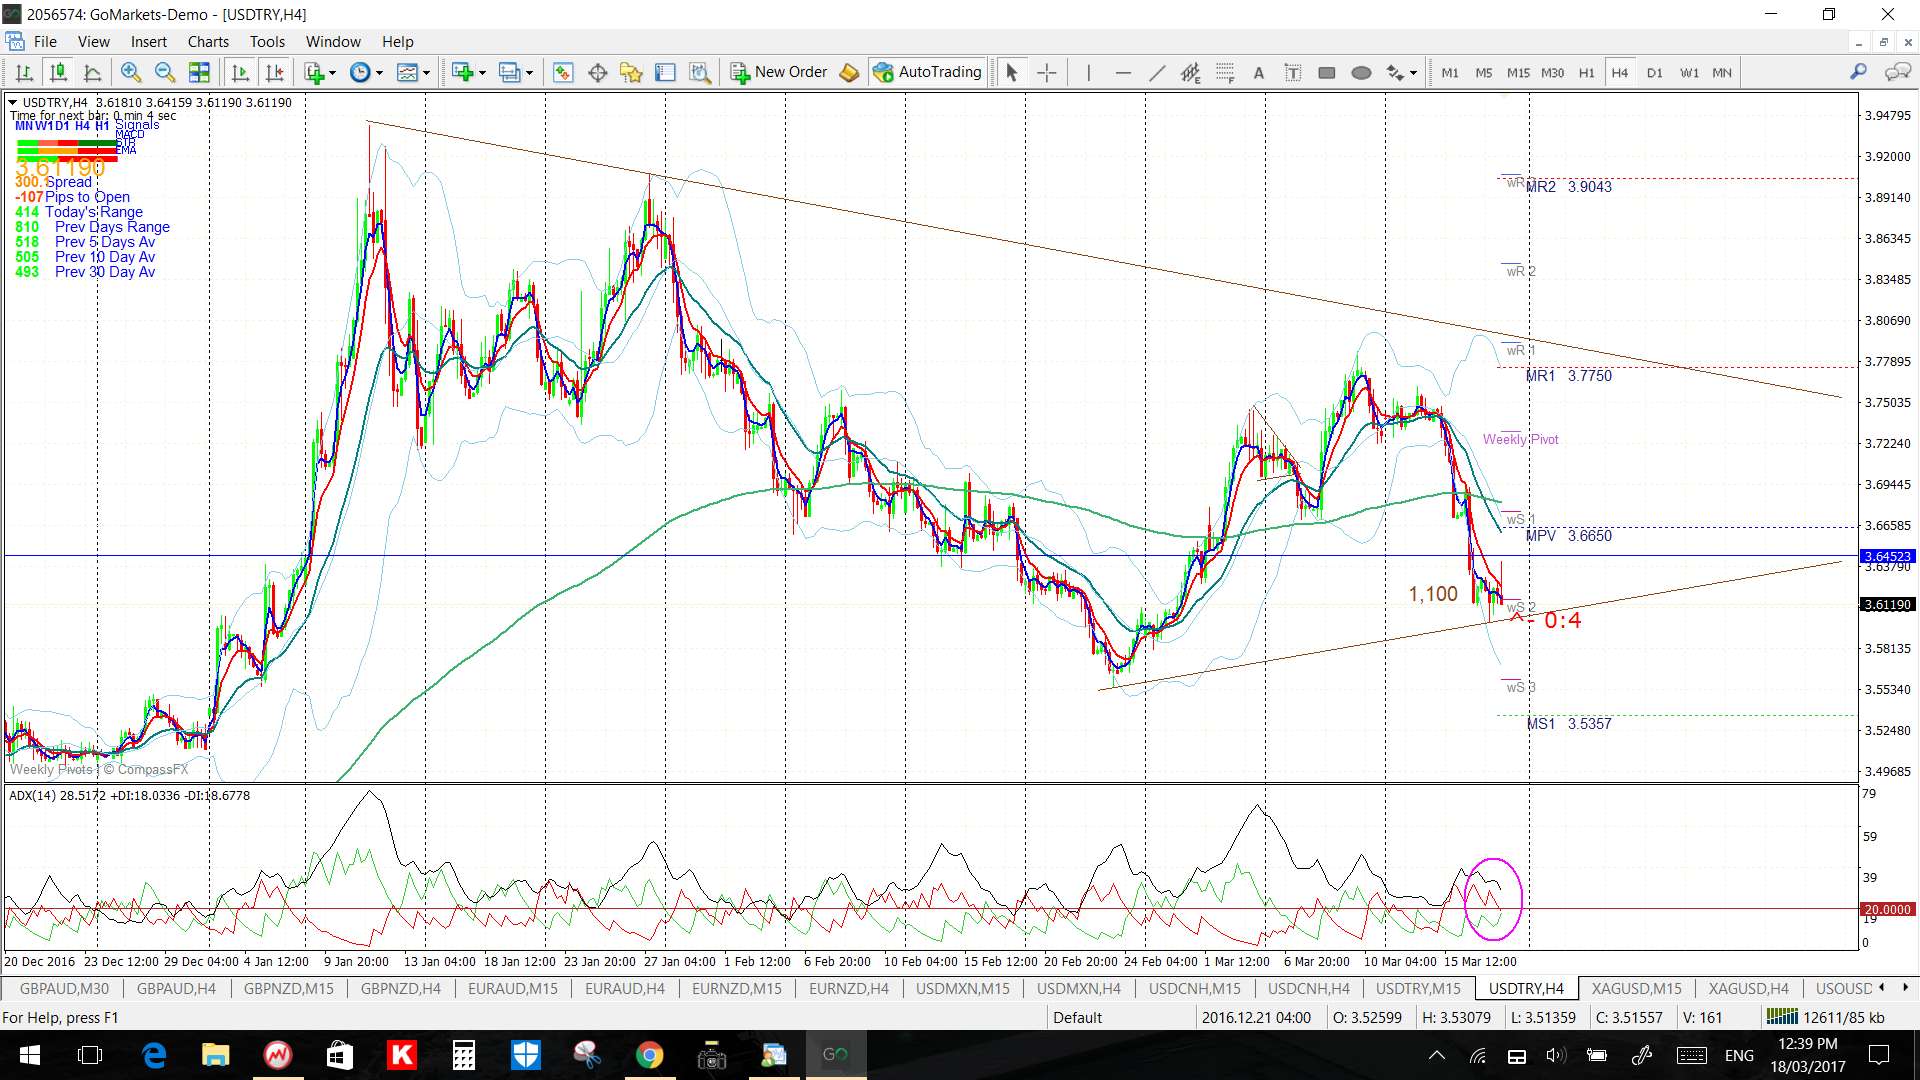
- USD/TRY: 1,100 pips.
There were also breakout moves on some of the Stock indices that were summarised here but these moves have now closed off:
- S&P500: 20 points.
- DJIA: 70 points.
- DAX: 45 points.
- NASDAQ: 30 points.
This week:
- US$: the US$ index, and the EUR$ index for that matter, are both hovering above 100 support and I’m keen to see if there will be one winner of this contest . A review of the indices can be found through this link.
- Indecision candles: Doji or Spinning Top indecision-style candles were printed across the following weekly chart instruments: AUD/JPY, NZD/USD, GBP/JPY, GBP/AUD, EUR/NZD, USD/CNH, Gold, Silver, Crude Oil, ASX-200, DJIA, S&P500 and the NASDAQ-100.
- Bullish engulfing candles: whilst not all text book, bullish engulfing-style candles were printed on the weekly charts of the AUD/USD and GBP/USD.
- Bearish engulfing candles: whilst not all exactly text book, bearish engulfing-style candles were printed on the weekly charts of the USD/JPY, USD/MXN and USD/TRY.
- Central Bank: there is the RBNZ rate update this week.
- TC Trigger: a reminder about my new TC Trigger indicator with instructions for how I use this explained in the following link.
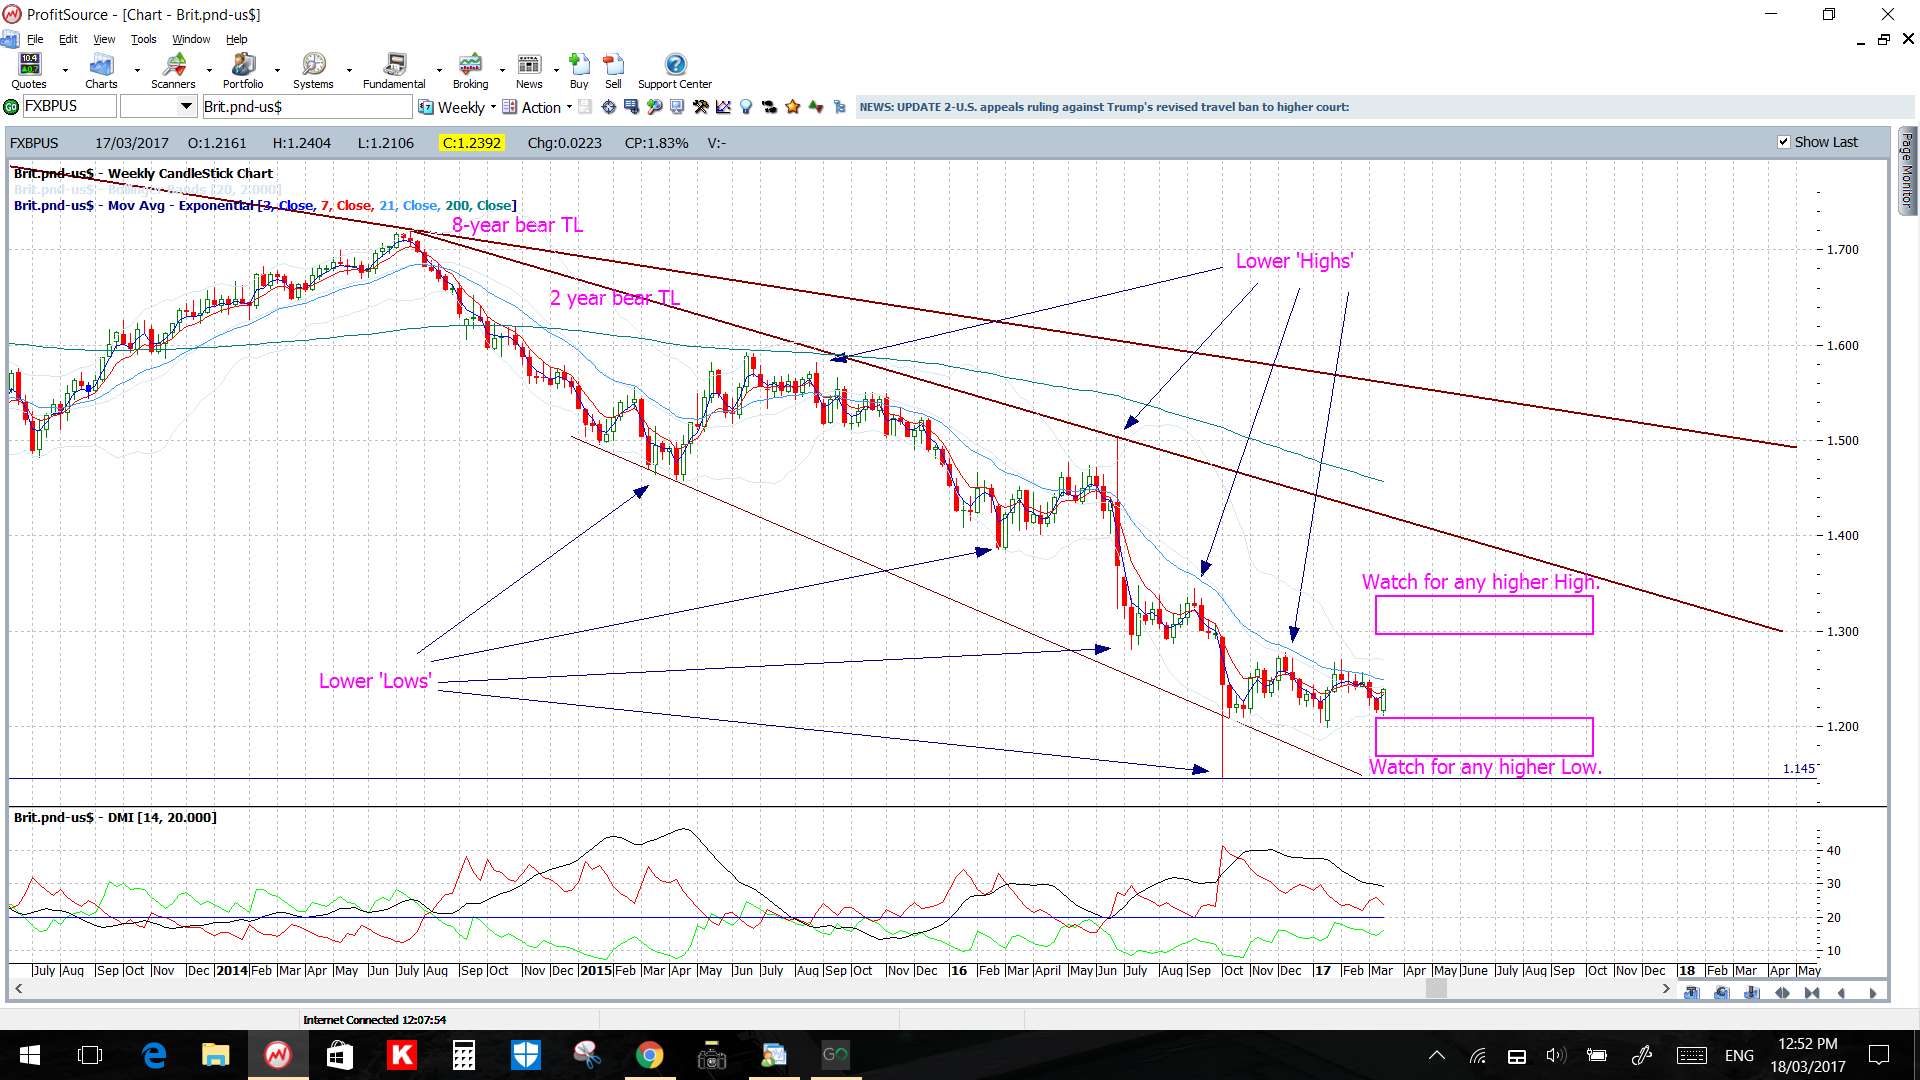
- GBP£ & Brexit: Brexit remains in the news whilst many of the GBP pairs continue to be range bound in consolidation patterns. There are some that suspect the worst may not be over for the GBP and so I’m keeping an open mind and will watch trend lines for clues about the next GBP move.
- Next w/e: is a busy one for me so blog updates may not be posted until the following Monday.
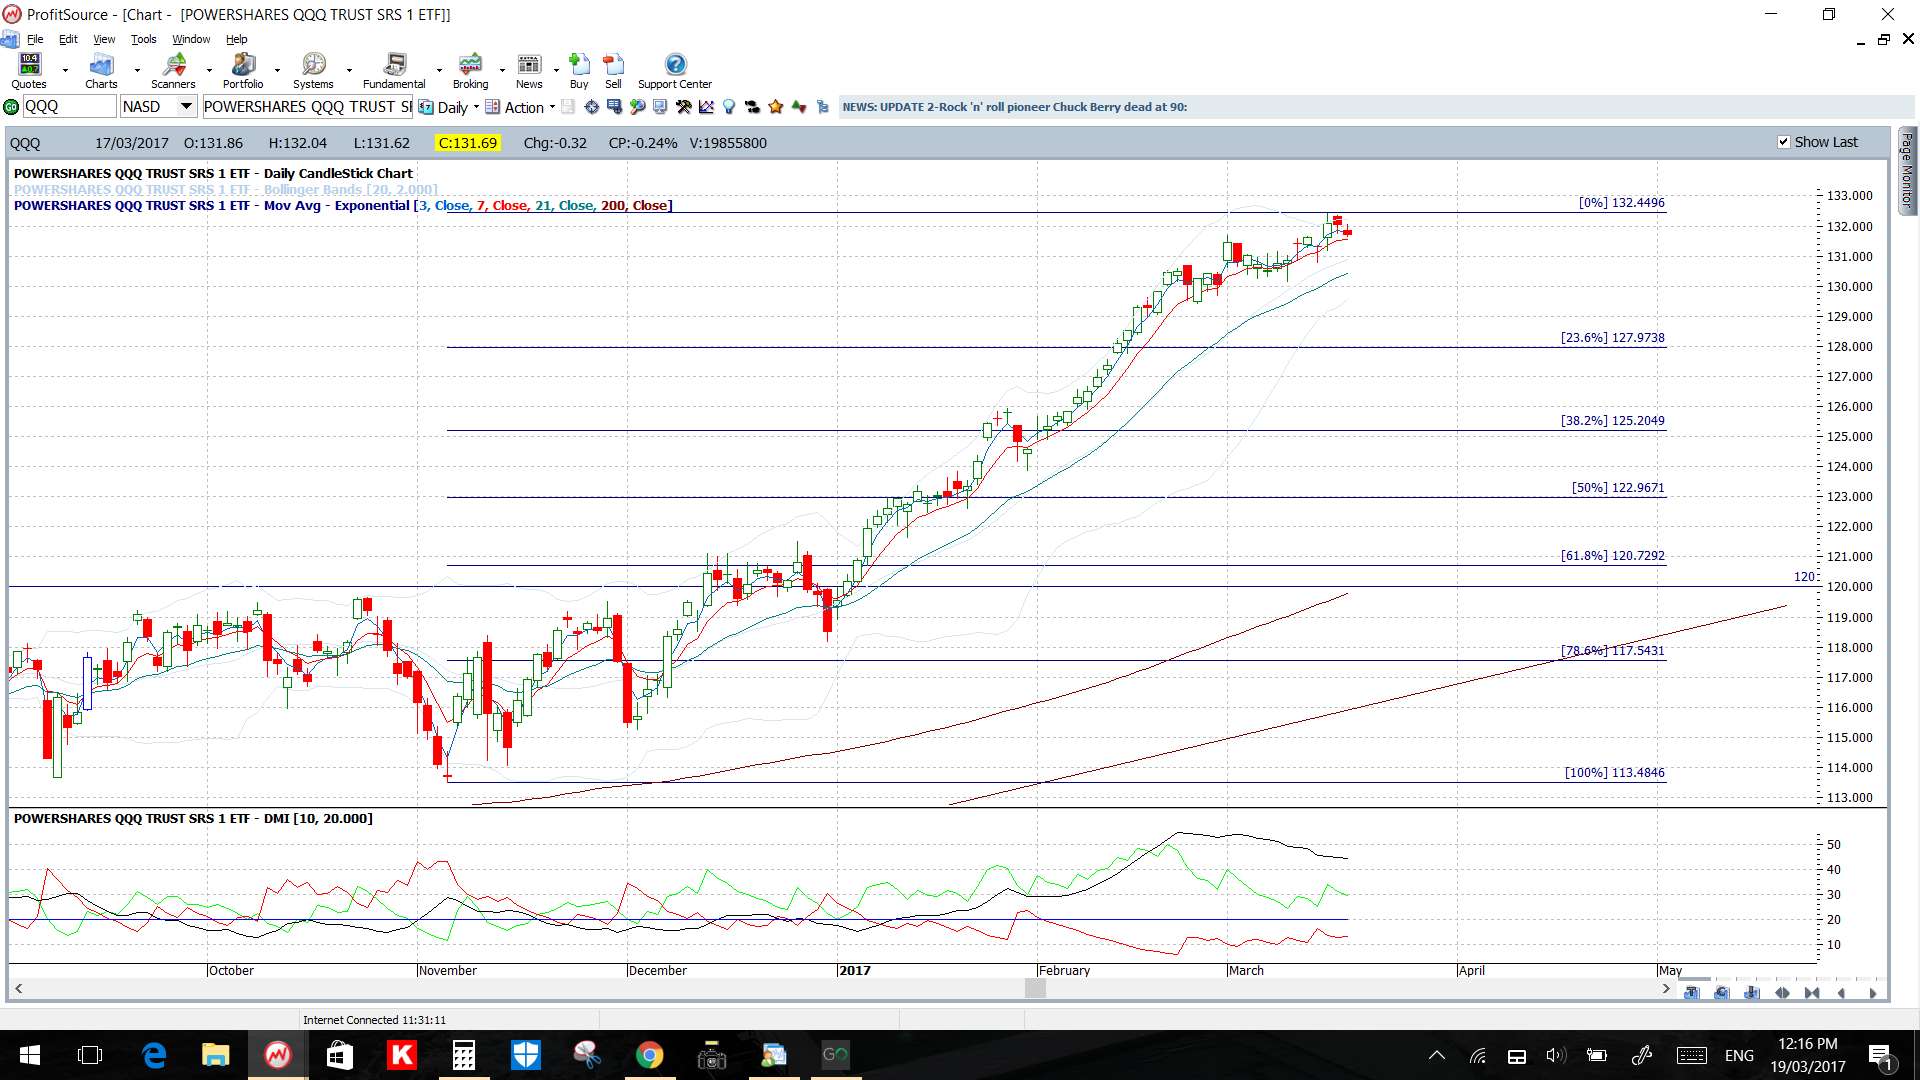
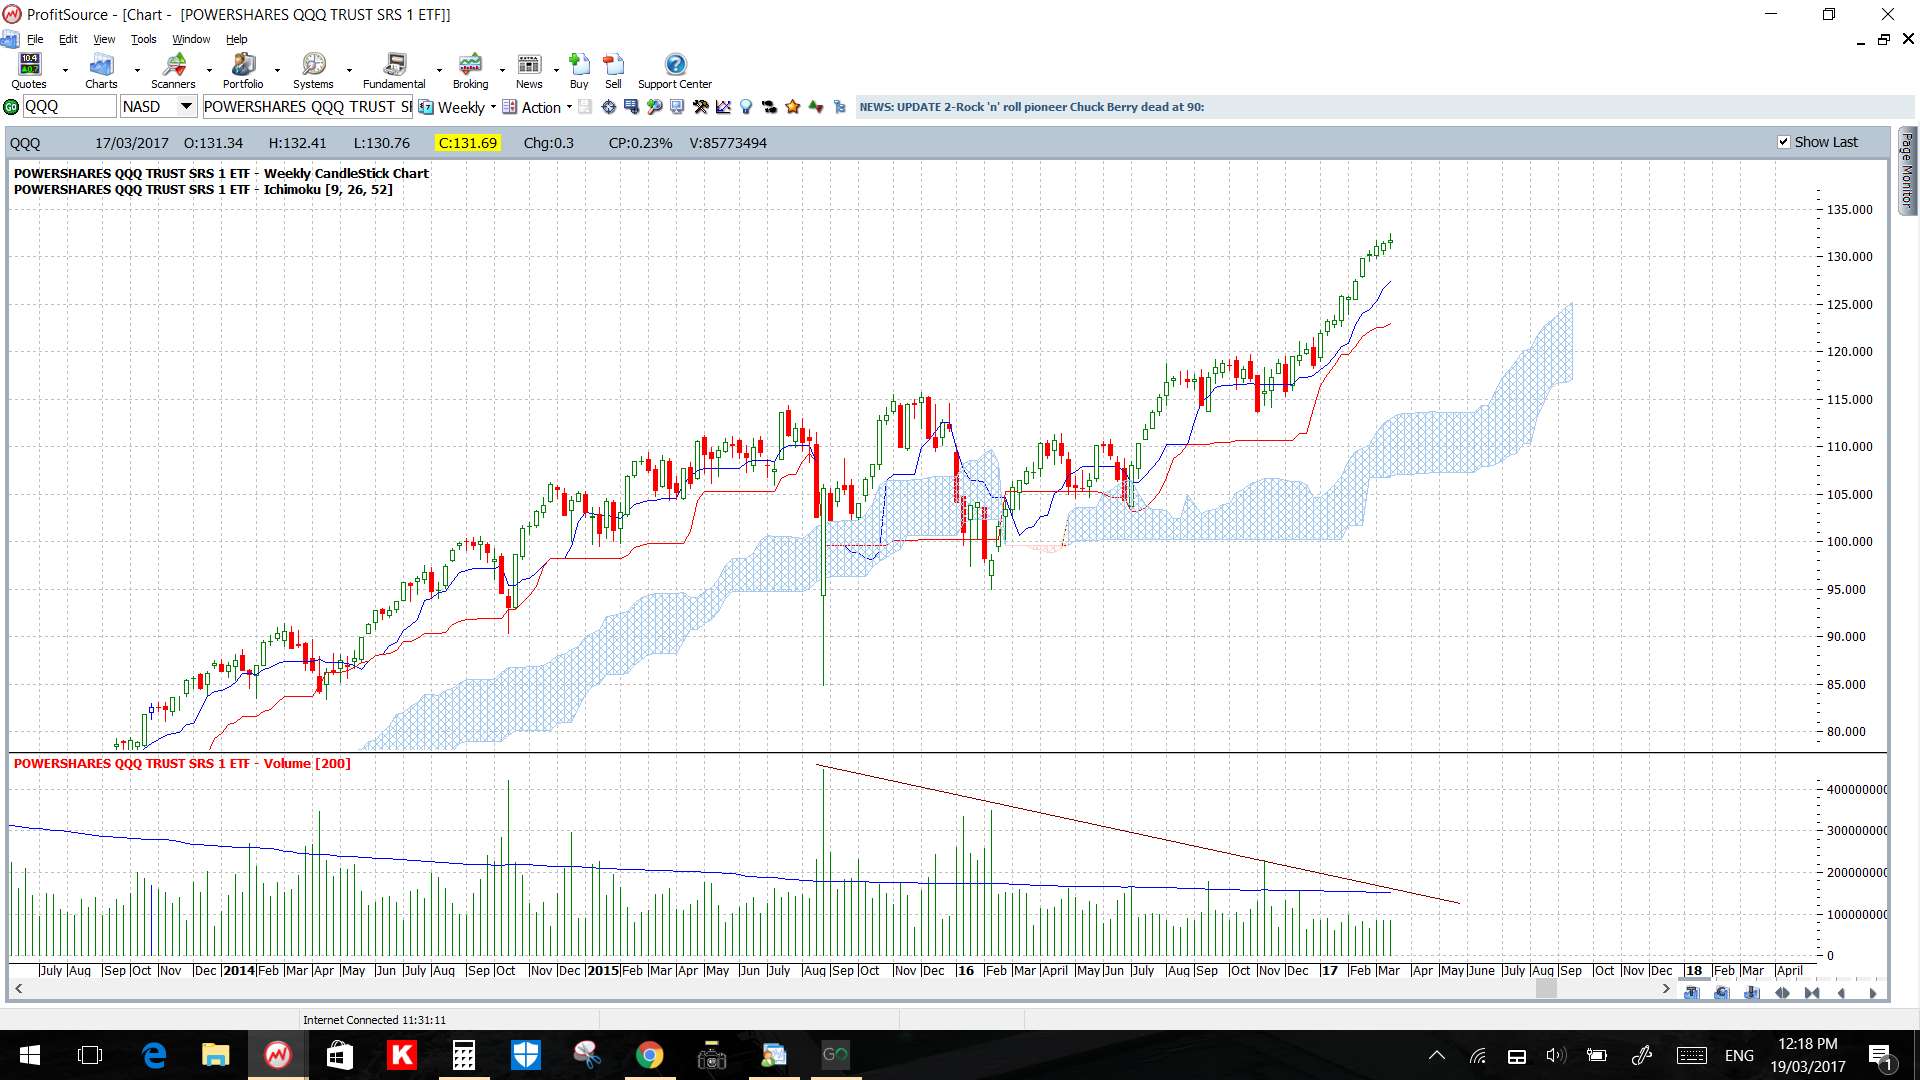
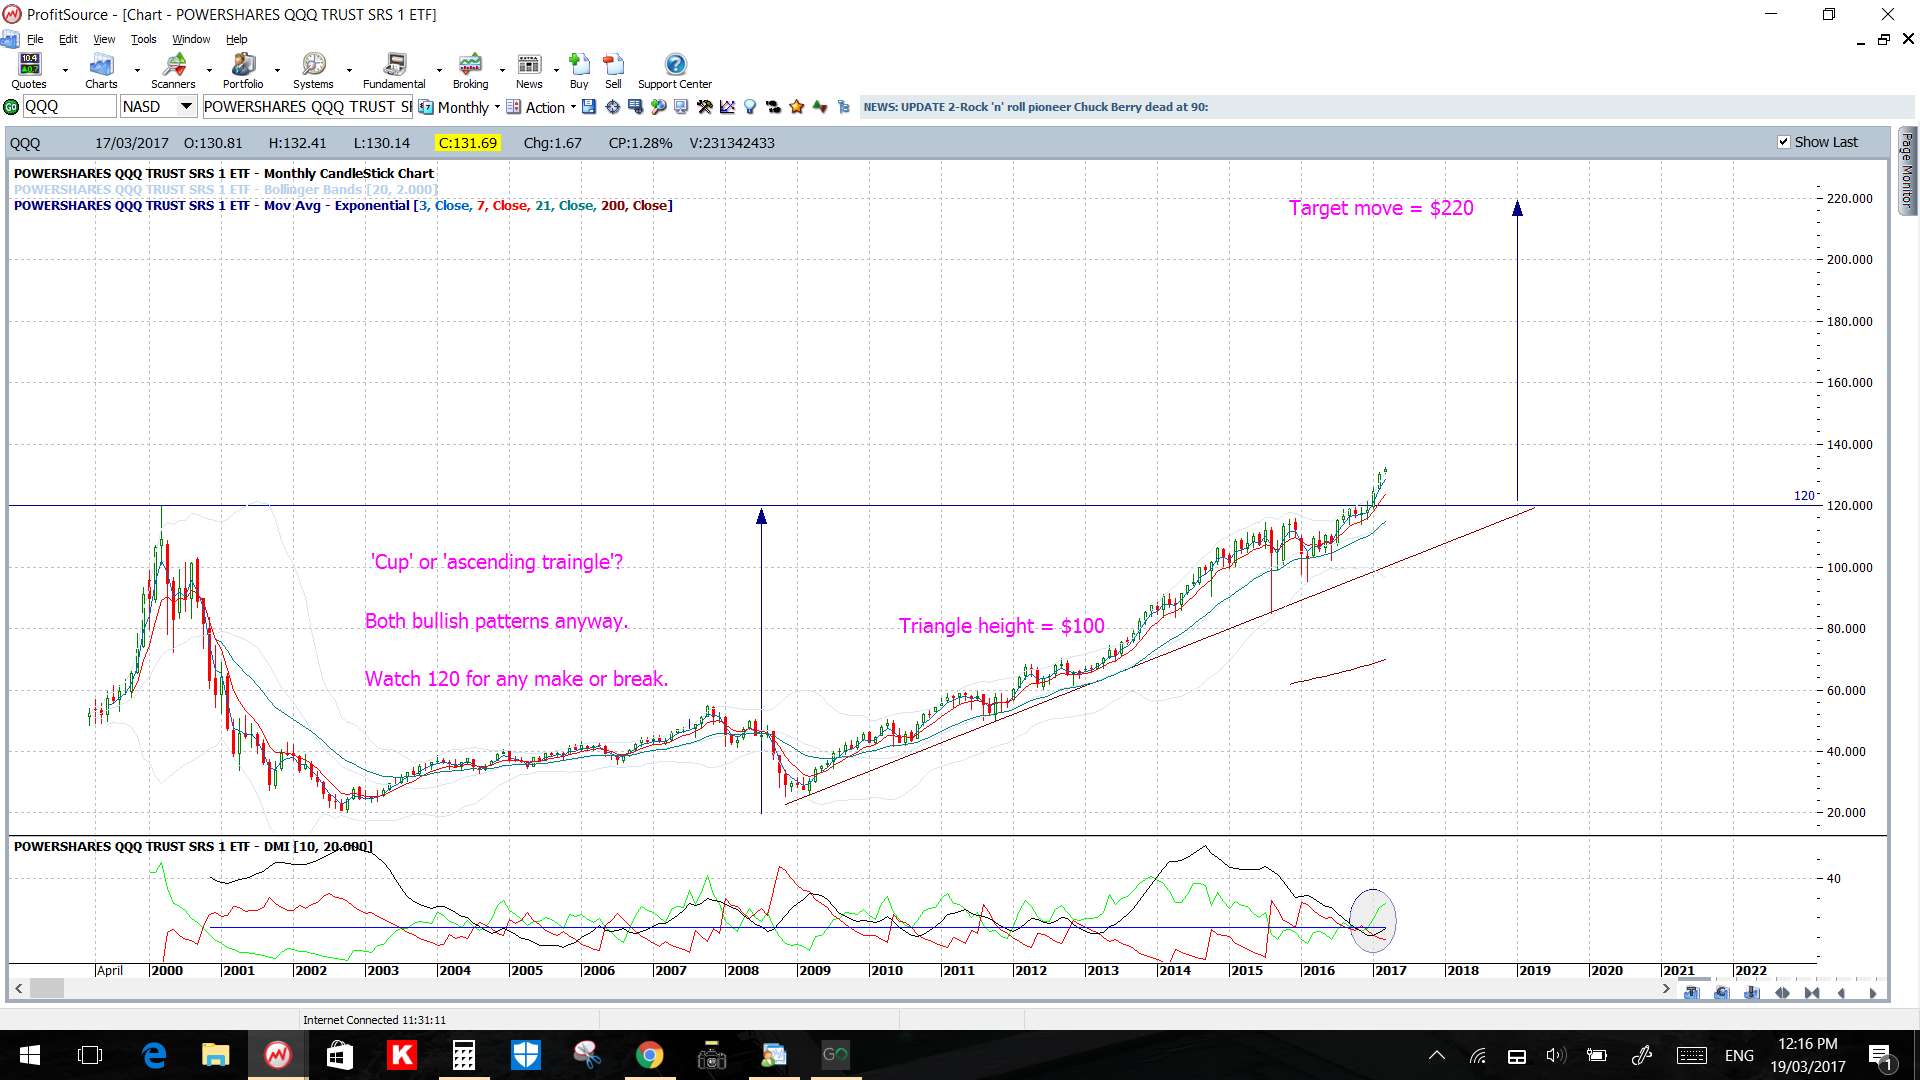
- NASDAQ & QQQ: I’ve got a few NASDAQ stocks in my portfolio but will be watching for any pullback here. I note the QQQ, the NASDAQ-100 ETF, might be a bit extended and some mean reversion back to the 120 breakout level and top of weekly Cloud would not surprise. I also note that the 61.8% fib is back near the breakout 120 level for added confluence.
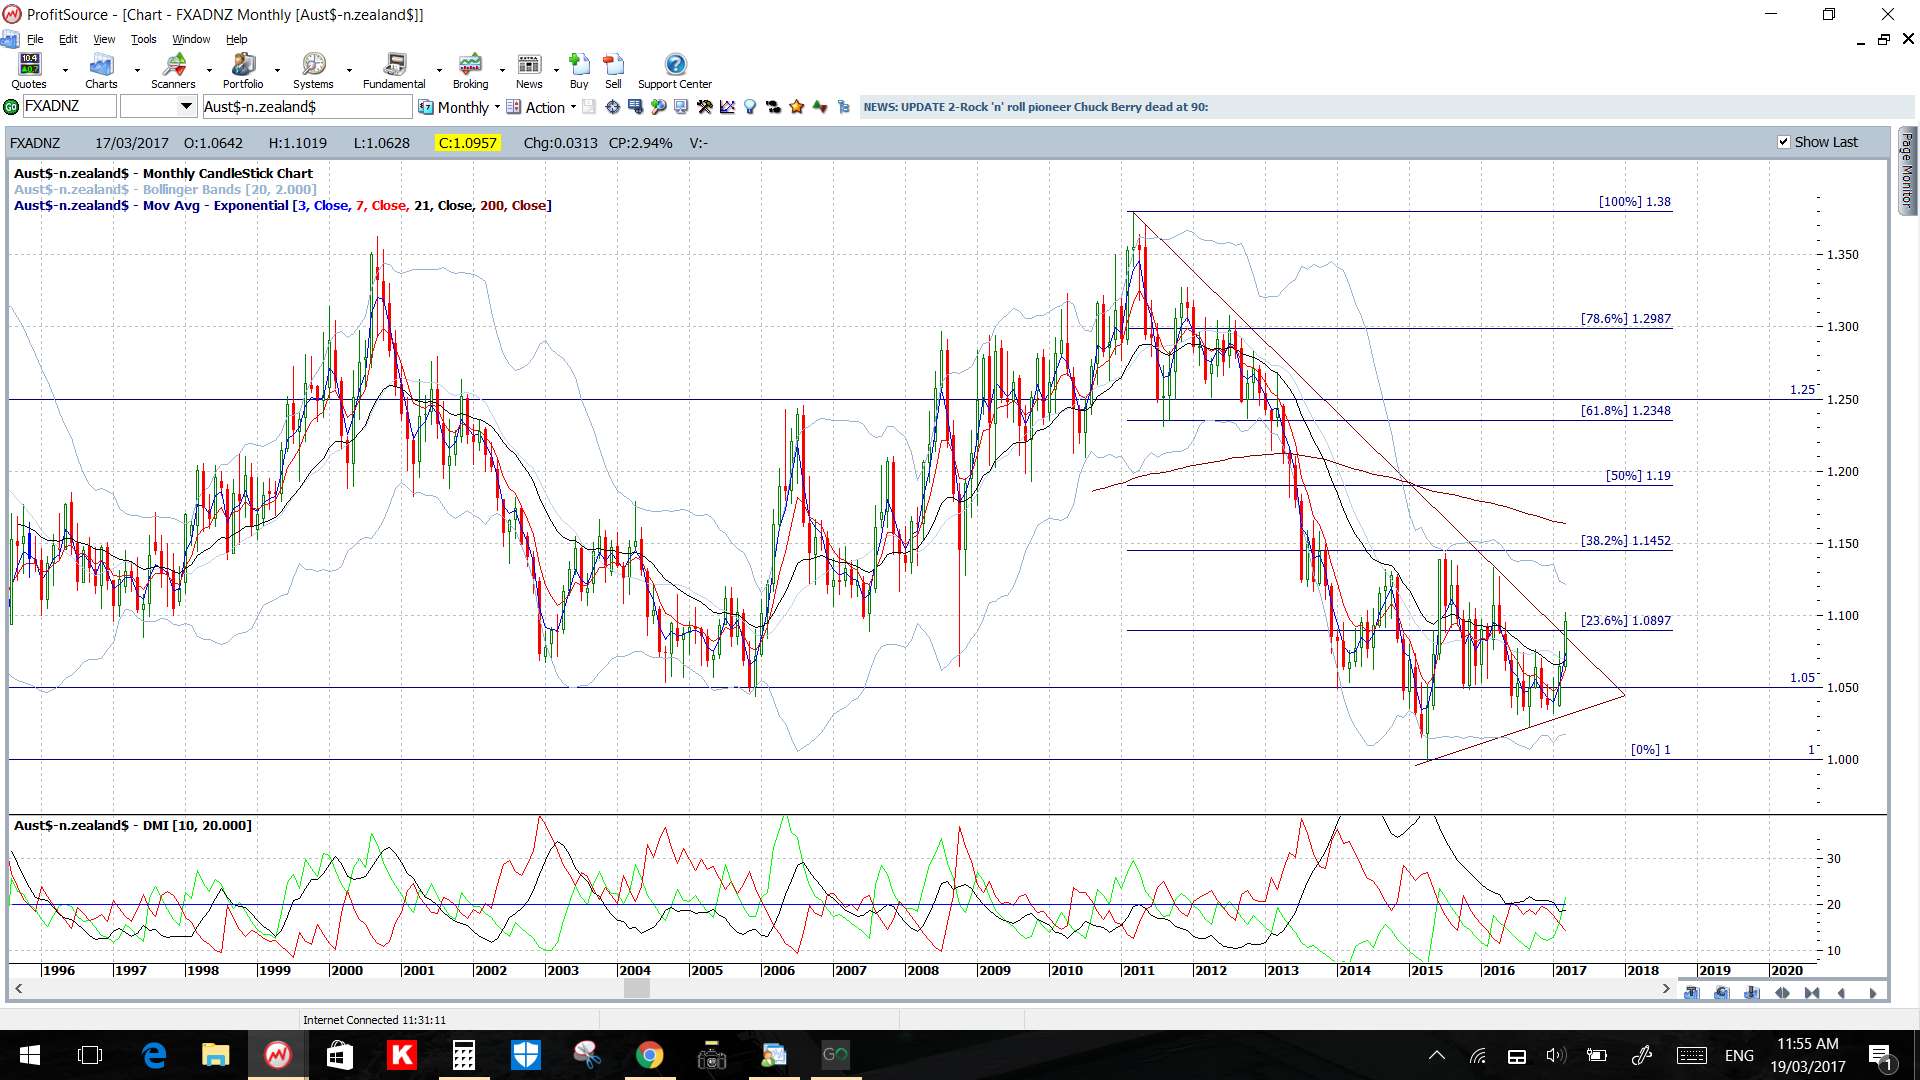
- AUD/NZD monthly: one of my preferred charts at the moment! Watch how the March candle closes to see if this can hold the bullish breakout:
Calendar:
- Mon 20th: JPY Bank Holiday.
- Tue 21st: AUD Monetary Policy Meeting Minutes. GBP CPI. CAD Core Retail Sales. NZD GDT Price Index.
- Wed 22nd: USD Crude Oil Inventories.
- Thurs 23rd: RBNZ Rate update. GBP Retail Sales. USd Fed Chair Yellen speech & Weekly Unemployment Claims.
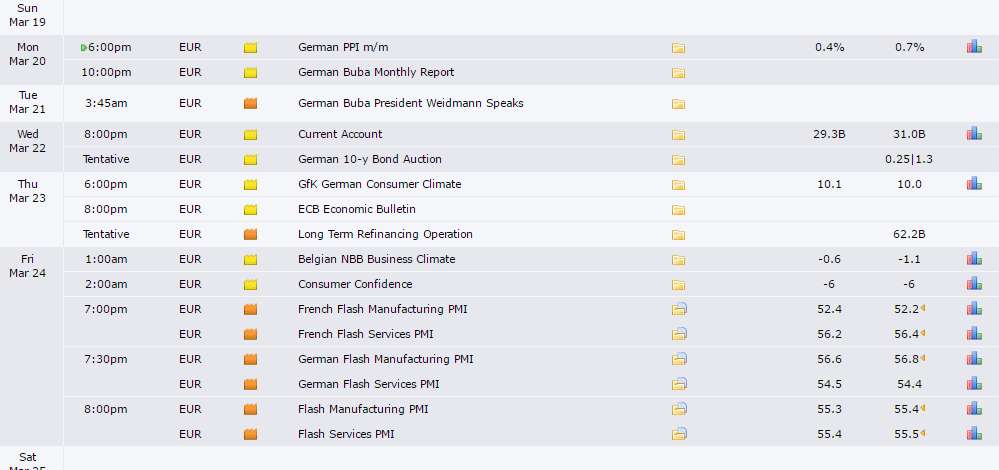
- Fri 24th: EUR lots of PMIs. CAD CPI. USD Core Durable Goods.
Charts:
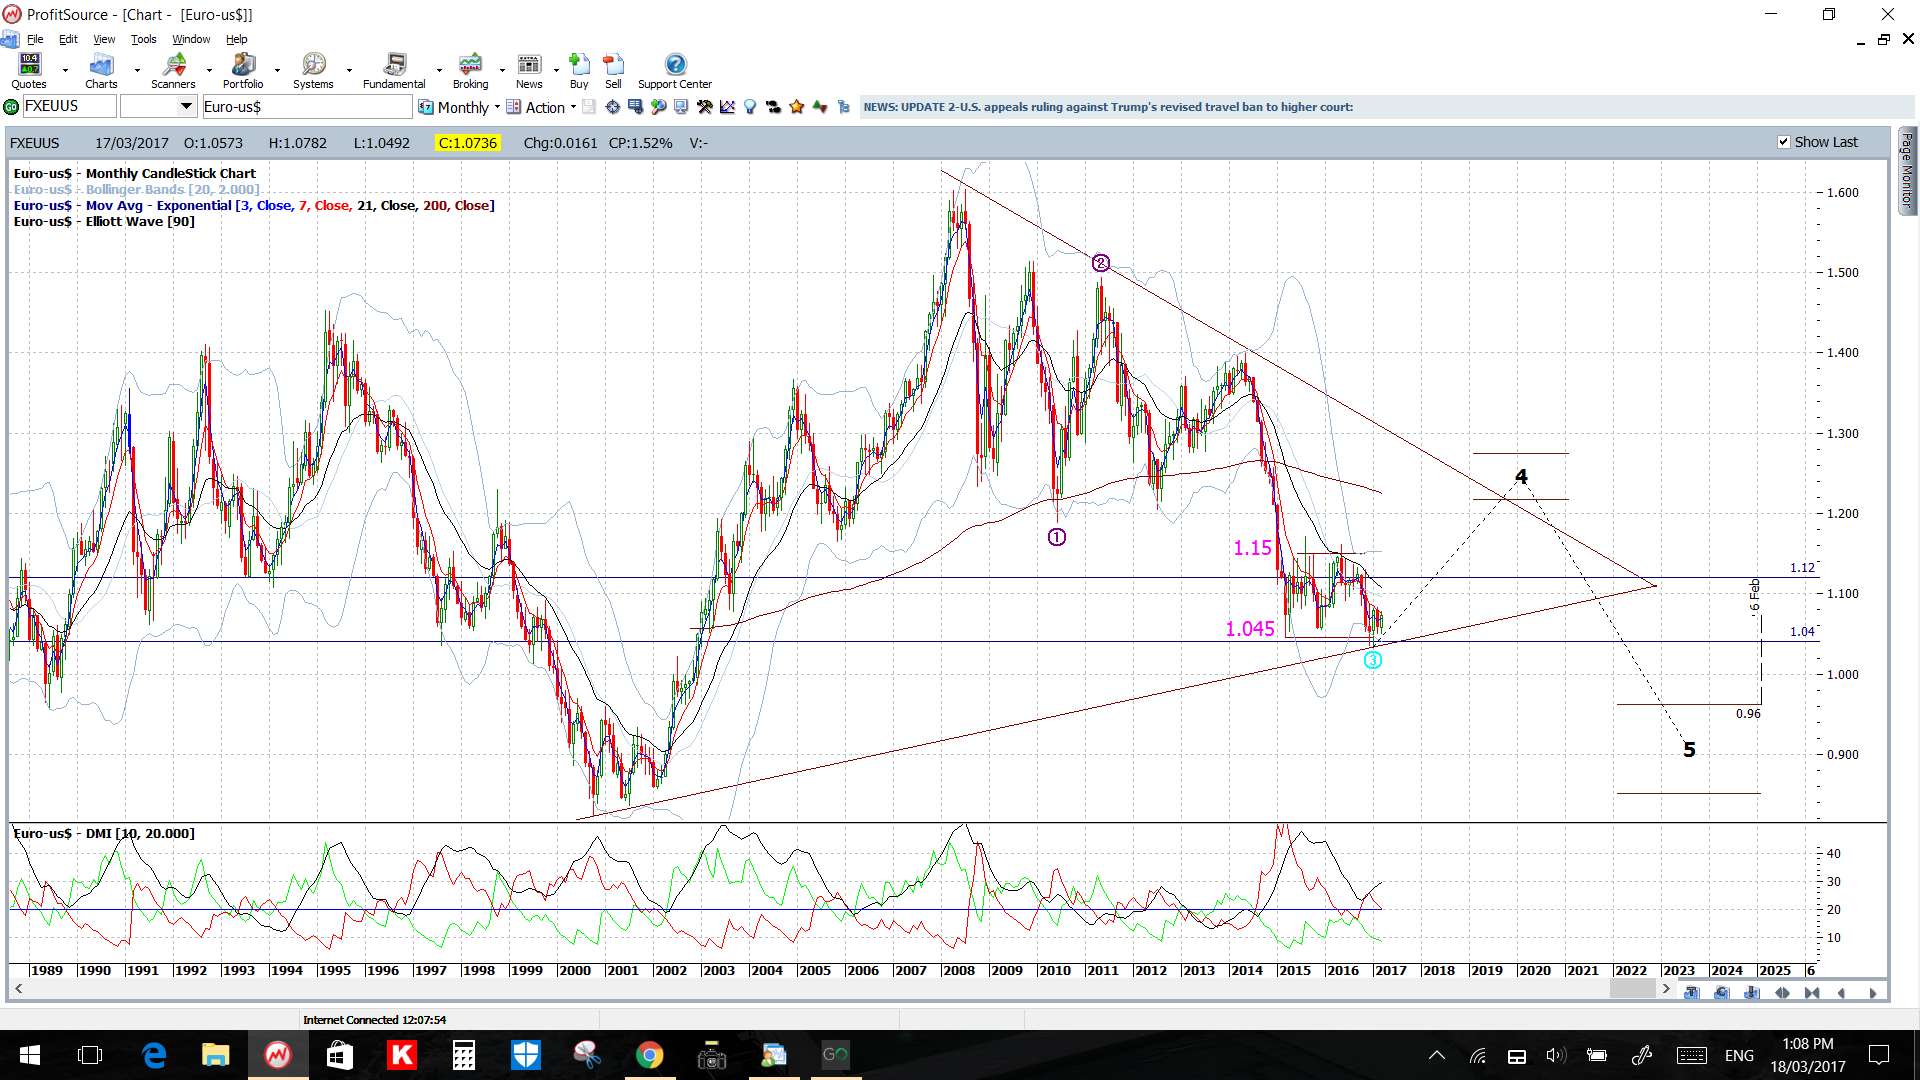
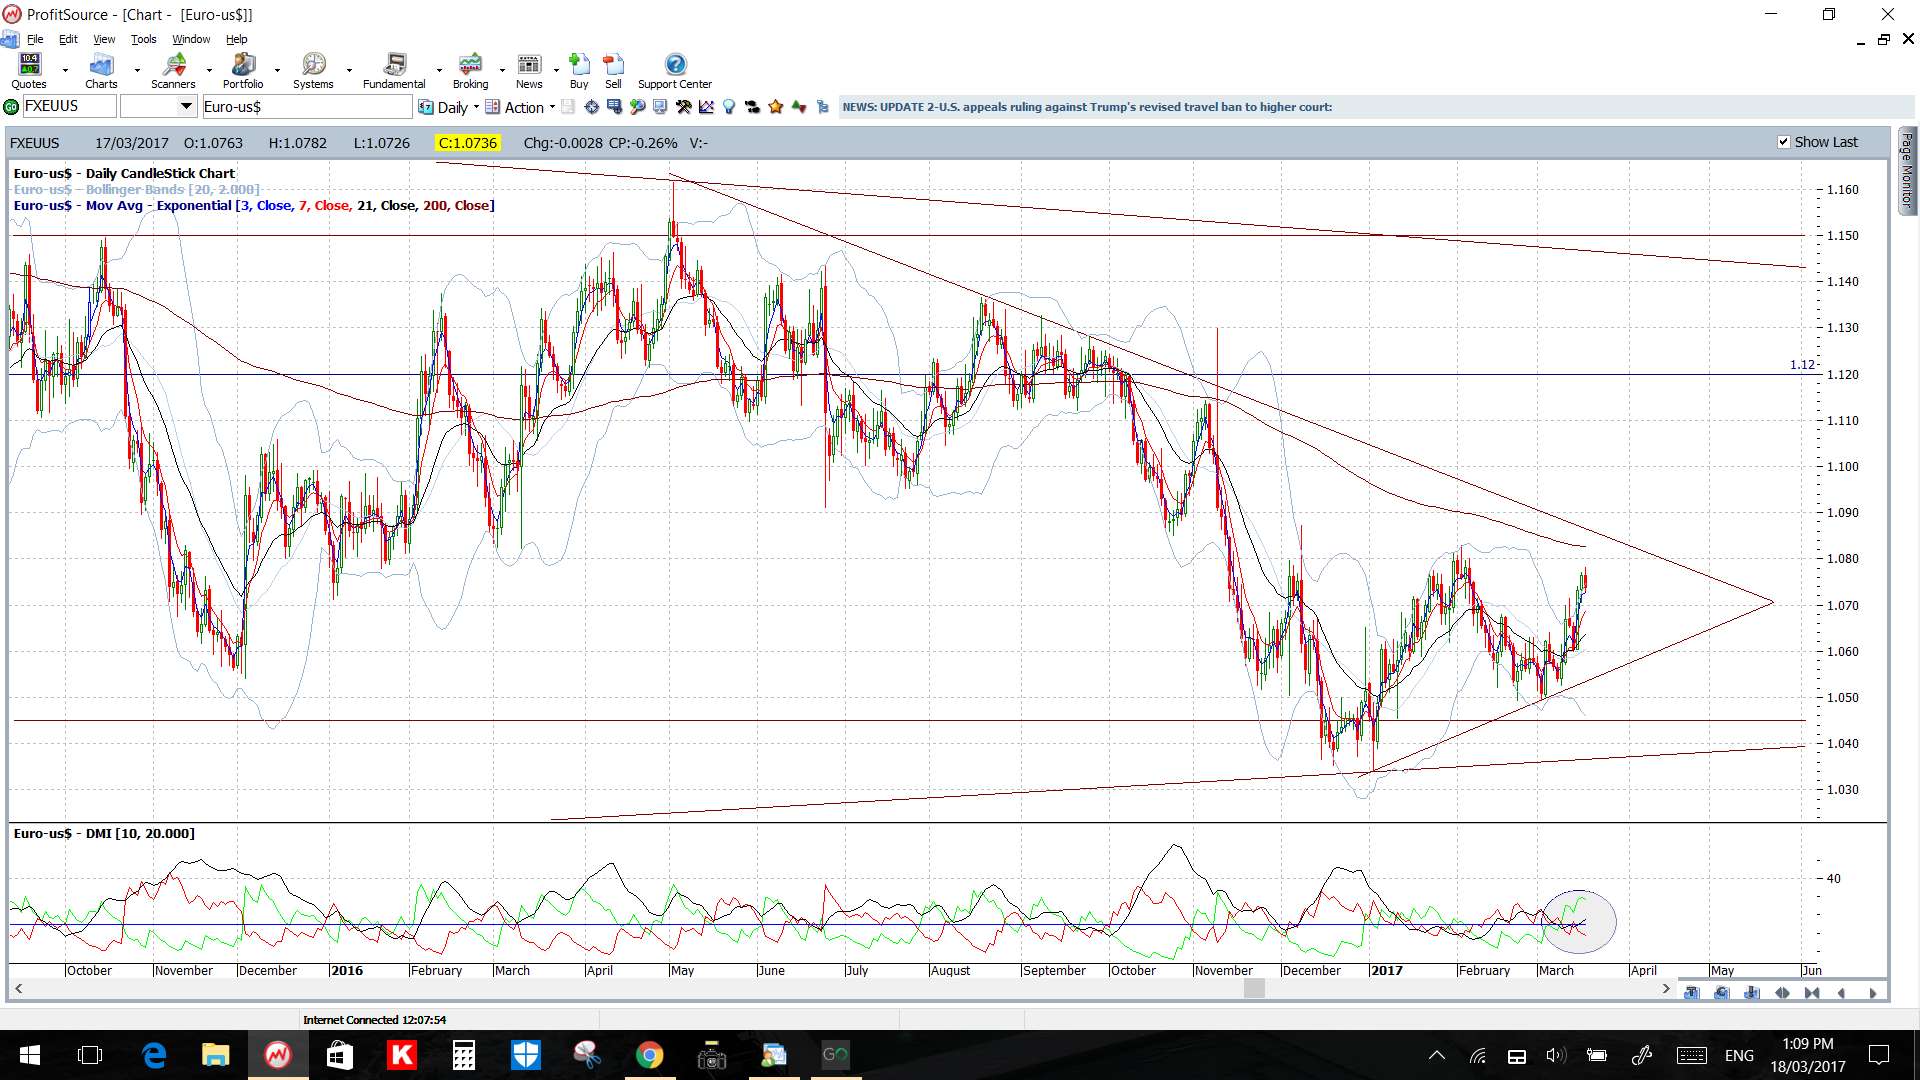
EUR/USD: I’m watching the daily chart triangle for any potential breakout.
Price is above the 4hr and daily Cloud.
The weekly candle was bullish.
Note the EUR data items on the calendar for this week:
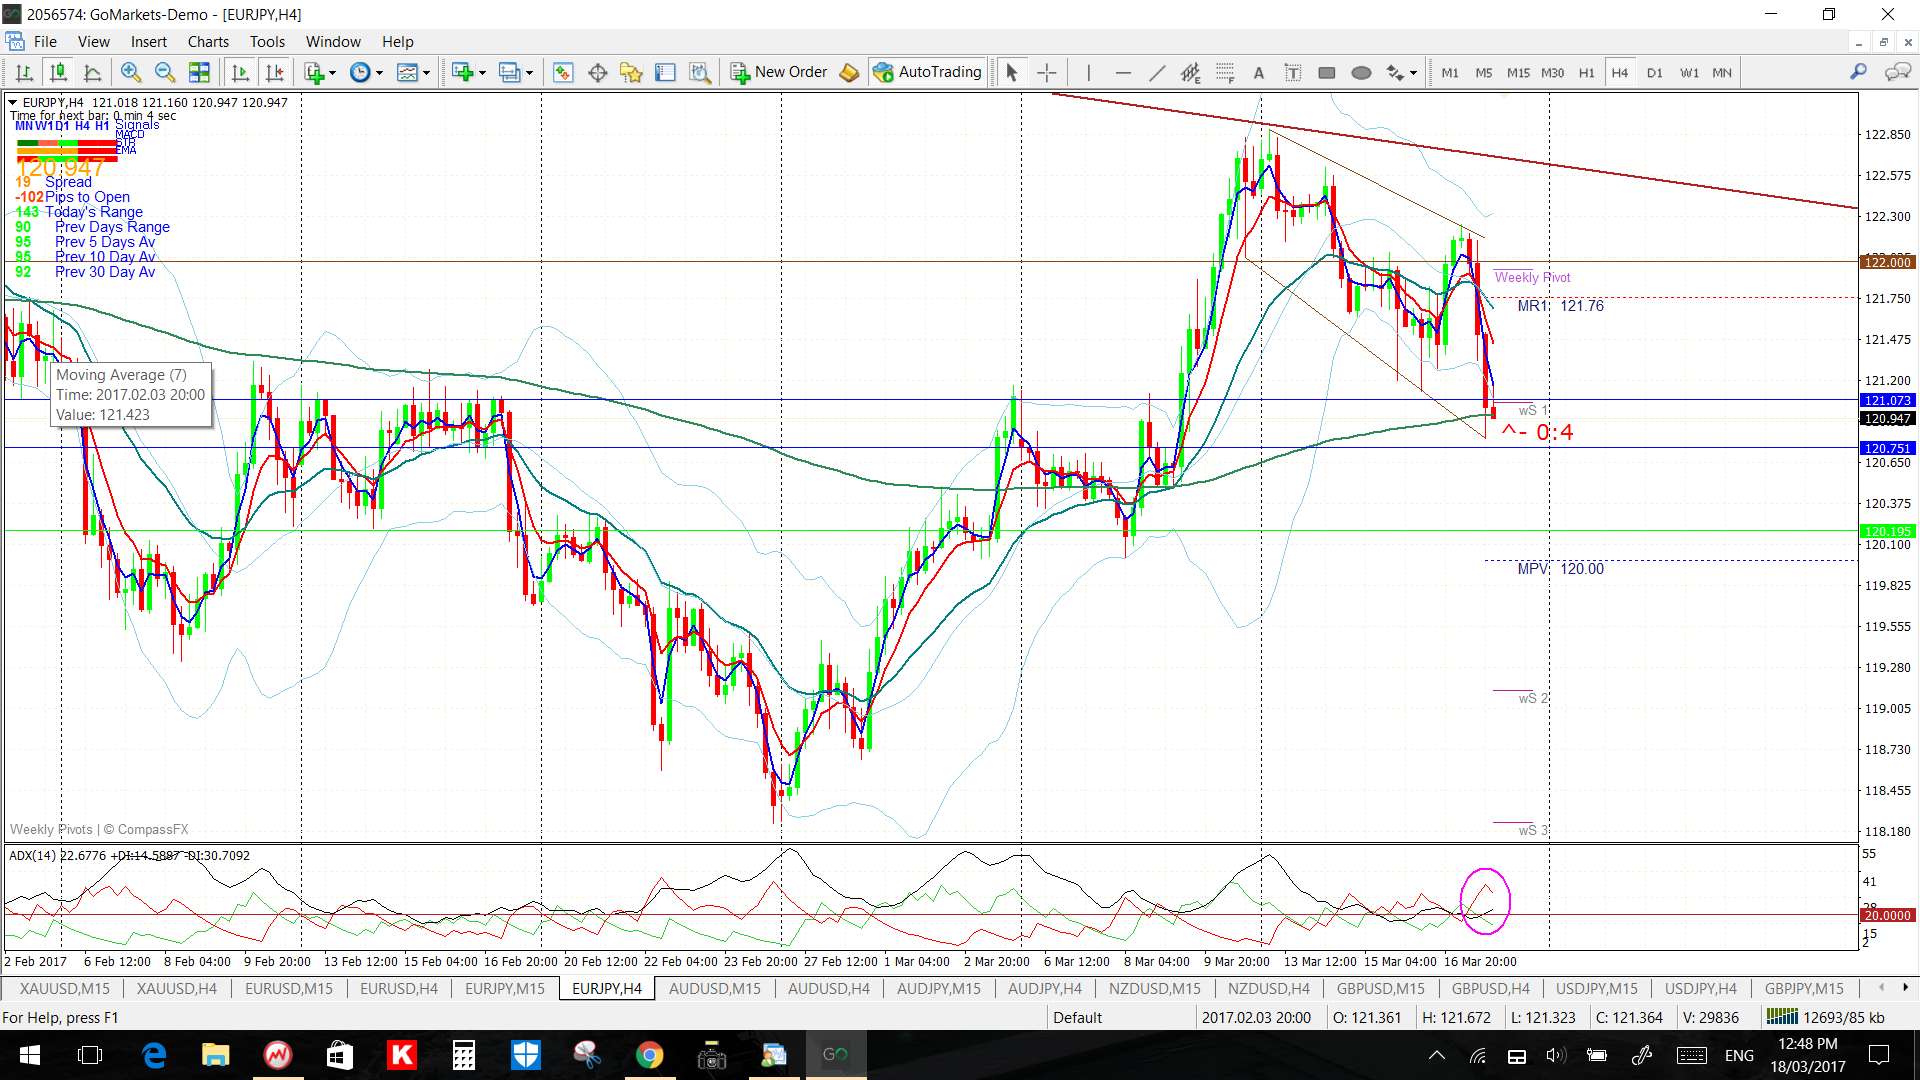
EUR/JPY: I’m watching the now-revised upper bear trend line from the weekly chart and the recent Flag trend lines for any potential new breakout.
Price is back below the 4hr and daily Cloud.
The weekly candle was bearish and forming an almost ‘Railway Track’ reversal-style pattern:


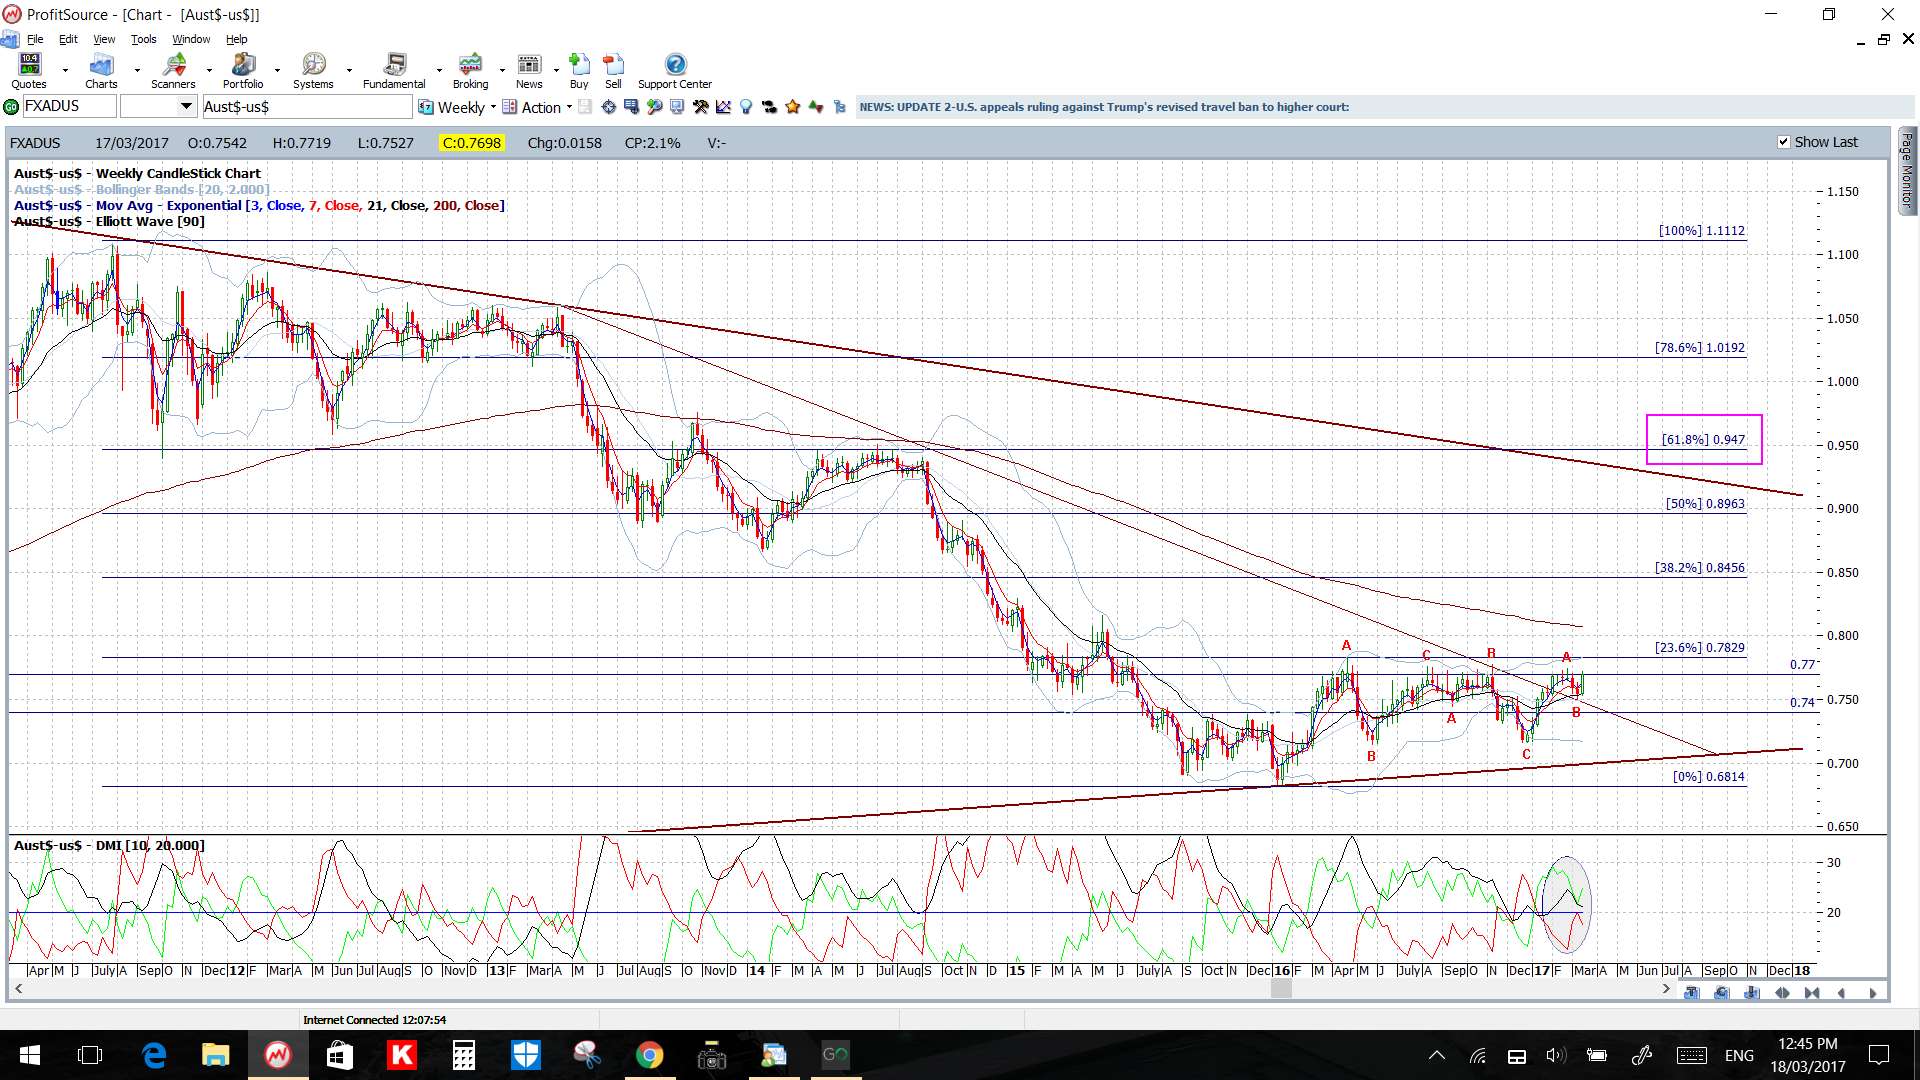
AUD/USD: The 0.77 level keeps giving this pair grief but watch the 4hr chart’s trend lines for clues about the next directional move.
Price is above the 4hr and daily Cloud.
The weekly candle was large bullish engulfing candle.
Note the AUD data items for this week:


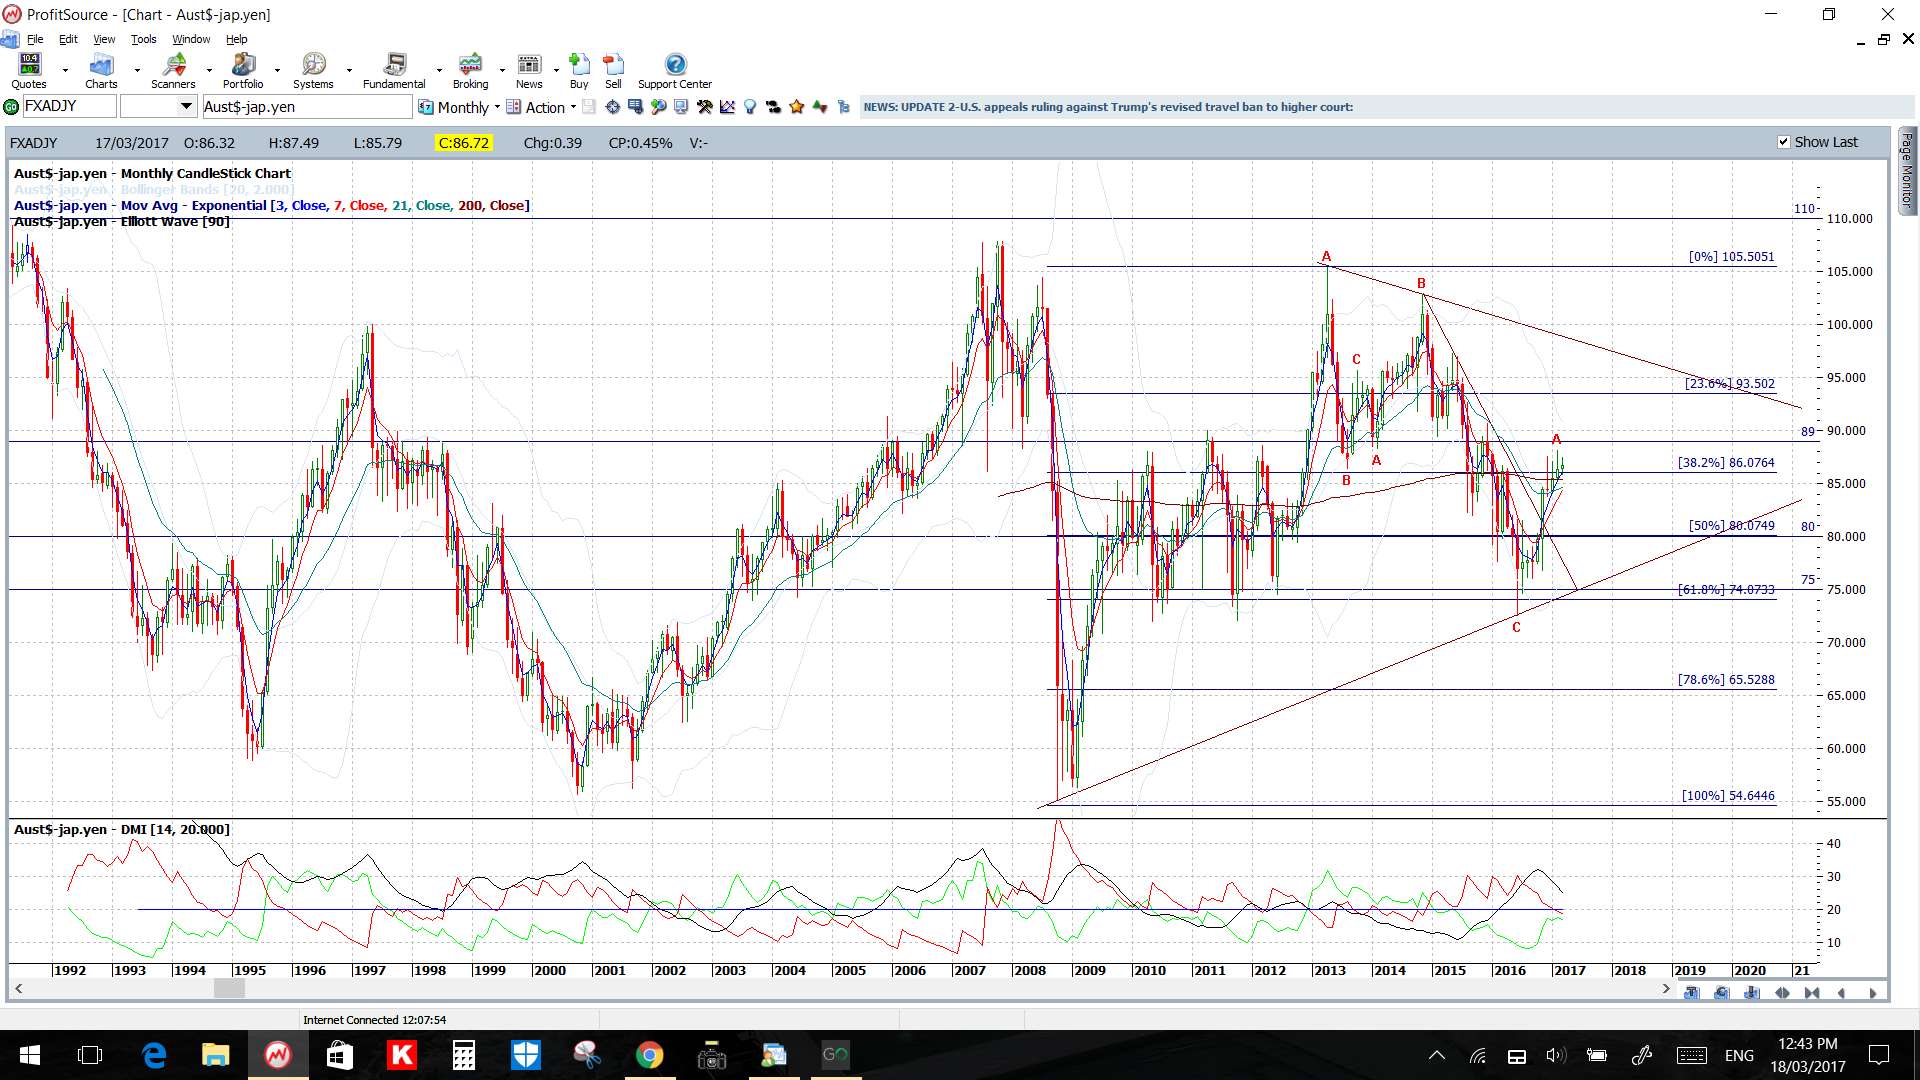
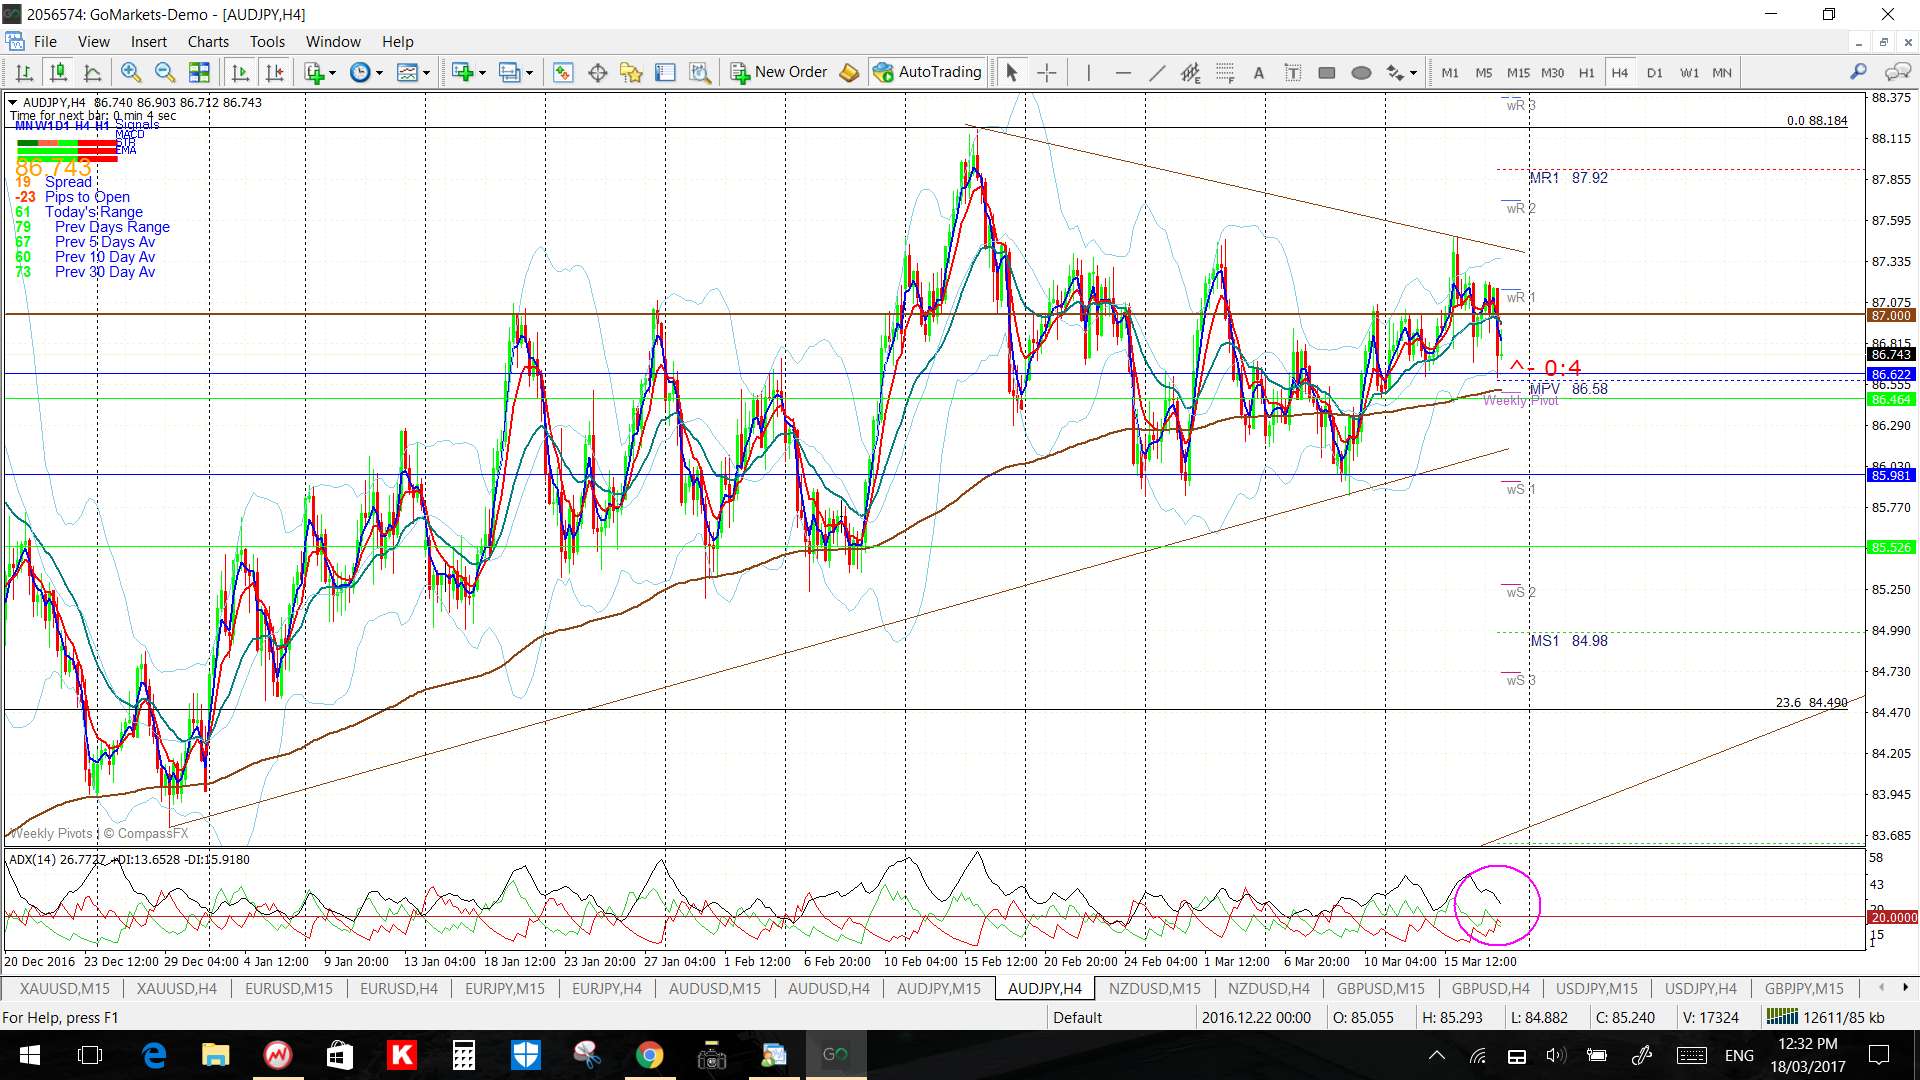
AUD/JPY: I’m watching the 4hr chart’s wedge pattern for any momentum-based breakout.
Price is above the 4hr and daily Cloud.
The weekly candle was a bullish coloured Doji reflecting indecsion.
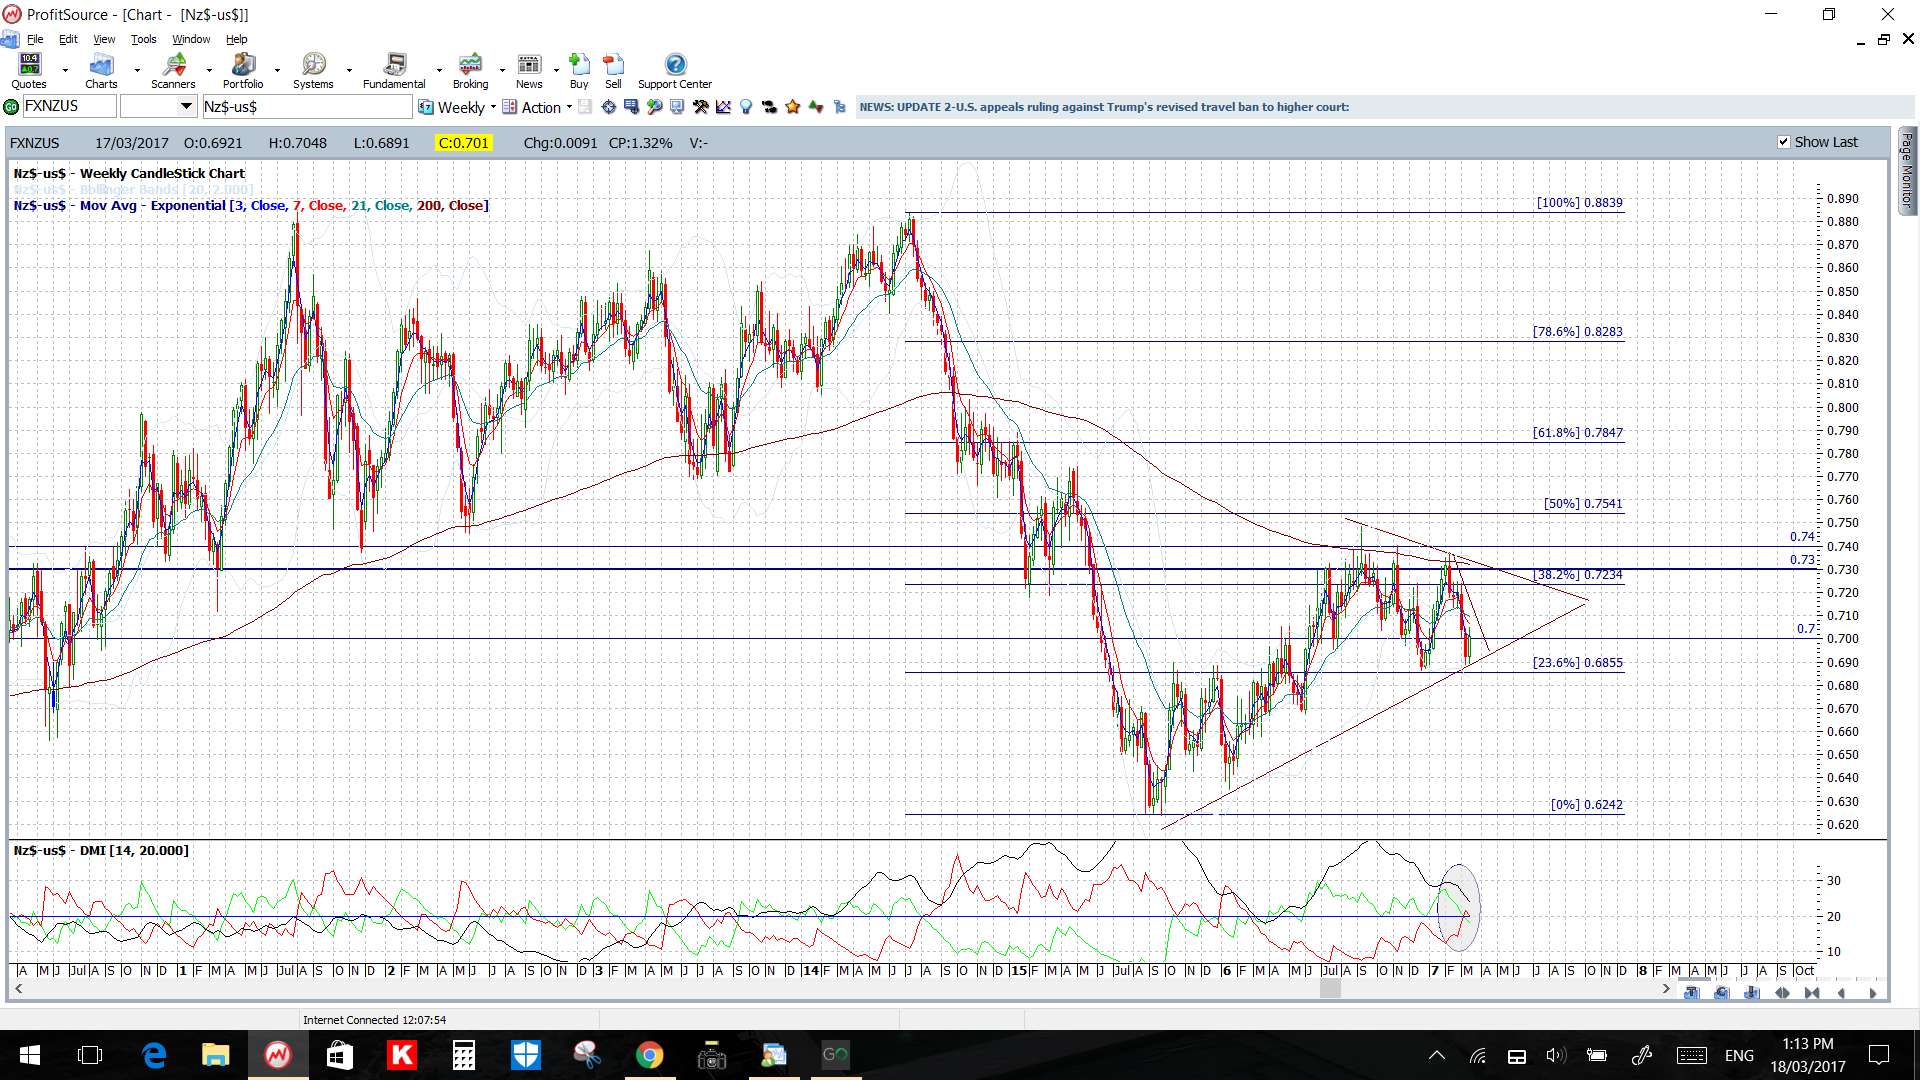
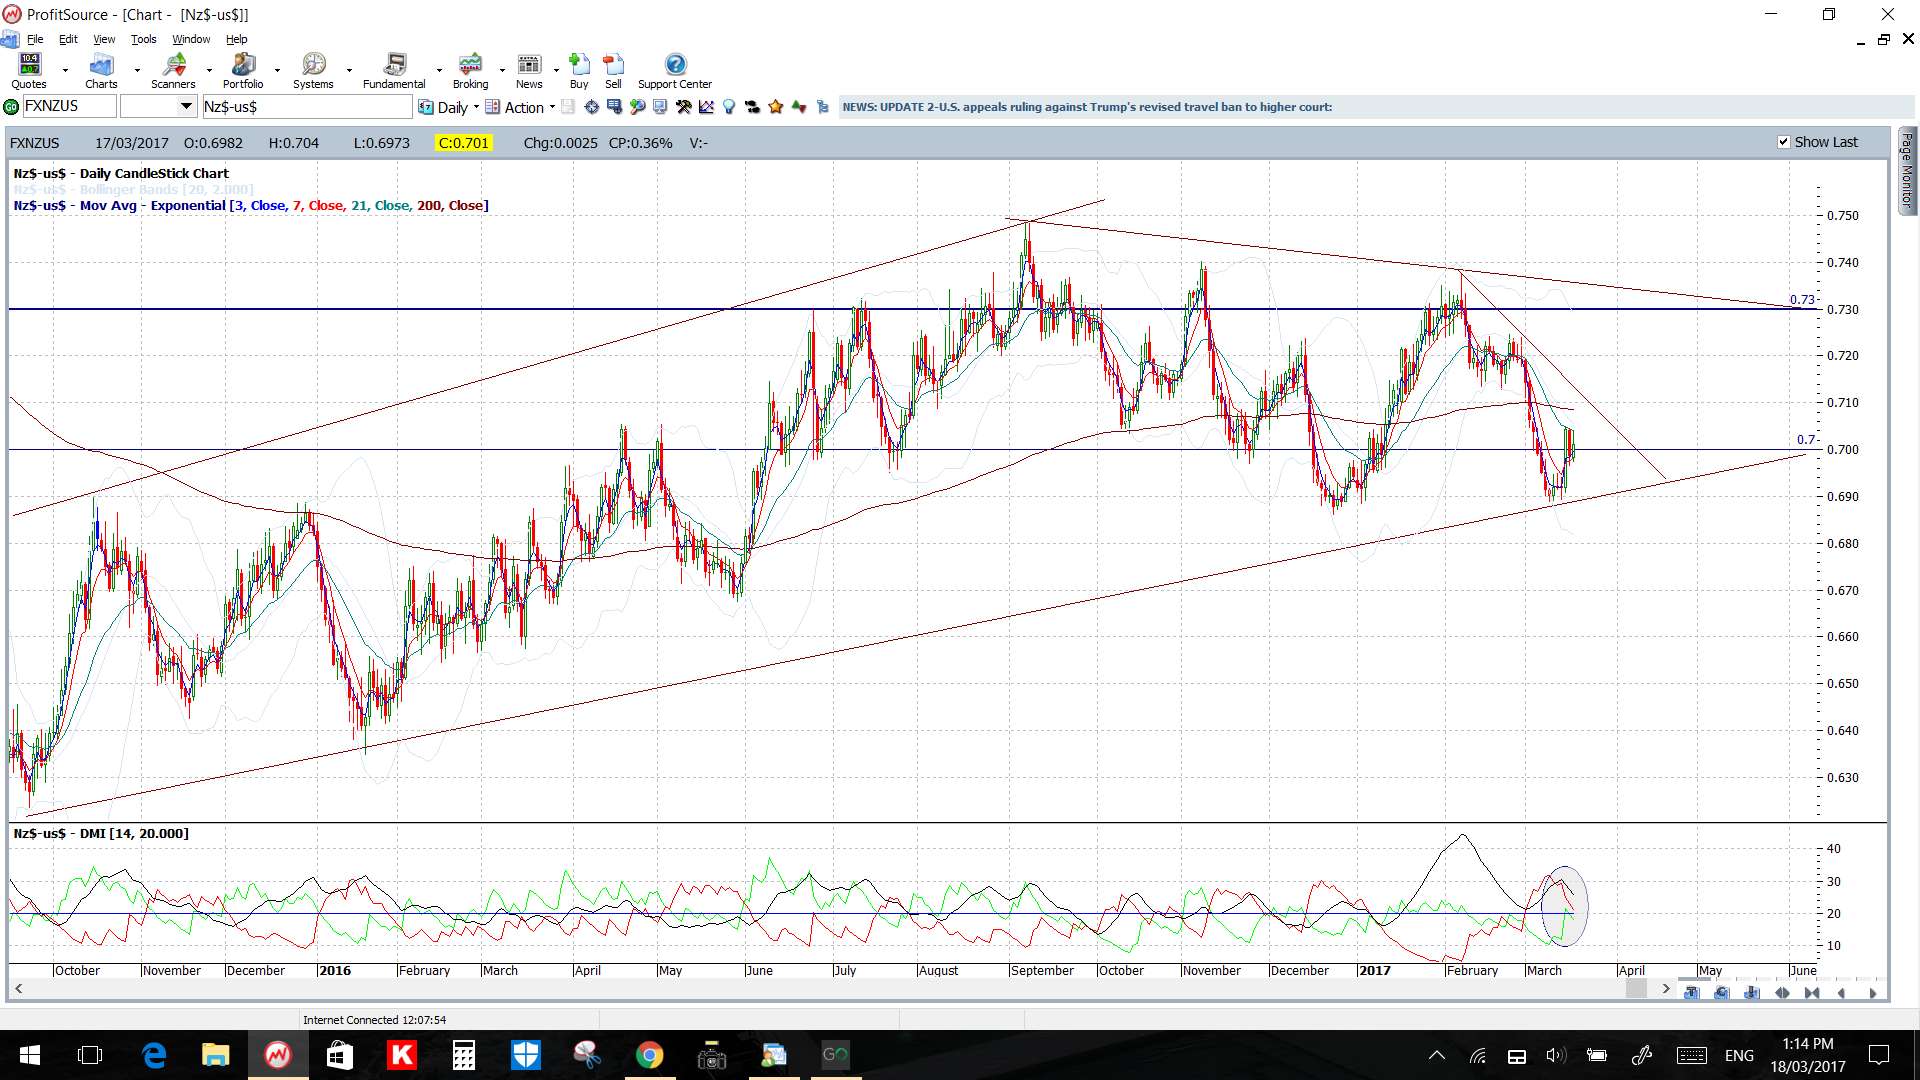
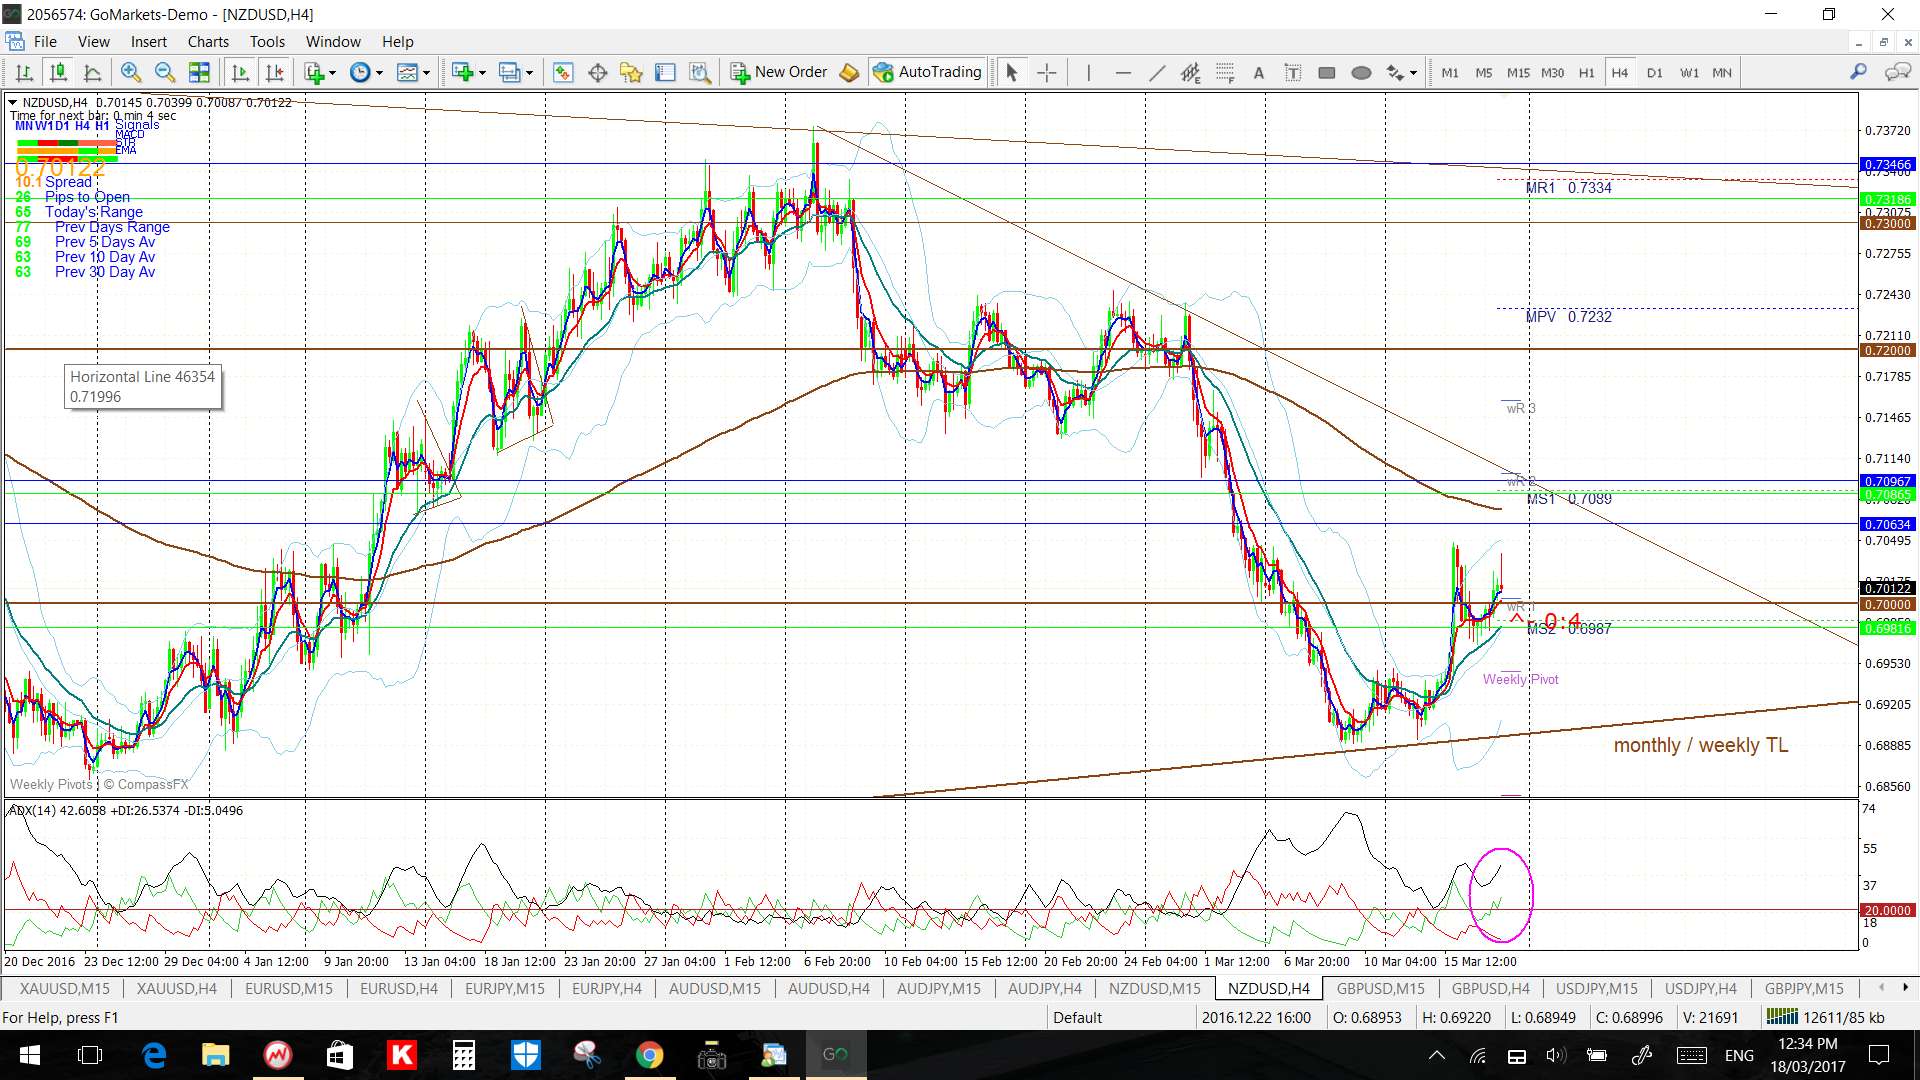
NZD/USD: I have revised my trend lines to accommodate recent price action and have a new 4hr chart triangle to watch for any potential momentum-based breakout.
Price is in the 4hr Cloud but below the daily Cloud.
The weekly candle was bearish and almost an ‘Inside’ candle reflecting indecision.
Note the RBNZ interest rate update this week:

GBP/USD: The Cable continues within the daily chart triangle so watch for any momentum-based breakout.
Price action recovered a bit last week following the BoE rate update when one of the MPC members voted for an immediate rate increase. However, Brexit remains in the news so traders need to watch for any renewed Brexit-related weakness.
Price is above the 4hr Cloud but in the daily Cloud.
The weekly candle was a large bullish engulfing candle.
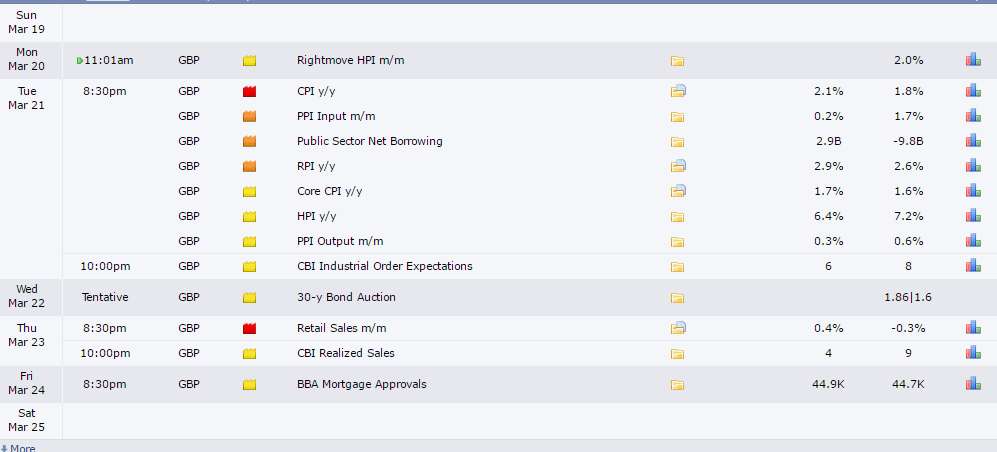
Note there is GBP CPI and Retail Sales data this week:


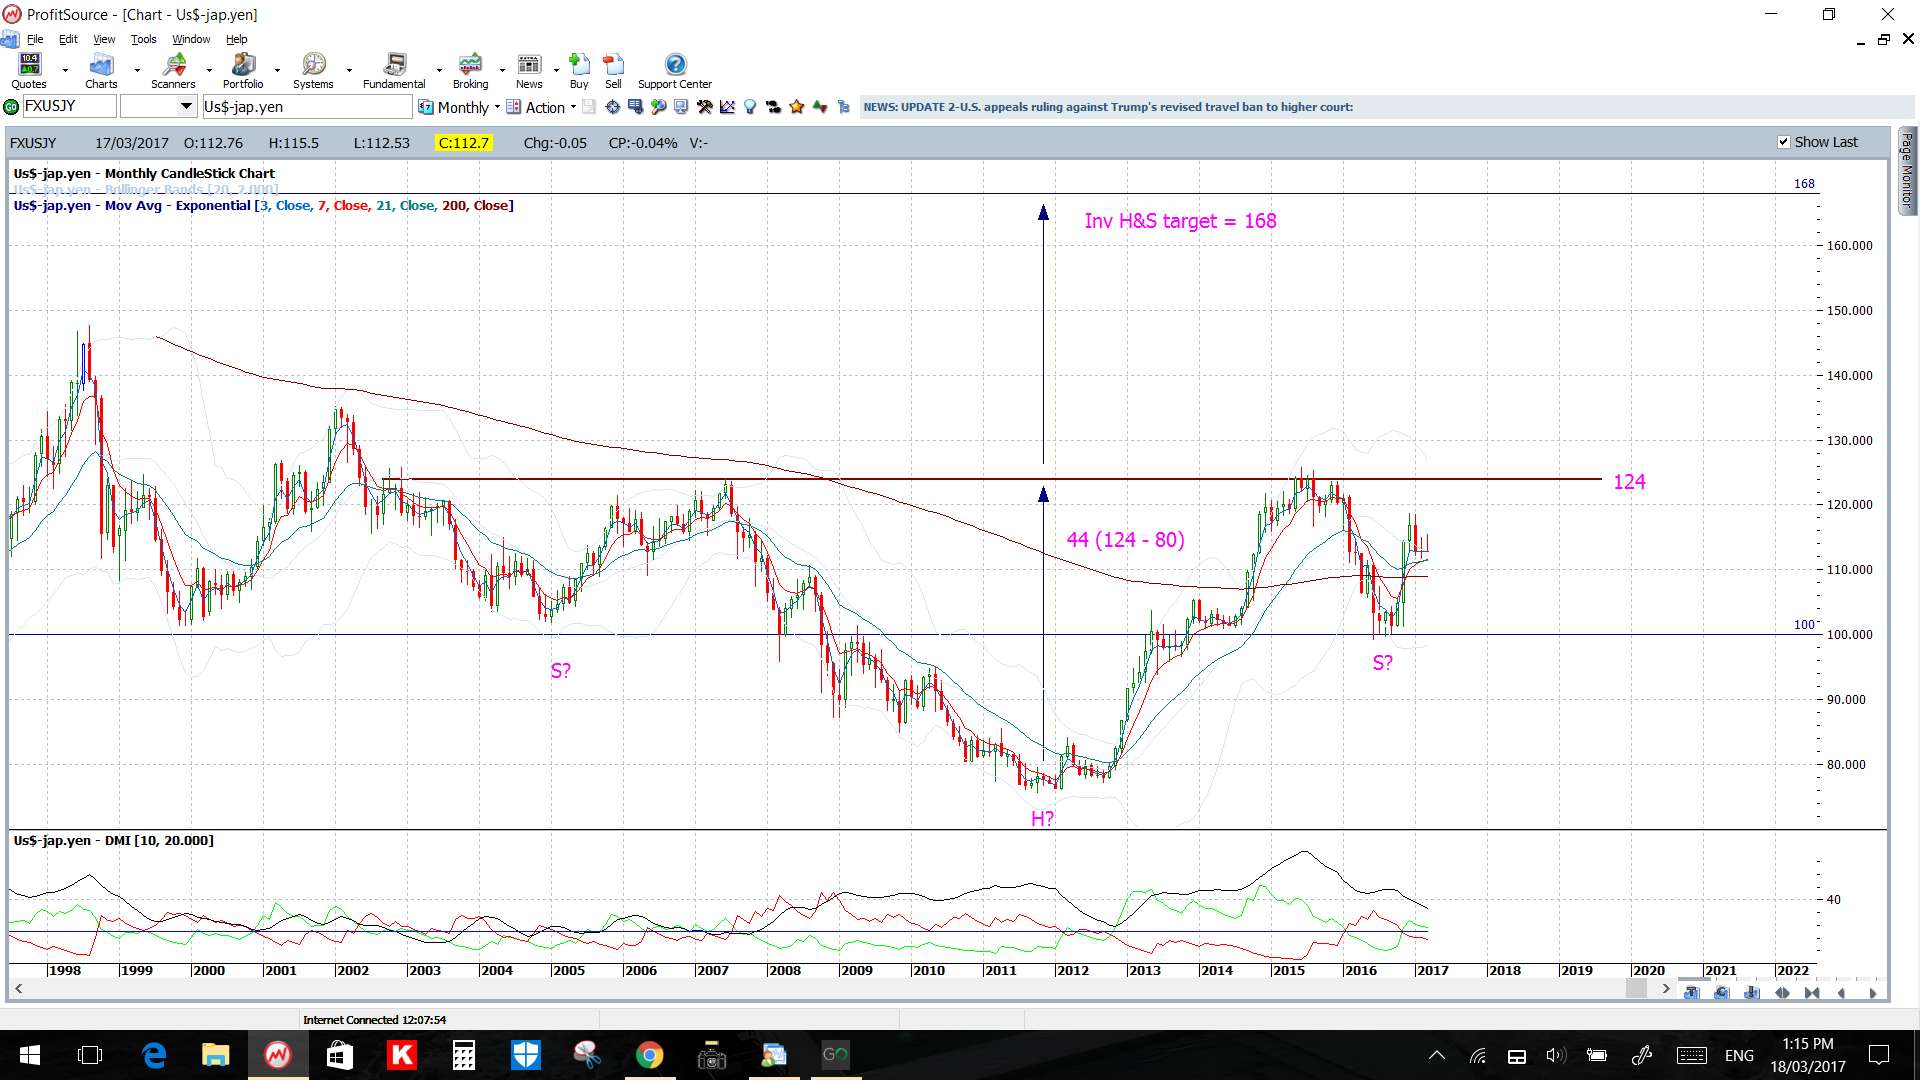
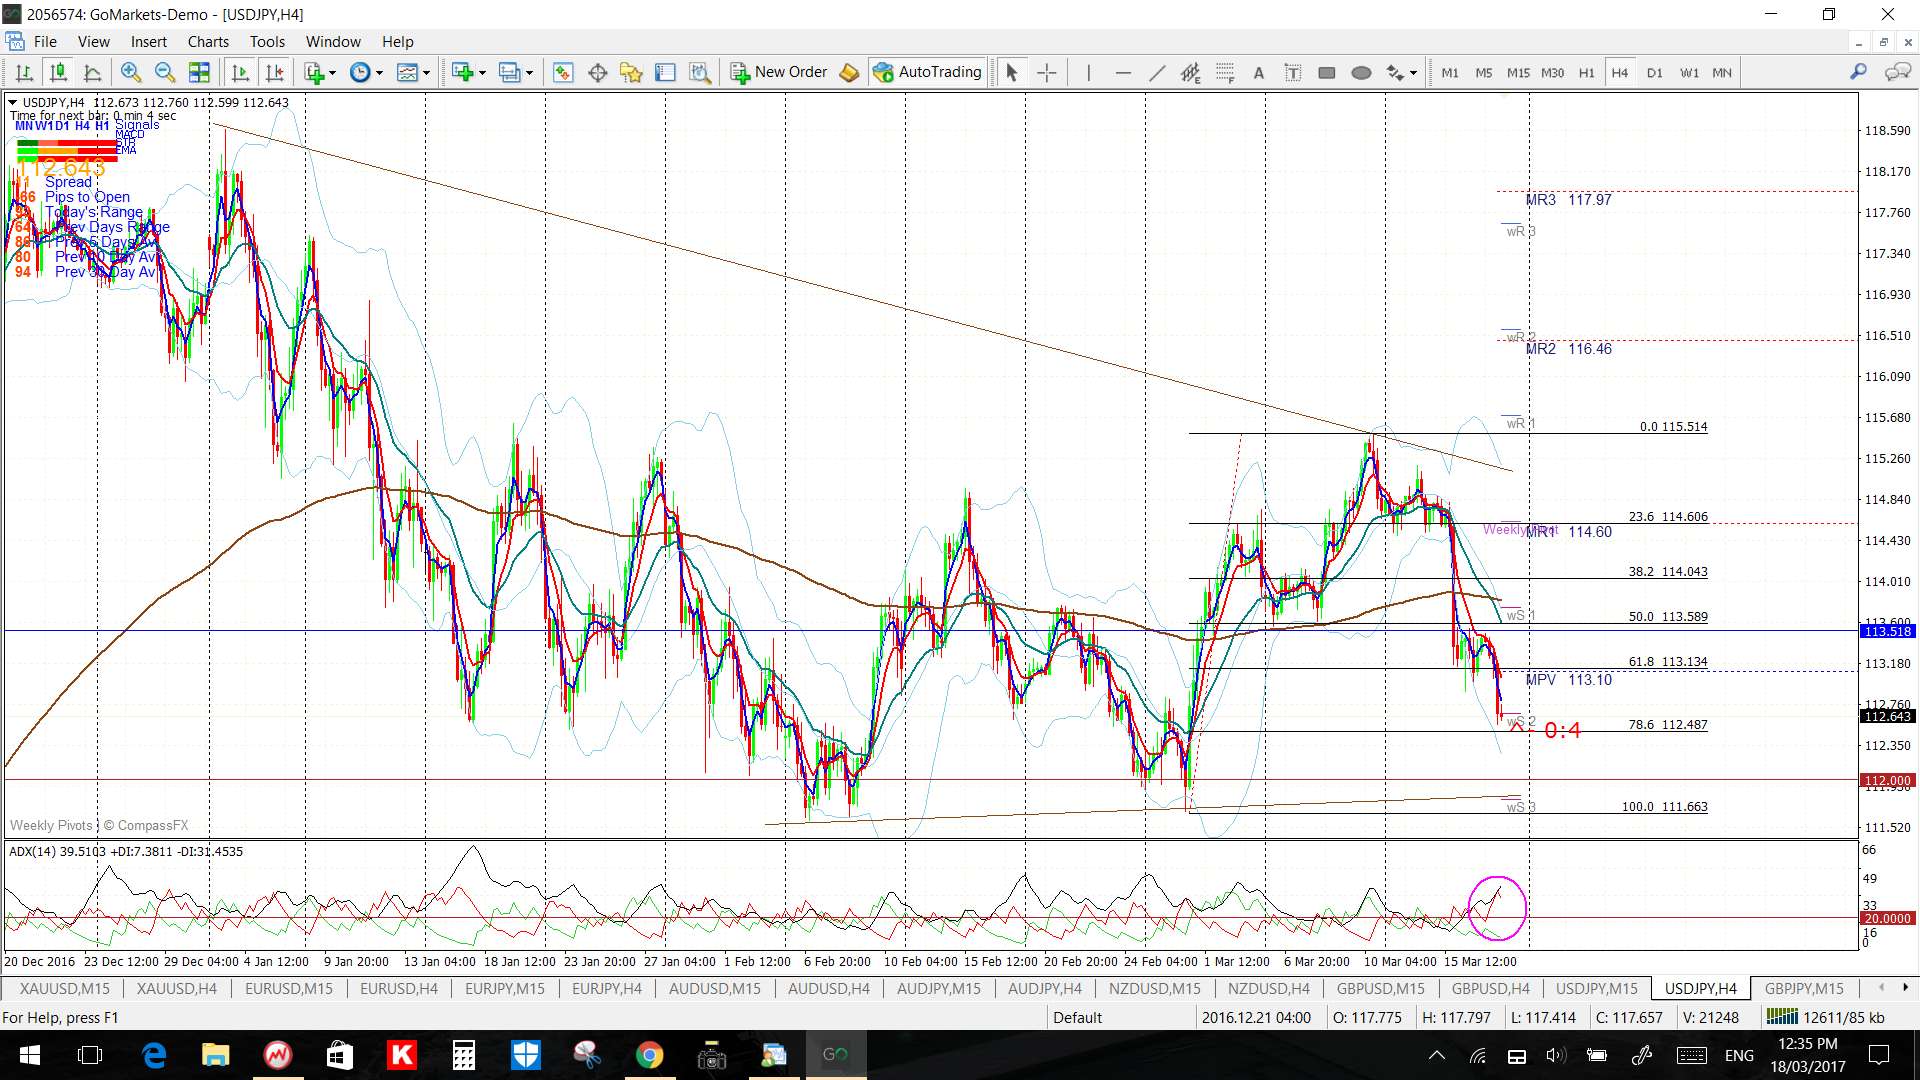
USD/JPY: I’m watching the 4hr chart’s wedge trend lines for any momentum-based breakout.
Price is below the 4hr and daily Cloud.
The weekly candle was bearish and almost engulfing.
There is no high impact JPY data this week but watch for impact from USD-sensitive data.
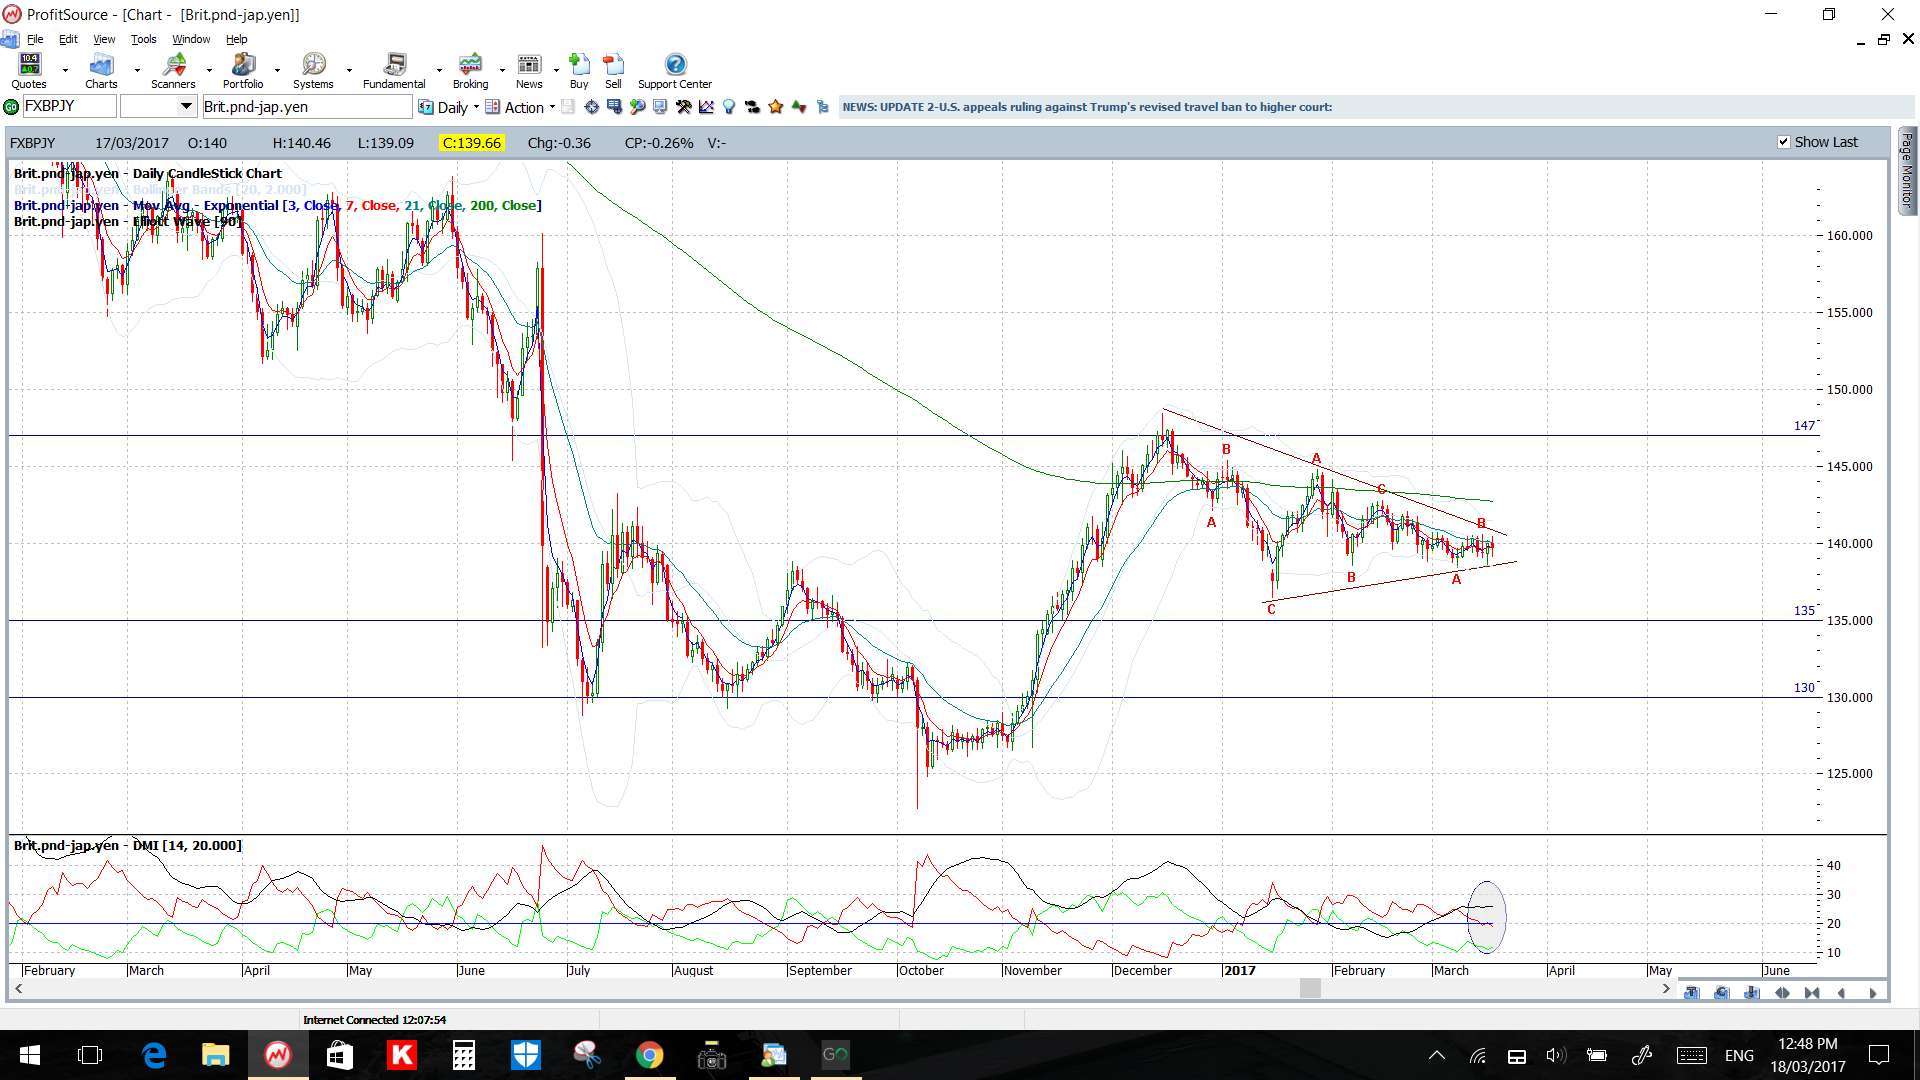
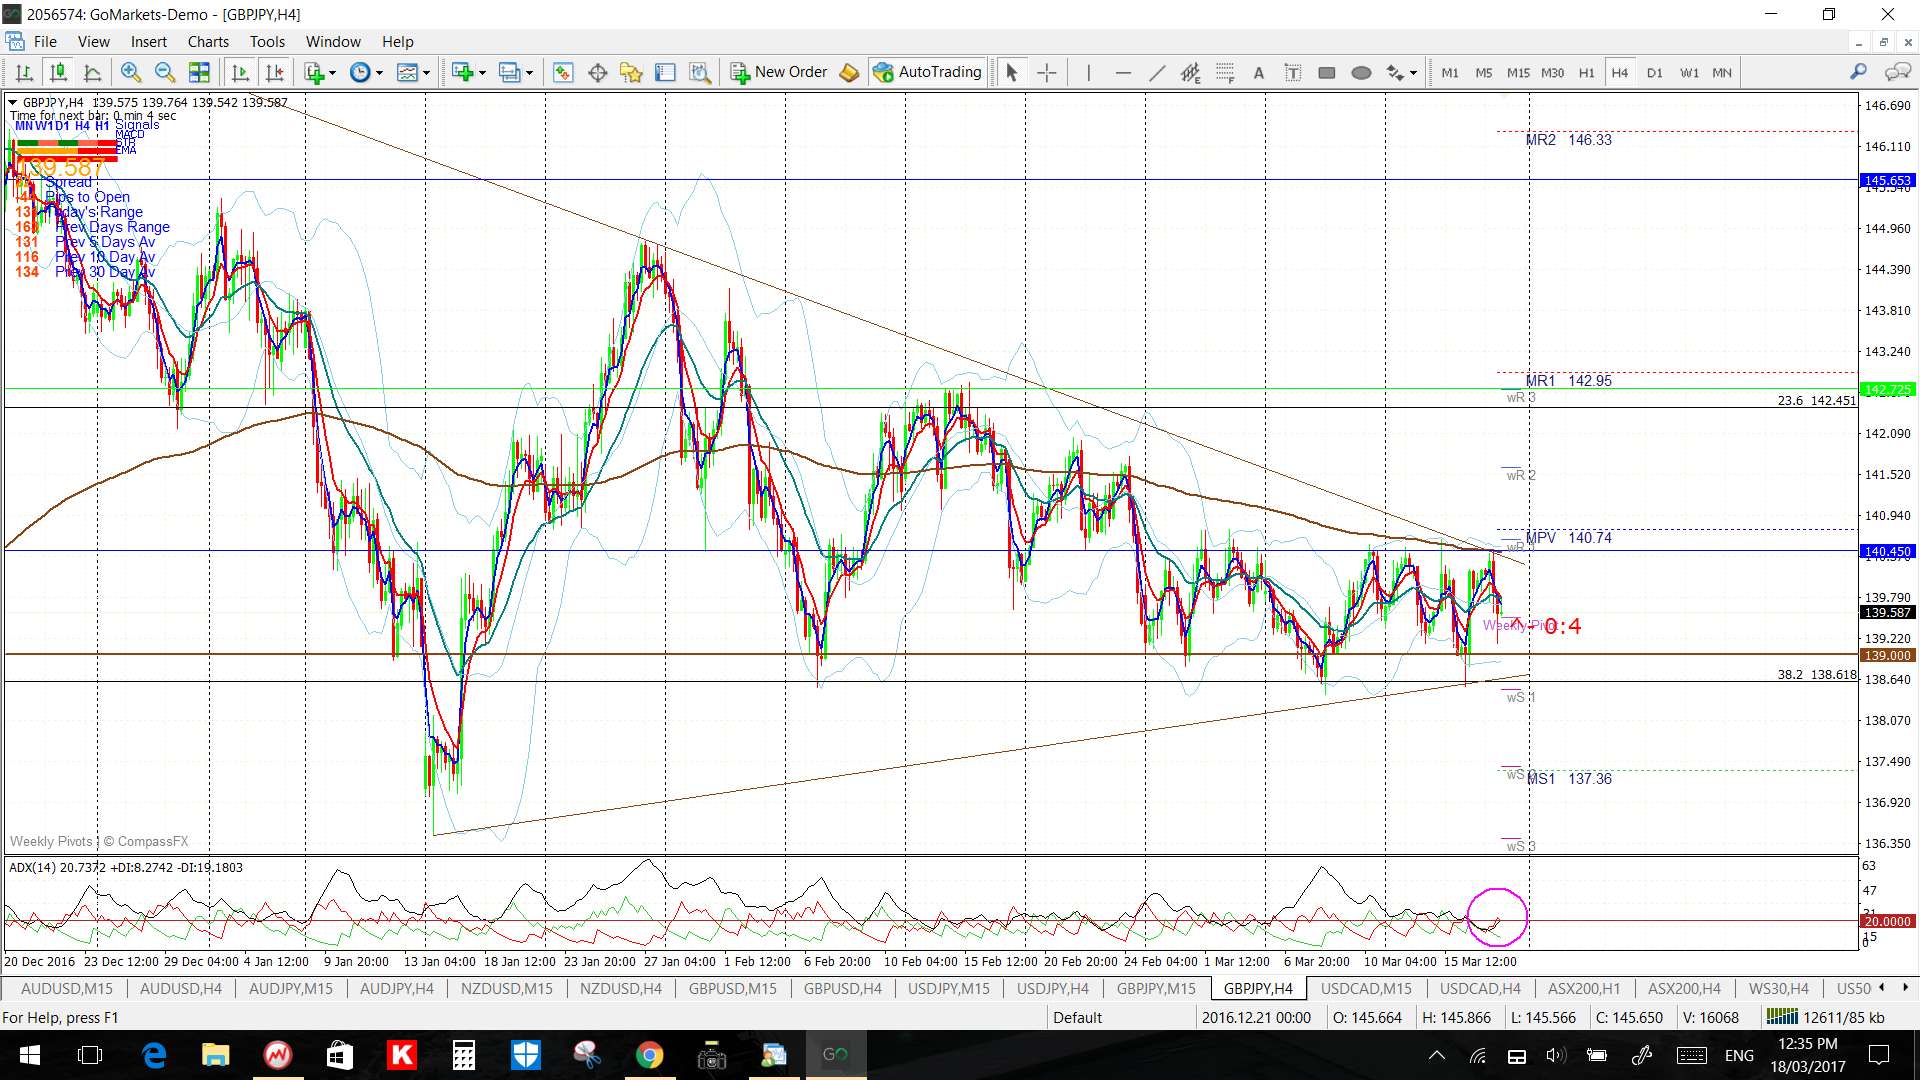
GBP/JPY: I’m watching the triangle trend lines for any momentum-based breakout.
Price is in thin 4hr Cloud but below the daily Cloud.
The weekly candle was a bullish coloured ‘Spinning Top’ reflecting indecision There have been 5 such candles in the last 6 weeks!.
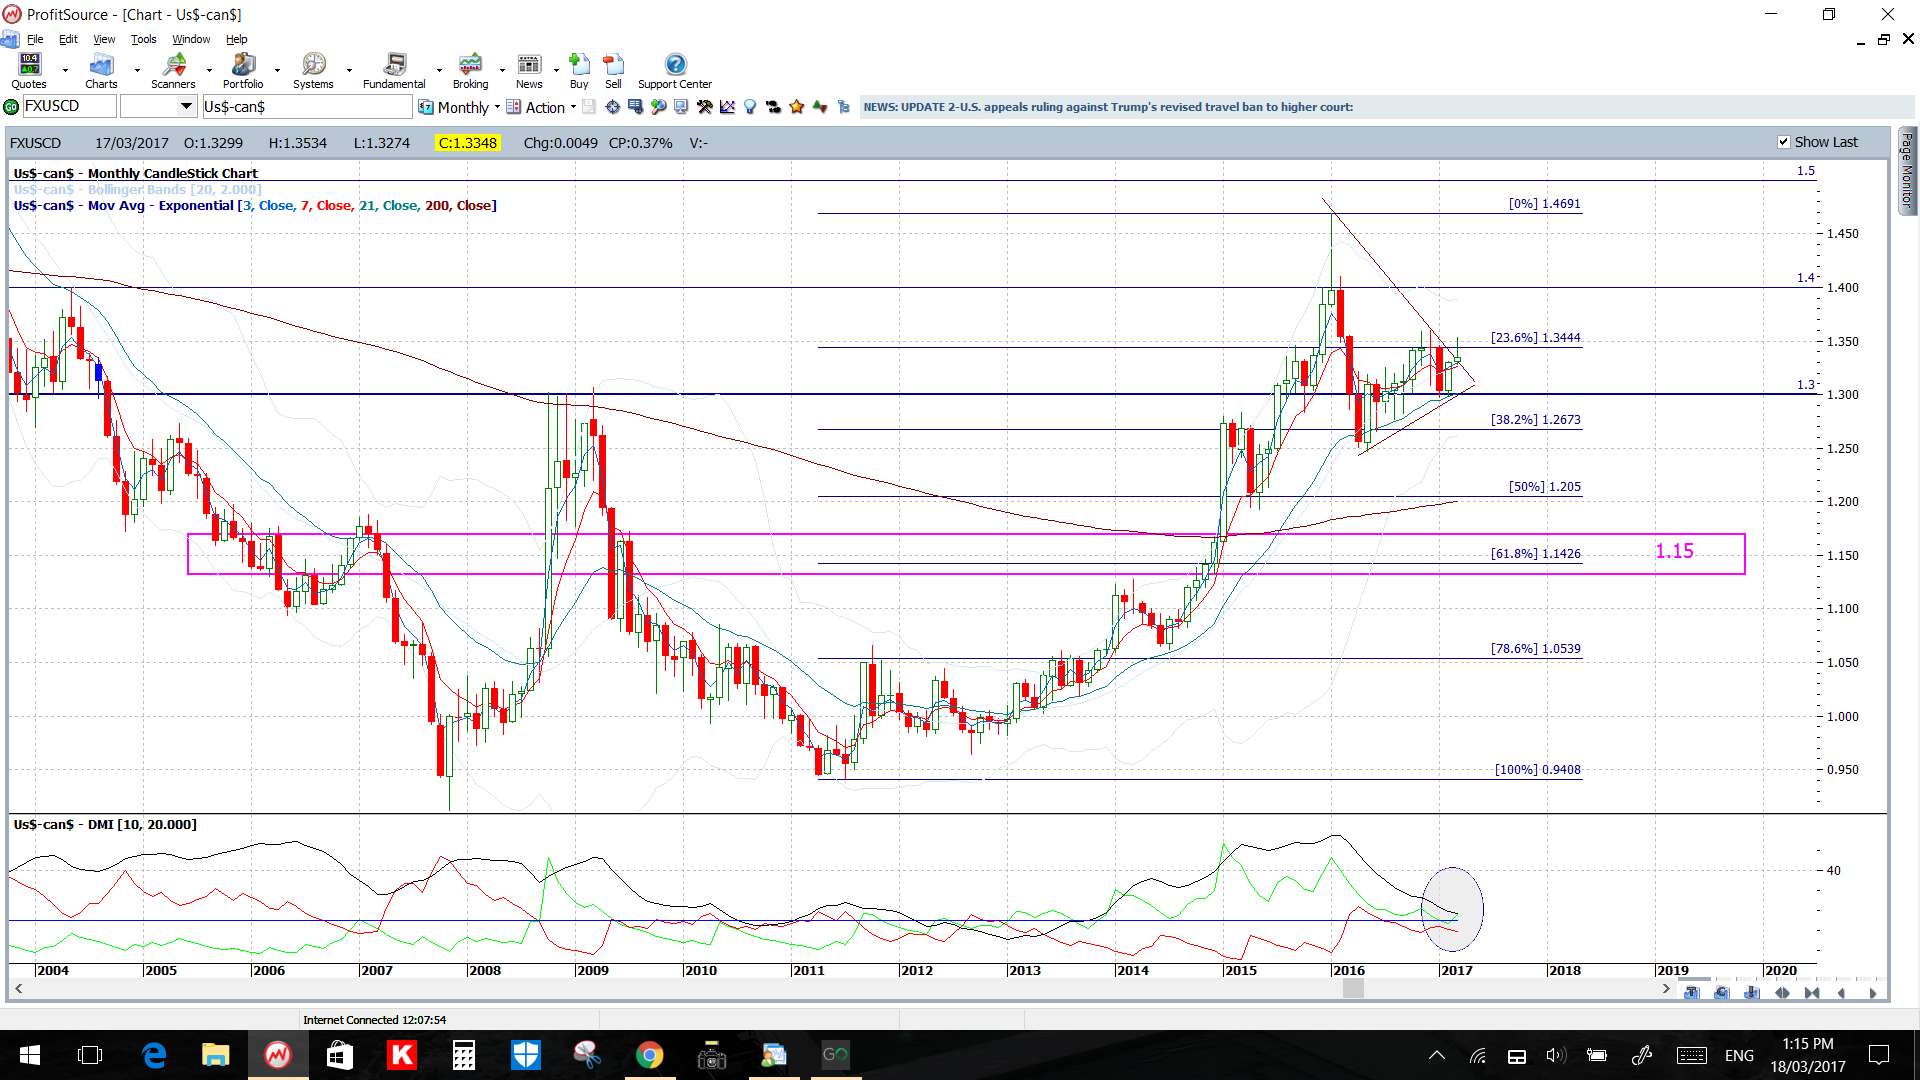
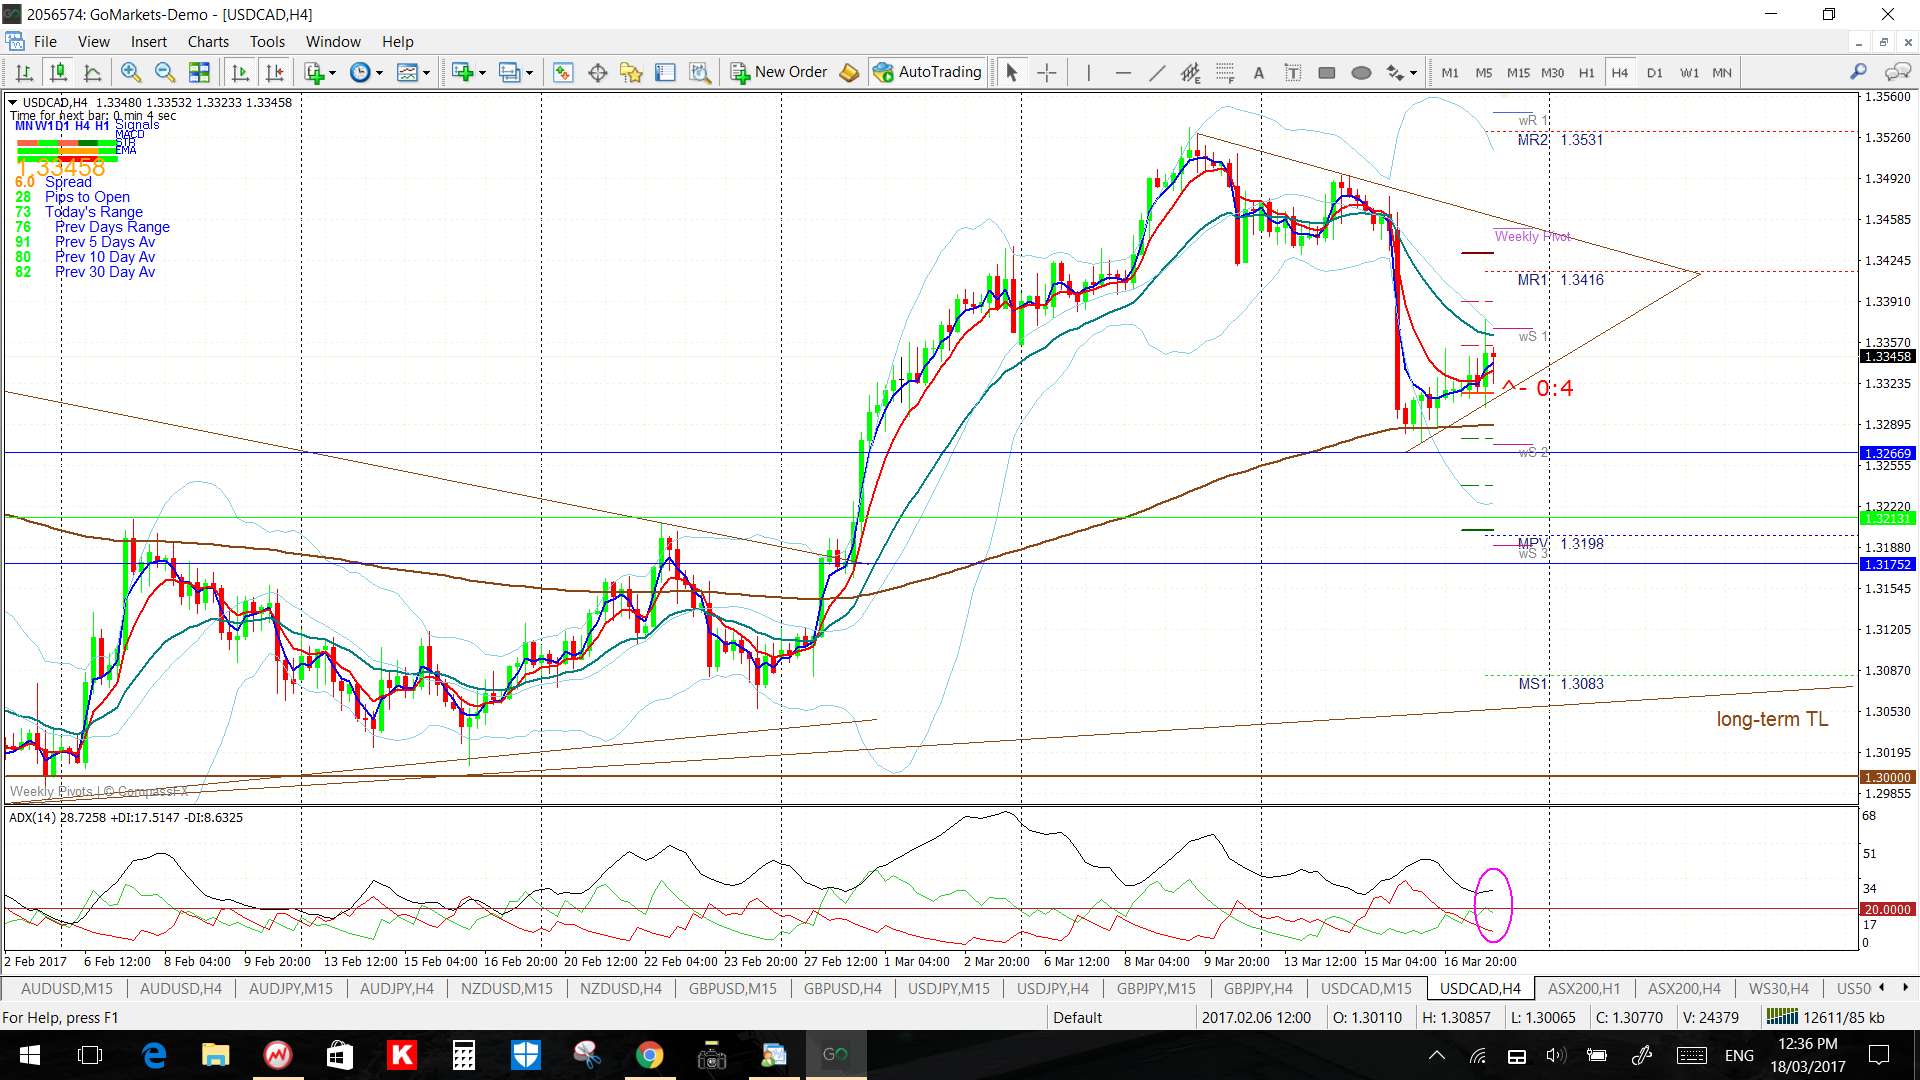
USD/CAD: I’m watching the 4hr chart’s triangle trend lines for any momentum-based breakout but there is one on the monthly chart too!
Price is below the 4hr Cloud but above the daily Cloud.
The weekly candle was bearish.
There is CAD CPI data this week.
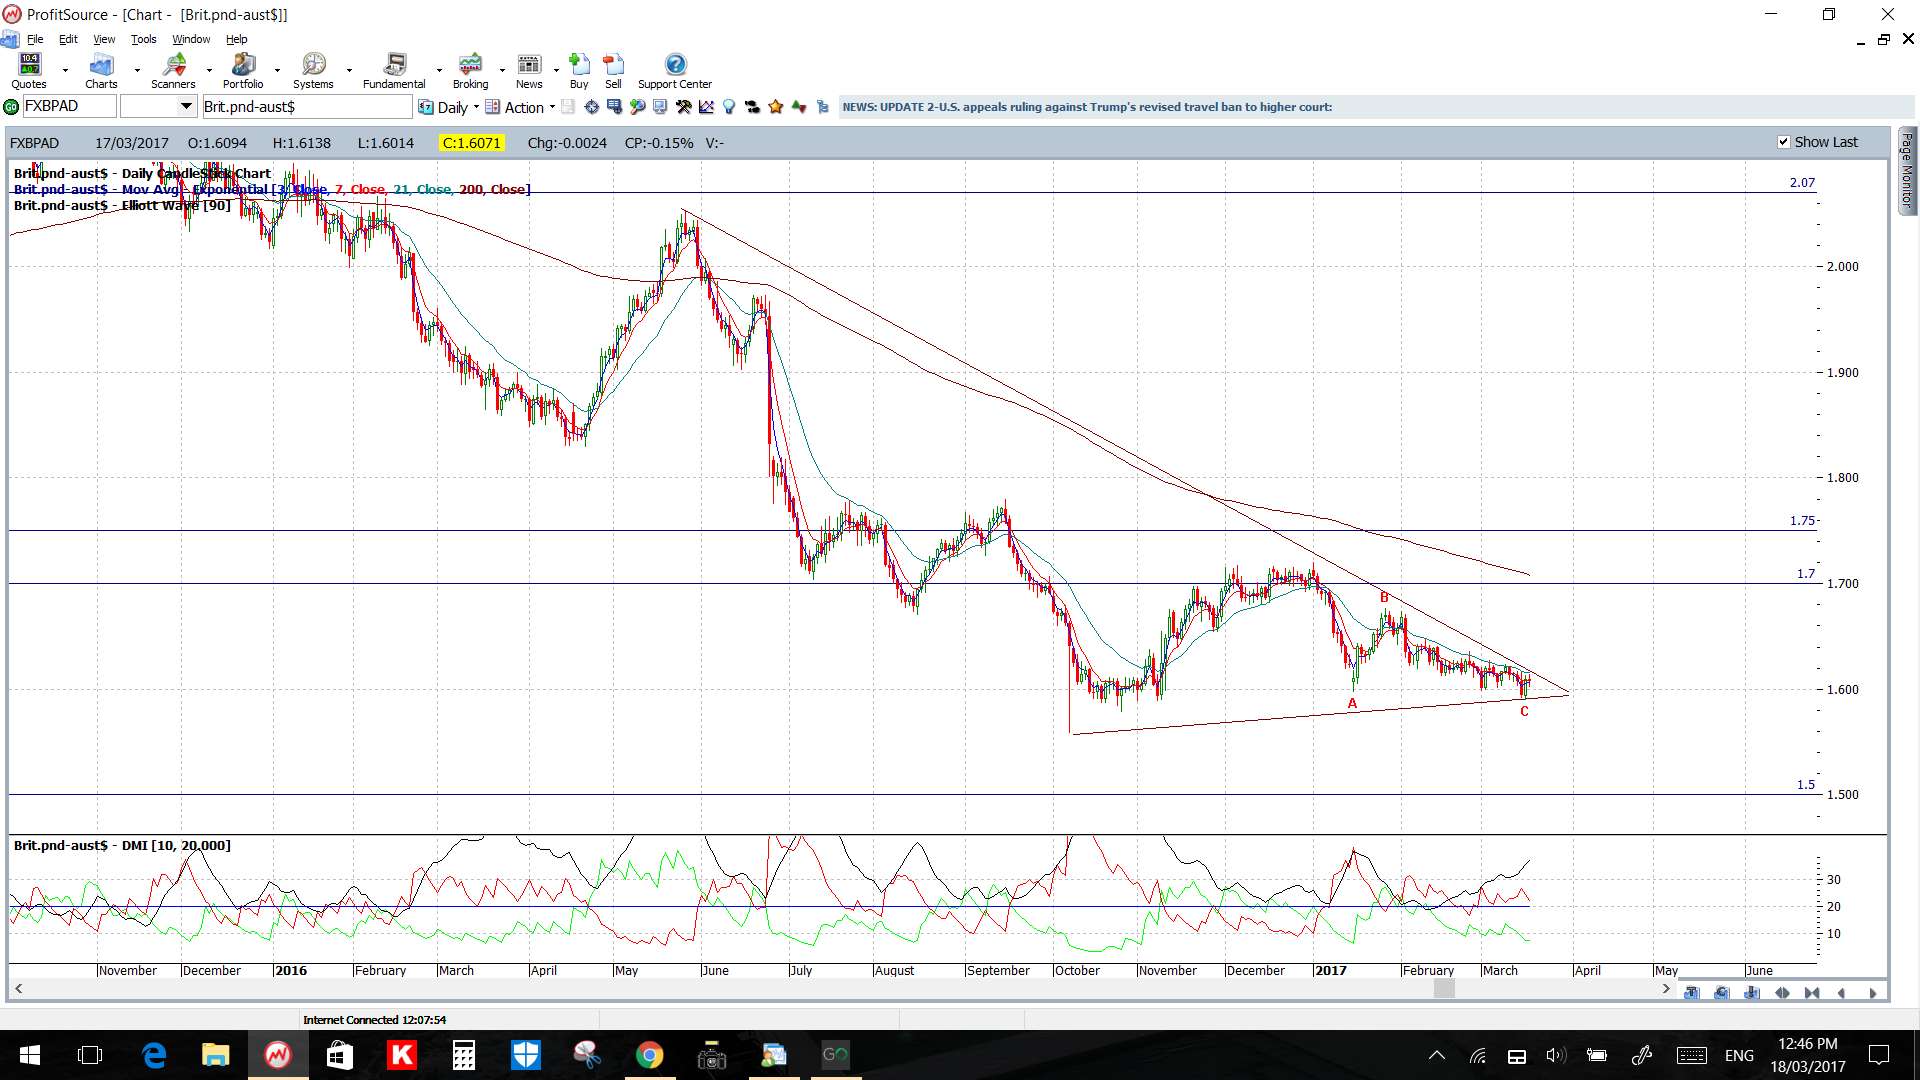
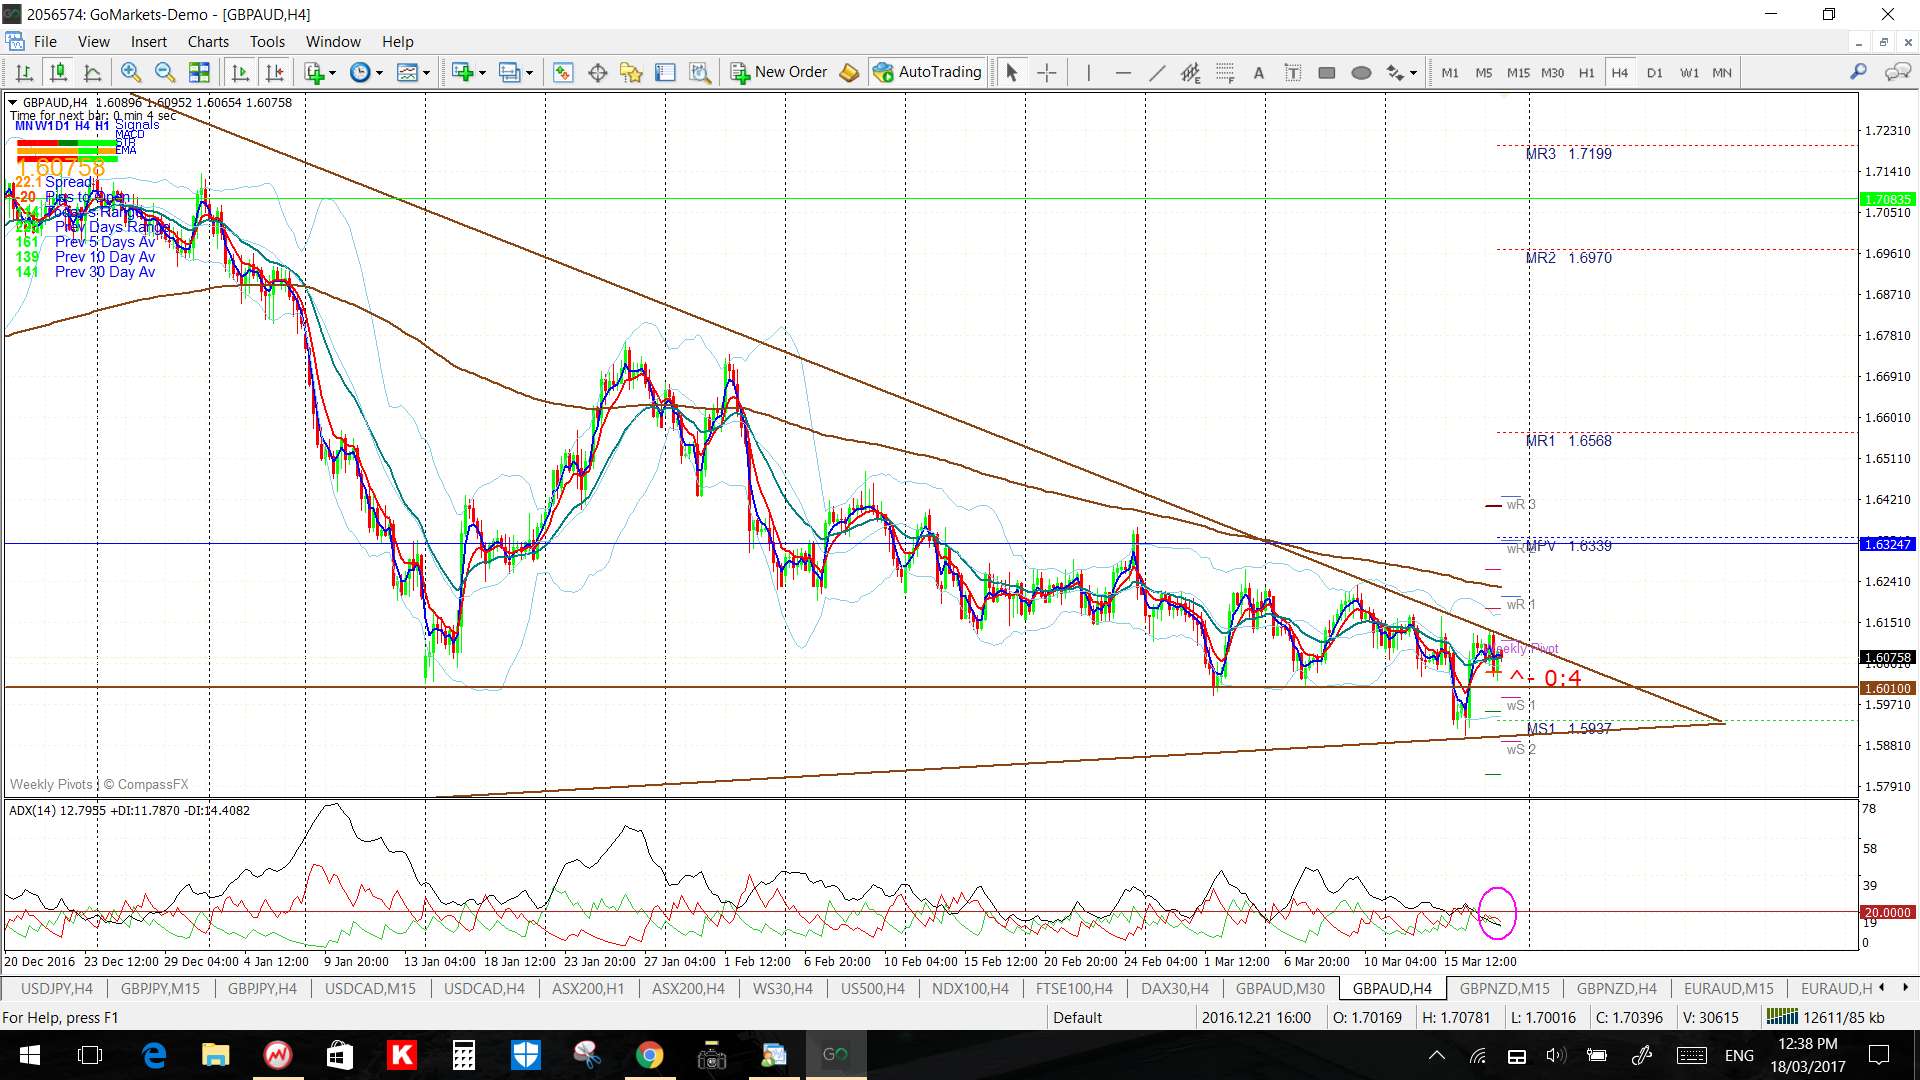
GBP/AUD: I’m watching the triangle trend lines for any momentum-based breakout.
Price is below the 4hr and daily Cloud.
The weekly candle closed as a bearish coloured Doji, making this the sixth consecutive indecision-style weekly candle!
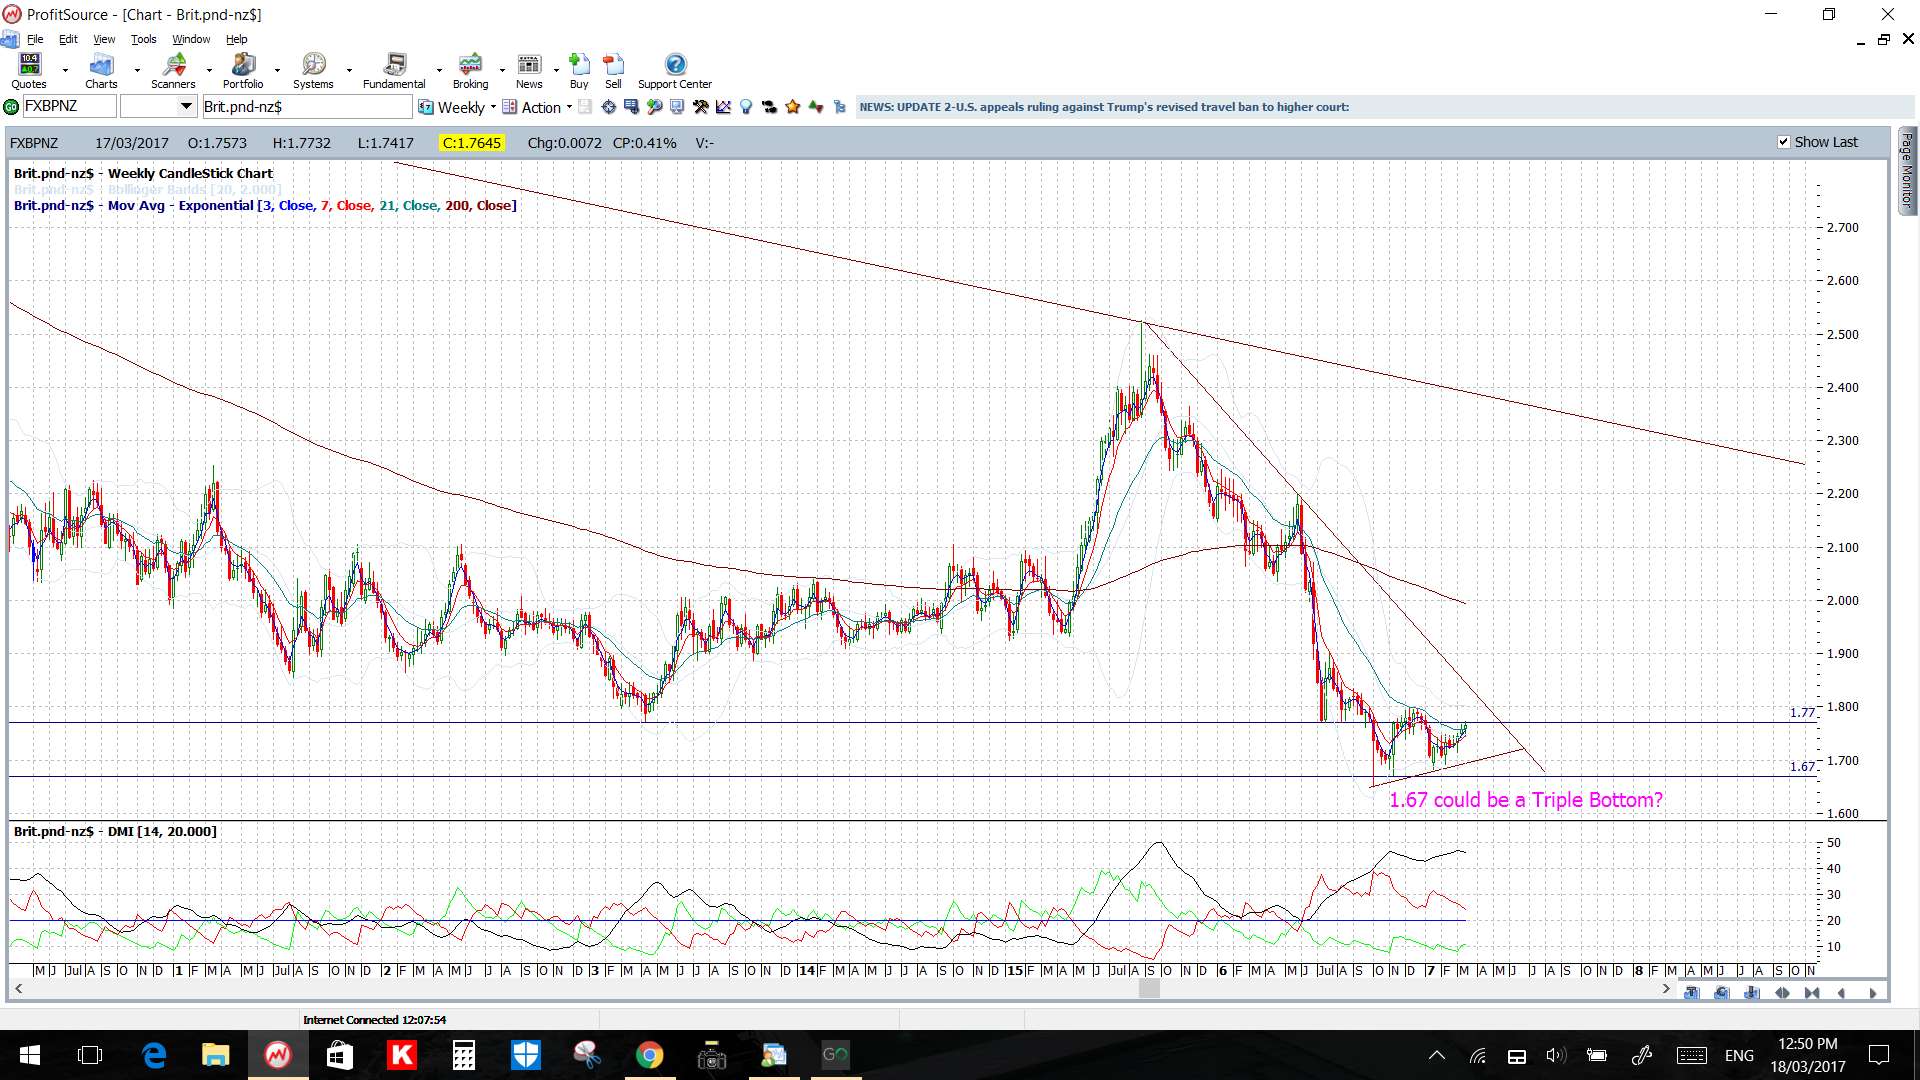
GBP/NZD: I’m watching the 4hr chart’s triangle trend lines and 1.77 level for any momentum-based breakout.
Price is above the 4hr and daily Cloud.
The weekly candle was bullish.

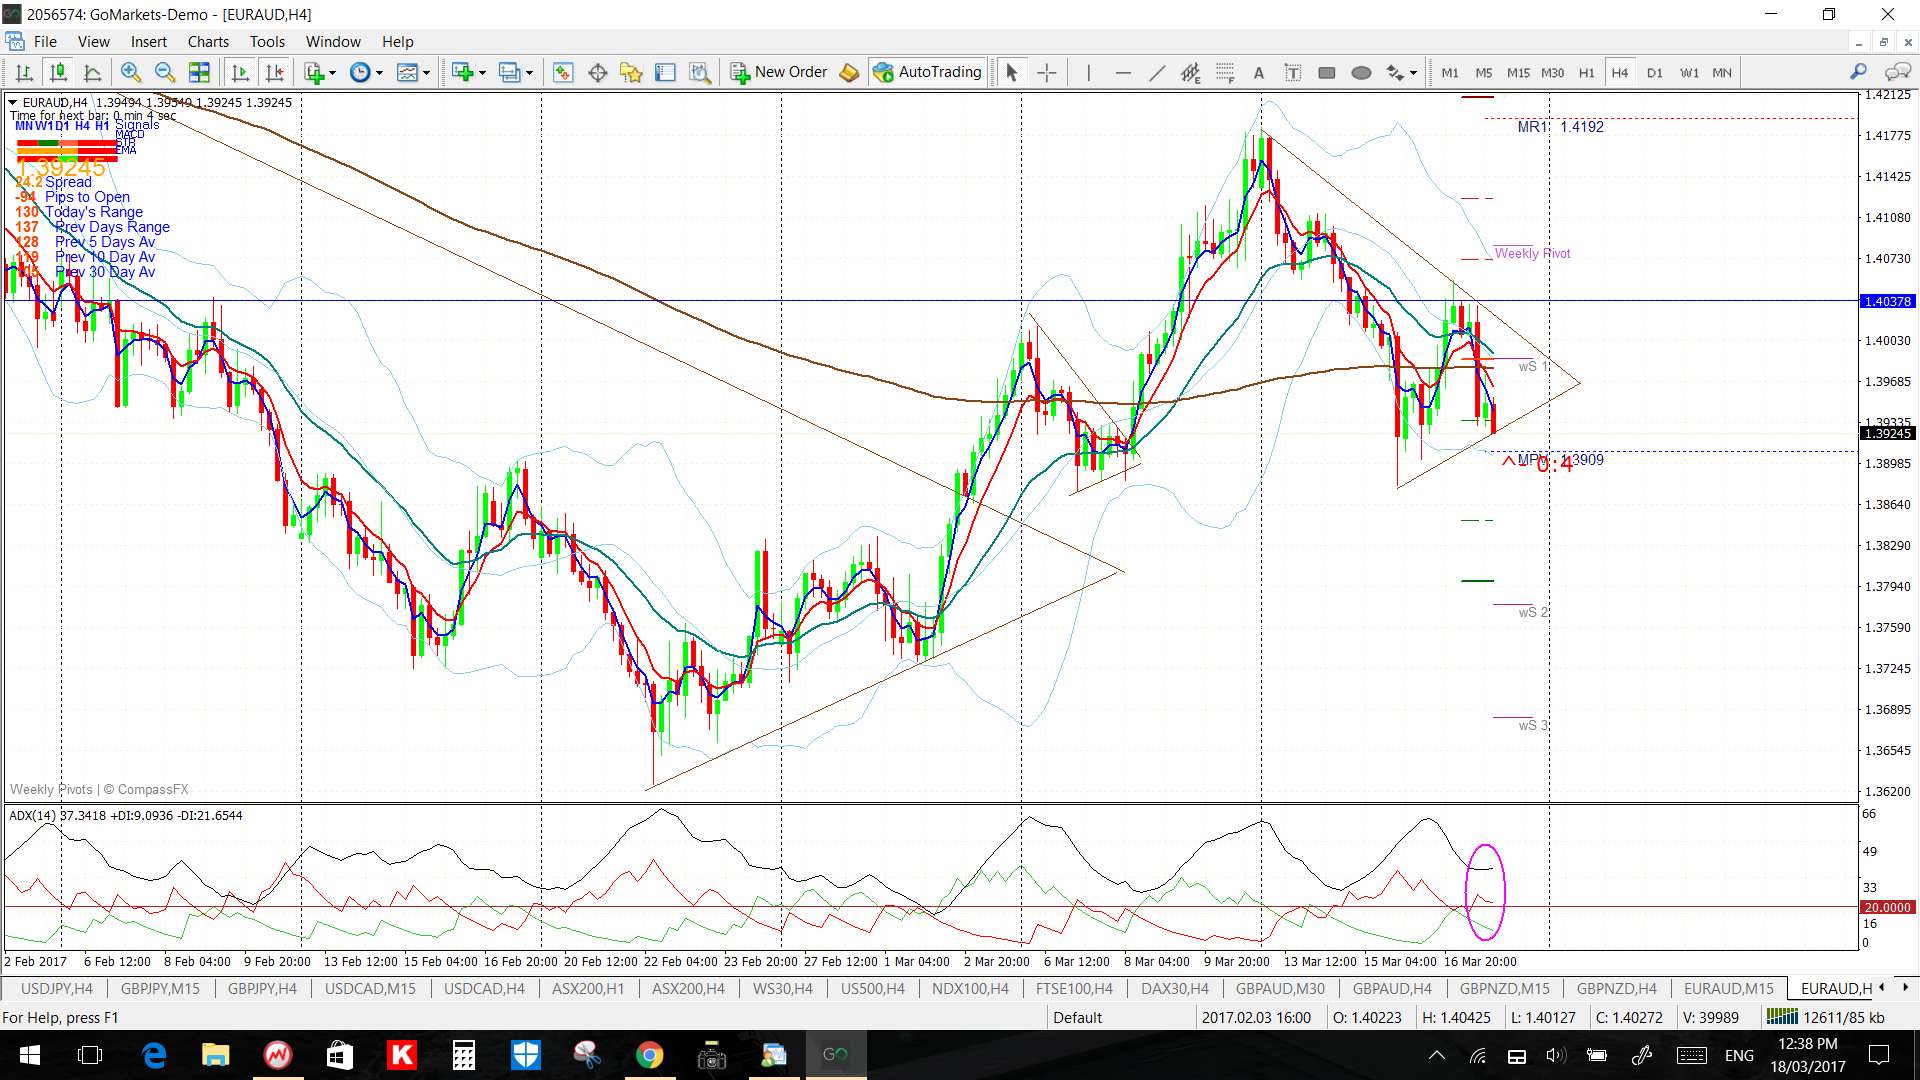
EUR/AUD: I’m watching the 4hr chart’s triangle trend lines for any momentum-based breakout.
Price is below the 4hr and daily Cloud.
The weekly candle was large and bearish.

EUR/NZD: I’m watching the 4hr chart’s wedge trend lines for any momentum-based breakout.
Price is in the 4hr Cloud but above the daily Cloud.
The weekly candle closed as a bearish colored ‘Inside’ candle reflecting indecision.


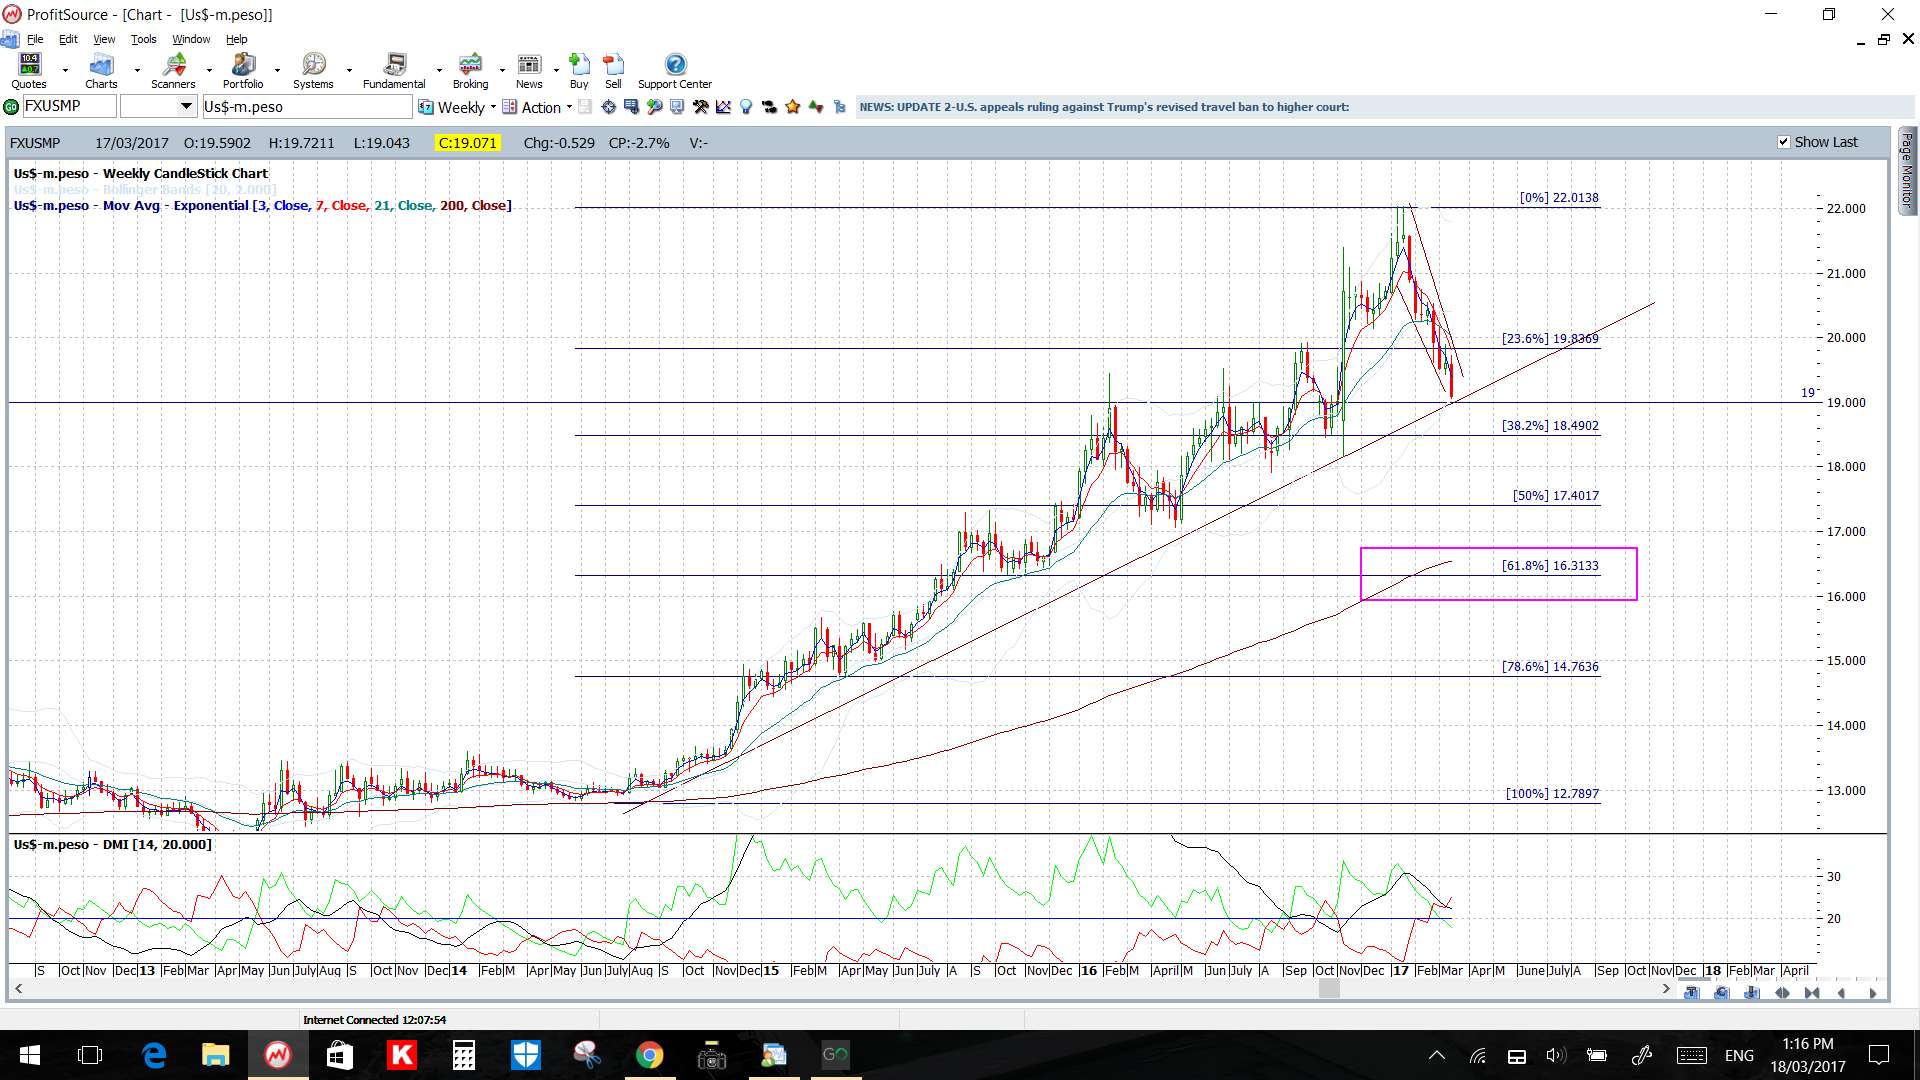
USD/MXN: This pair continues in the descending trading channel but price is now down near major support from the weekly support trend line and the whole-number and previous S/R level of 19.
Price is below the 4hr and daily Cloud.
The weekly candle was large bearish and, essentially, engulfing.
USD/CNH: I’m watching the 4hr chart’s wedge trend lines for any momentum-based breakout.
Price is just below the 4hr Cloud and just above the daily Cloud.
The weekly candle was a bullish coloured Doji reflecting indecision.
USD/TRY: I’m watching the wedge trend lines for any momentum-based breakout.
Price is below the 4hr and daily Cloud.
The weekly candle was a large, bearish and, essentially, an engulfing candle.
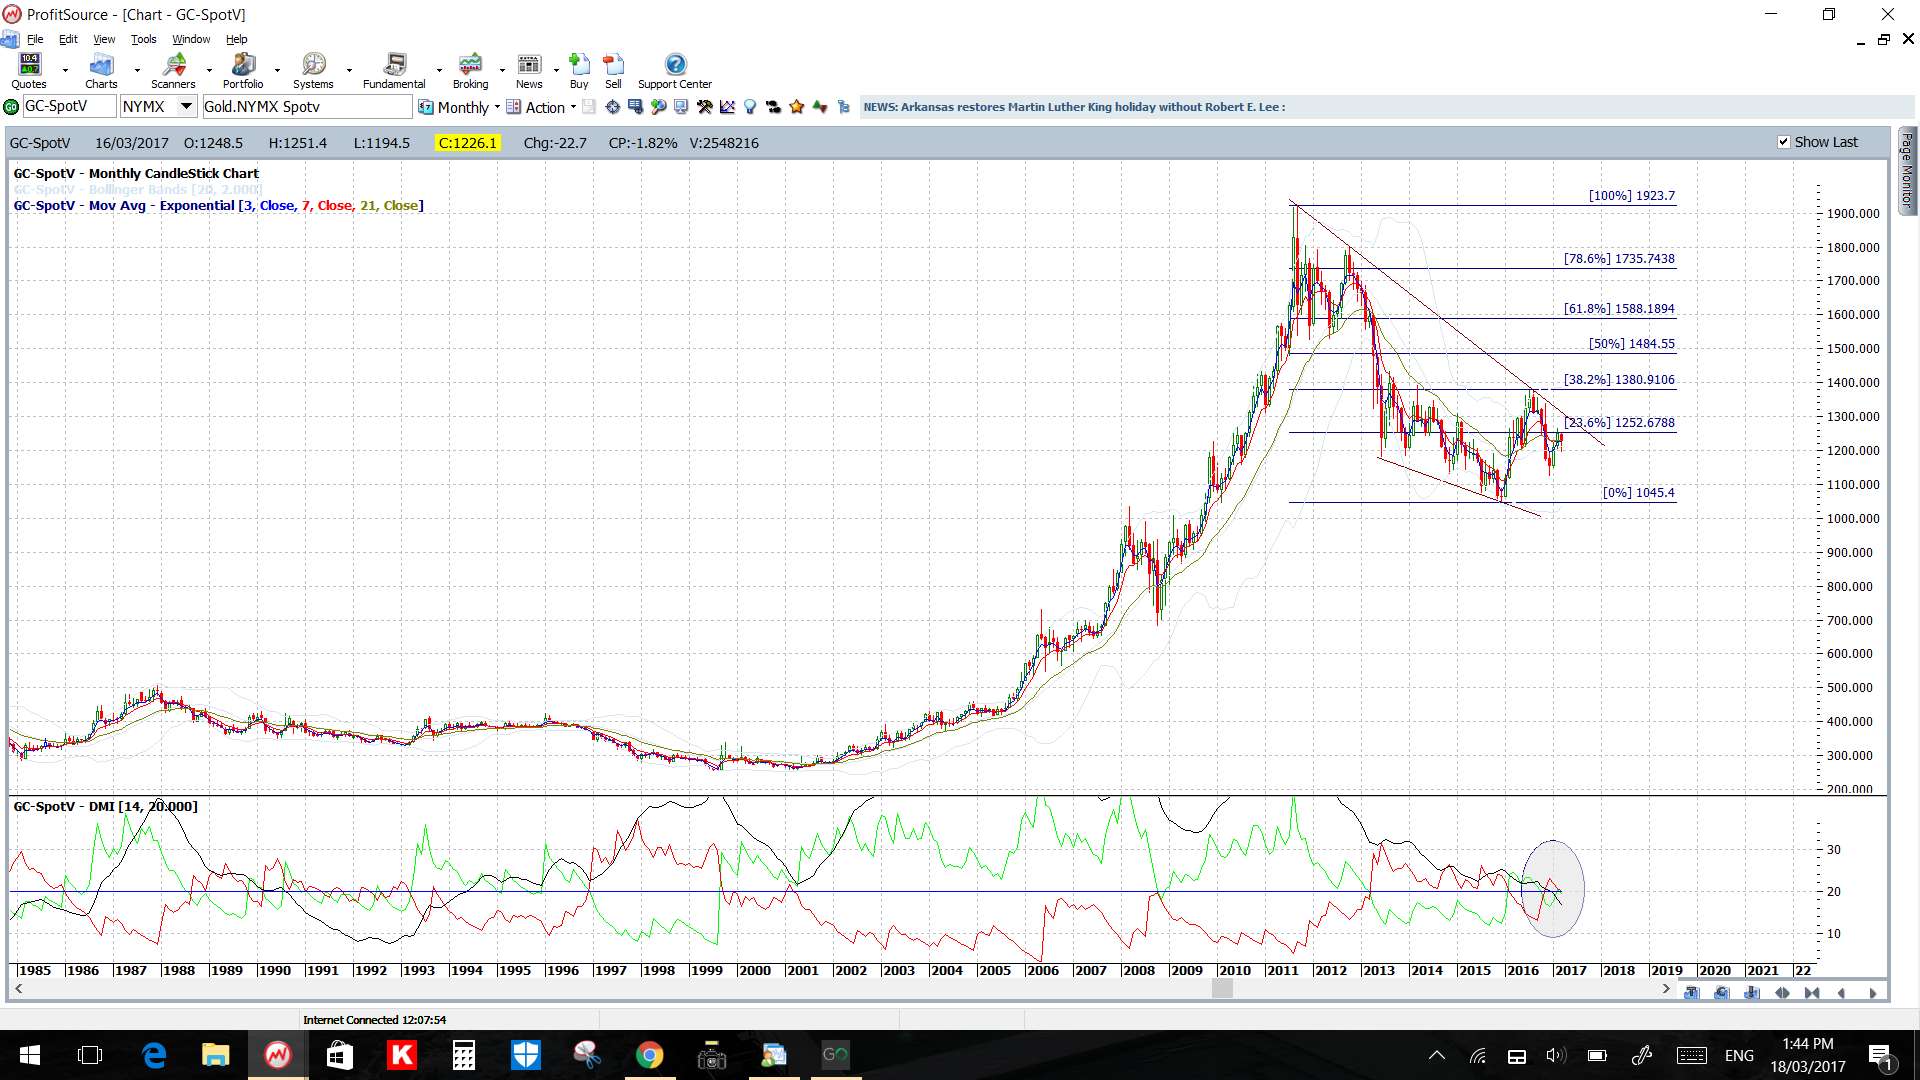
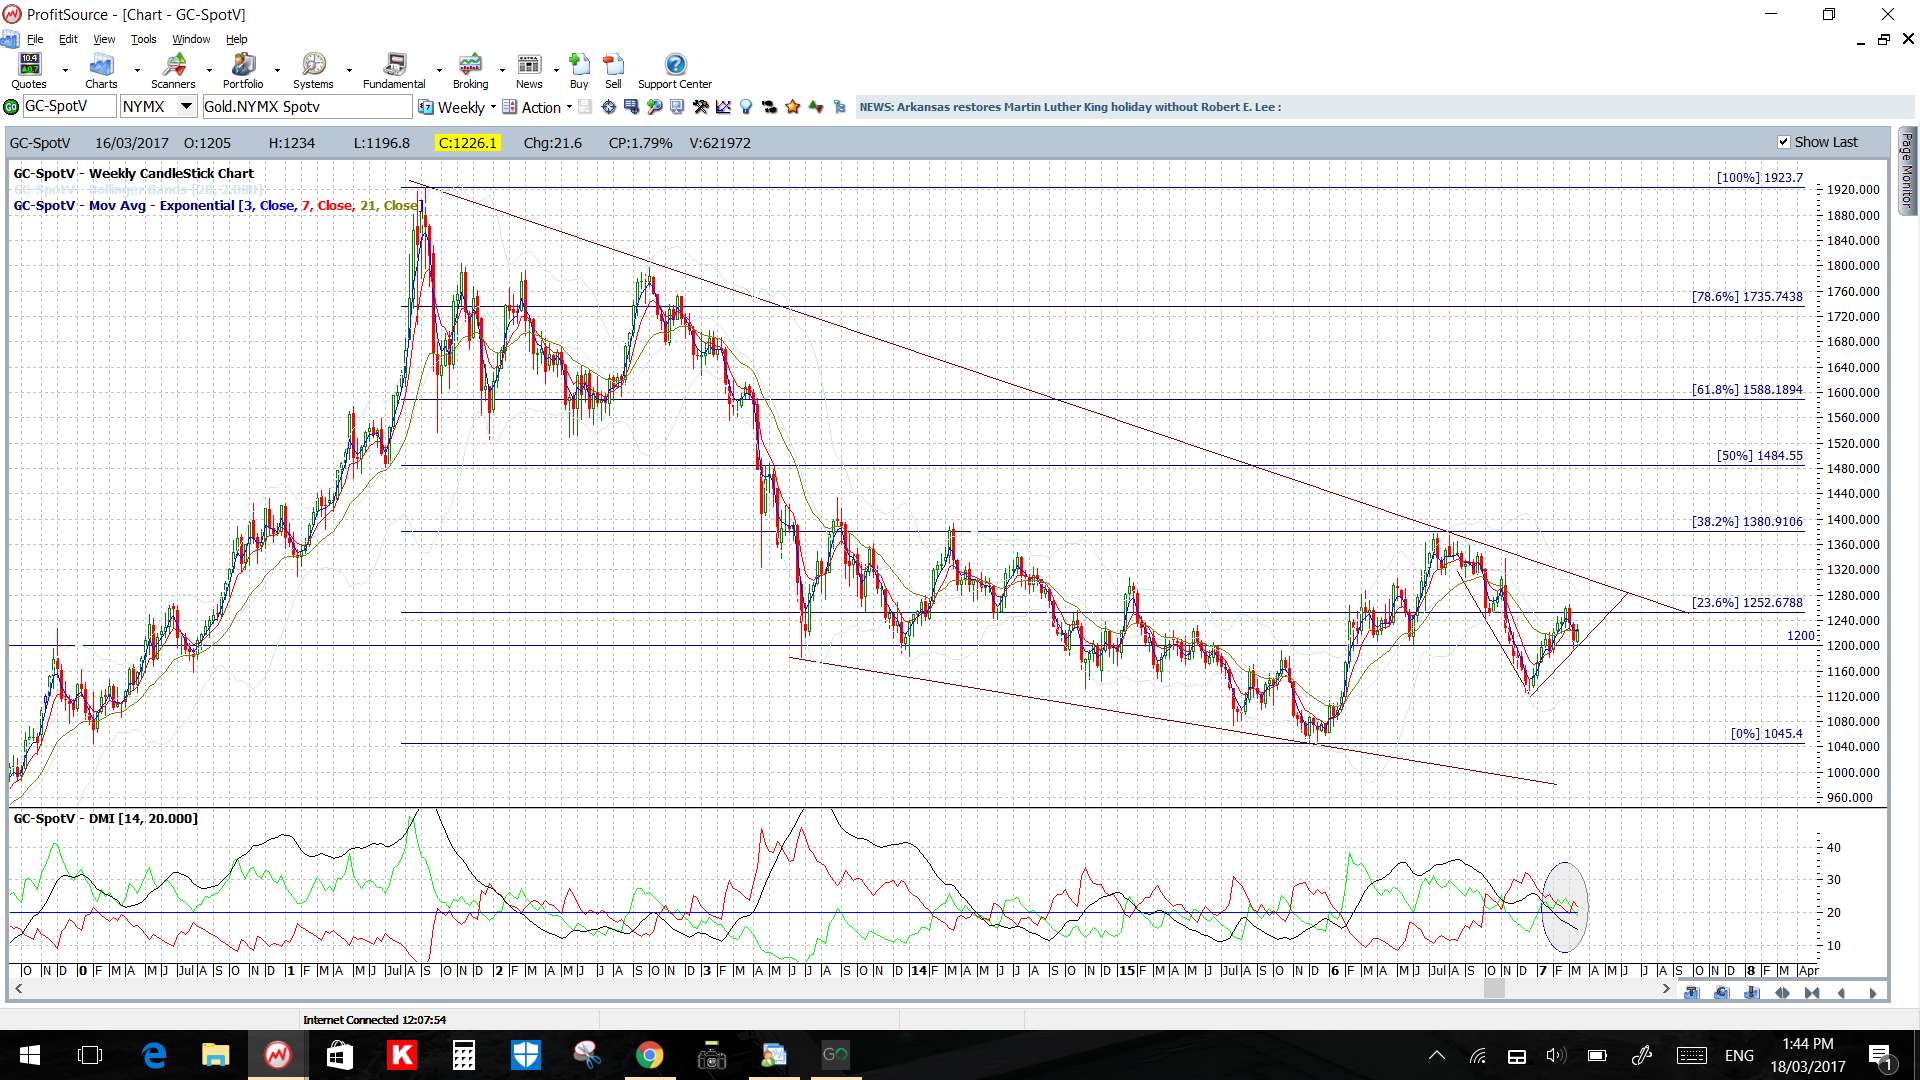
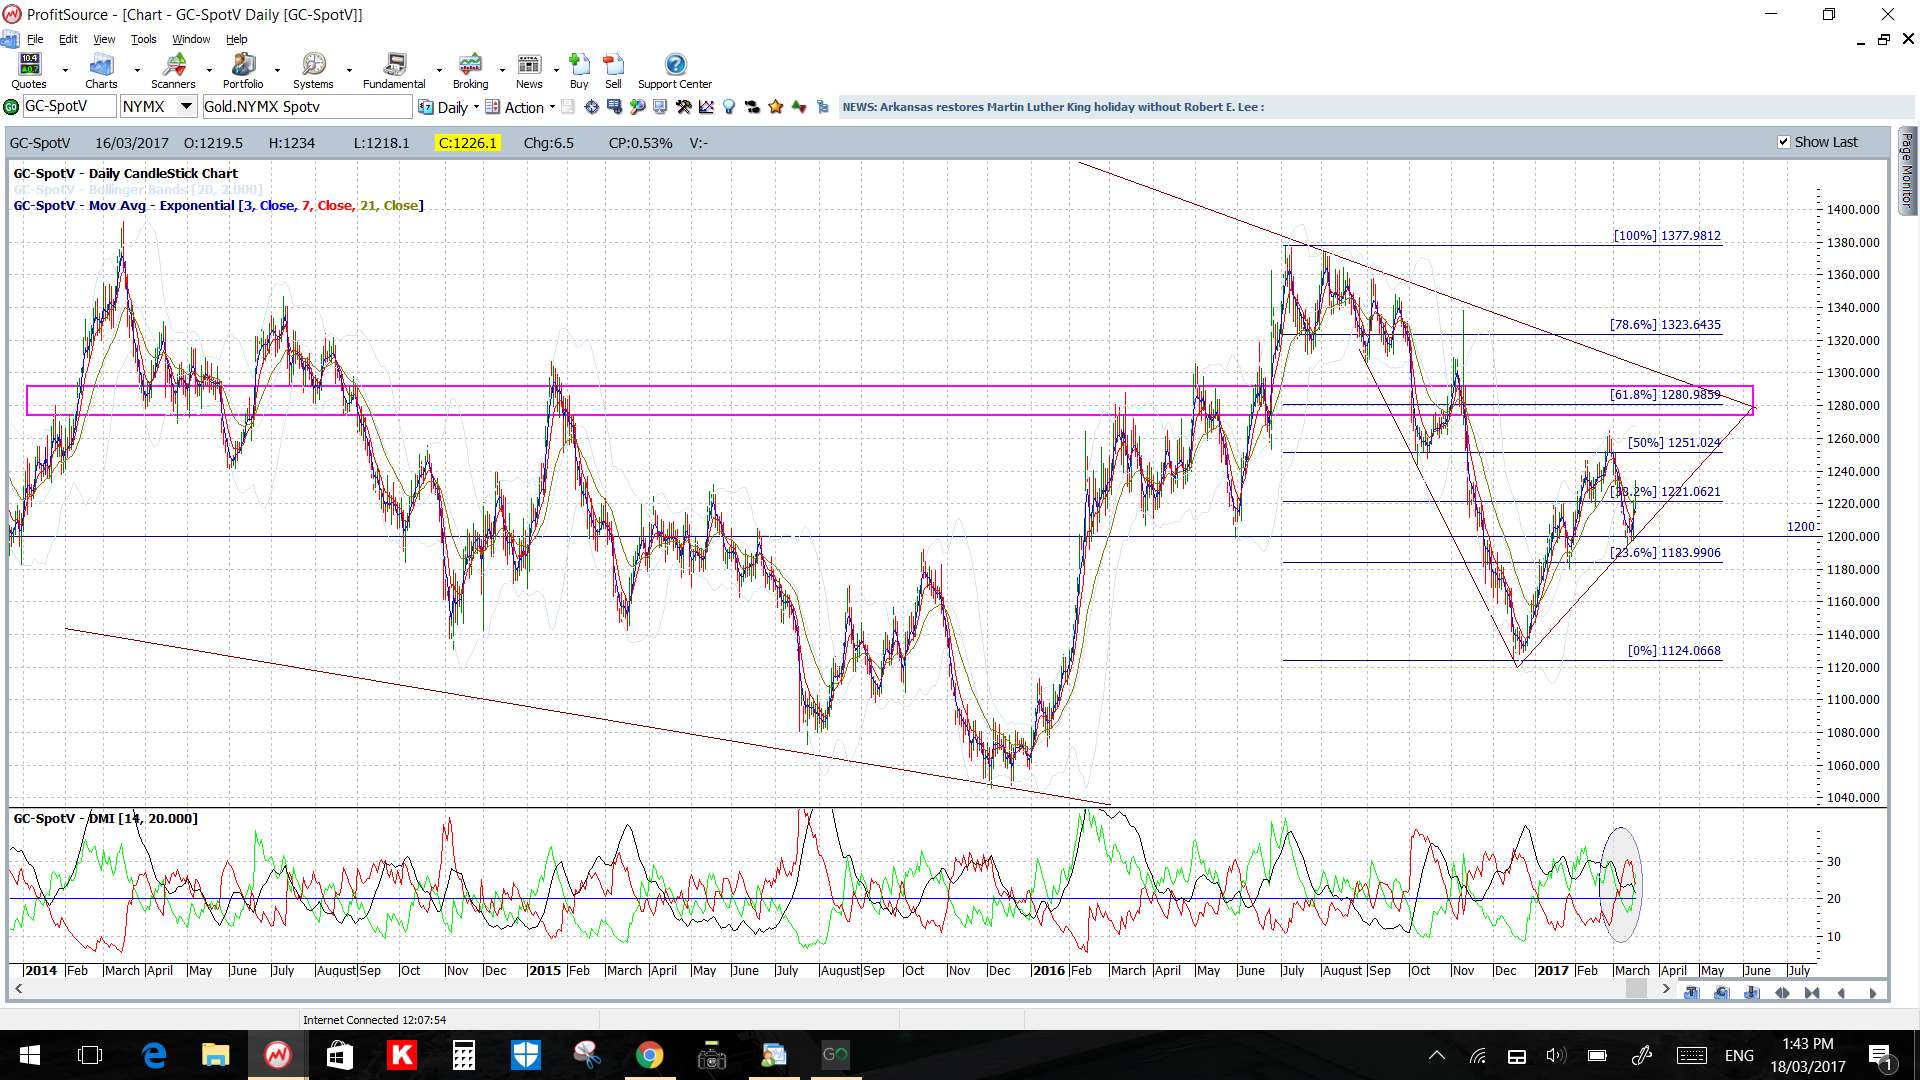
Gold: I’m watching the 4hr chart’s triangle trend lines for any momentum-based breakout.
Price is above the 4hr and daily Cloud.
The weekly candle was a bullish coloured ‘Inside’ candle reflecting indecision.
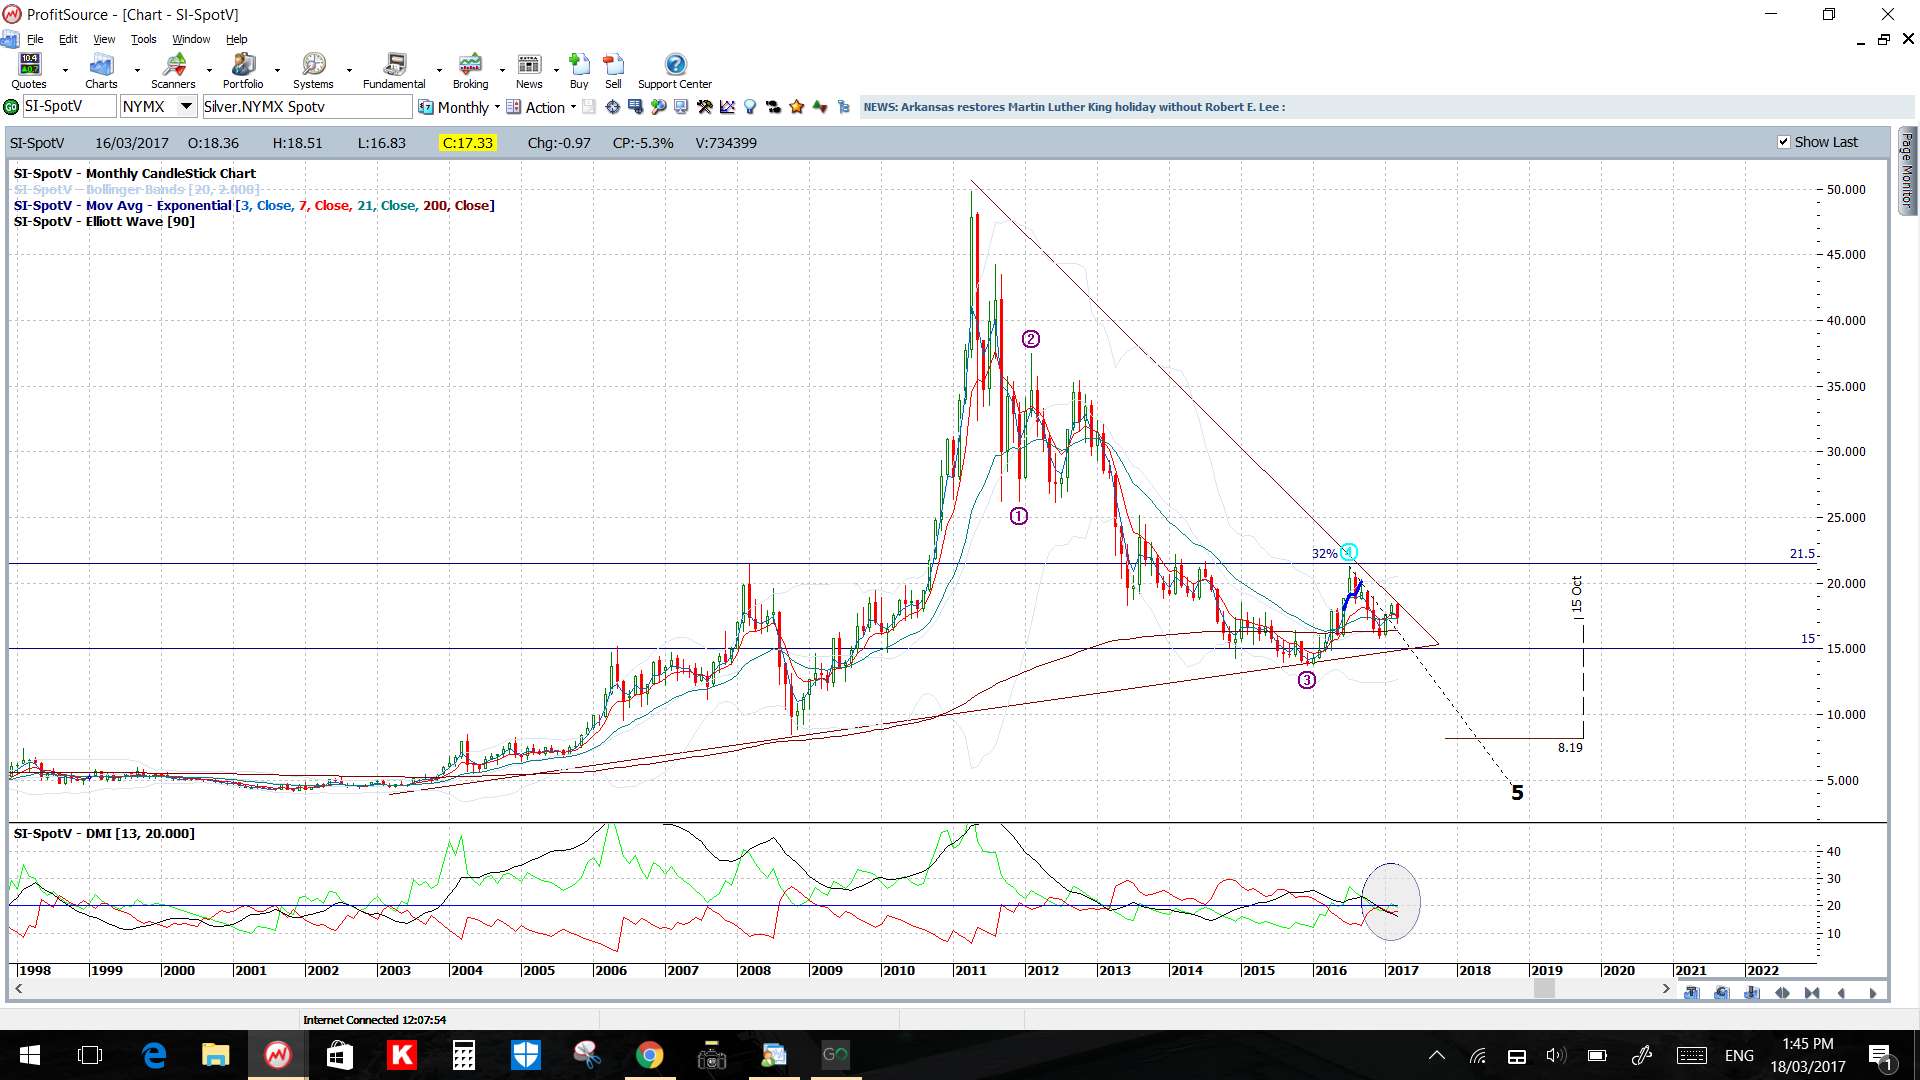
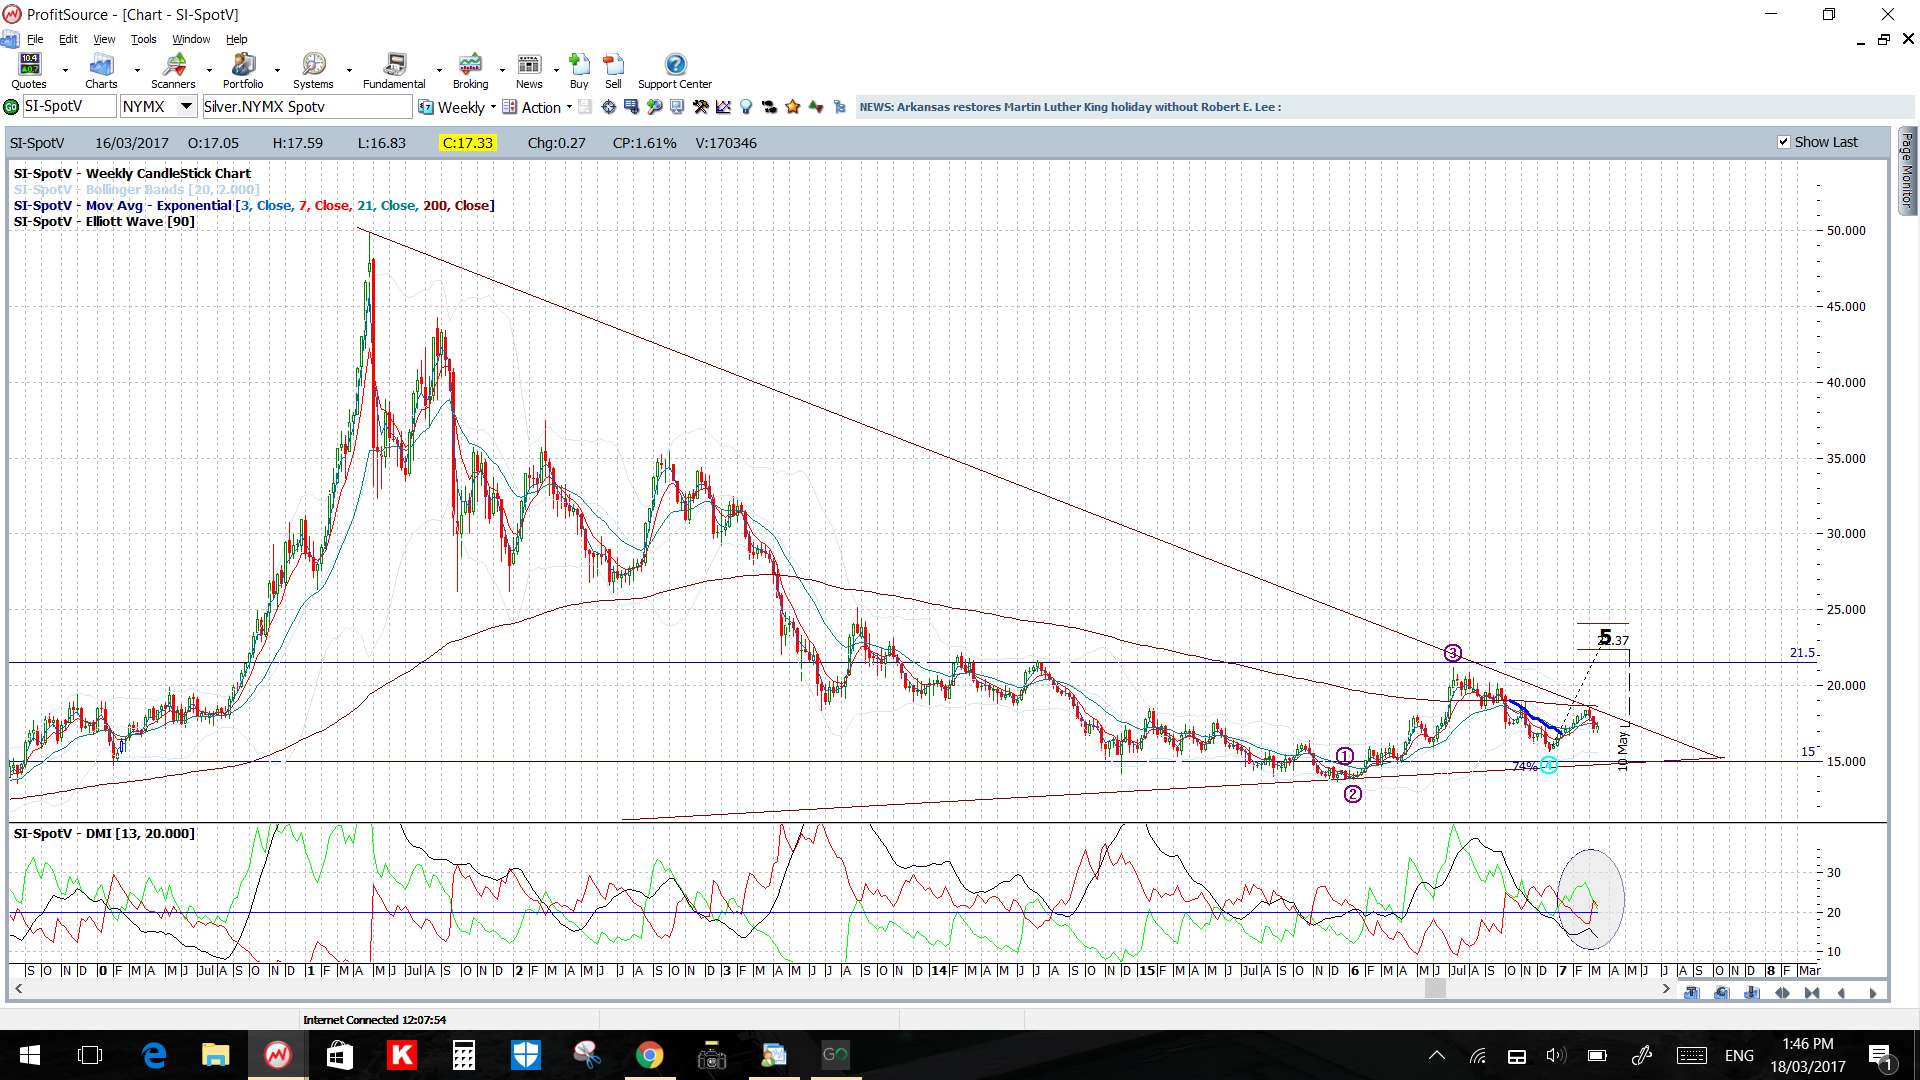
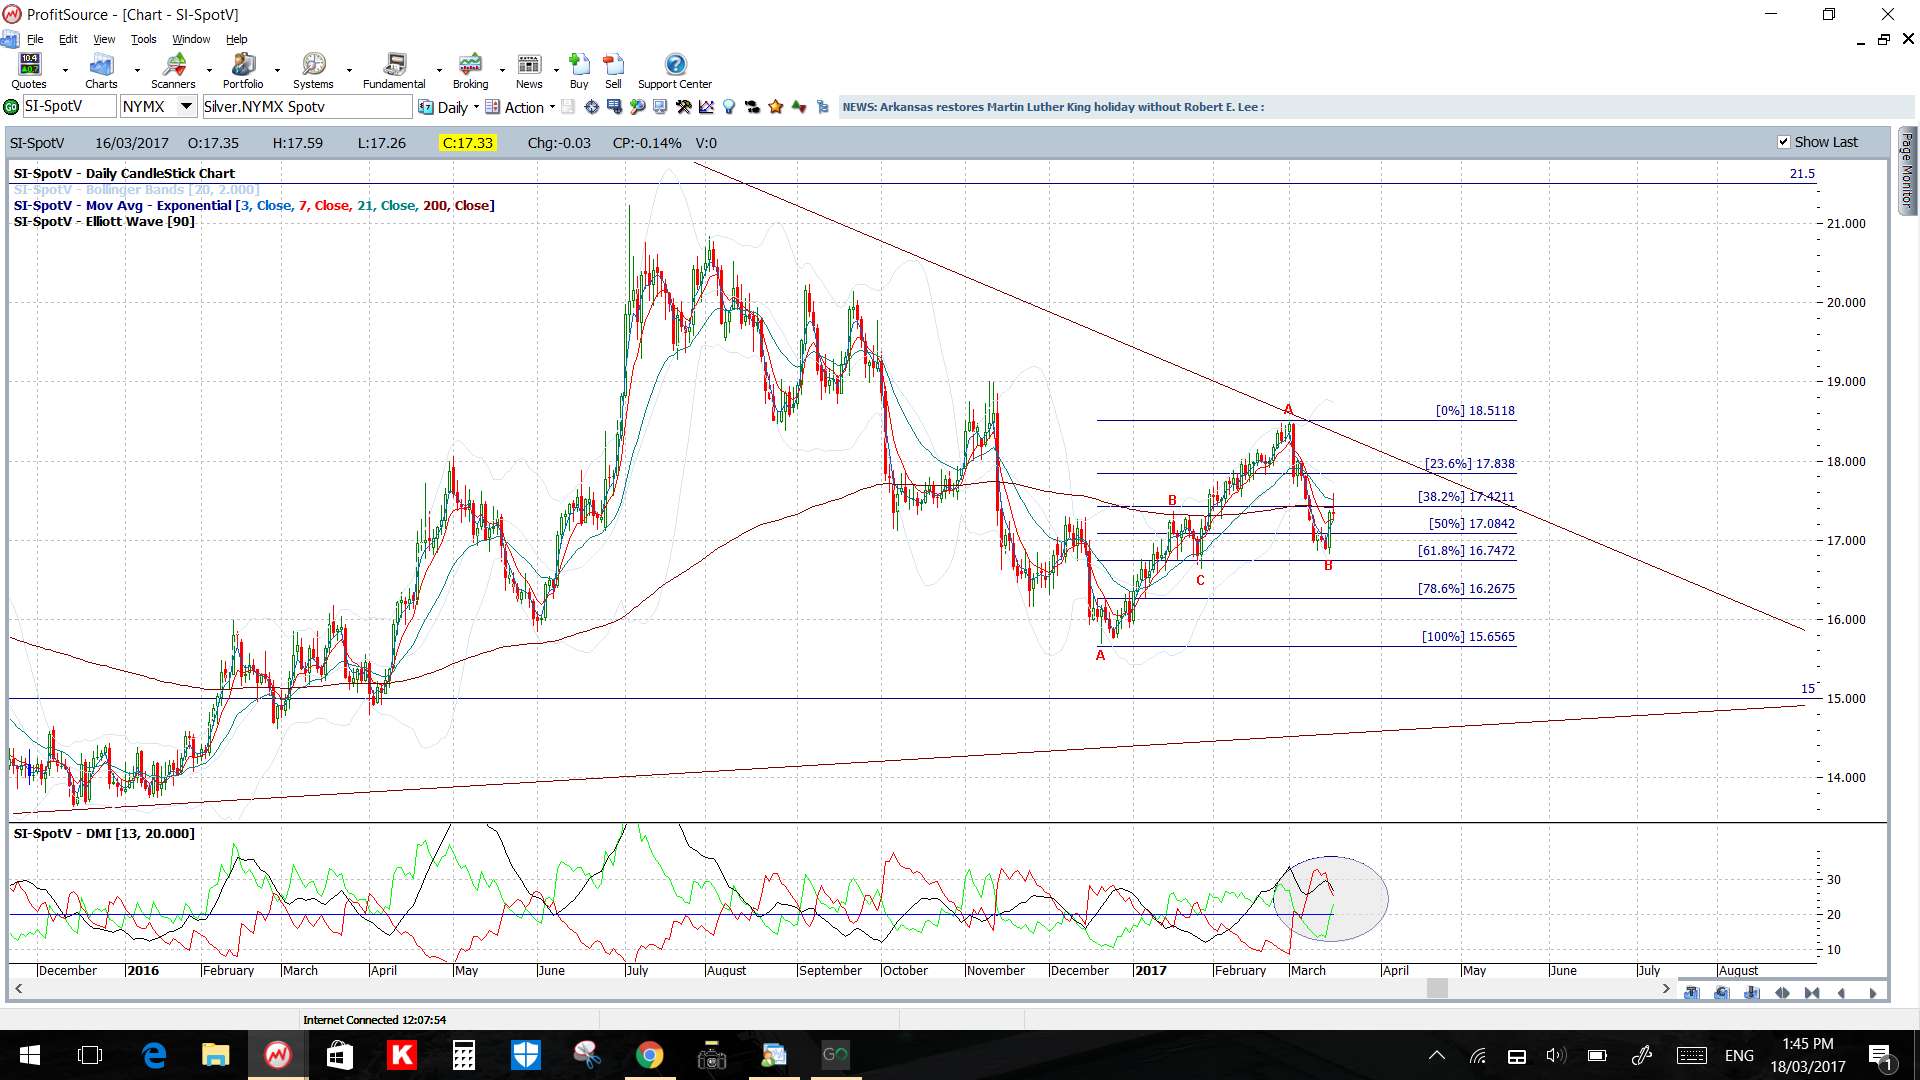
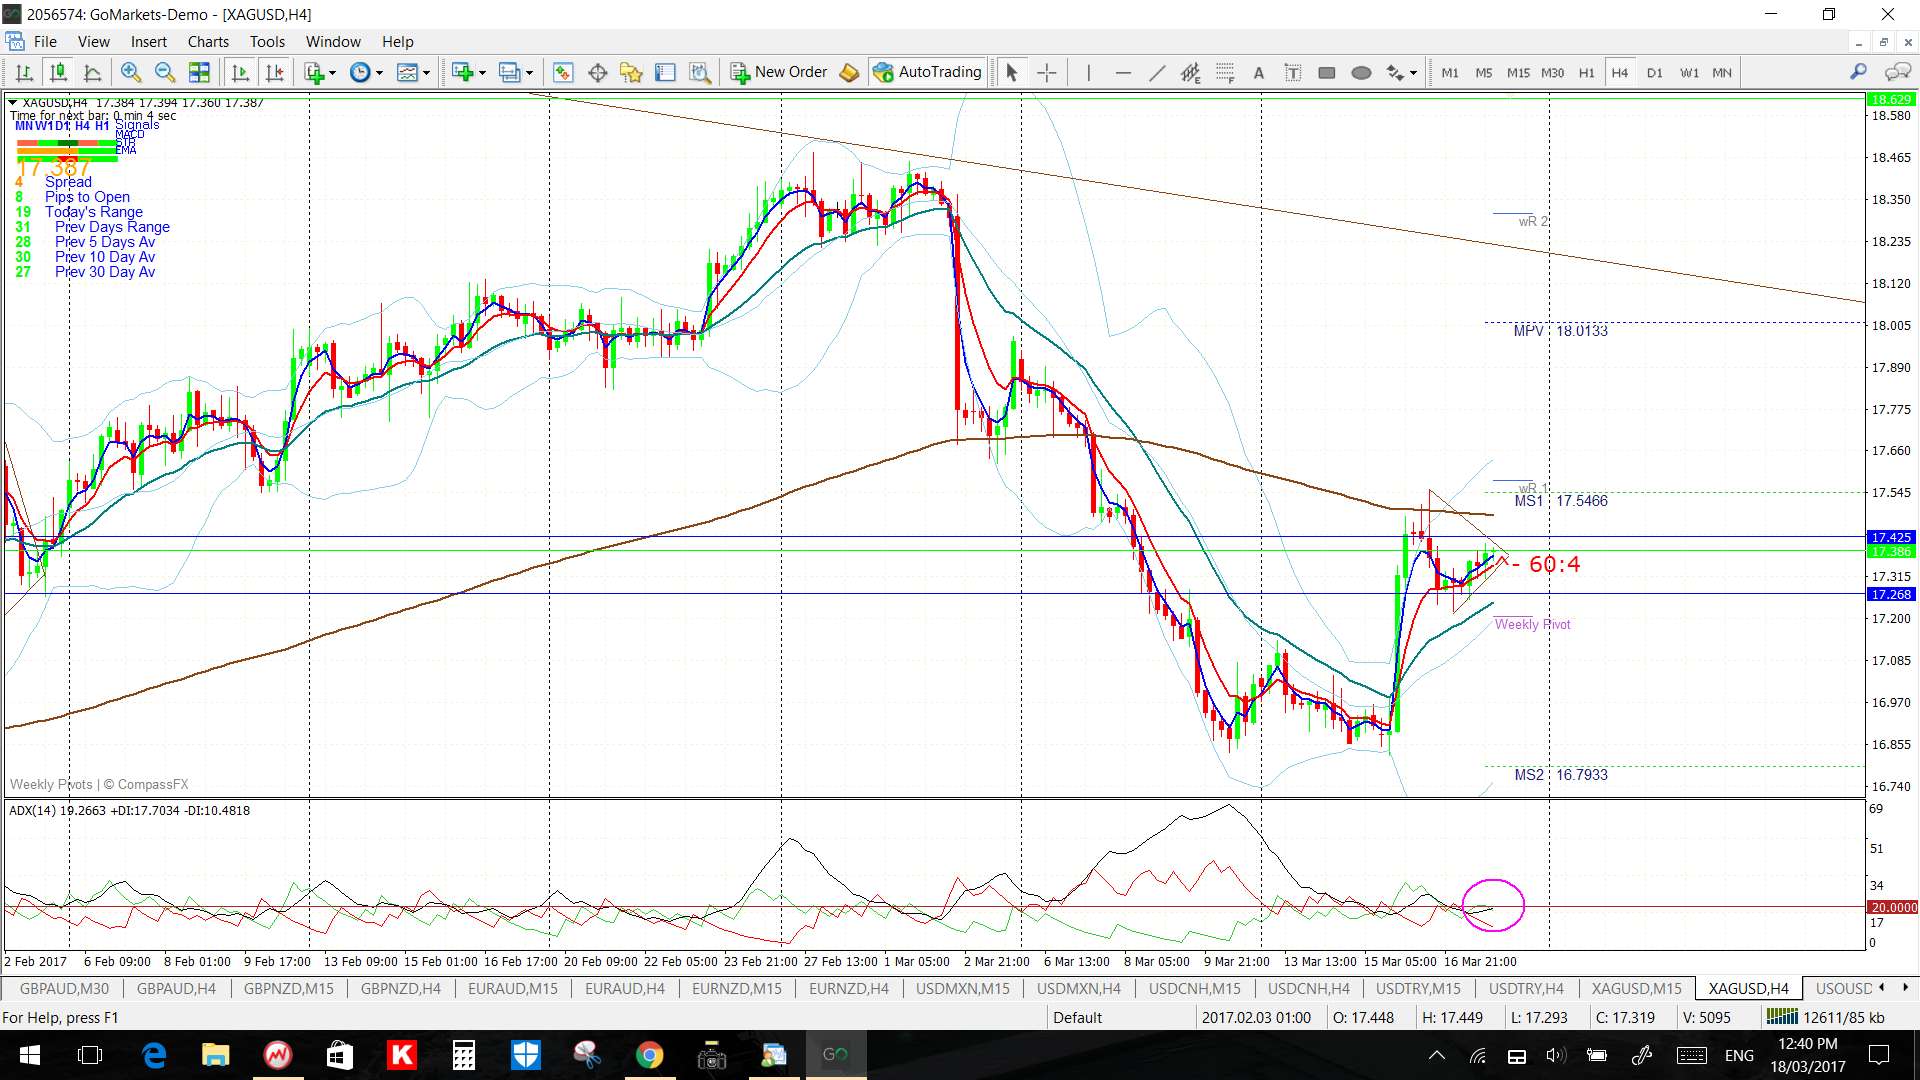
Silver: I’m watching the 4hr chart’s triangle trend lines for any momentum-based breakout.
Price is in the 4hr Cloud and just above the daily Cloud.
The weekly candle was a bullish coloured ‘Inside’ candle reflecting indecision.
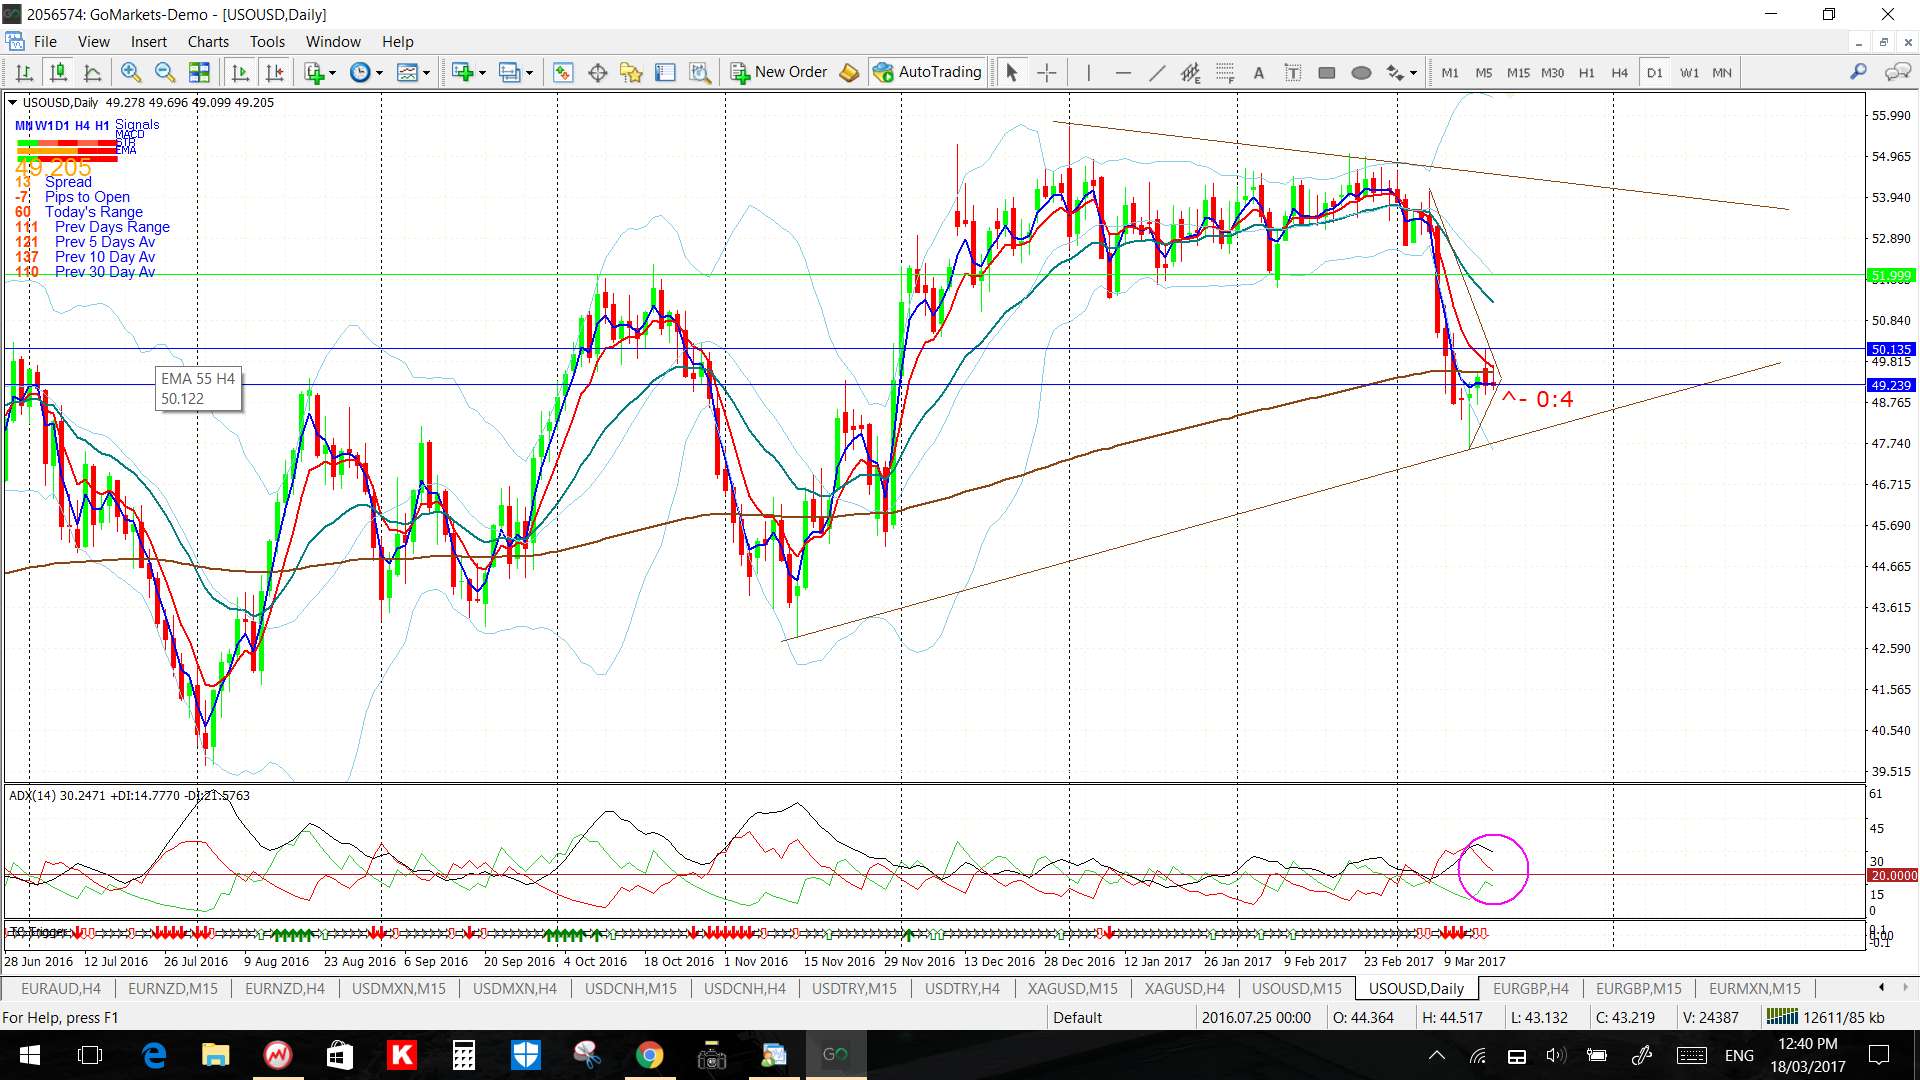
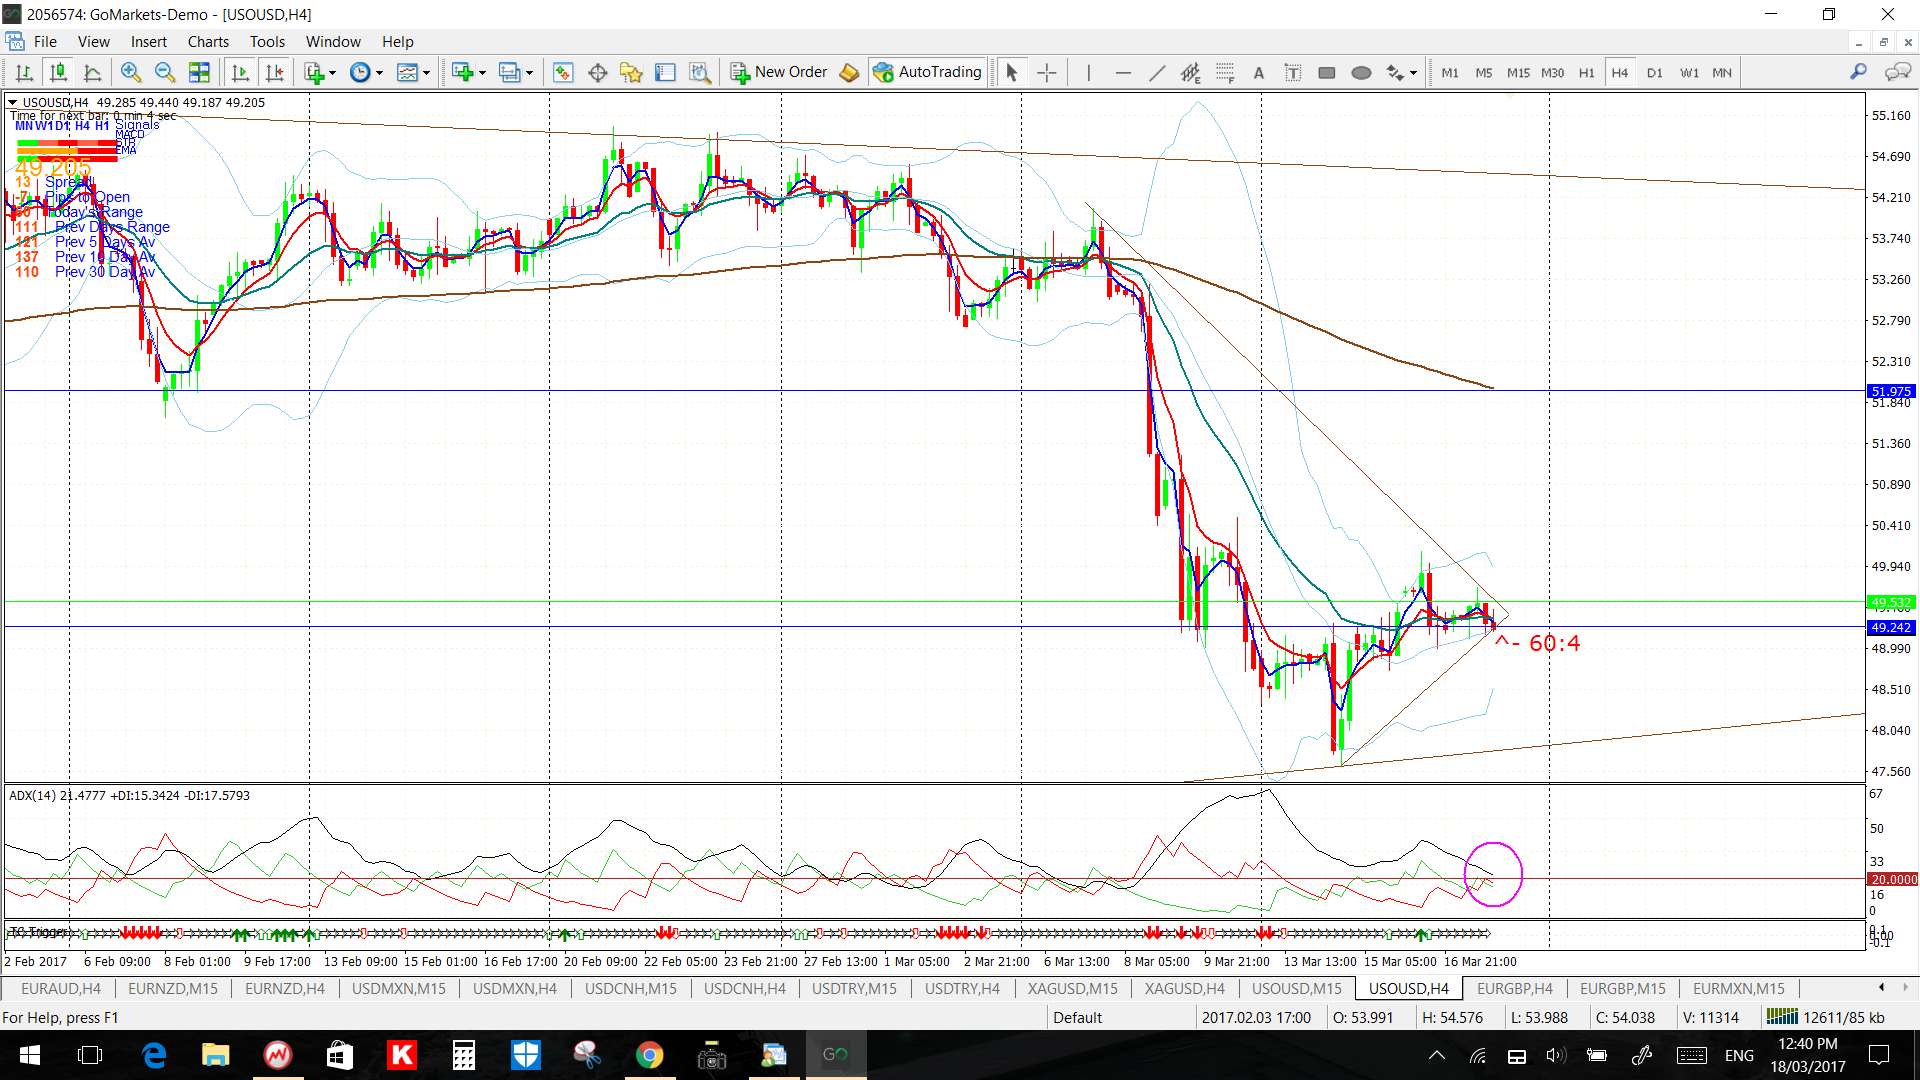
Oil: I’m watching the 4hr chart’s triangle trend lines for any momentum-based breakout.
Price is below the 4hr and daily Cloud.
The weekly candle was a bullish coloured ‘Spinning Top’ reflecting indecision.
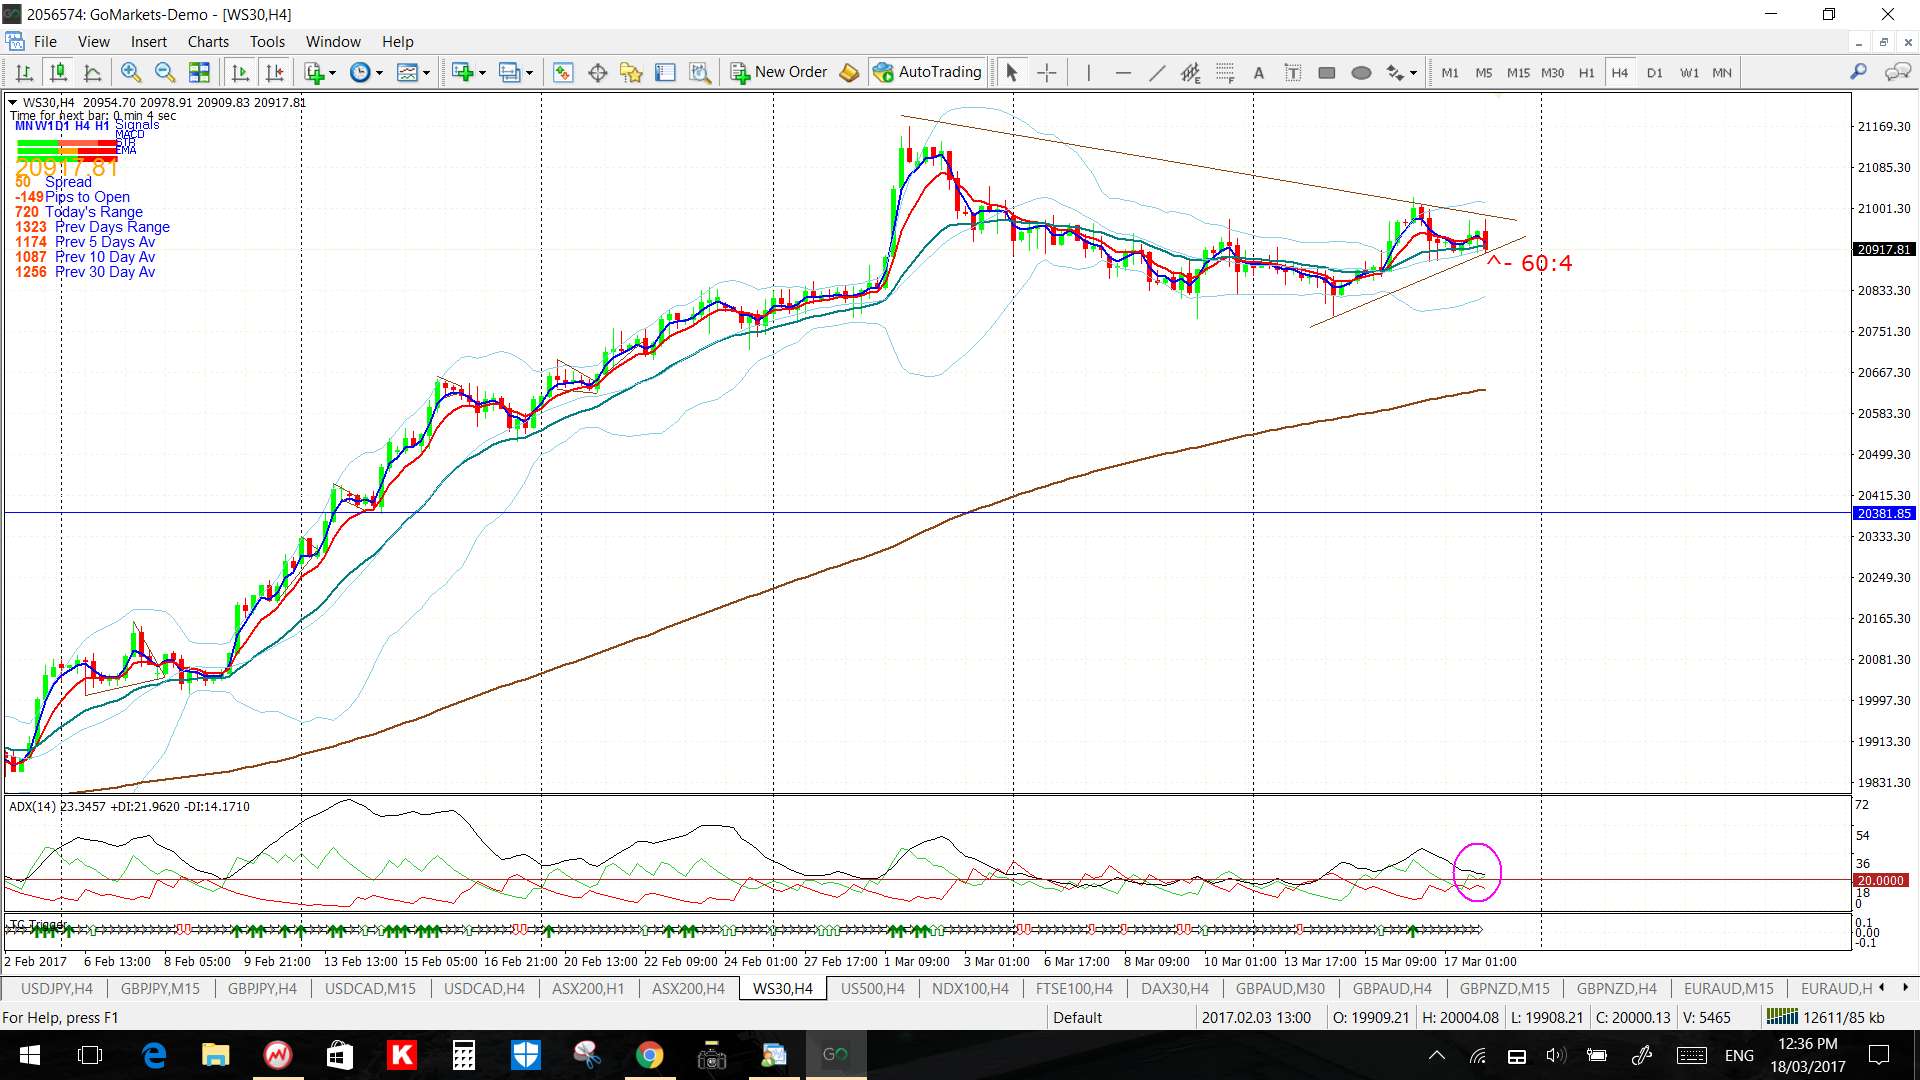
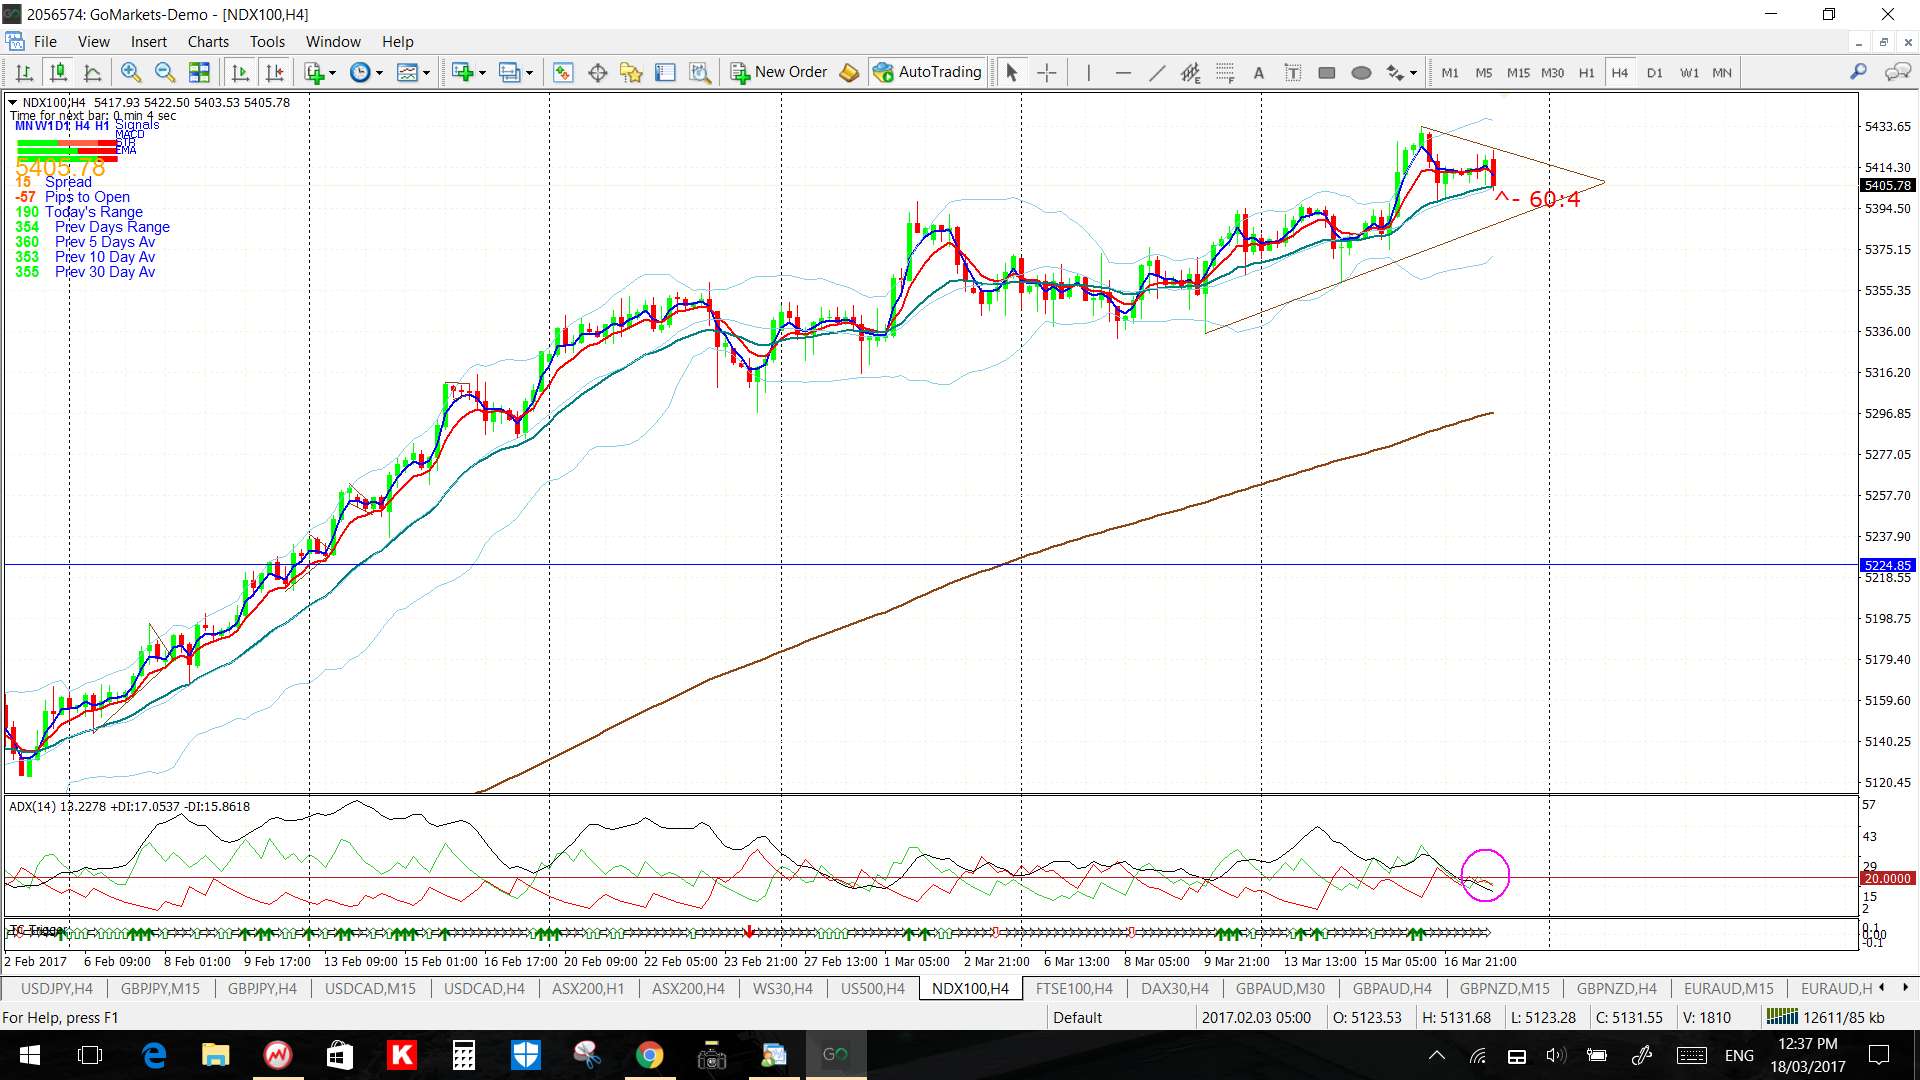
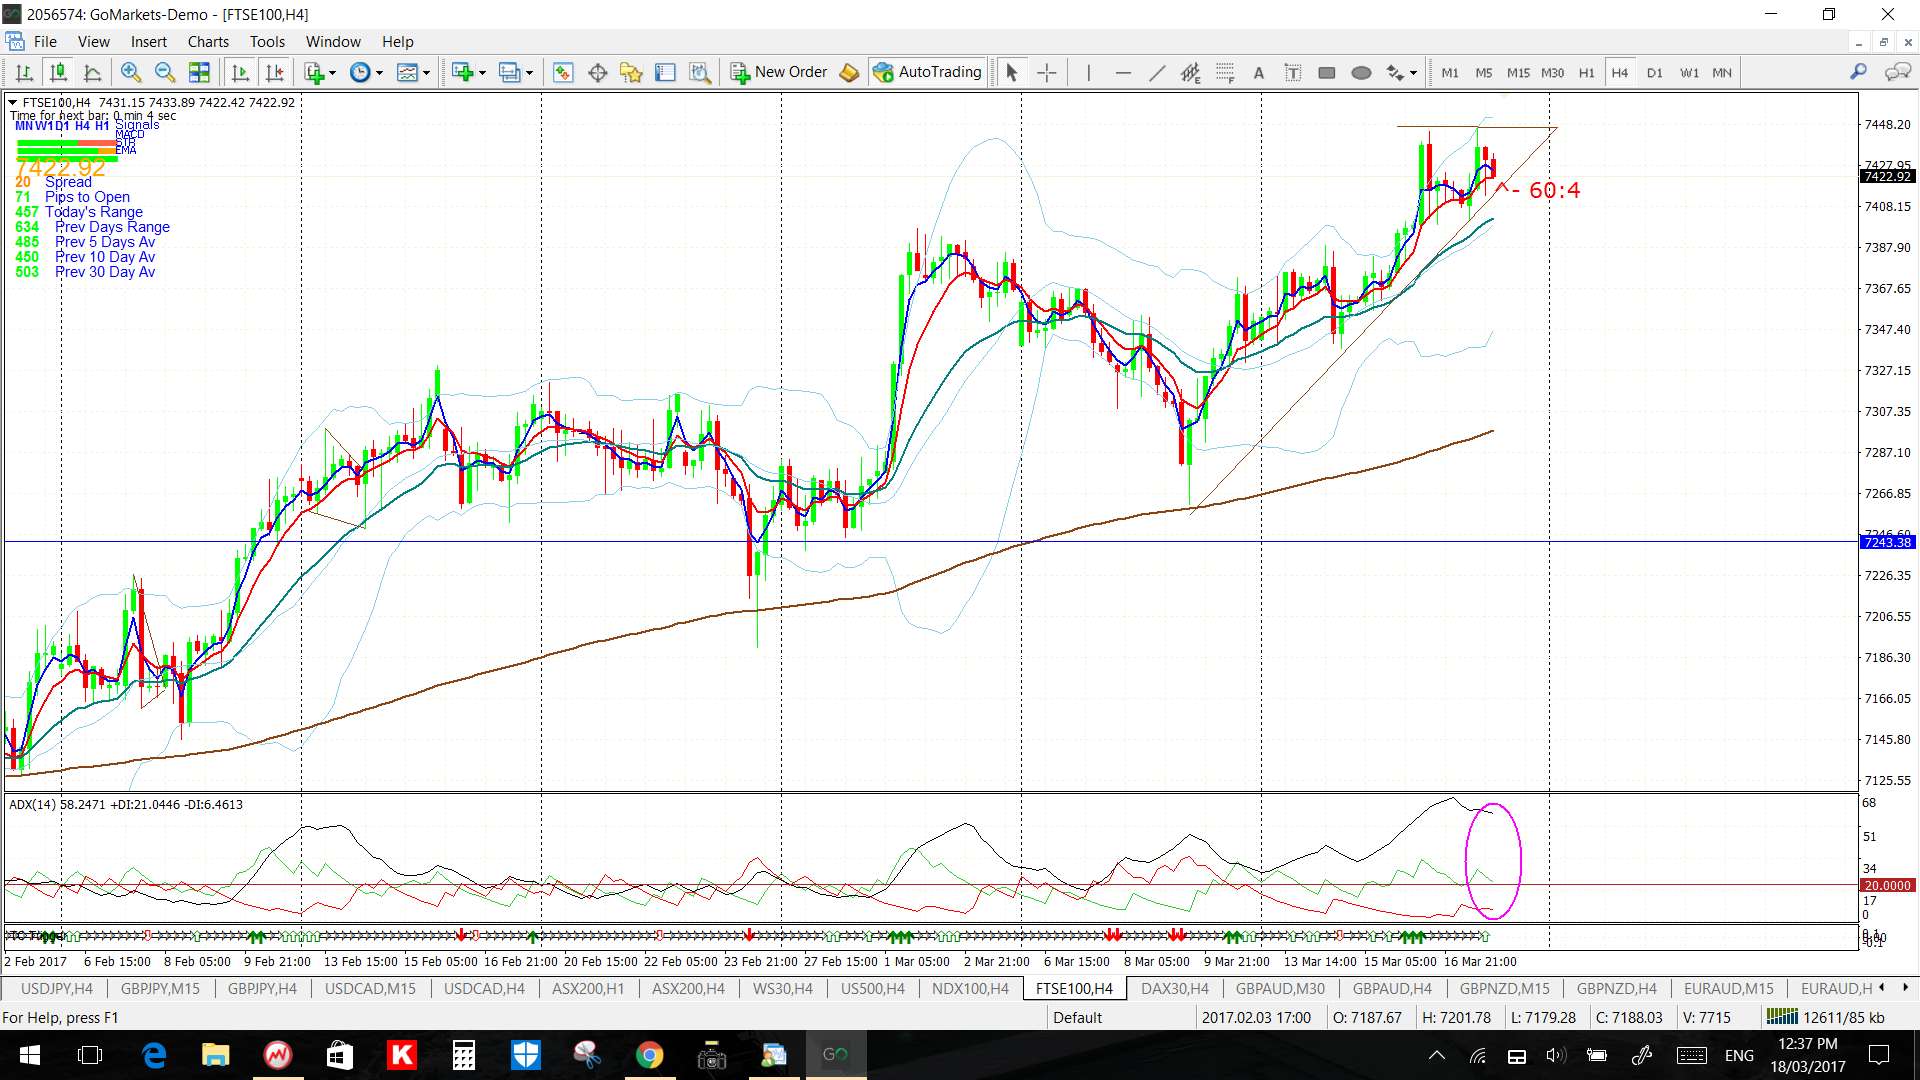
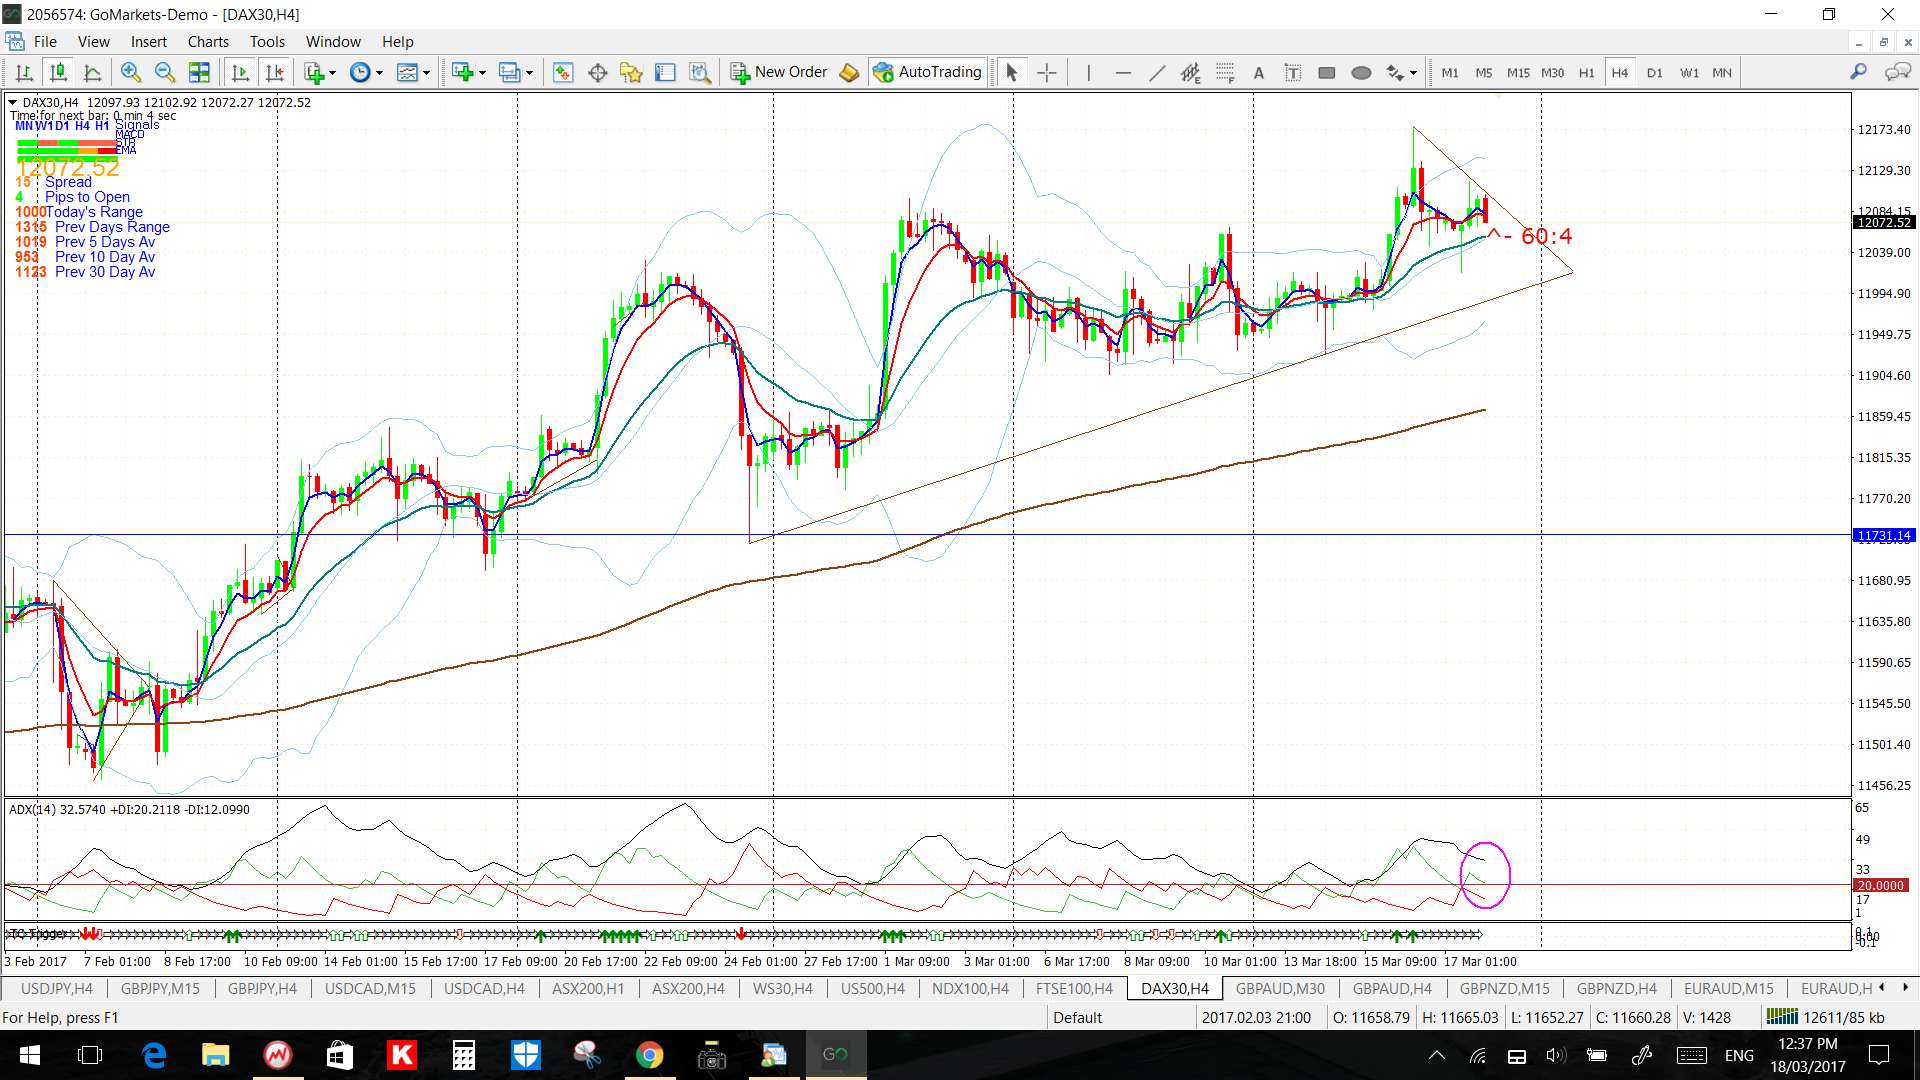
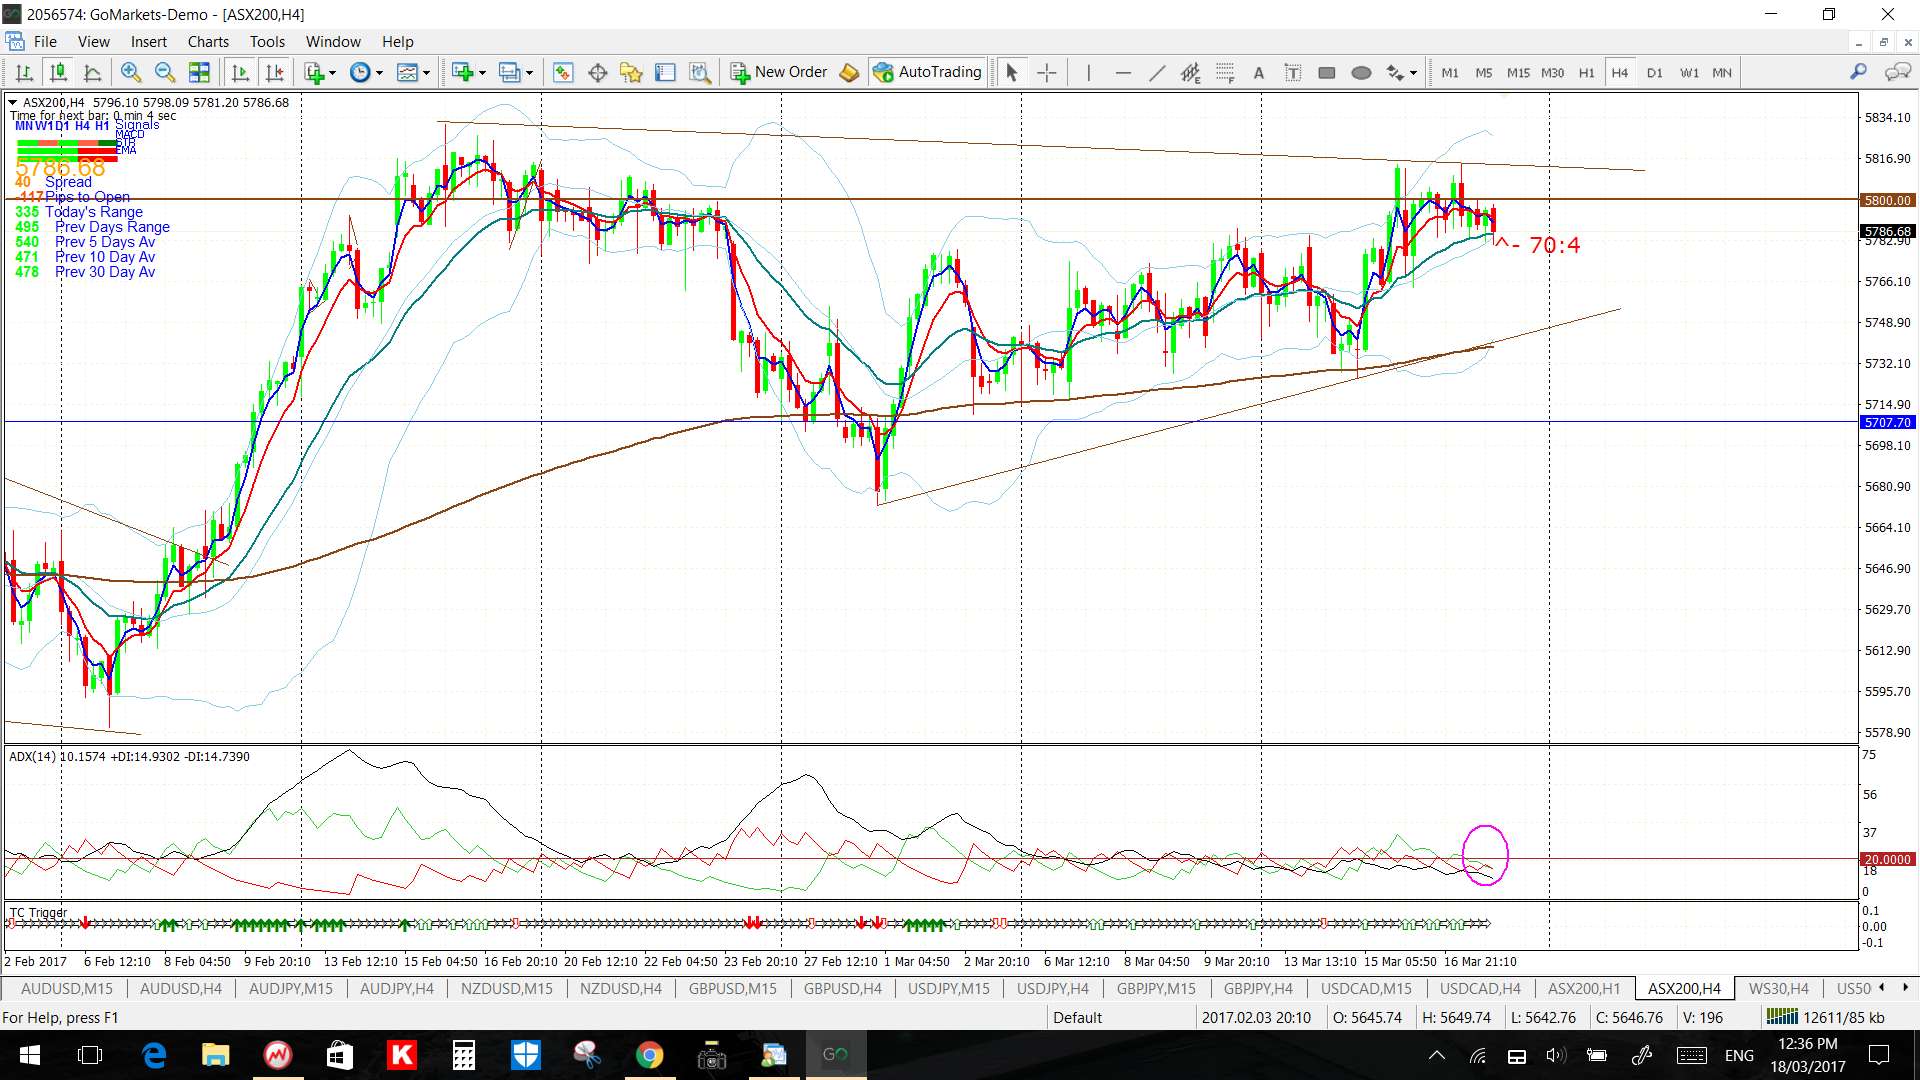
Stock Indices: watch for any trend line breakout on the 4hr charts of the following stock indices.
DJIA:
S&P500:

NASDAQ-100:
FTSE-100:
DAX-30:
ASX-200:
The post TL and TC in focus again. appeared first on Trade Charting.
The post TL and TC in focus again. appeared first on www.forextell.com.