Last week: There were no TC signals in another choppy week marked by increased Geo-political tension across the Middle East and Russia/Ukraine region. Market jitters were further fueled by growing anxiety due to the Argentinian debt default and renewed Euro-zone concern sparked by the struggling Portuguese ‘Banco Espirito Santo’ Bank. All of these factors contributed to a global ‘perfect storm’ that saw the S&P500 suffer its worst weekly decline in 2 ½ years. These issues are likely to continue and undermine market confidence into next week at least.
The lack of TC signals continues to be noteworthy. I read an article last week that described this current market behaviour as being typical of the churning action one sees at market tops and or bottoms. I have not traded my algorithm through either such market and so have taken this on board as the markets continue to unfold.
This week:
The USD rally dominated FX moves last week but stalled on Friday when the dollar ran into major resistance from the upper trend line of a 10 month trading channel. Further respect of this trend line could result in some reversal moves for FX this week. A review of FX indices can be found through this link.
There is a lot of high impact data this week. There are three important pieces of Chinese data released starting on Sunday with Non-Manufacturing PMI which came in slightly lower than the previous result. There are two more pieces on Thursday and Saturday to monitor as well. There are also interest rate announcements from four central banks for the AUD, EUR, GBP and JPY.
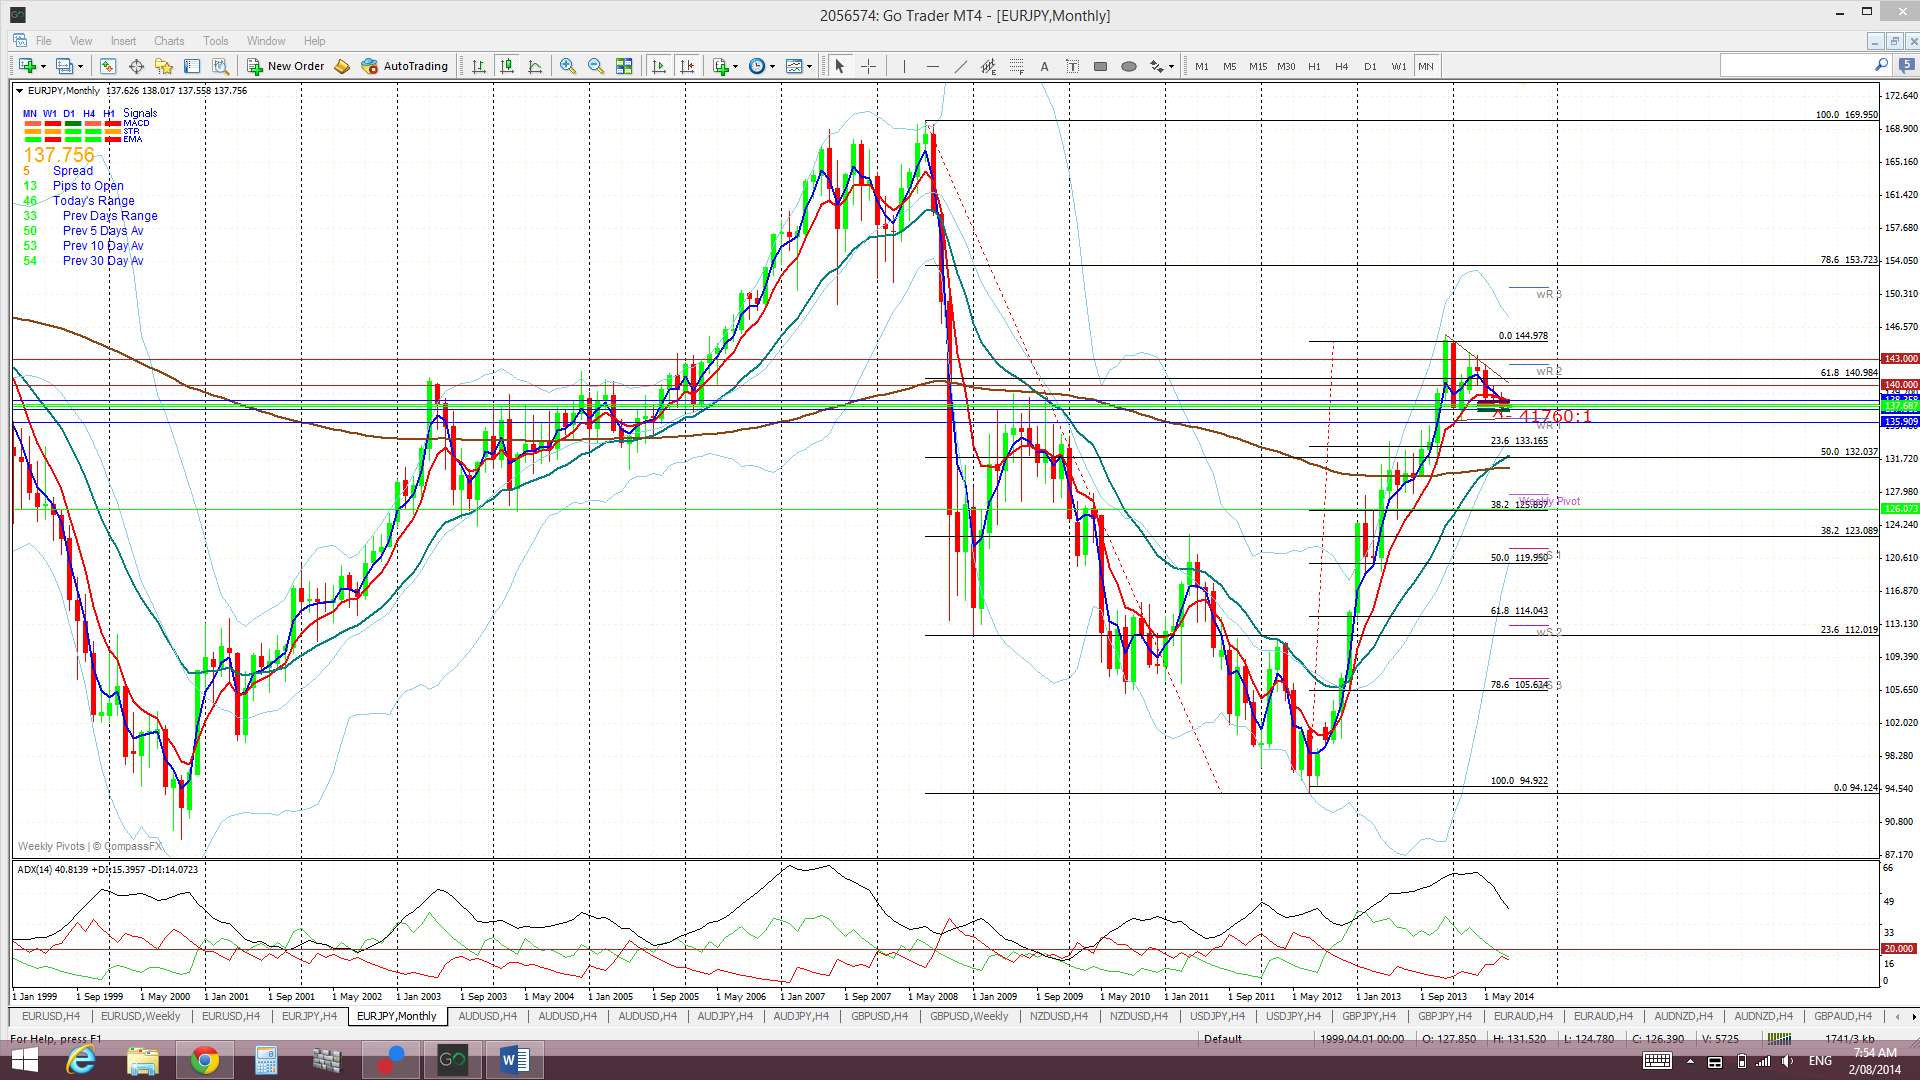
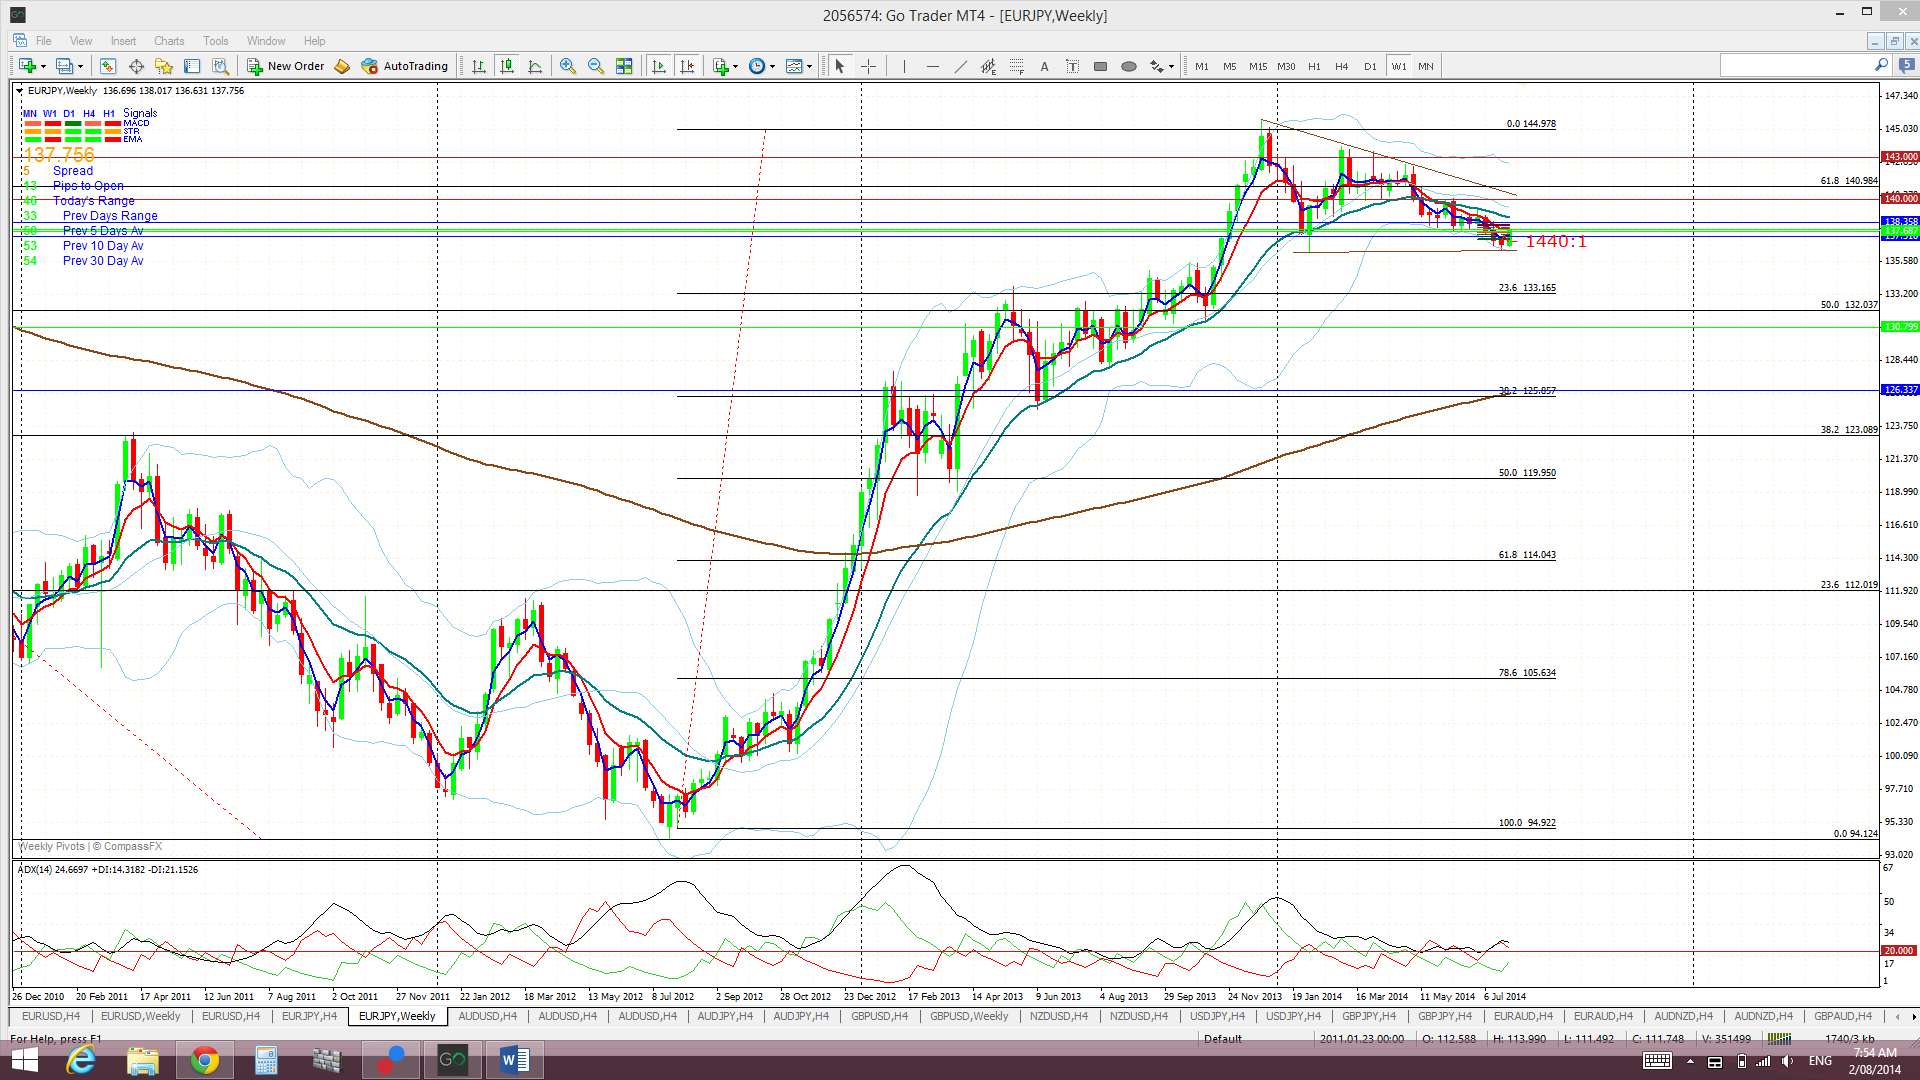
U/J: has broken out from a 7 month consolidation pattern. Will this hold? Is this the re-start of the bullish Cup ‘n’ Handle pattern?
Cable: It is a huge week for the Cable with lots of high impact data. This comes for the Cable at a time when it has broken down through weekly support and is struggling to hold above major monthly support. The 1.68 level seem to be the ‘line in the sand’ to guide traders next week.
Loonie: the bullish wedge breakout has held but will this continue?
Bullish engulfing monthly candles: formed on the Loonie and almost on the U/J.
Railway Track patterns: there have been a few of these across the charts of both bearish and bullish reversal varieties:
Railway Track Patterns
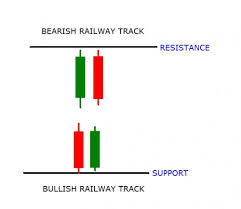
- Bullish-reversals noted on the: EUR/AUD weekly chart and AUD/NZD monthly chart.
- Bearish-reversals noted on the: the A/U monthly chart and Kiwi monthly chart.
‘Indecision’ style candles: There have also been a number of indecision-style candle patterns noted as well:
- Doji candles: on the A/J & GBP/AUD monthly charts.
- ‘Inside’ candles: on the Cable & Silver monthly charts.
- ‘Spinning Top’ candle: on the A/J weekly chart.
Events in the Ukraine and the Middle East continue to have the potential to undermine any developing ‘risk’ appetite and need to be monitored.
Stocks and broader market sentiment:
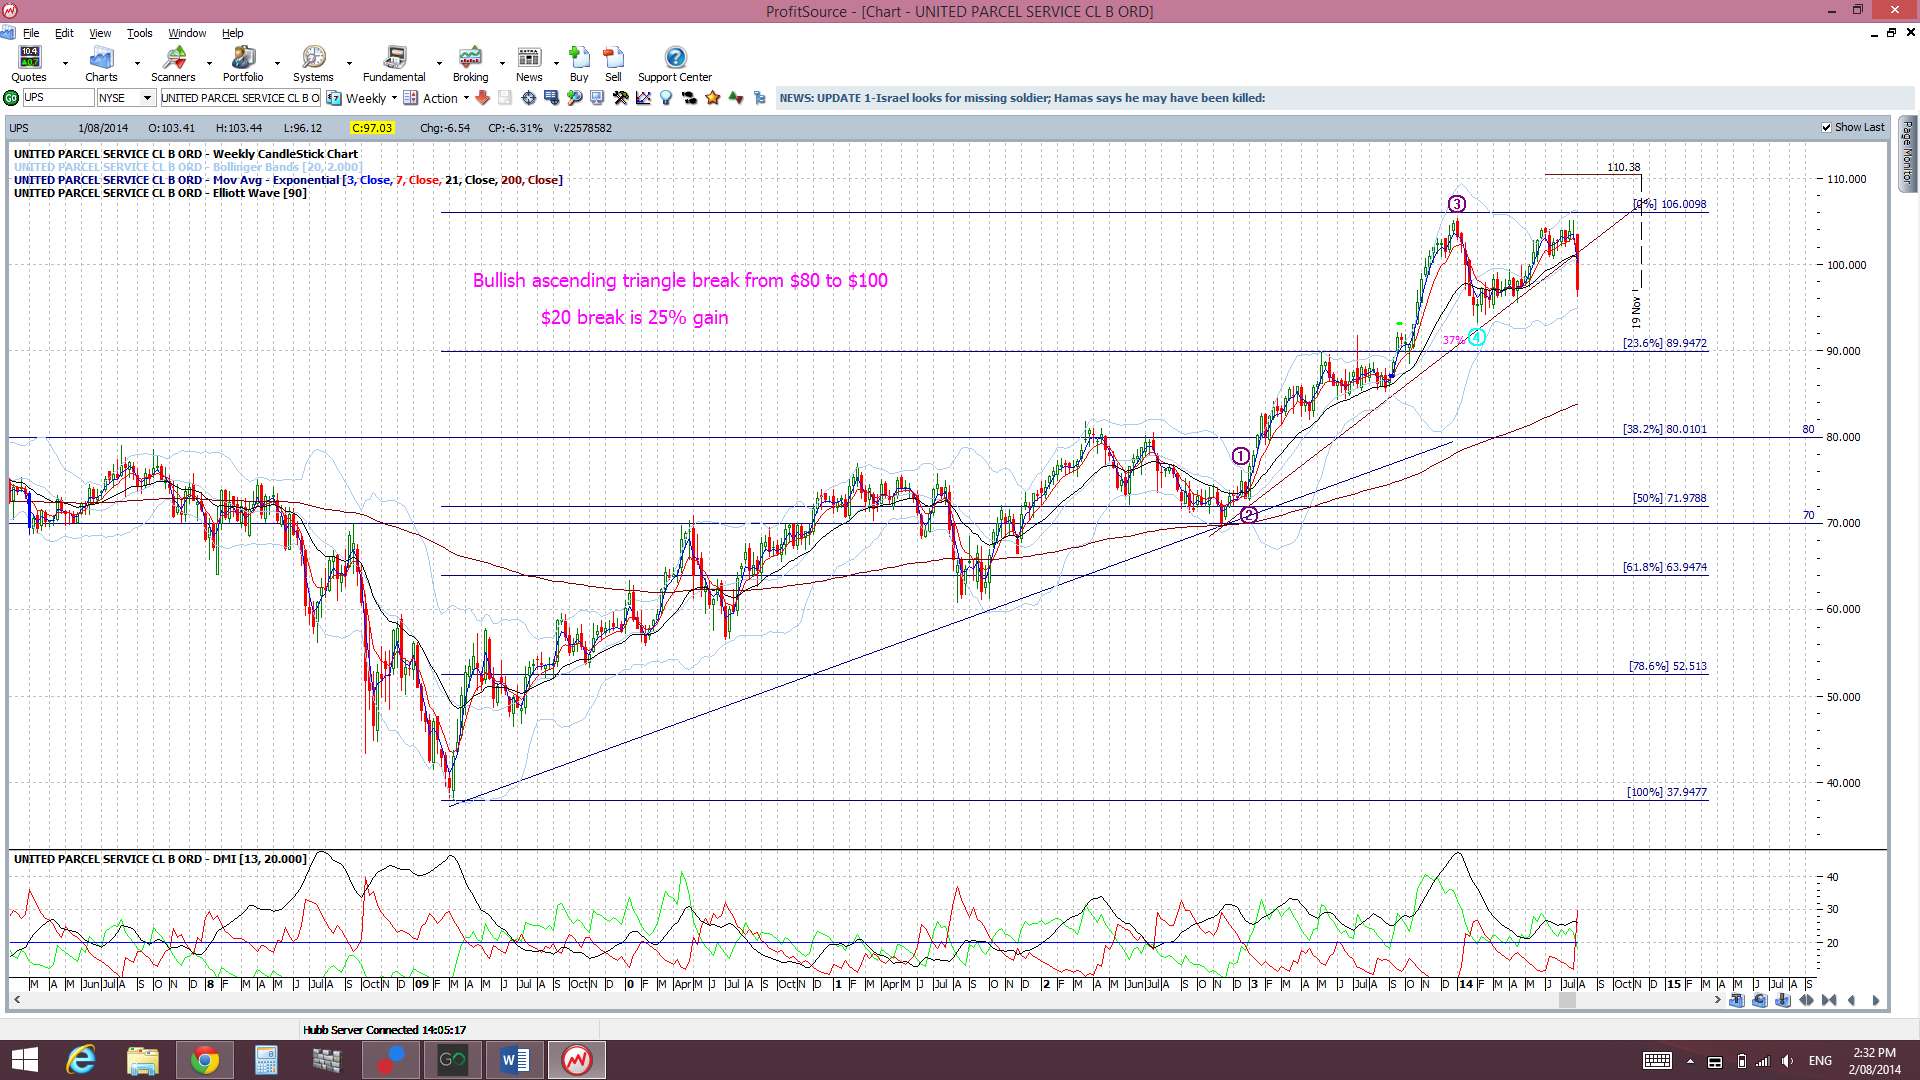
The ‘bellwether’ stock, UPS, gave an early warning last week that stocks may be in trouble when it dipped below its weekly support trend line:
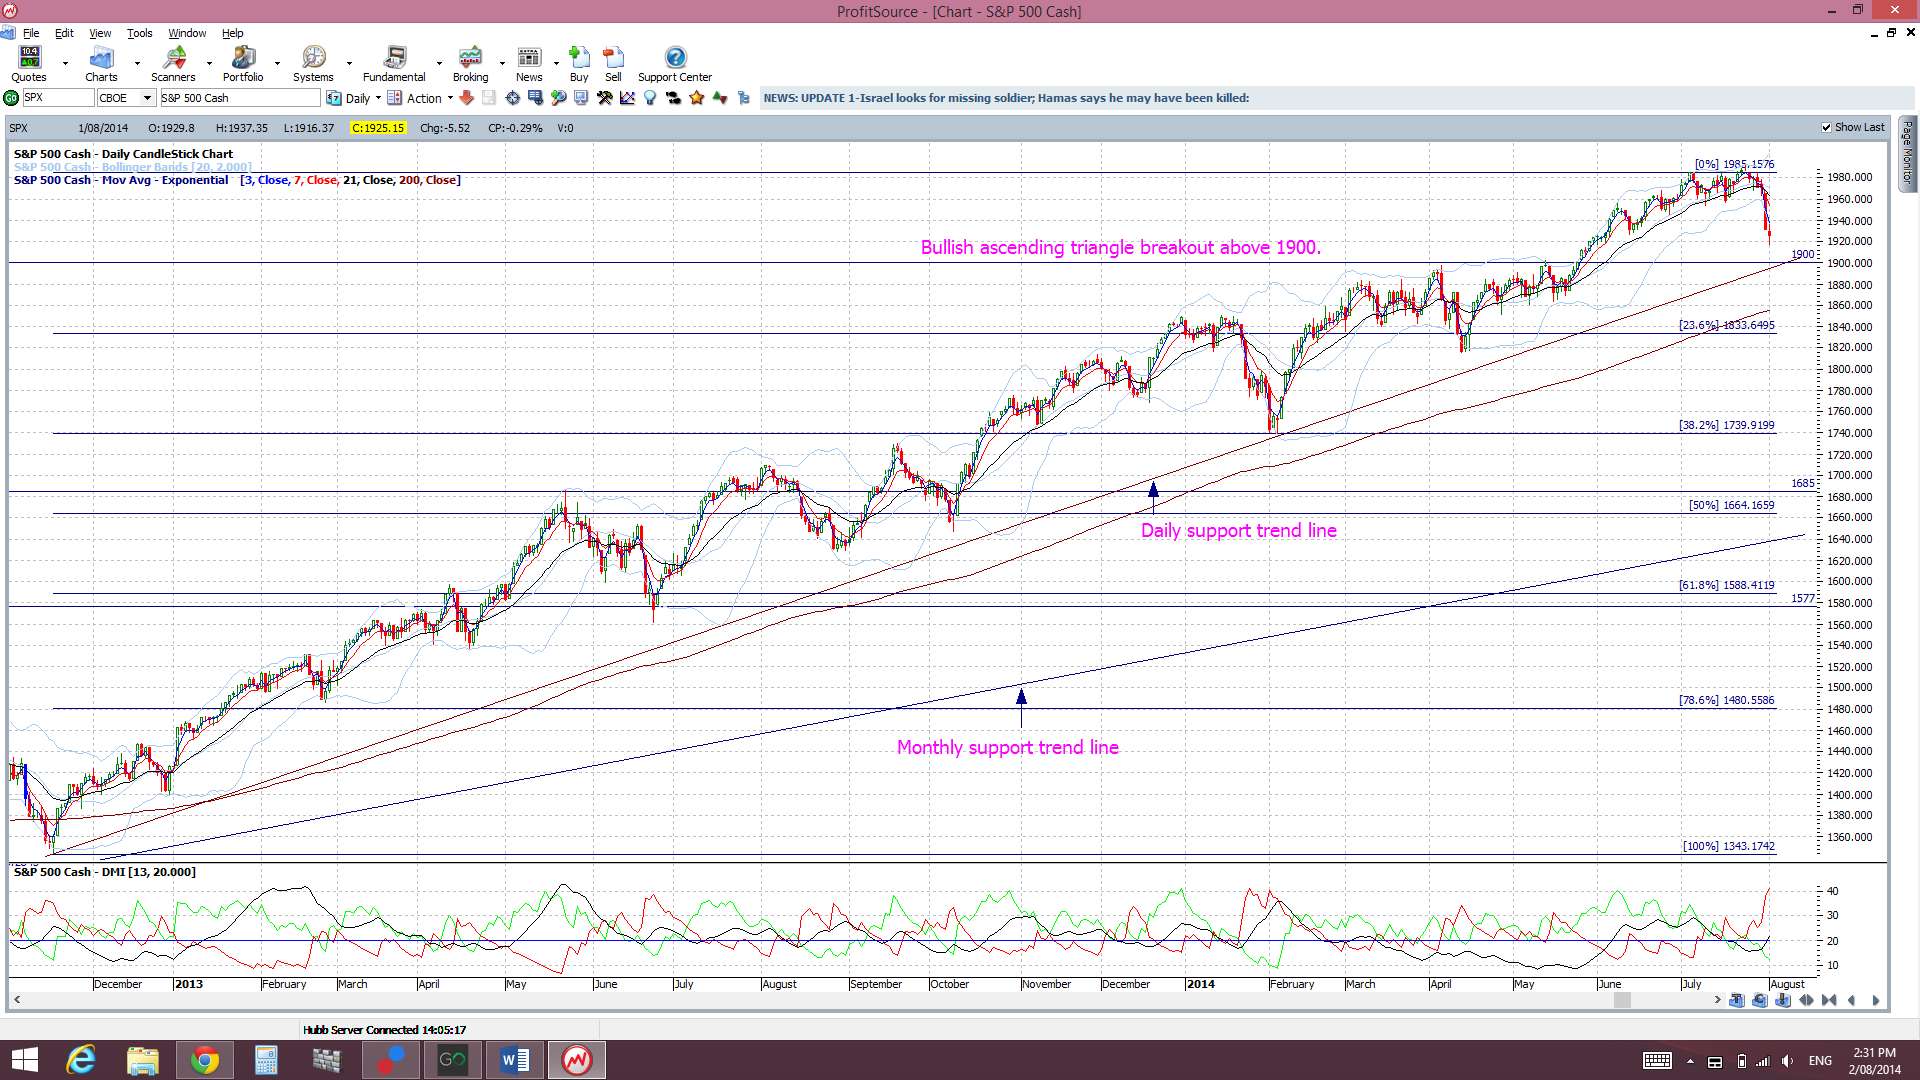
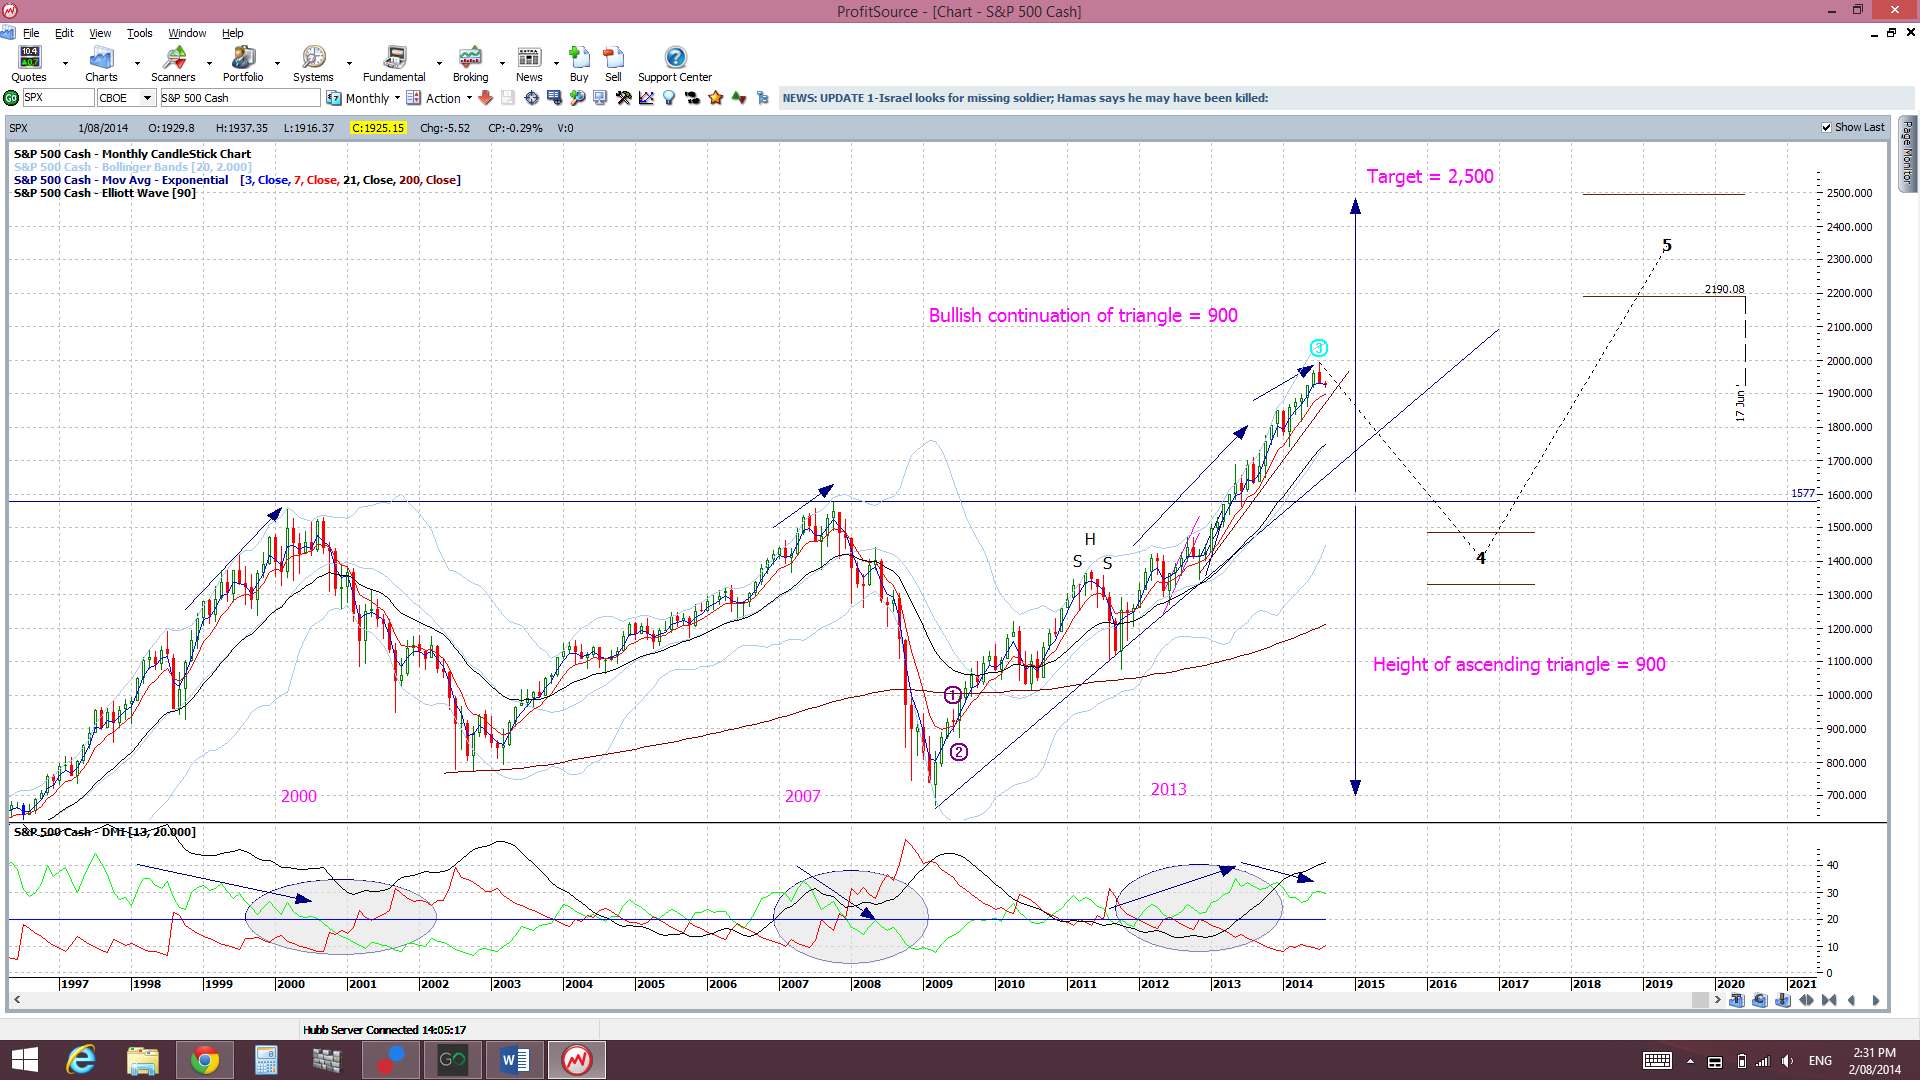
A broader stock sell off followed by the end of the week and the S&P500 had its worst decline in 2 ½ years. The S&P500 has now also dipped back down into the Ichimoku Cloud and the DJIA has slipped below its daily Cloud. The S&P500 and DJIA July monthly candles both closed as bearish candles after 5 bullish months but neither index formed bearish reversal ‘Shooting Star’ patterns though as their candle bodies were too large. The NASDAQ monthly candle, however, did close with more of a bearish-reversal ‘Shooting Star’ look to it and, also, back below the 4,400 S/R level.
Whilst the stock sell off has everyone talking about this being the long awaited for ‘correction’ I still think such talk might be a bit premature. Don’t get me wrong. I want and see the need for a decent pull back as much as the next trader BUT, even though UPS is flashing a warning, the VIX is up and the NASDAQ has closed back below the 4,400 S/R level, the S&P500 and DJIA are still trading above daily and monthly support trend lines. Another point of significant note is that the risk-sensitive Russell 2000 ‘small caps’ index is still trading above its key support of 1,100. Clearly, any subsequent breach of these levels will alter the trading landscape BUT I’m urging caution until such time:
Russell 2000 ‘small caps’ Index:

I am not alone with this cautionary note either as just one quote from CNBC reveals:
“I find it very hard to get scared by a sell off caused by an economy that is improving and rates coming up from very low levels. It’s not a recipe for stock-market disasters,” said David Kelly, chief market strategist at J.P. Morgan Funds, referring to the notion that the equities market was headed for a large drop on fears of the Federal Open Market Committee hiking interest rates sooner than anticipated.
However, I am still seeing divergence on the monthly S&P500 monthly chart and whilst this might just be warning of a pause, as the index navigates new highs, the chance of a pullback cannot be ruled out either. There has not been any real deep pull back since the break up through the 1,577, 1,600, 1,700 and 1,800 levels and the major break of the 1,577 level was only tested once. Thus, I remain cautious here now even though the daily support of the S&P500 has not been broken.
It is worth noting that a 61.8% fib pull back of the recent bull run (Nov 2012-present) would bring price down to near the 1,577 area. This remains significant as it is the breakout level of the previous highs from the 2000 and 2007 peaks. I would expect this region could be a target IF there was any serious pullback on the S&P500.
Thus, with all of this, I continue to watch out for further clues as to any new momentum move, long or short though! Next week may prove crucial as the S&P500 and DJIA trade down but only just above key daily support trend lines. In particular I’m looking out for:
S&P500 daily chart: I’m watching for any break of the daily trend line but price, although trending downwards now, is holding above this level for the time being. It is worth noting that a pull back to test the 1,900 level would not break the daily support trend line.
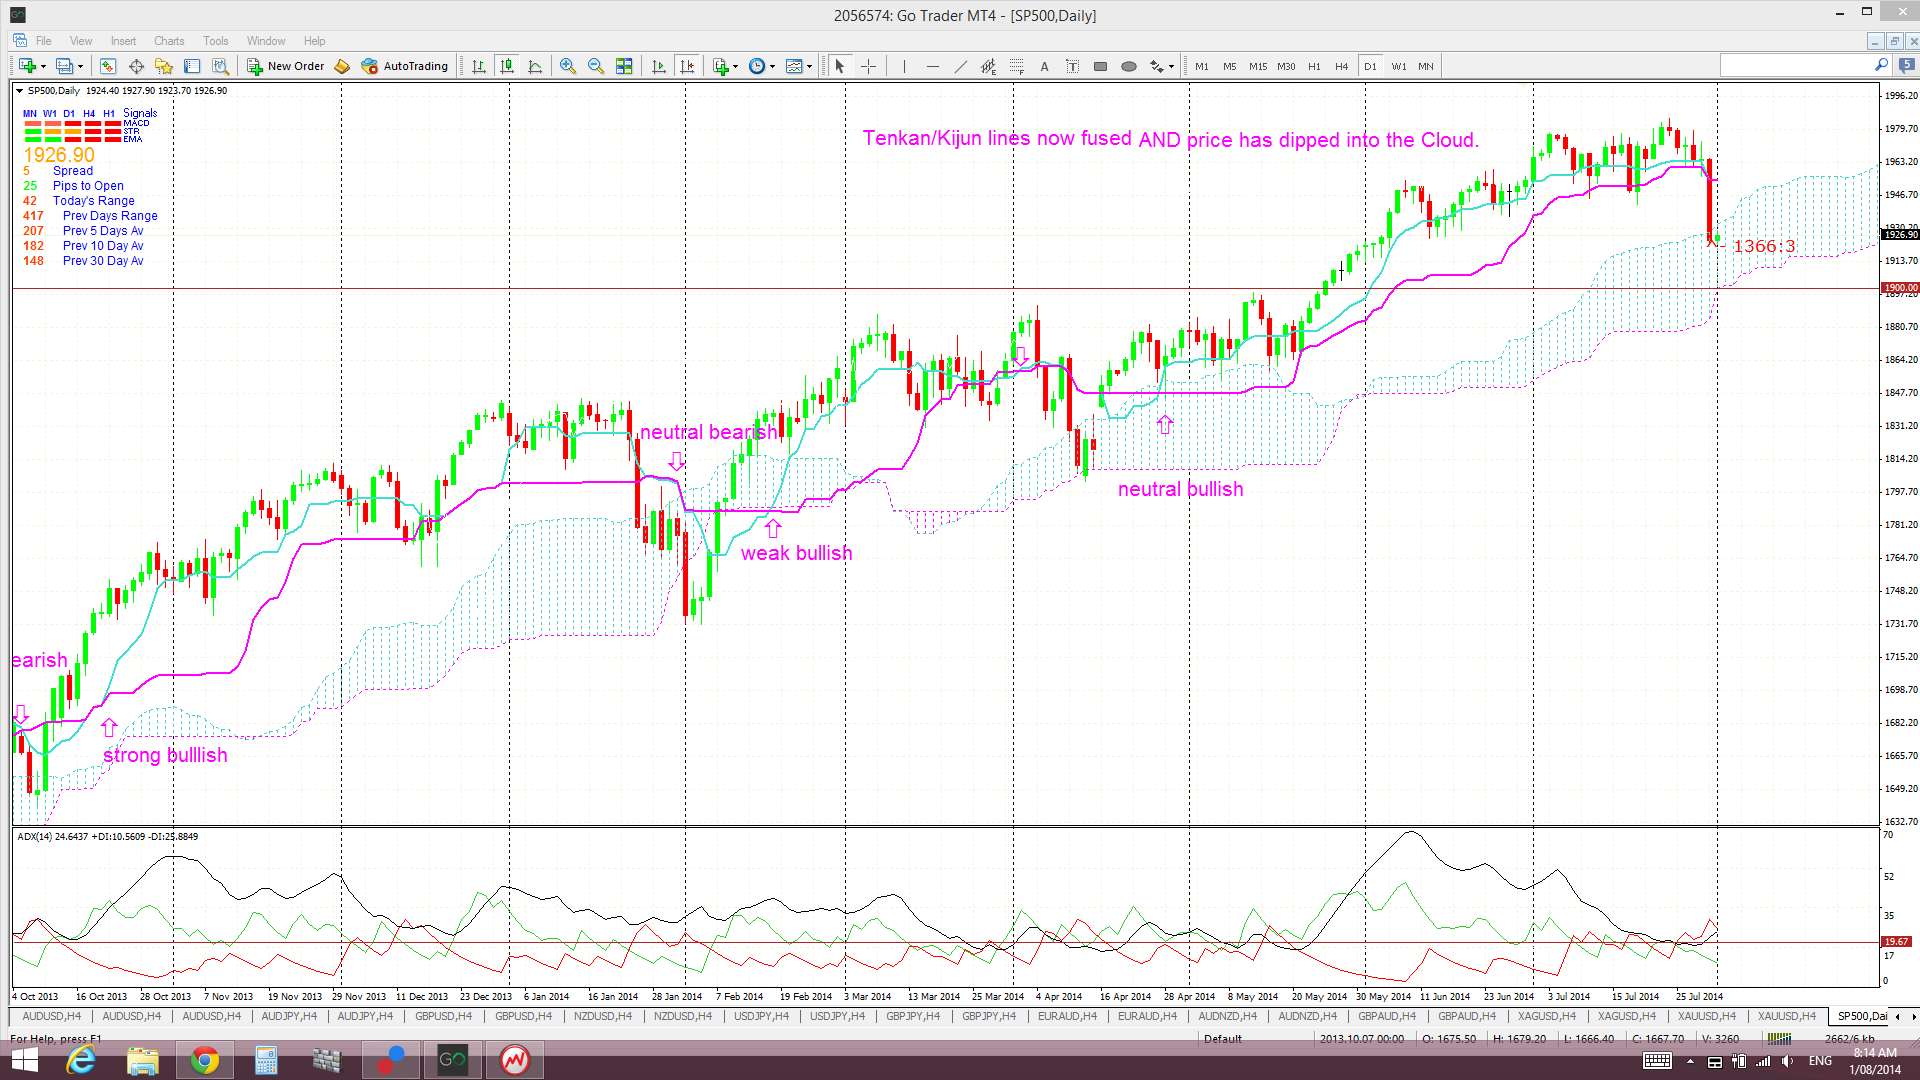
Ichimoku S&P500 chart: a clear cross of the blue Tenkan-sen line below the pink Kijun-sen line. The Tenkan/Kijun lines have fused now and price has dipped into the Ichimoku Cloud. I’ll be on the lookout for any new cross and for any move below the Cloud:
S&P500 monthly chart: a break of the monthly support trend line (see monthly chart). The monthly trend line remains intact. A break of this support level would suggest to me of a more severe pull back or correction. The look of this ‘market top’ still appears quite different to that of the previous two market tops from back in 2000 and 2007. I am seeing divergence on the monthly chart though. This may just be as the index pauses and ponders this new high or it could be warning of a pull back. Elliott wave suggest a big correction here though. I am still thinking that the 1,600 level might be the new base line for this index. The saying that ‘Old resistance becomes new Support’ holds here. I still believe that it would not be at all surprising to this 1,600 level tested again. It has only been tested once by a monthly candle since the bullish breakthrough and I would expect a significant level such as this to be tested more than once. Maybe I’m wrong here though as there have now been thirteen consecutive months of candles that have closed above this key level, and, without testing this region at all. To add to this thought of bearish pull back potential, the previous candle close ‘highs’ from back in 2000 and 2007 were down near the 1577/1580 area so it is entirely feasible that price may even test this region again before any continued move upwards. I actually won’t be too comfortable with any bullish continuation move on the S&P500 until this 1,577 level is tested again but, for the moment, the trend seems to be continuing higher.
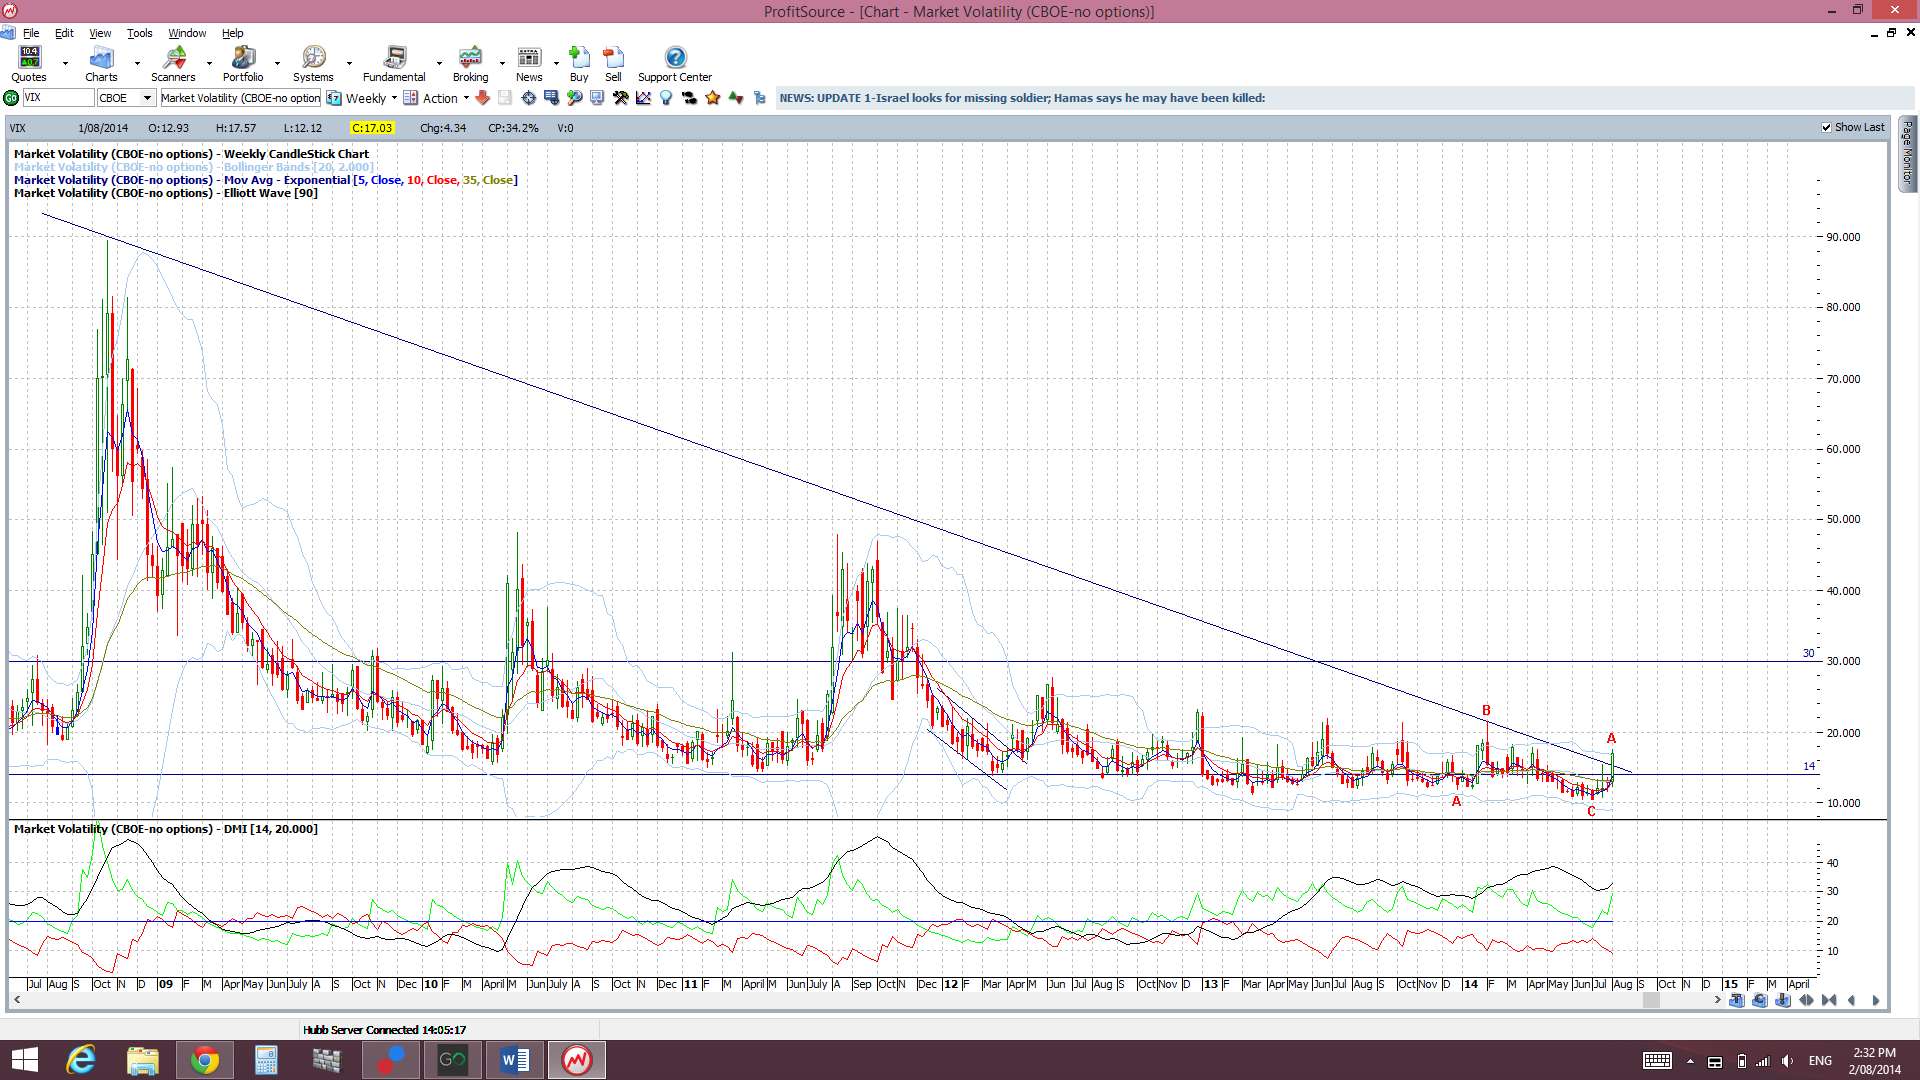
VIX: this has broken back above the weekly bear trend line BUT is still below the key 20 level:
Items to watch out for:
- Sun 3rd: CNY Non-Manufacturing PMI (Result: slightly lower than previous reading).
- Mon 4th: AUD Retail Sales. GBP Construction PMI.
- Tue 5th: AUD Trade Balance, RBA cash rate & statement. GBP Services PMI. USD ISM Non-Manufacturing PMI.
- Wed 6th: NZD Unemployment data. GBP Manufacturing Production. USD Trade Balance. CAD Trade Balance.
- Thurs 7th: AUD Unemployment data. GBP cash rate & statement. ECB cash rate & ECB Conference. USD Unemployment Claims. CAD Building Permits & Ivey PMI.
- Fri 8th: RBA Monetary Policy Statement. JPY Monetary Policy Statement & BoJ Press Conference. CNY Trade Balance. CAD Unemployment data.
- Sat 9th: CNY CPI.
Forex:
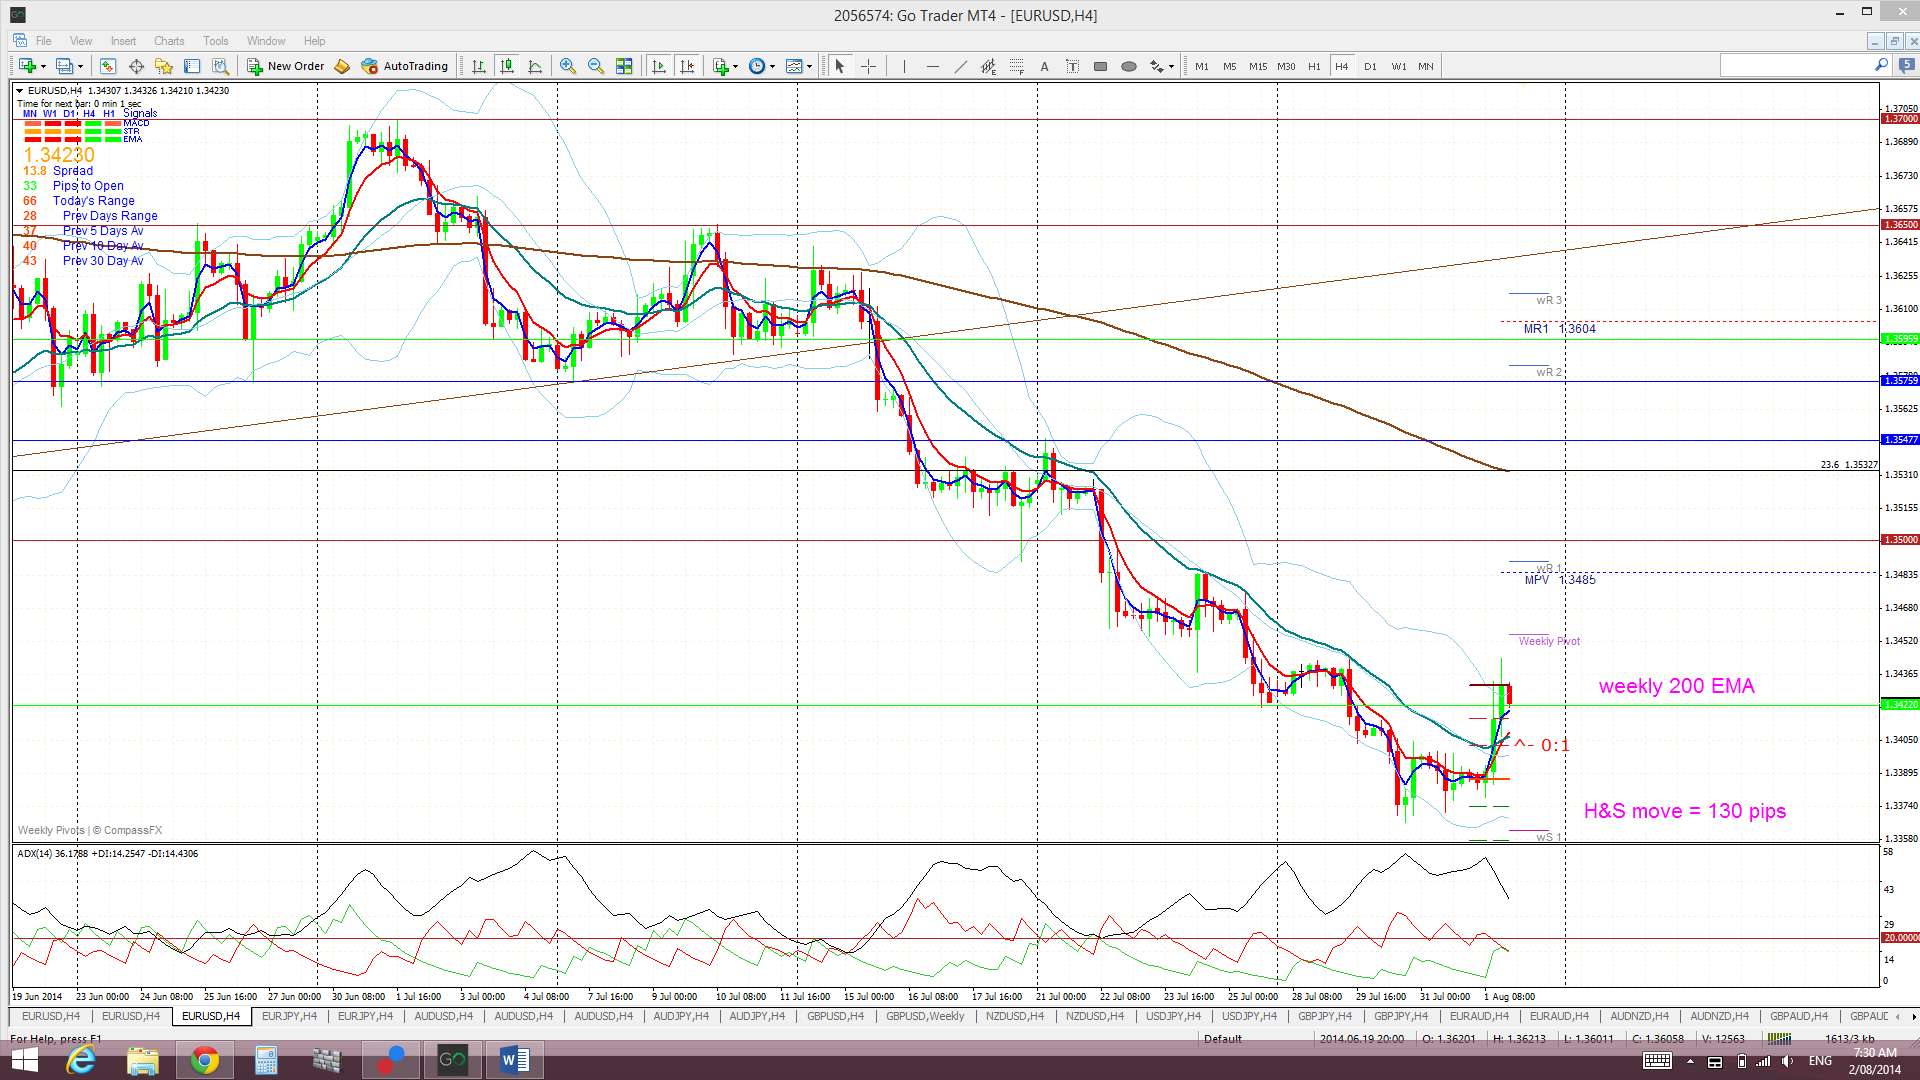
E/U: The E/U drifted lower last week and temporarily slipped below the support of the weekly 200 EMA. Friday’s weaker than expected US NFP though saw the USD weaken and this helped to lift the E/U and it closed back just above the weekly 200 EMA.
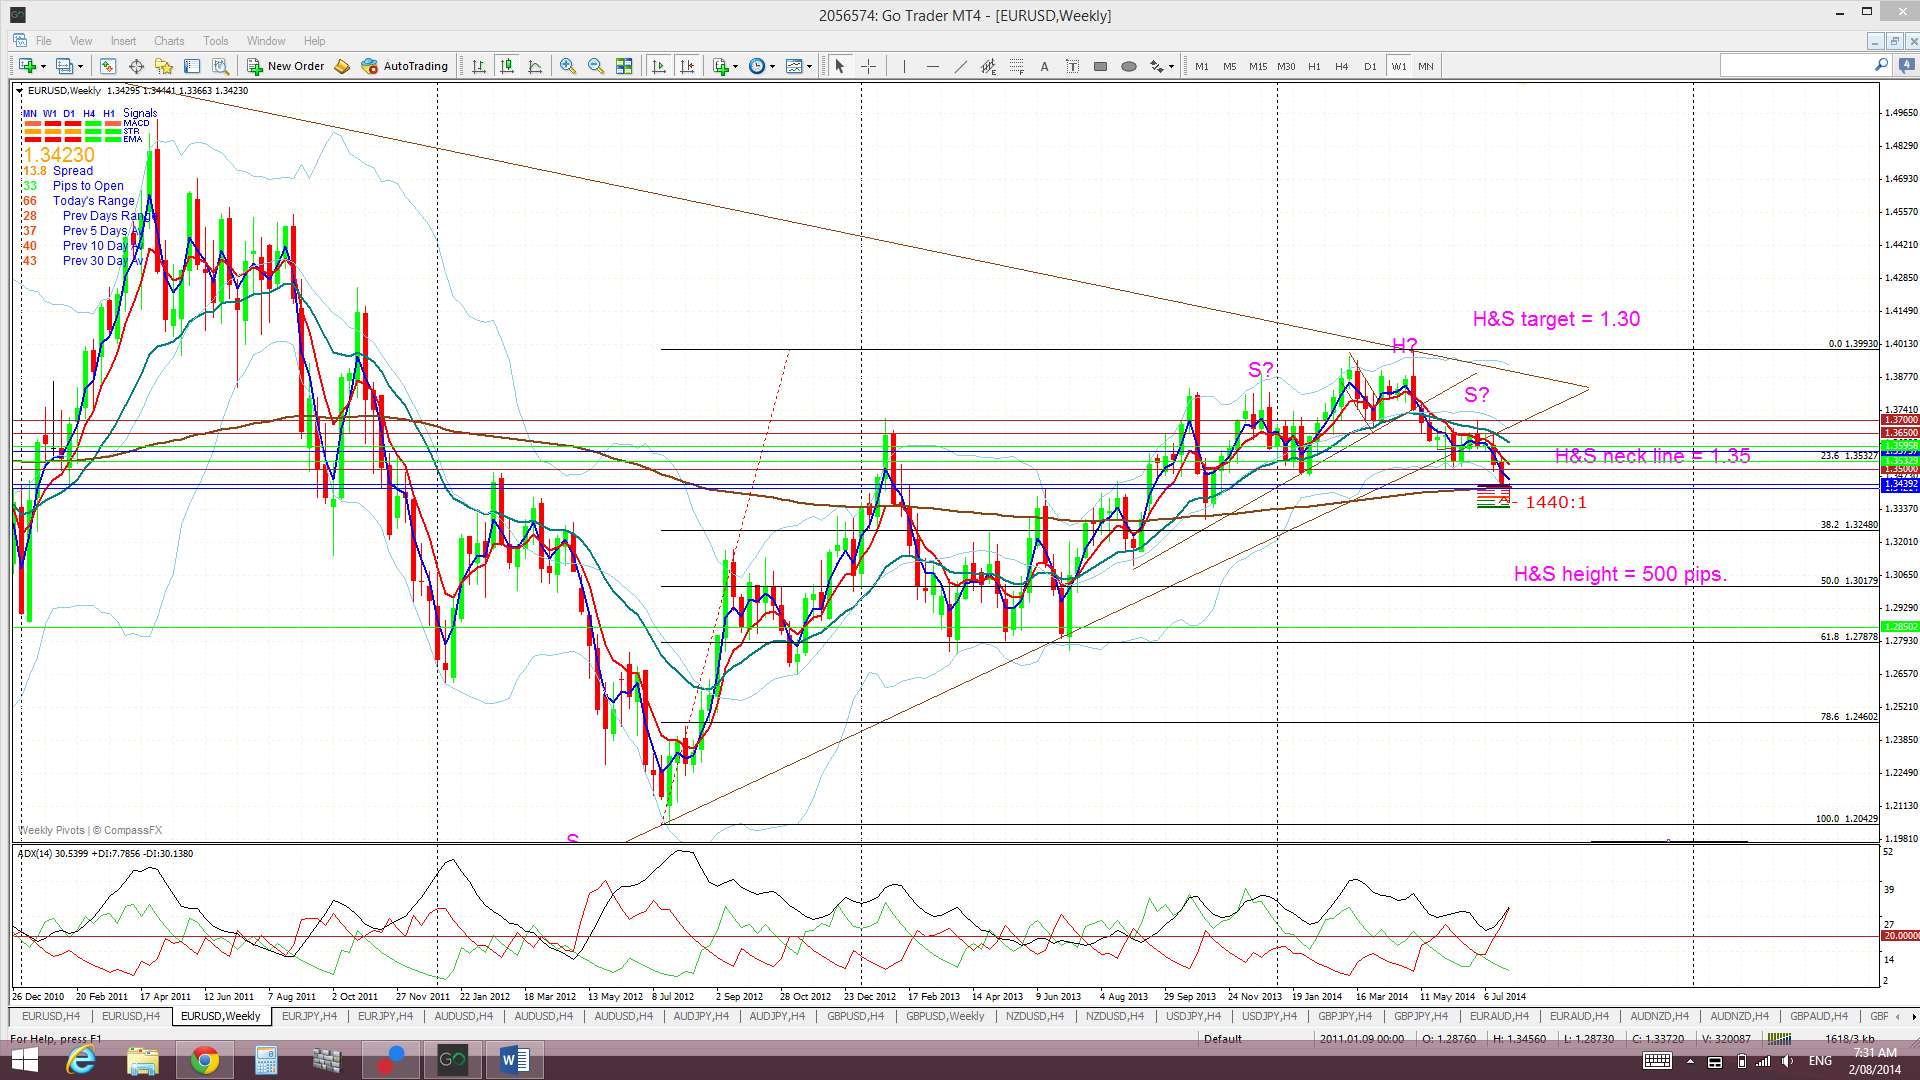
The 1.35 level, 80 pips above current price, will be key to watch next week. Any close and hold back above this level would suggest a failure of the weekly chart’s bearish H&S. A respect of this 1.35 level though would suggest that this H&S ‘neck line’ region was simply being tested before bearish continuation; a phenomenon that is quite common with such technical moves.
Weekly H&S? The weekly chart’s bearish ‘H&S’ appears to have evolved with the ‘neck line’ of 1.35 now clearly broken. The height of this weekly H&S pattern is about 500 pips. The theory of these technical patterns is that any bearish follow through can be expected to extend by the same order of magnitude as the height of the pattern. Thus, the projected target for this H&S pattern is 500 pips below the 1.35 level. This would predict the E/U to target the 1.3 level which is just above the monthly 200 EMA. This had already delivered up to 130 pips before Friday’s recovery.
I had mentioned last week that there was plenty of support below current price and that any bearish follow through may be choppy. This is exactly what we’ve seen. Support levels below current price still include the:
- weekly 200 EMA level
- bottom of the weekly Ichimoku Cloud.
- 50% fib level of this latest Bull Run.
- monthly 200 EMA AND
- 61.8% fib level of this latest Bull Run.
Price is now trading below the Ichimoku Cloud on the 4hr and daily charts, near the bottom of the Cloud on the weekly chart and at the bottom edge of the Cloud on the monthly chart.
The weekly candle closed as a bearish coloured candle BUT with a long lower shadow giving it a bit of a bullish-reversal ‘Hammer’ appearance. The July monthly candle closed as a large bearish, almost ‘engulfing’ style candle.
There will be two main risk events for the E/U this coming week that traders need to be mindful of: the continuing reaction of the USD following NFP AND ECB interest rate news followed by the ECB conference.
- I’m watching for any new TC signal on this pair and the 1.35 level.


E/J: The E/J traded higher last week on the back of some U/J strength and closed back above the daily 200 EMA and near the new monthly pivot.
I have adjusted the daily chart’s lower trend line here to reflect the latest support level.
Price is now trading above the Cloud on the 4hr, below on the daily chart, in the Cloud on the weekly but above the Cloud on the monthly chart. The November and December candles were the first to close above the resistance of the monthly Ichimoku Cloud since 2008.
The weekly candle closed as a bullish engulfing candle. The July candle closed as a bearish candle.
I still think the monthly chart has a ‘Bull Flag’ look to it BUT I’m keeping an open mind.
Traders need to be mindful of the high impact interest rate news for both the EUR and JPY in the coming week.
- I’m watching for any new TC signal on this pair and the daily 200 EMA.
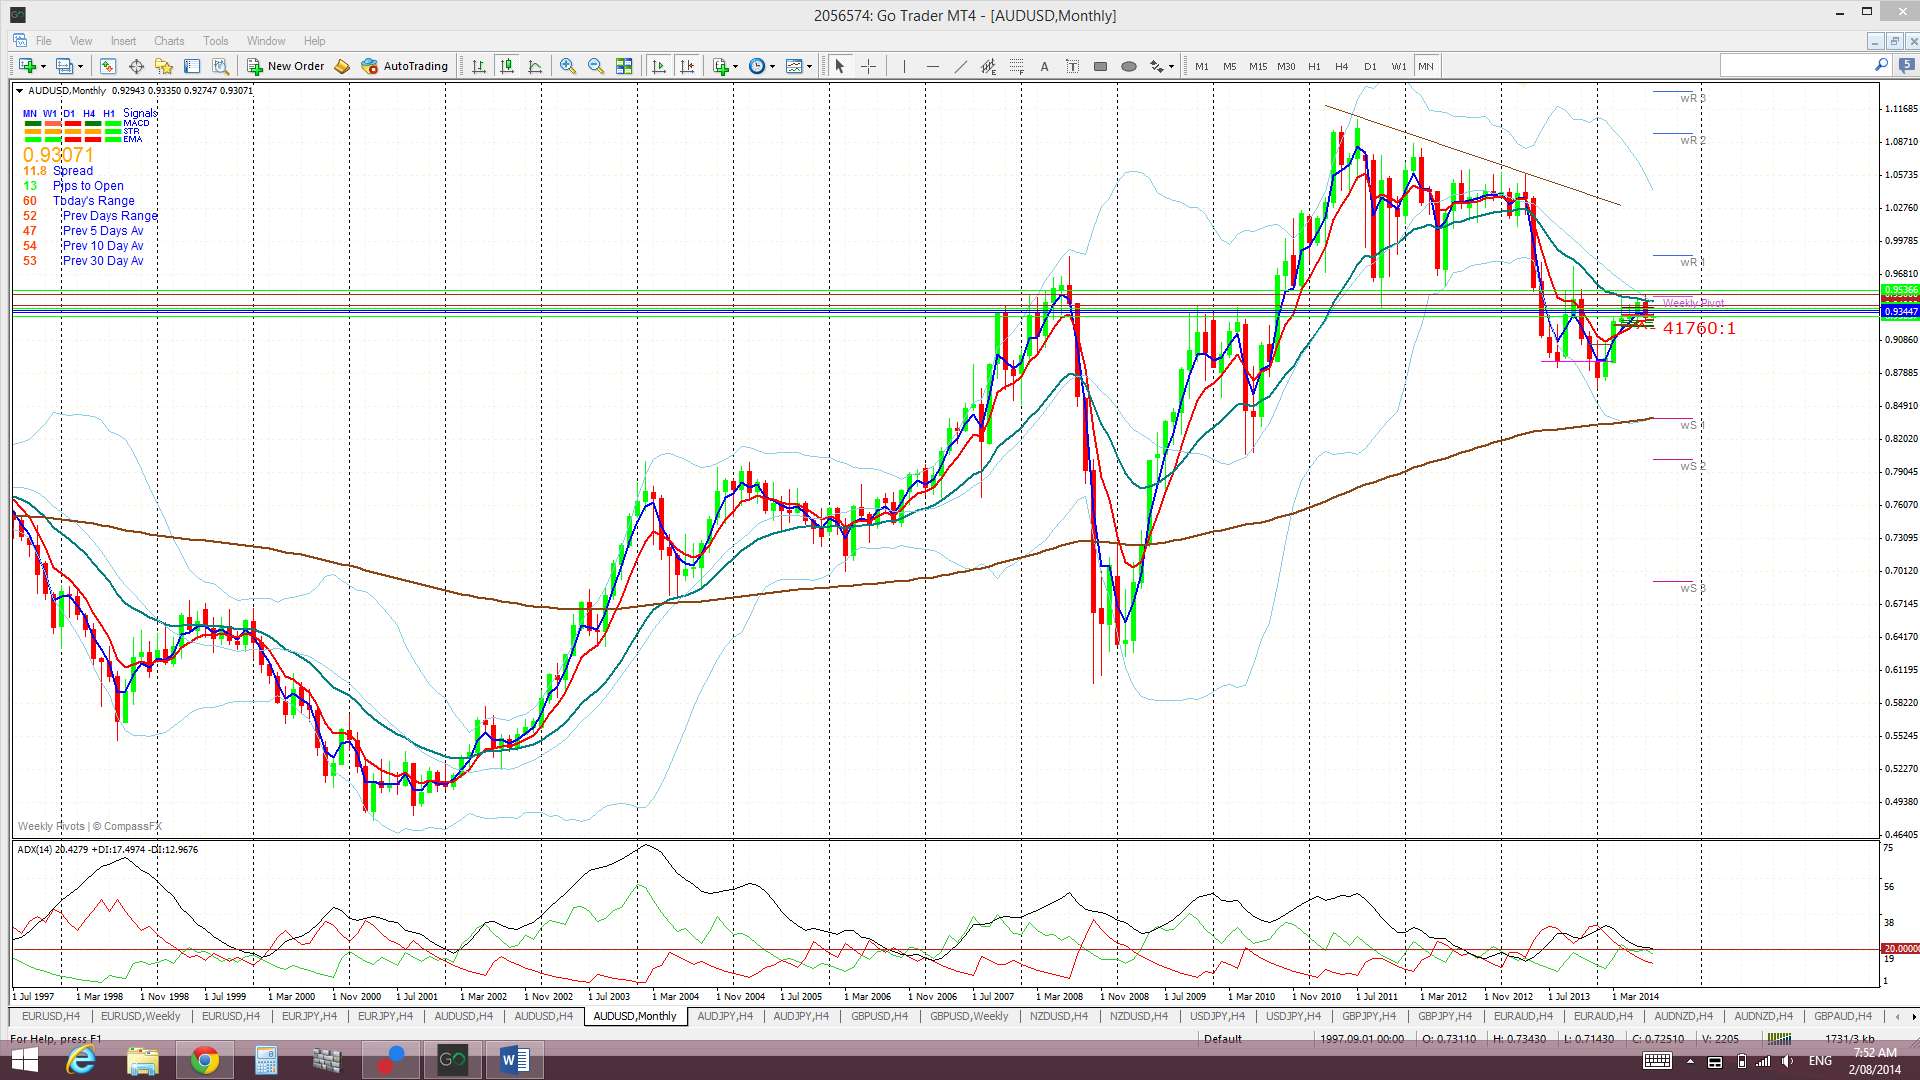
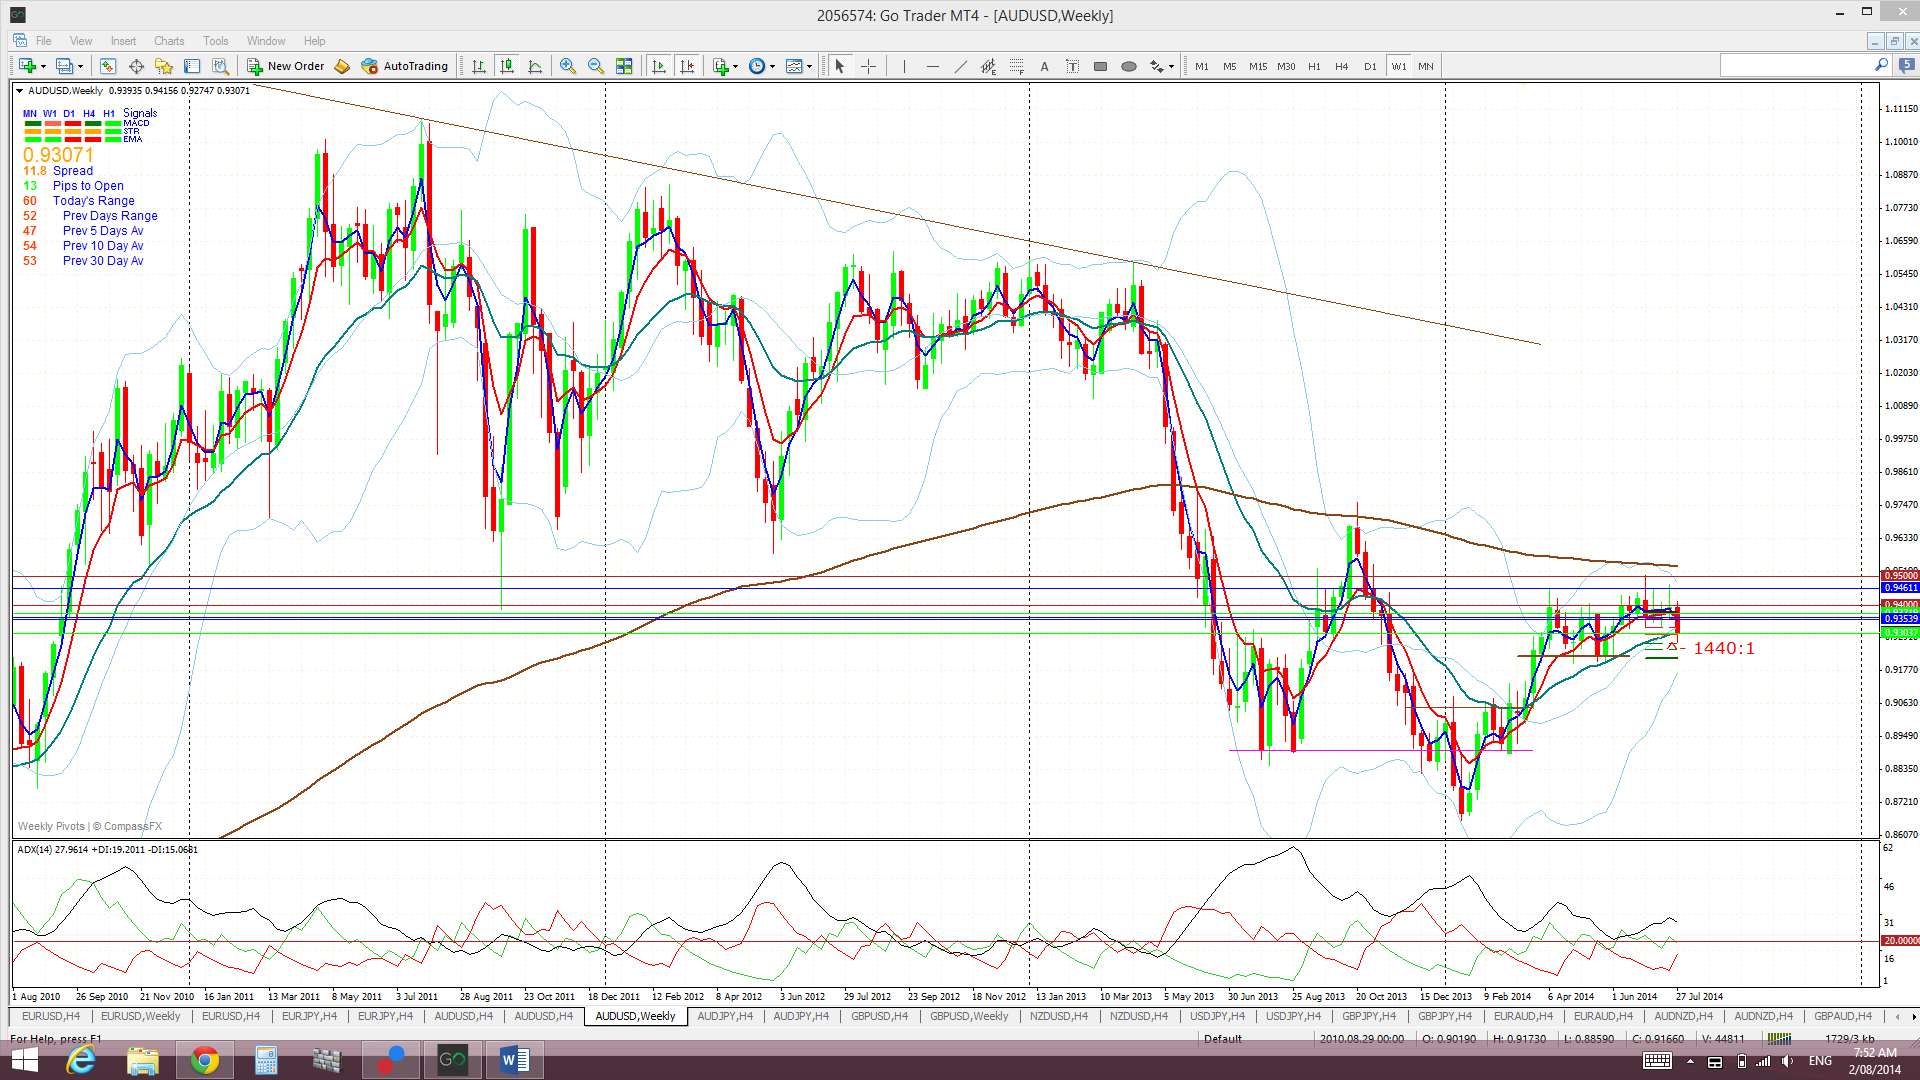
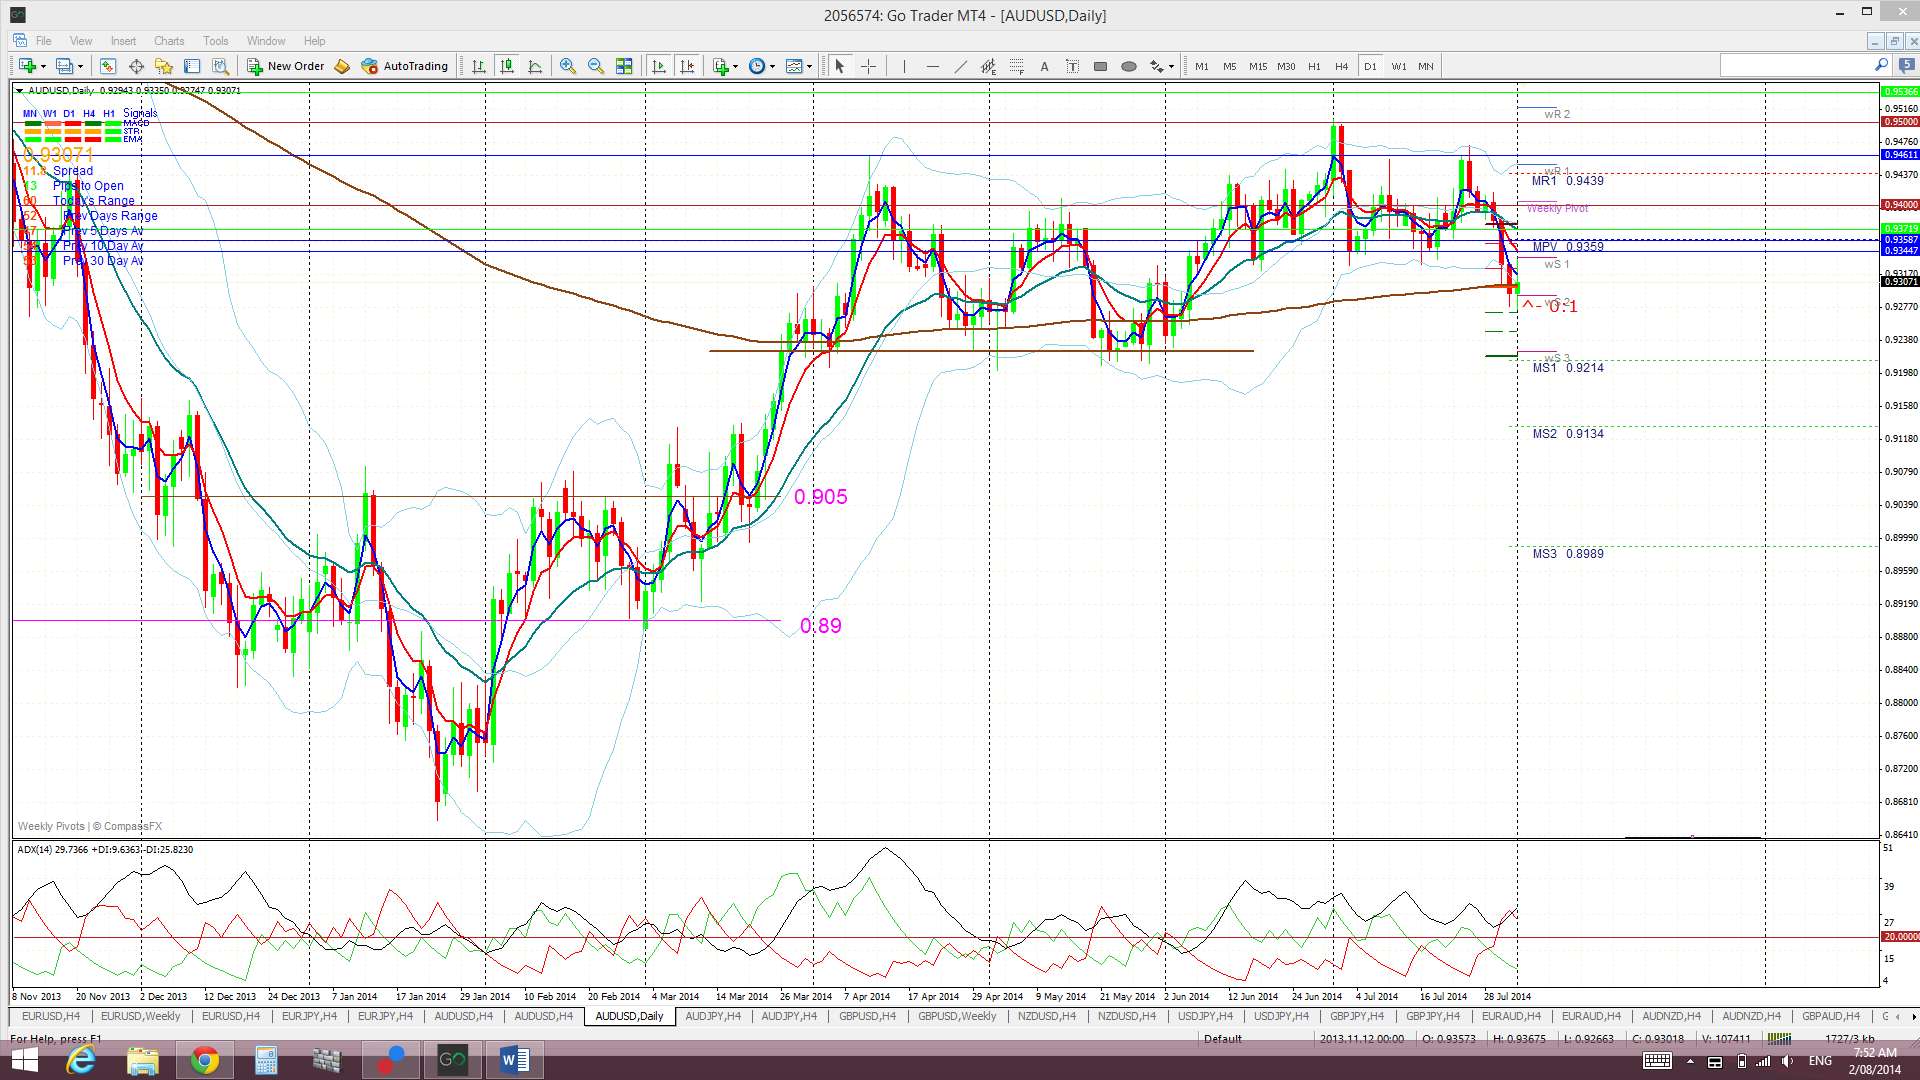
A/U: The AUD chopped lower last week with continuing USD strength but the weaker NFP print on Friday saw the Aussie recover a bit and it managed to close back above the support of the daily 200 EMA.
There has been a recent bearish Tenkan/Kijun cross on the daily Ichimoku chart but this was deemed a ‘weak’ signal as it evolved above the Cloud. The Tenkan/Kijun lines are trending lower though now and price is below the daily Cloud which is painting a bearish picture here:

Price is now trading below the Cloud on the 4hr and daily charts, in the bottom of the Cloud on the weekly chart and in the middle of the Cloud on the monthly chart.
The weekly candle closed as a large bearish candle. The July candle closed as a large bearish, almost ‘engulfing’ style candle. This follows after 5 bullish monthly candle closes. The monthly chart also now has a bit of a bearish-reversal ‘Railway Track’ look to it as well.
I do note all of this bearish activity and how some traders are getting ready to short the A/U BUT, if the USD conforms to its current trading channel and embarks on a renewed bearish run, then, this could trigger some bullish A/U movement.
- I’m watching for any new TC signal on this pair and the daily 200 EMA.

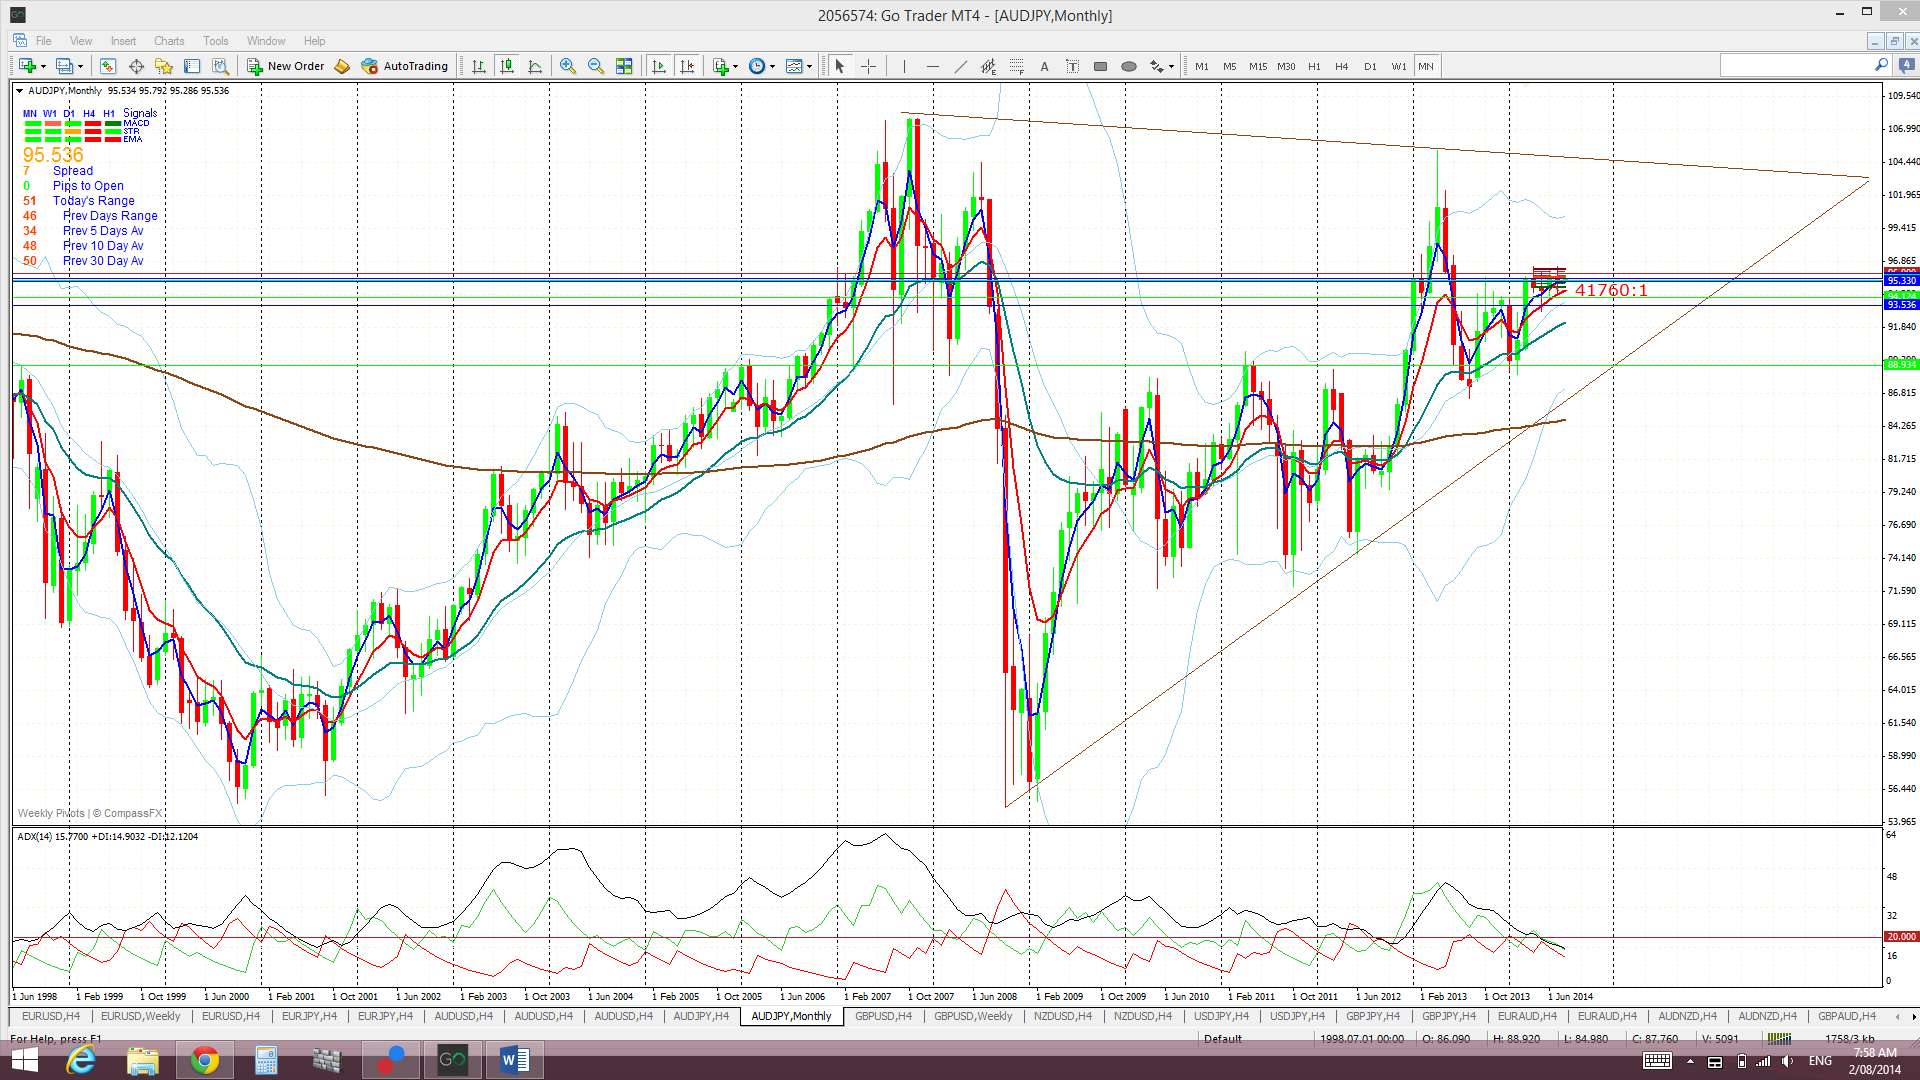
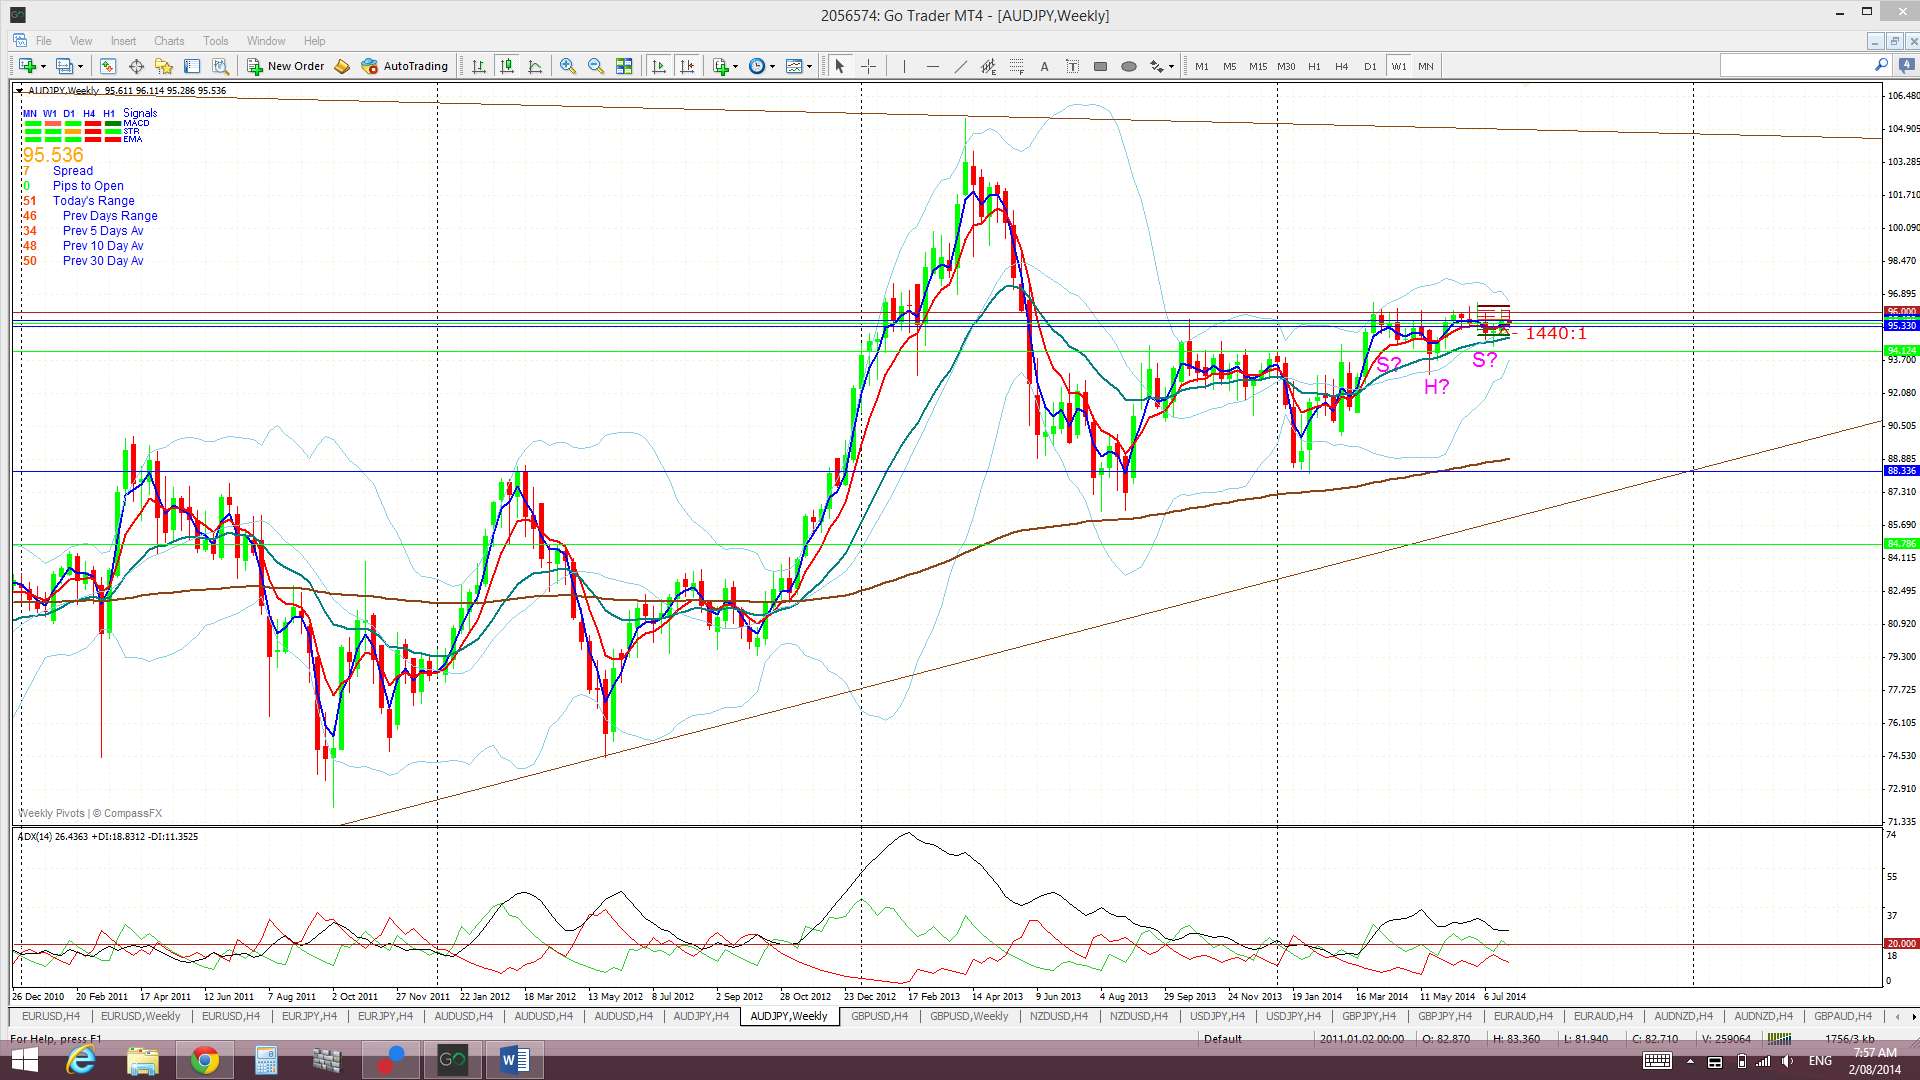
A/J: The A/J chopped a bit lower last week but is still just under the key S/R level of 96. The daily chart’s bullish ‘Inverse H&S’ is still in contention.
Bullish Inverse H&S? The daily charts shows a rather sloppy bullish ‘inverse H&S’ possibly still setting up on this pair. The ‘neck line’ is at the crucial 96 level.
Price is now trading in the middle of the Cloud on the 4hr chart, in the top edge of the Cloud on the weekly but above on the daily and monthly charts.
The weekly candle closed as a bearish coloured ‘Spinning Top’ candle. The monthly candle closed as a bearish coloured Doji. There is clearly a lot of indecision here!
Traders need to be mindful of the high impact interest rate news for both the AUD and JPY in the coming week.
- I’m watching for any new TC signal on this pair, the daily chart’s ‘inverse H&S’ and the 96 level.


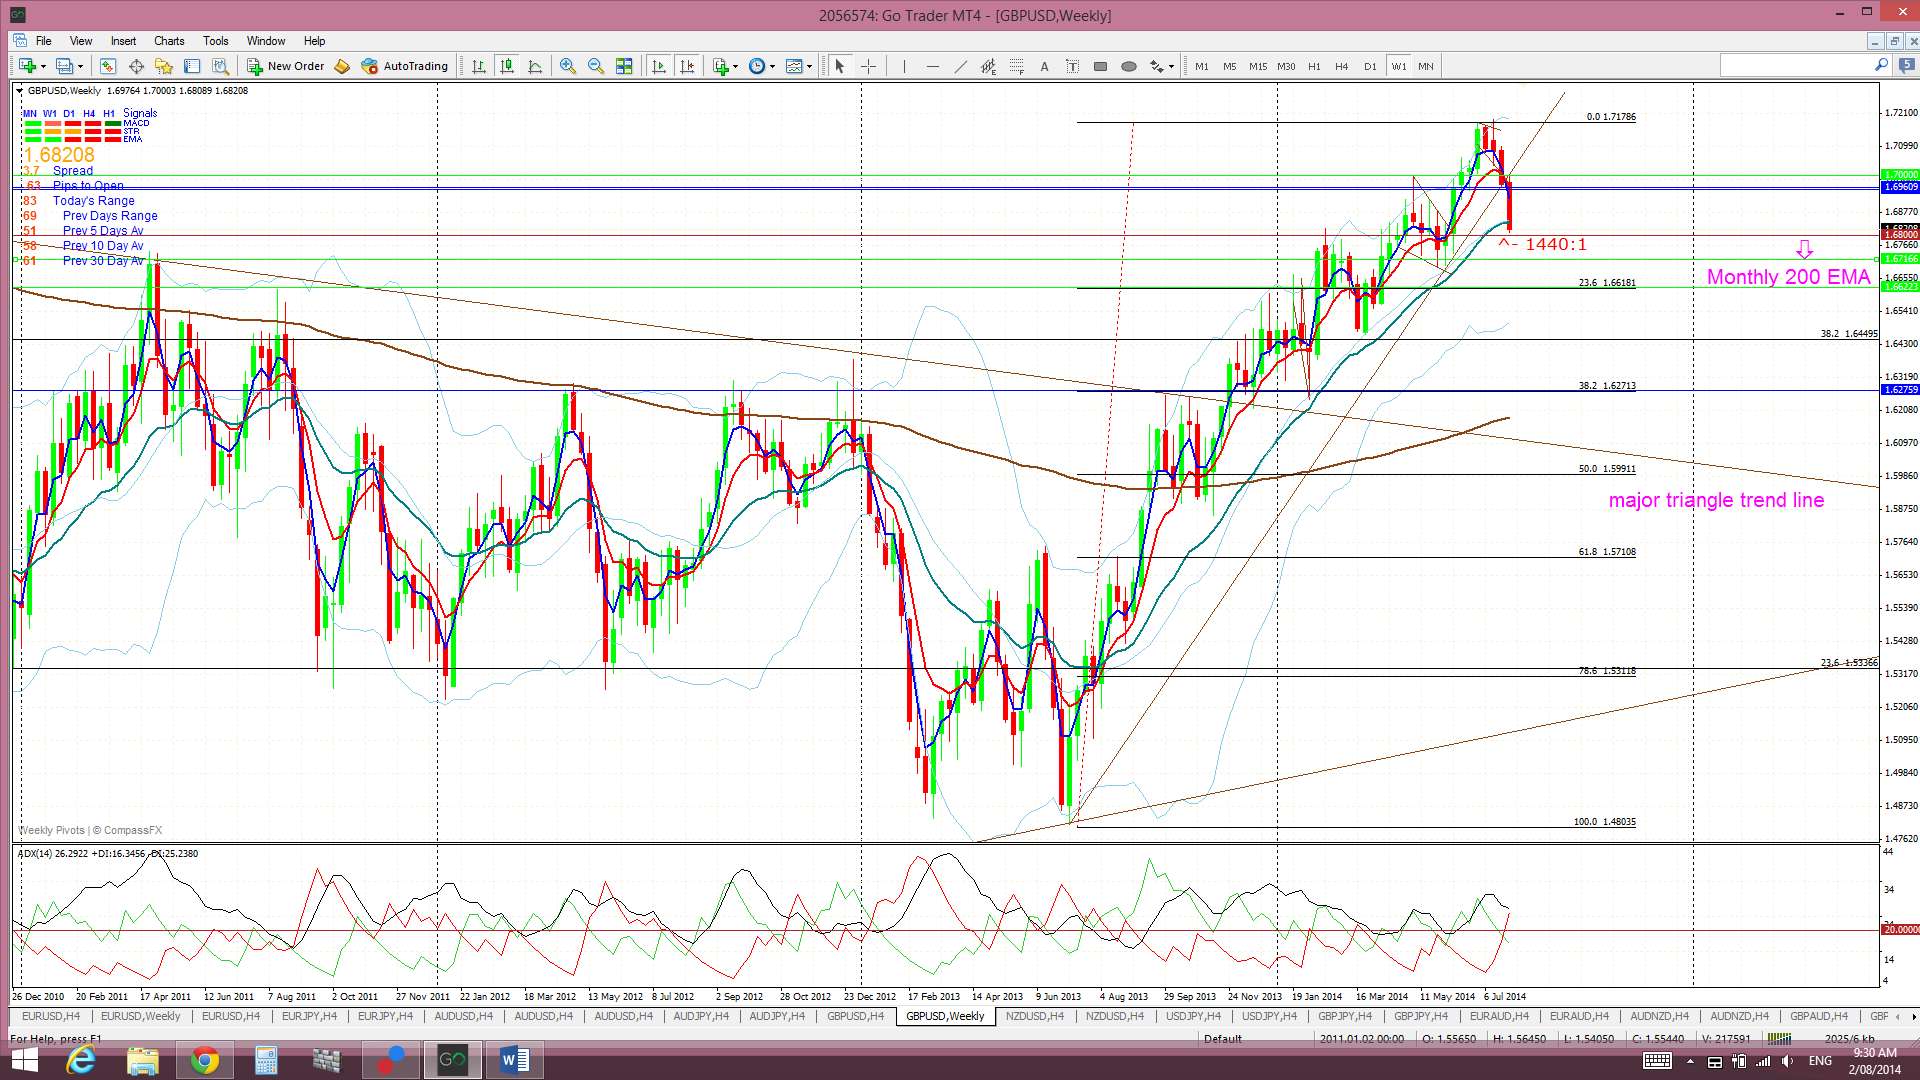
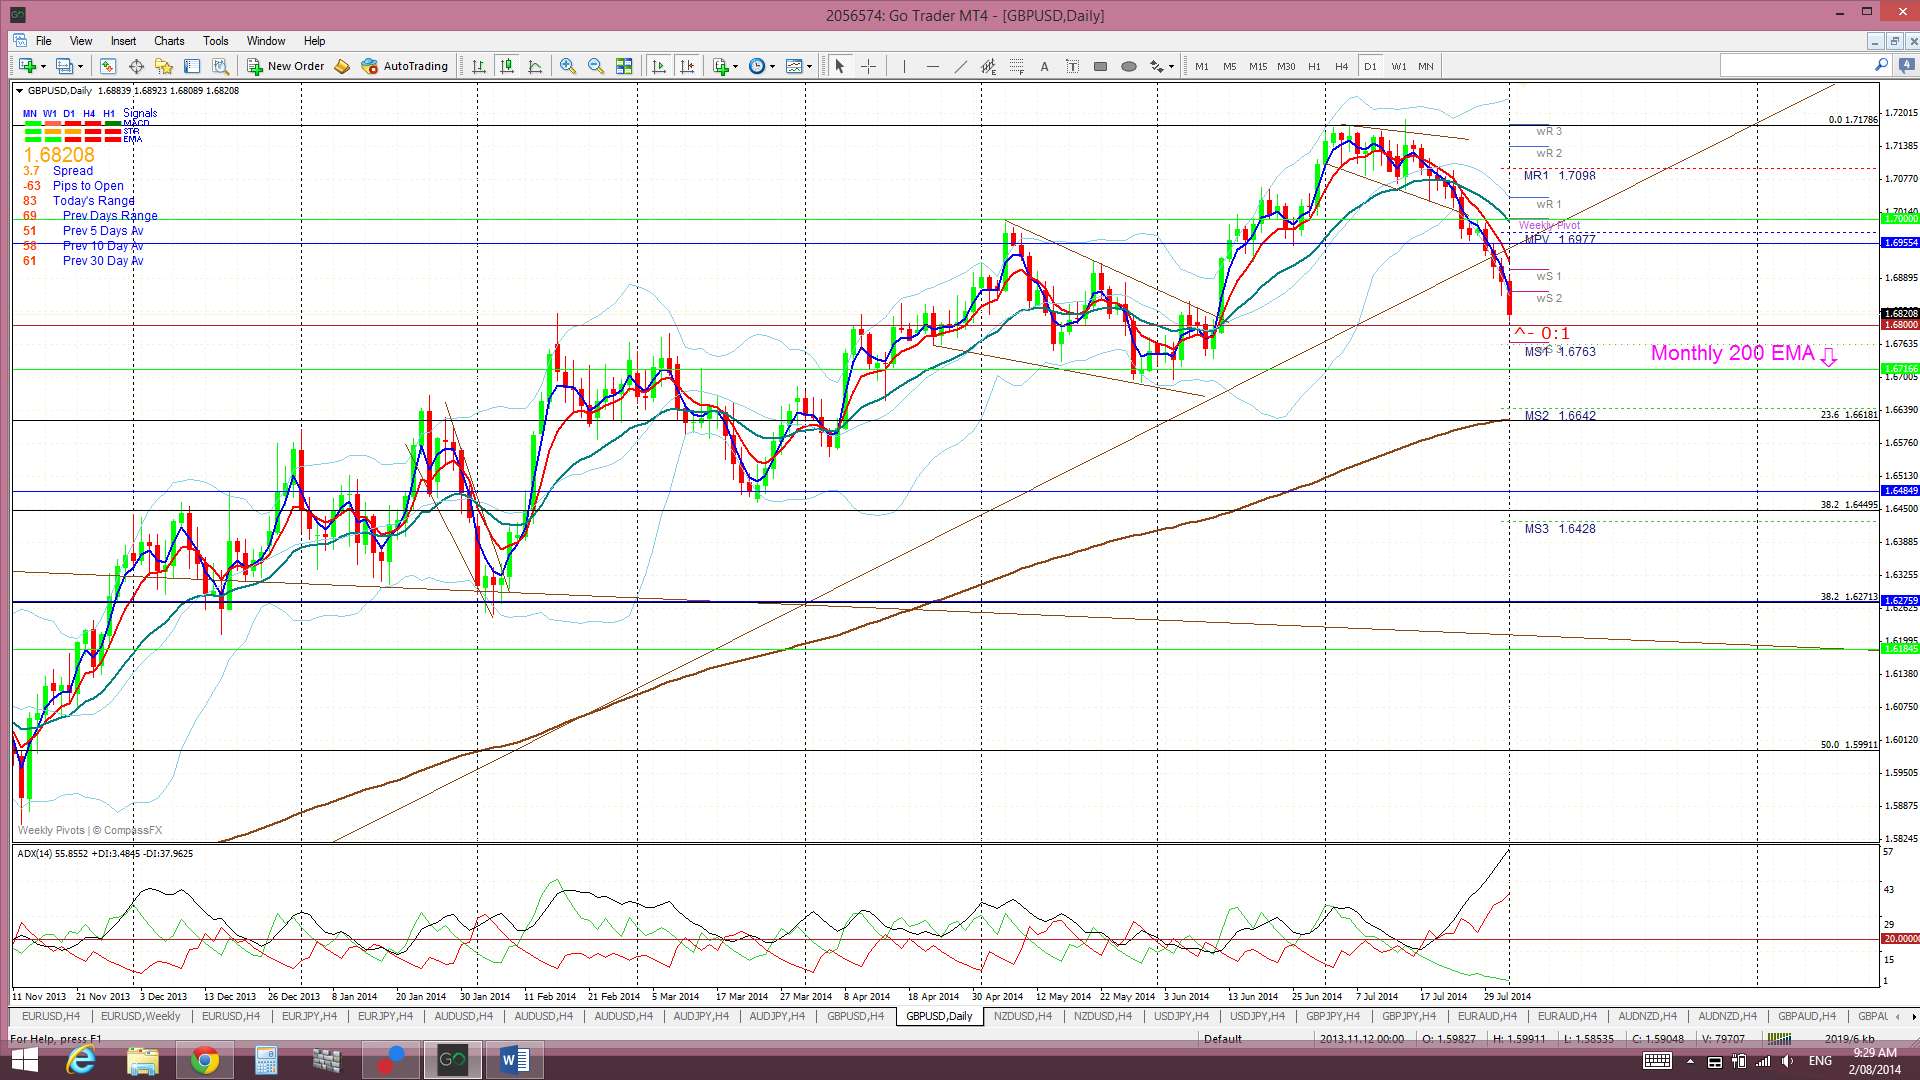
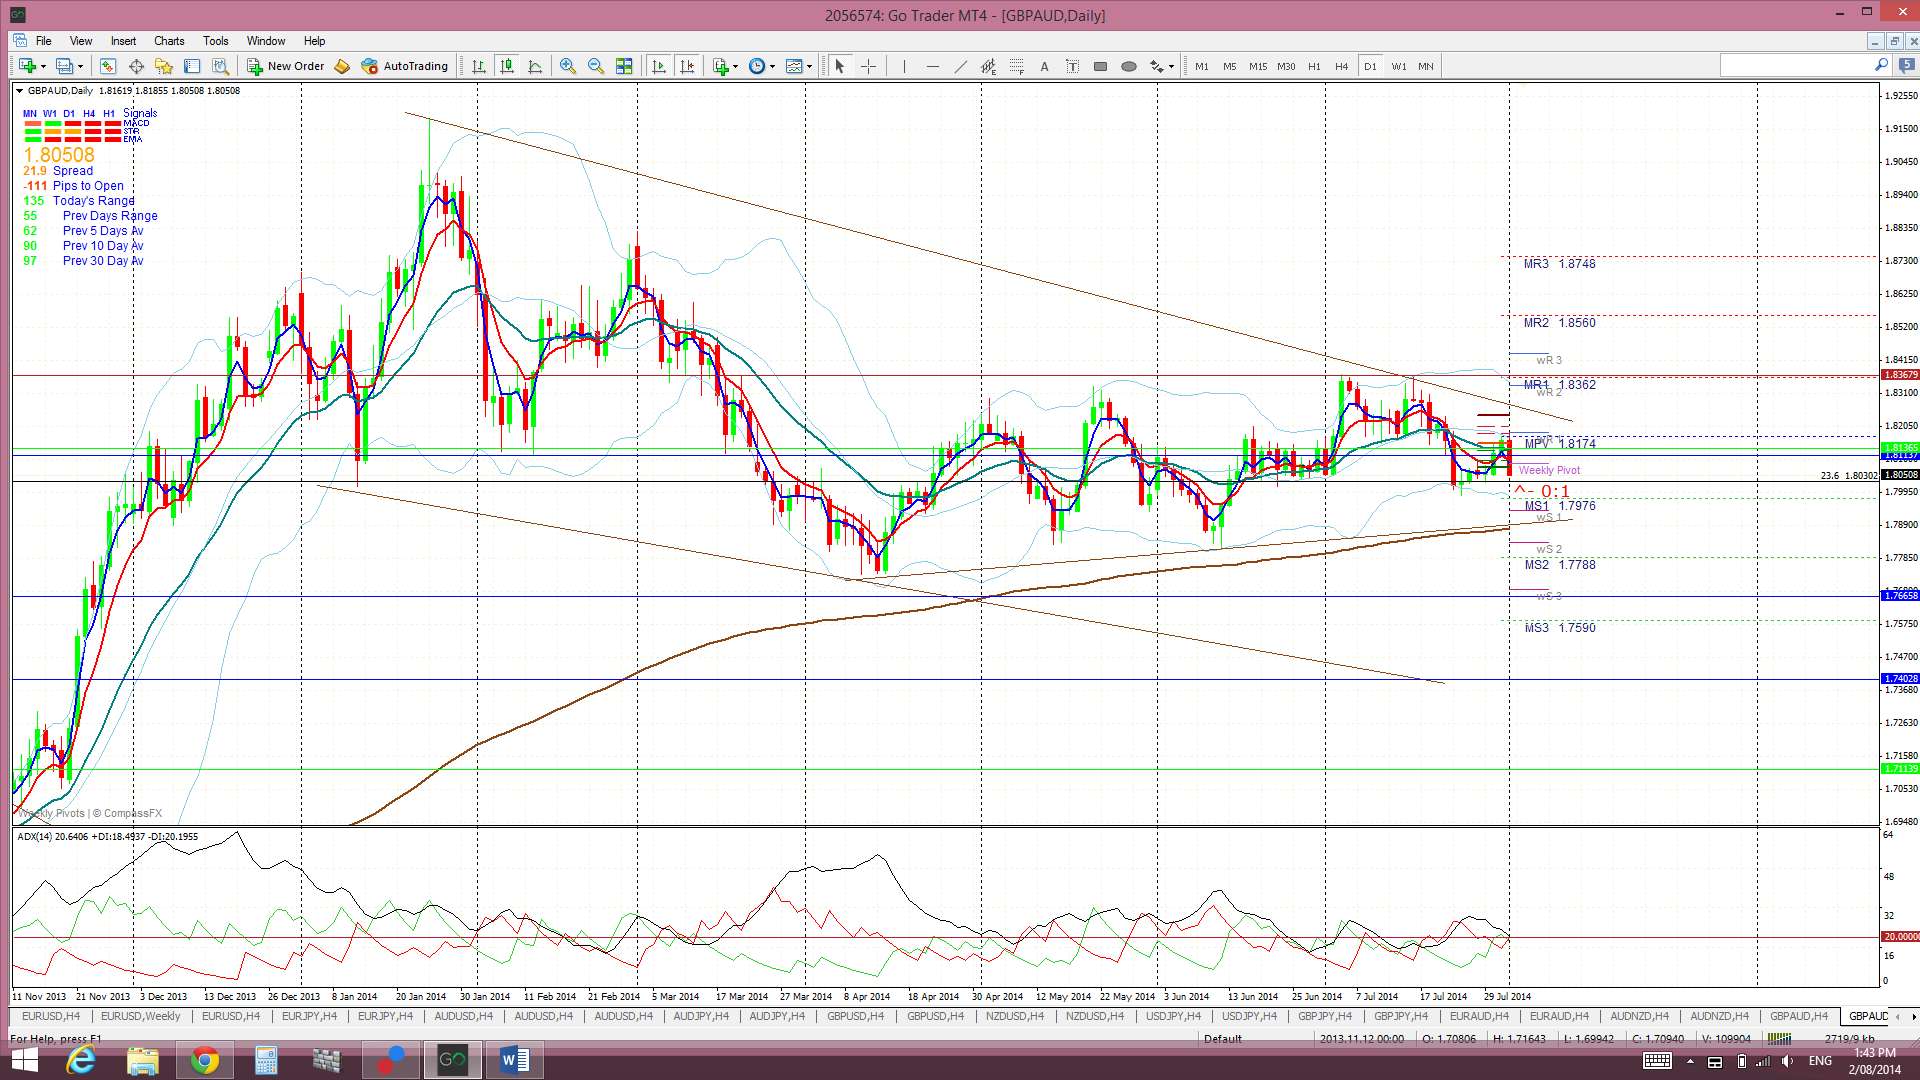
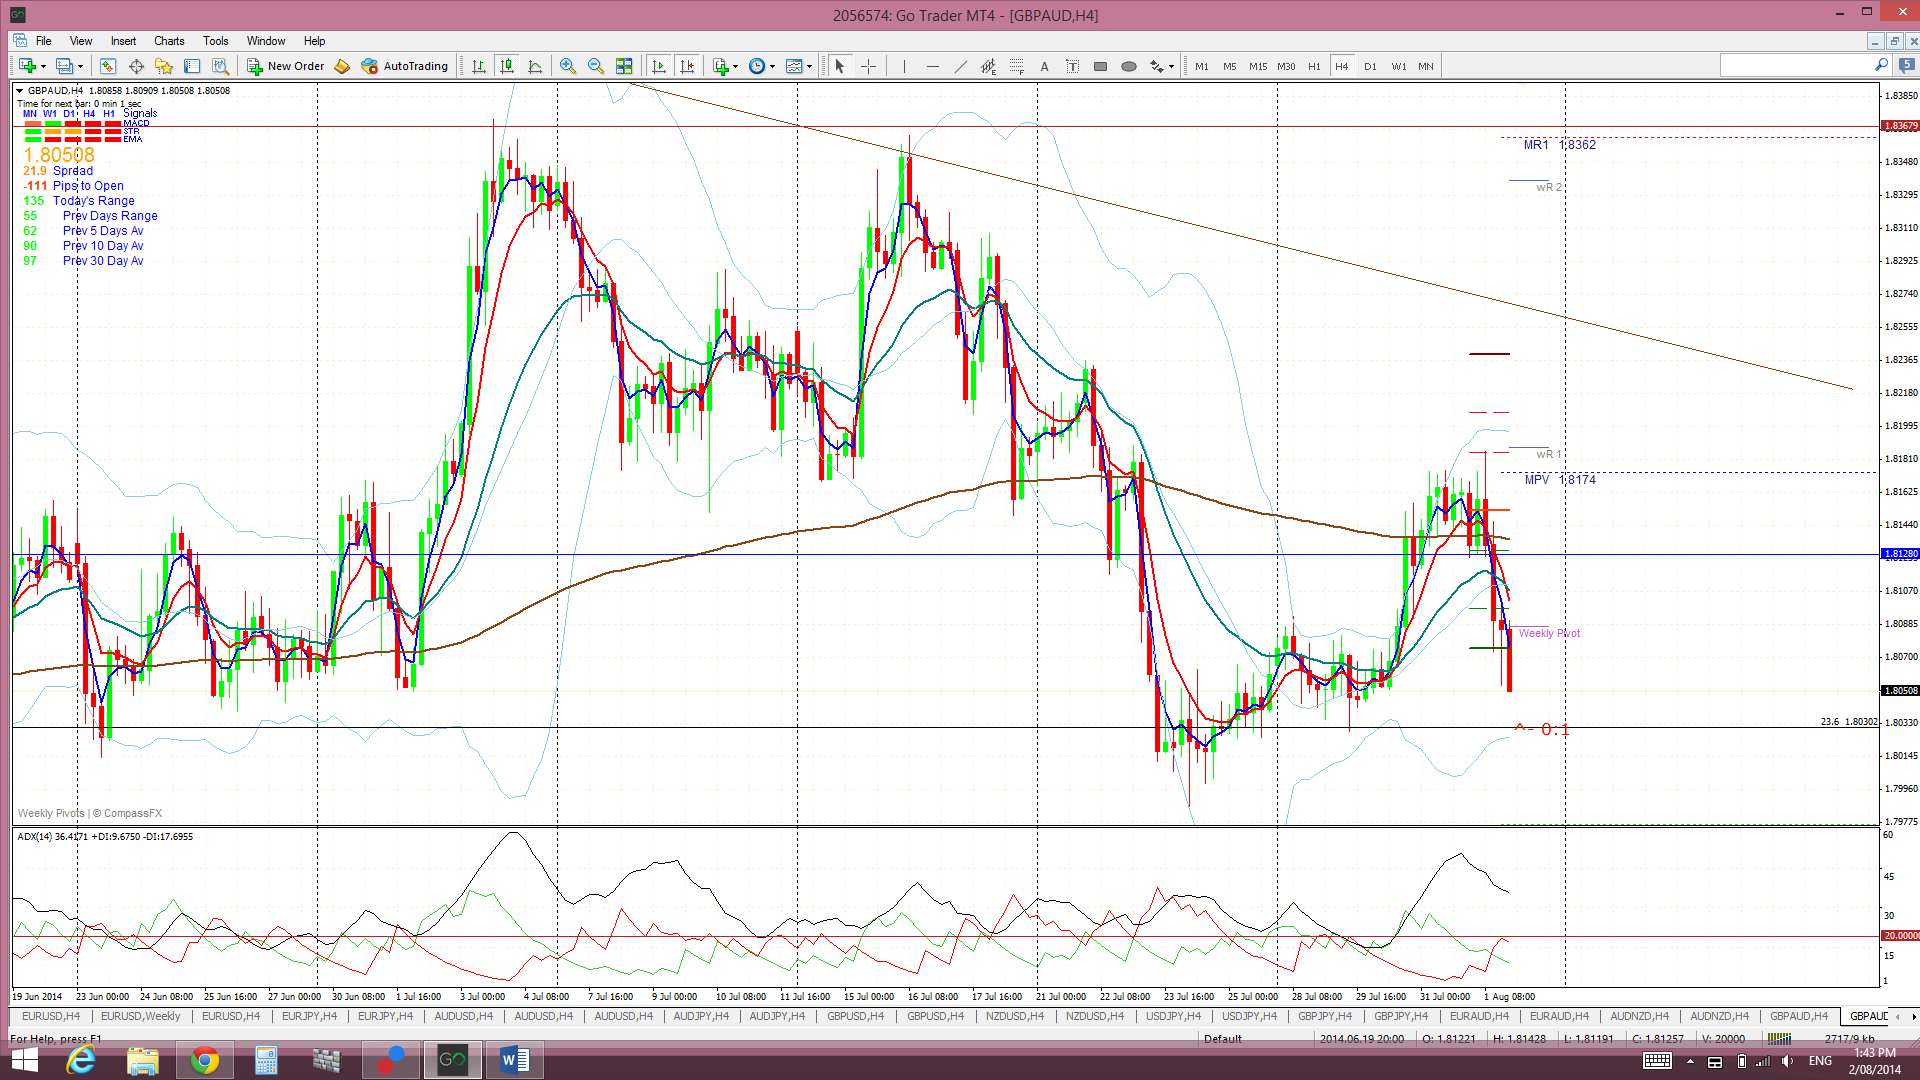
G/U: The Cable continued to chop lower last week below the previously broken 1.70 support level. This bearish continuation also resulted in it breaking down through the weekly support trend line. The Cable didn’t get much of a reprieve from the bit of USD weakness on Friday and it closed only just above the 1.68 level. This is another key S/R level for the Cable and can be seen more clearly on the condensed view of the weekly chart posted below. Any new close below the 1.68 would suggest bearish continuation:

The weekly close below the weekly support trend line already suggests that a further pull back may be in store here though. Possible targets include:
- The 1.68 S/R level (only 20 pips away)
- The monthly 200 EMA, near the 23.6% fib of the recent bull move (100 pips away)
- The 1.6 region. This is near the 50% fib of the recent bull move and the previously broken monthly chart’s triangle trend line (800 pips away)
A break and close below the 1.68 would suggest a test of the monthly 200 EMA. Any such action would bring this major S/R level back into focus as this has been a significant demarcation level for the Cable. A break and hold below the monthly 200 EMA would suggest possible follow through to the 1.6 level.
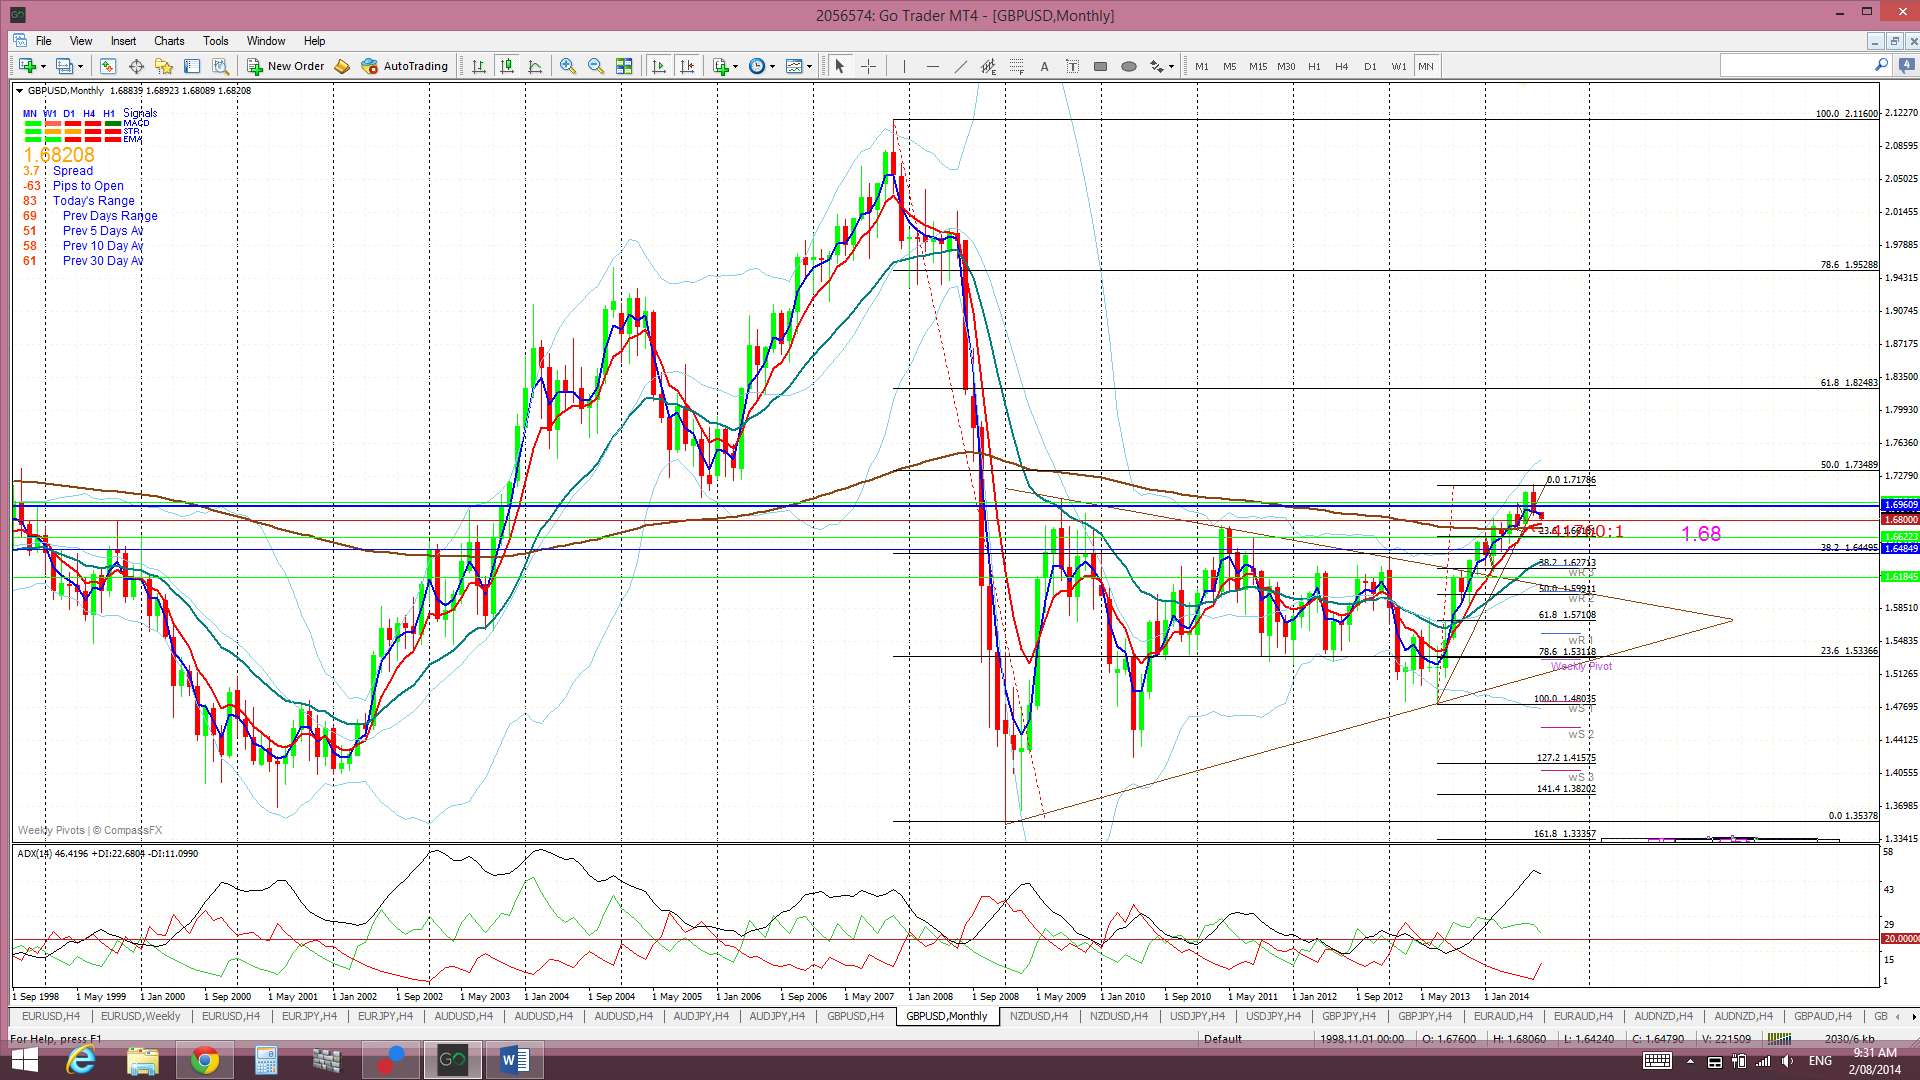
Bullish targets for any continued hold above the monthly 200 EMA: This level remains a key level to watch here and any continued hold above this level would be quite bullish. It is important to remember that February was the first monthly close above this S/R level since September 2008 and, also, the highest monthly close since the bear move of 2007-2009. These were major achievements. A possible target for any continued bullish movement is best determined from the monthly chart. The 50 % fib level of the 2007-2009 bear move is up at around the 1.73 region and the 61.8 % fib is at the 1.82 region. Both of these levels might be possible profit targets. The 61.8% fib level is now about 1,400 pips away.
Price is now trading below the Cloud on the 4hr and daily chart, above the Cloud on the weekly and in the top edge of the Cloud on the monthly chart but this represents a bearish shift.
The weekly candle closed as a large bearish candle. That earlier weekly chart ‘Evening Star’ pattern, whilst not 100% technically correct, has certainly been accurate with direction here! The July candle closed as a bearish coloured ‘inside candle’ reflecting a certain degree of indecision here.
There are a lot of risk events for the Cable next week that traders need to be mindful of: any renewed USD weakness following NFP, GBP Construction and Services PMI, GBP Manufacturing production and GBP interest rates.
- I’m watching for any new TC signal on this pair, the 1.68 level and the monthly 200 EMA.

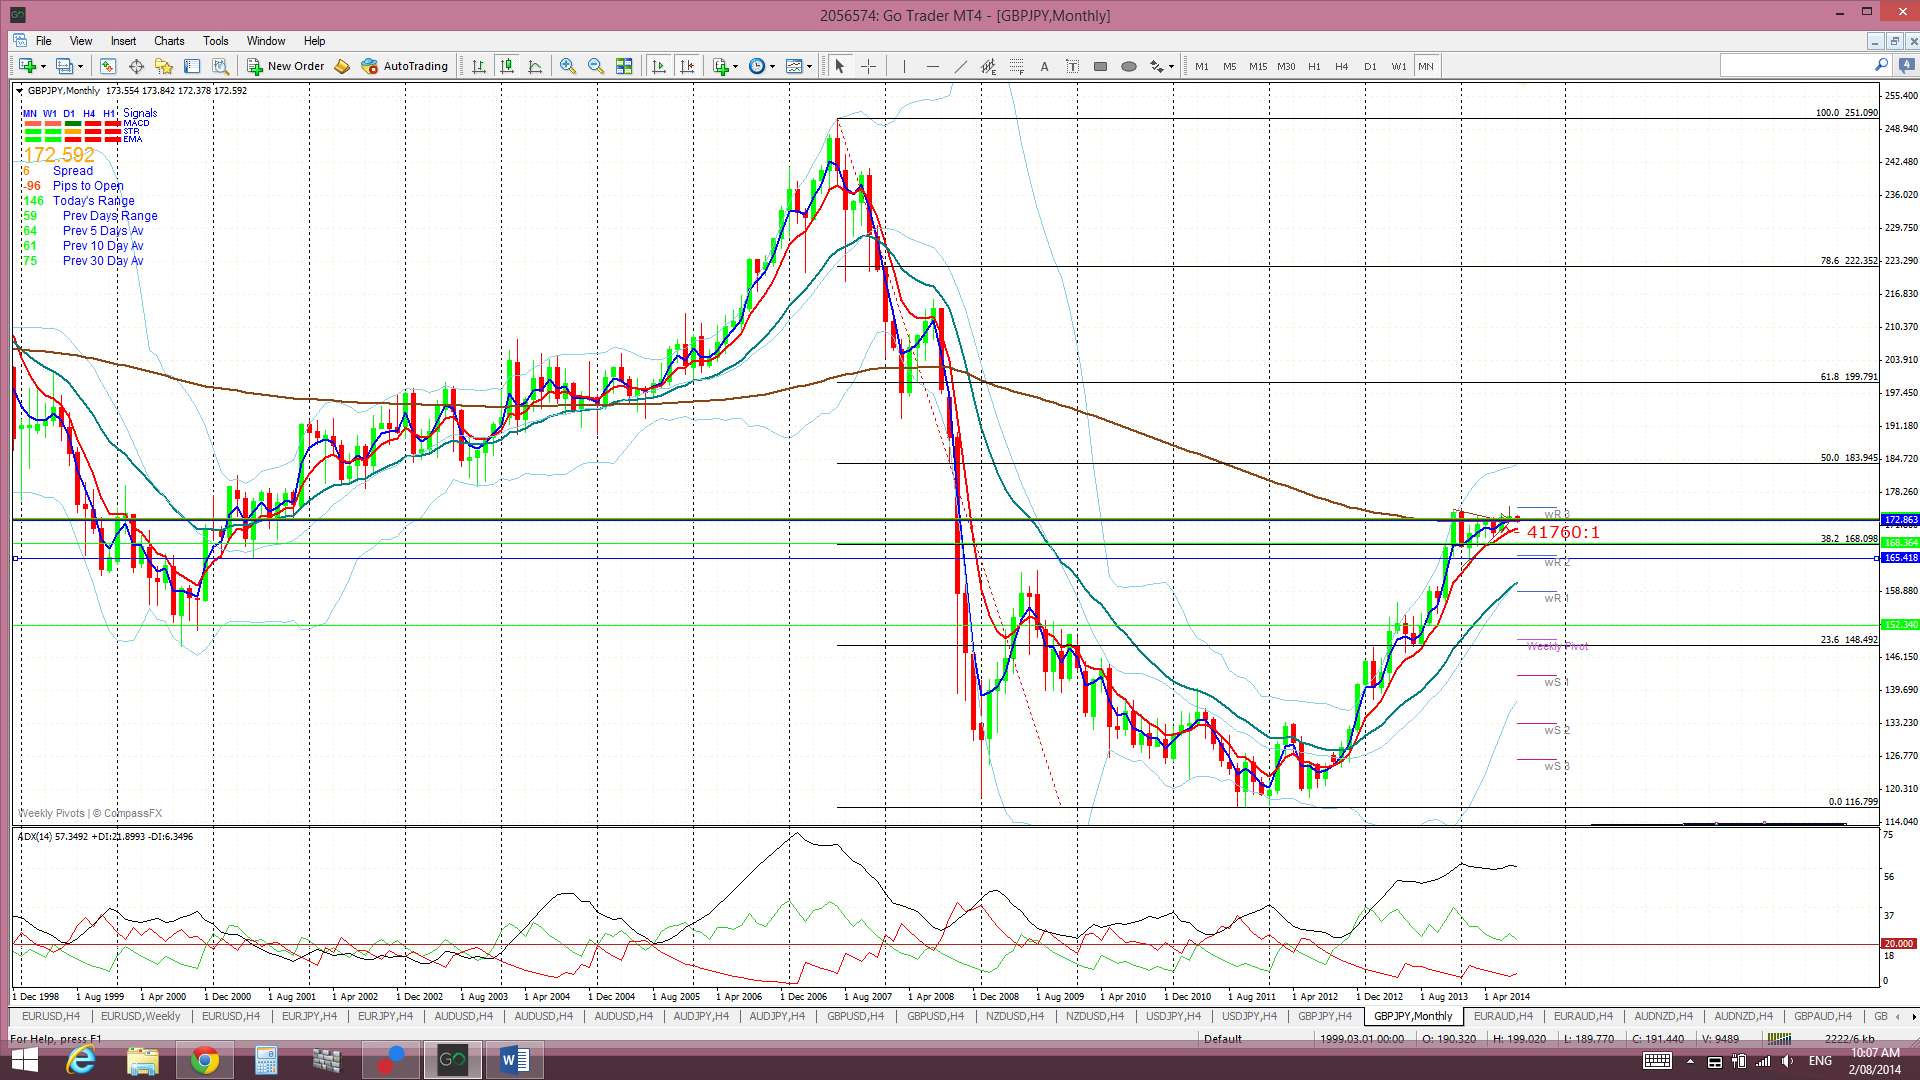
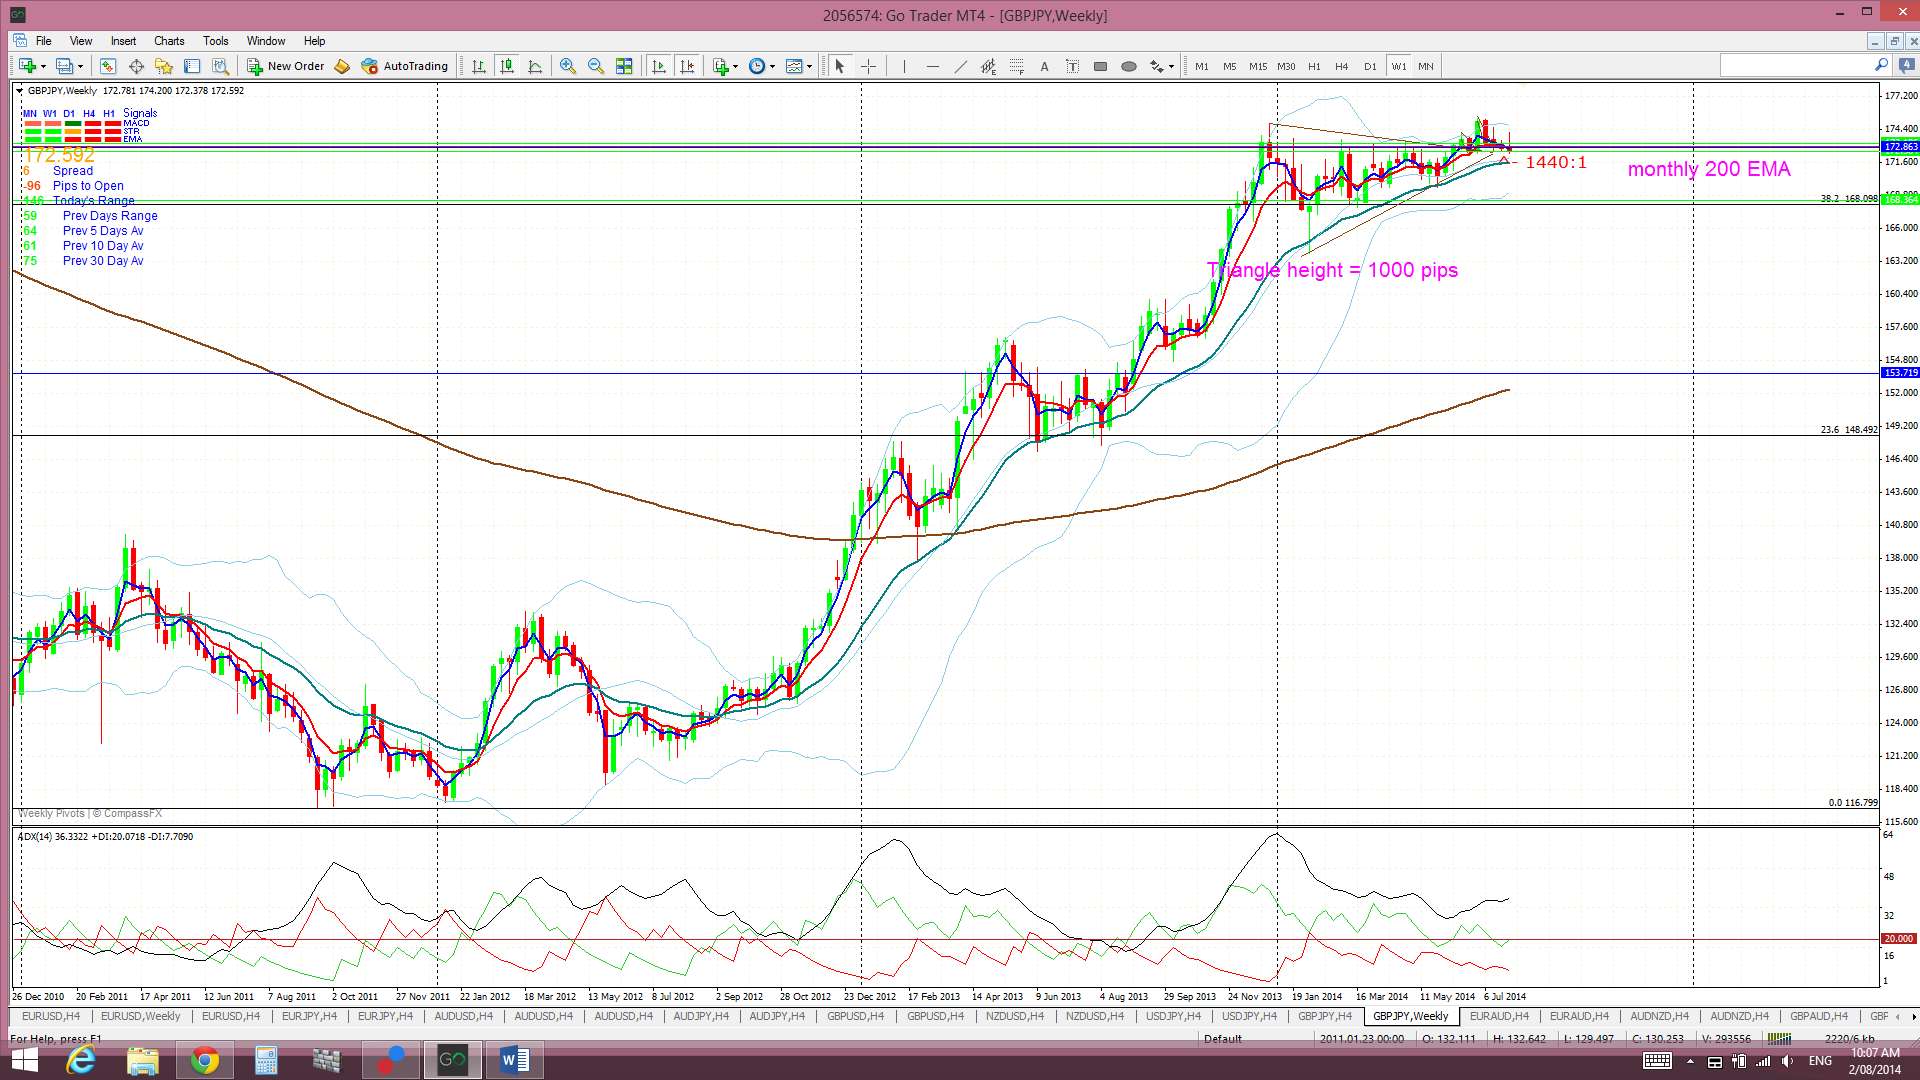
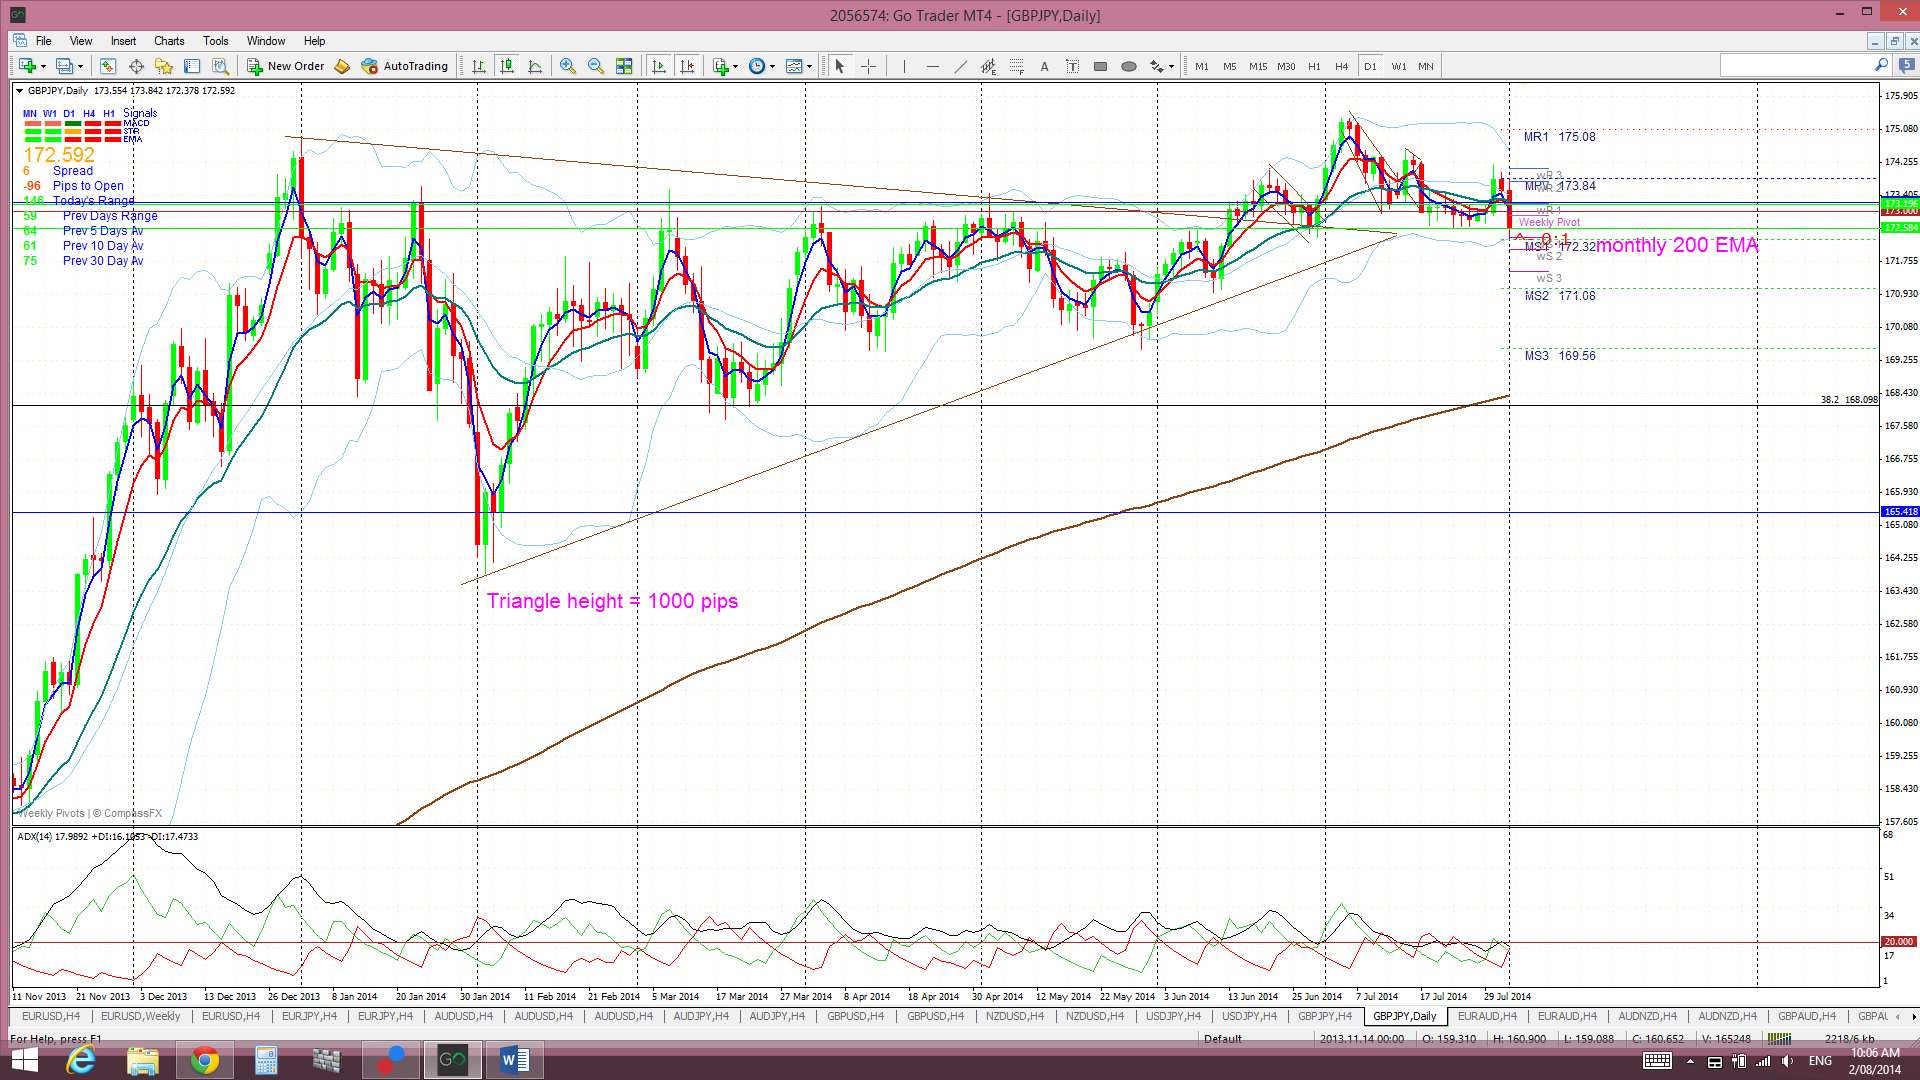
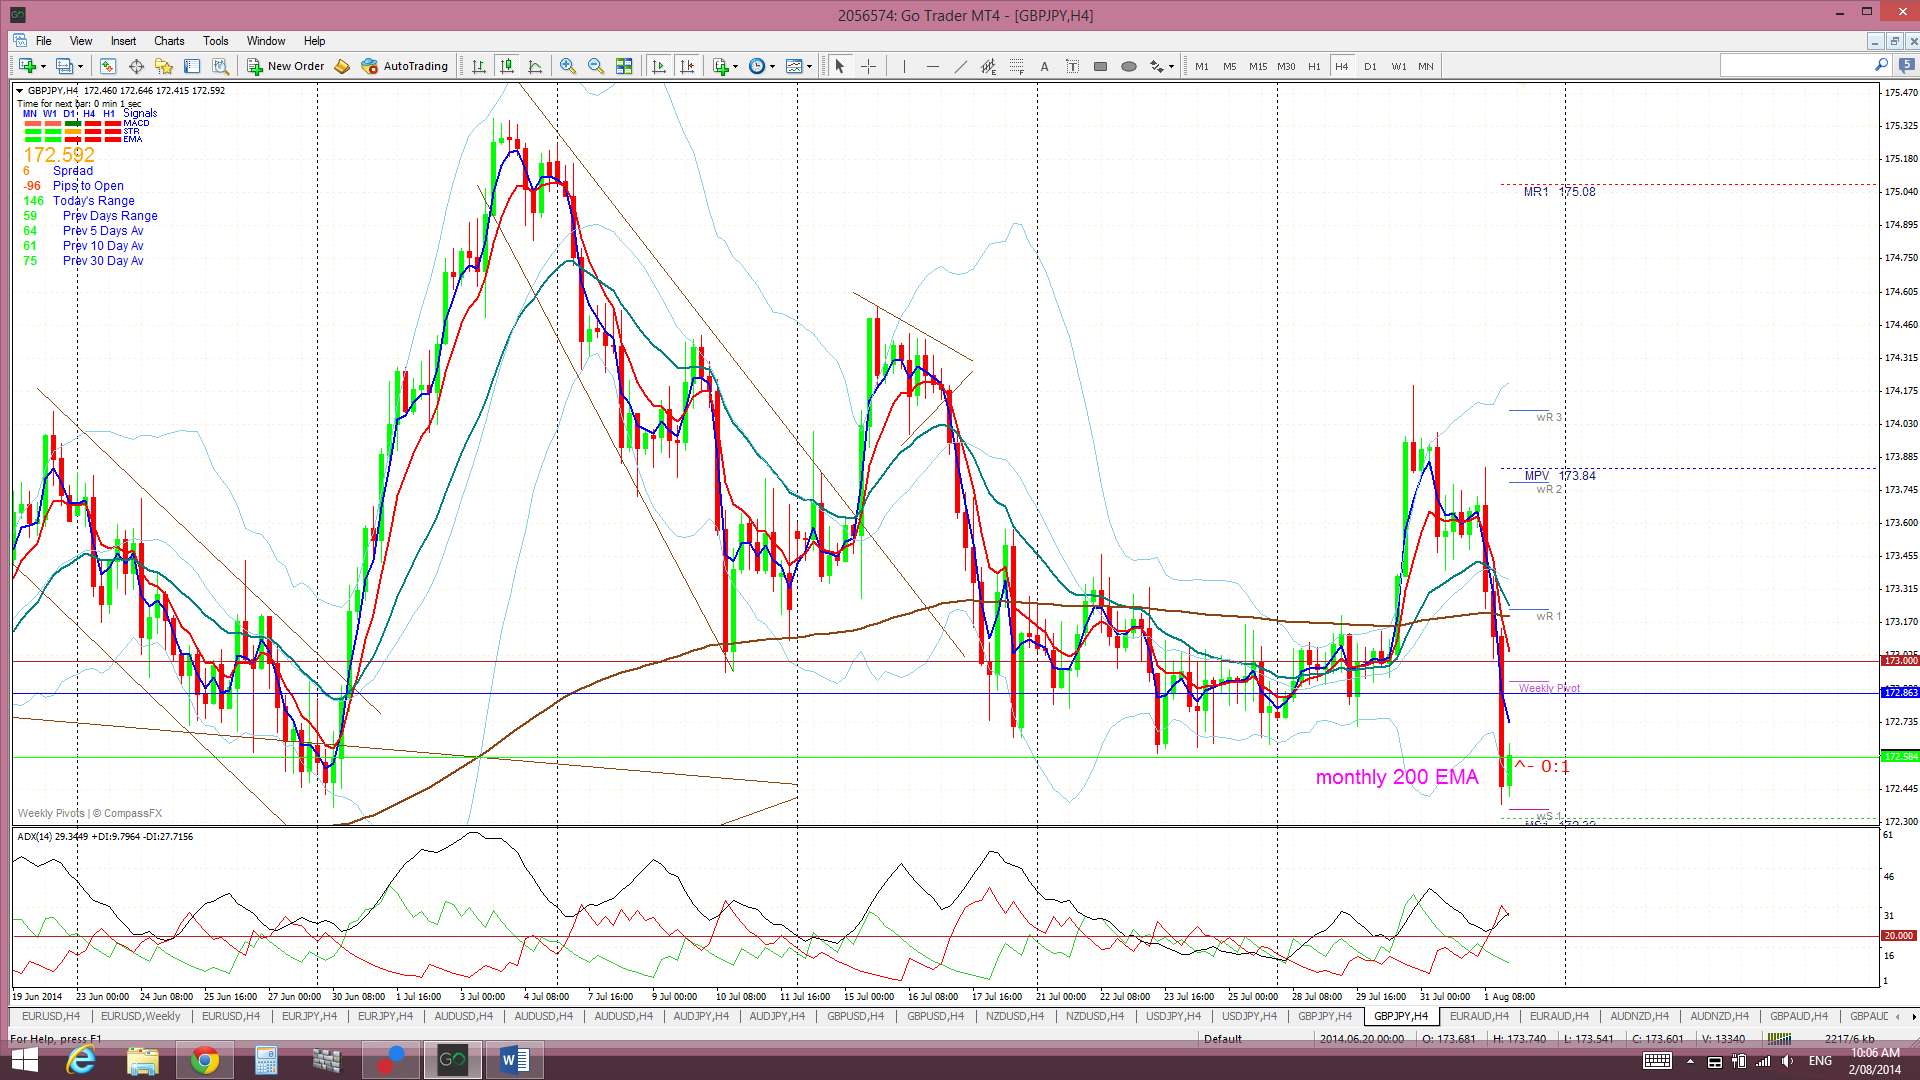
GBP/JPY: The GBP/JPY chopped sideways along the 173 level until rallying mid-week on the back of some U/J strength. Fresh GBP weakness following weaker than expected manufacturing data on Friday triggered a pull back here though. This was closely followed by US NFP which dragged the U/J down and, in turn, impacted negatively on the GBP/JPY. The pair closed the week back below the 173 and also back below the monthly 200 EMA.
Triangle breakout targets: The GBP/JPY has held up and out from trading within a triangle pattern on the daily/weekly charts. This pattern had been giving the weekly and monthly charts a ‘Bull Flag’ appearance. The daily/weekly triangle pattern is worth about 1000 pips and technical theory would suggest that the possible bull move from any breakout and continuation would be of a similar order of magnitude. A 1000 pip move would take the GBP/JPY up to about 183 which is near the 50% fib of the 2007-2012 bear move. The 61.8% fib, another popular trading target, is up at the 200 level which is 2,600 pips away. This breakout move has stalled for the time being but is still valid. A break and hold back below the monthly 200 EMA would void this pattern though.
Price is trading below the Ichimoku Cloud on the 4hr chart, at the top edge of the Cloud on the daily chart but above the Cloud on the weekly and monthly charts.
The weekly candle closed as a small bearish candle with a long upper shadow. The July candle closed as a bullish coloured ‘Spinning Top/Doji’.
Traders need to be mindful of and the swathe of GBP and JPY high impact data scheduled for the coming week.
- I’m watching for any new TC signal on this pair, the 173 level and the monthly 200 EMA.
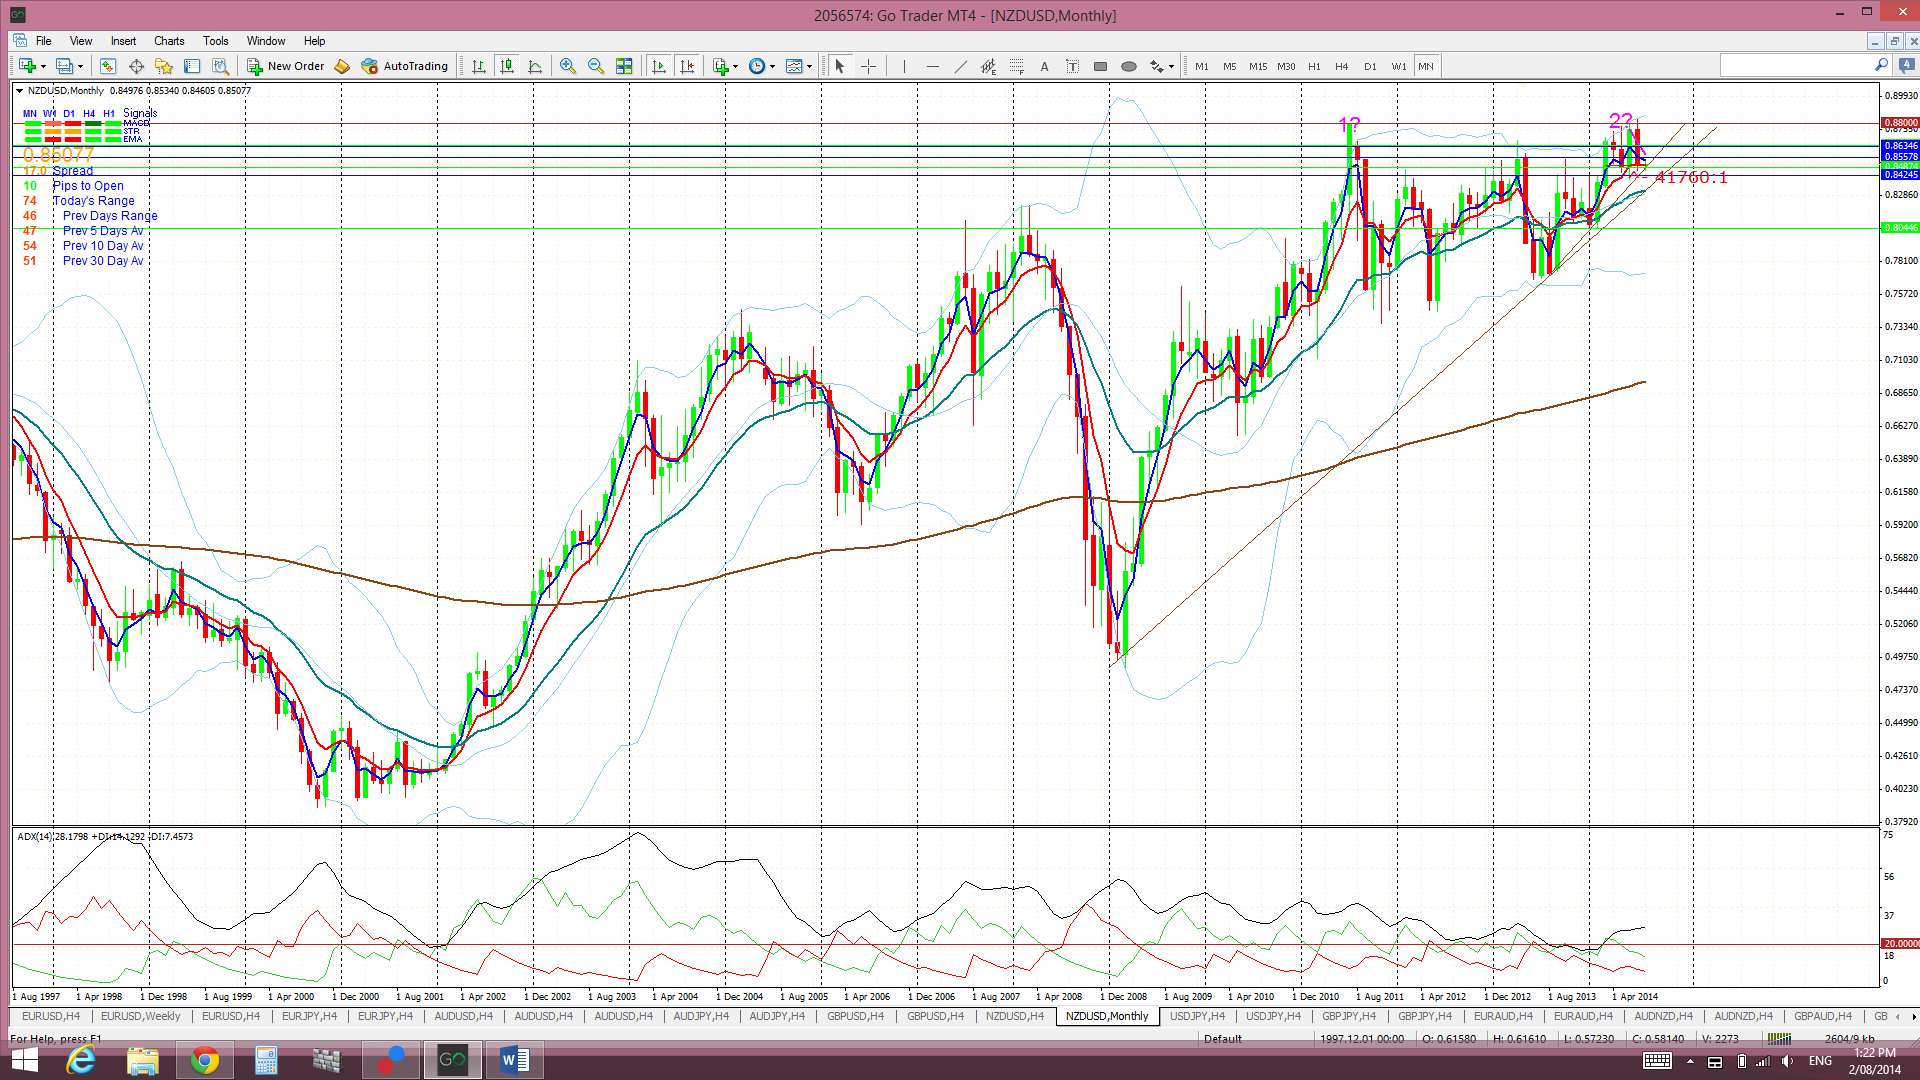
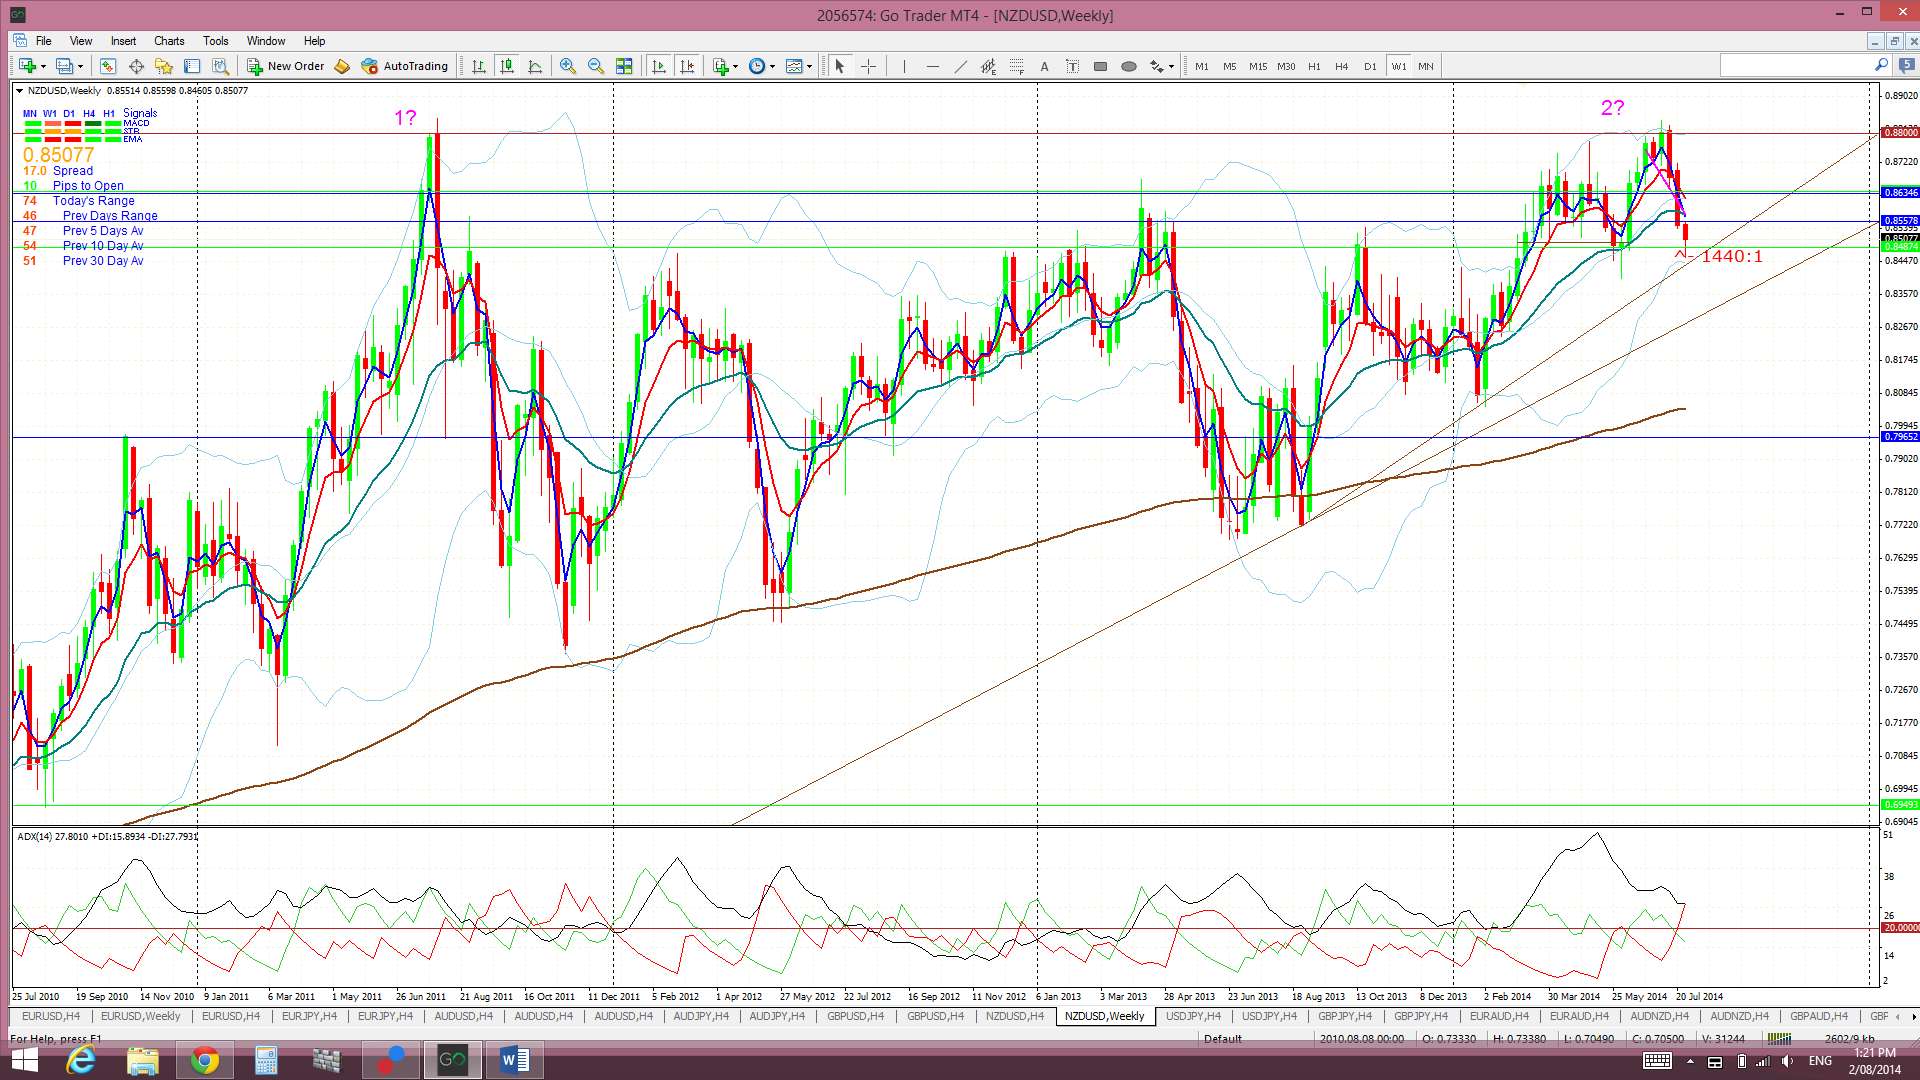
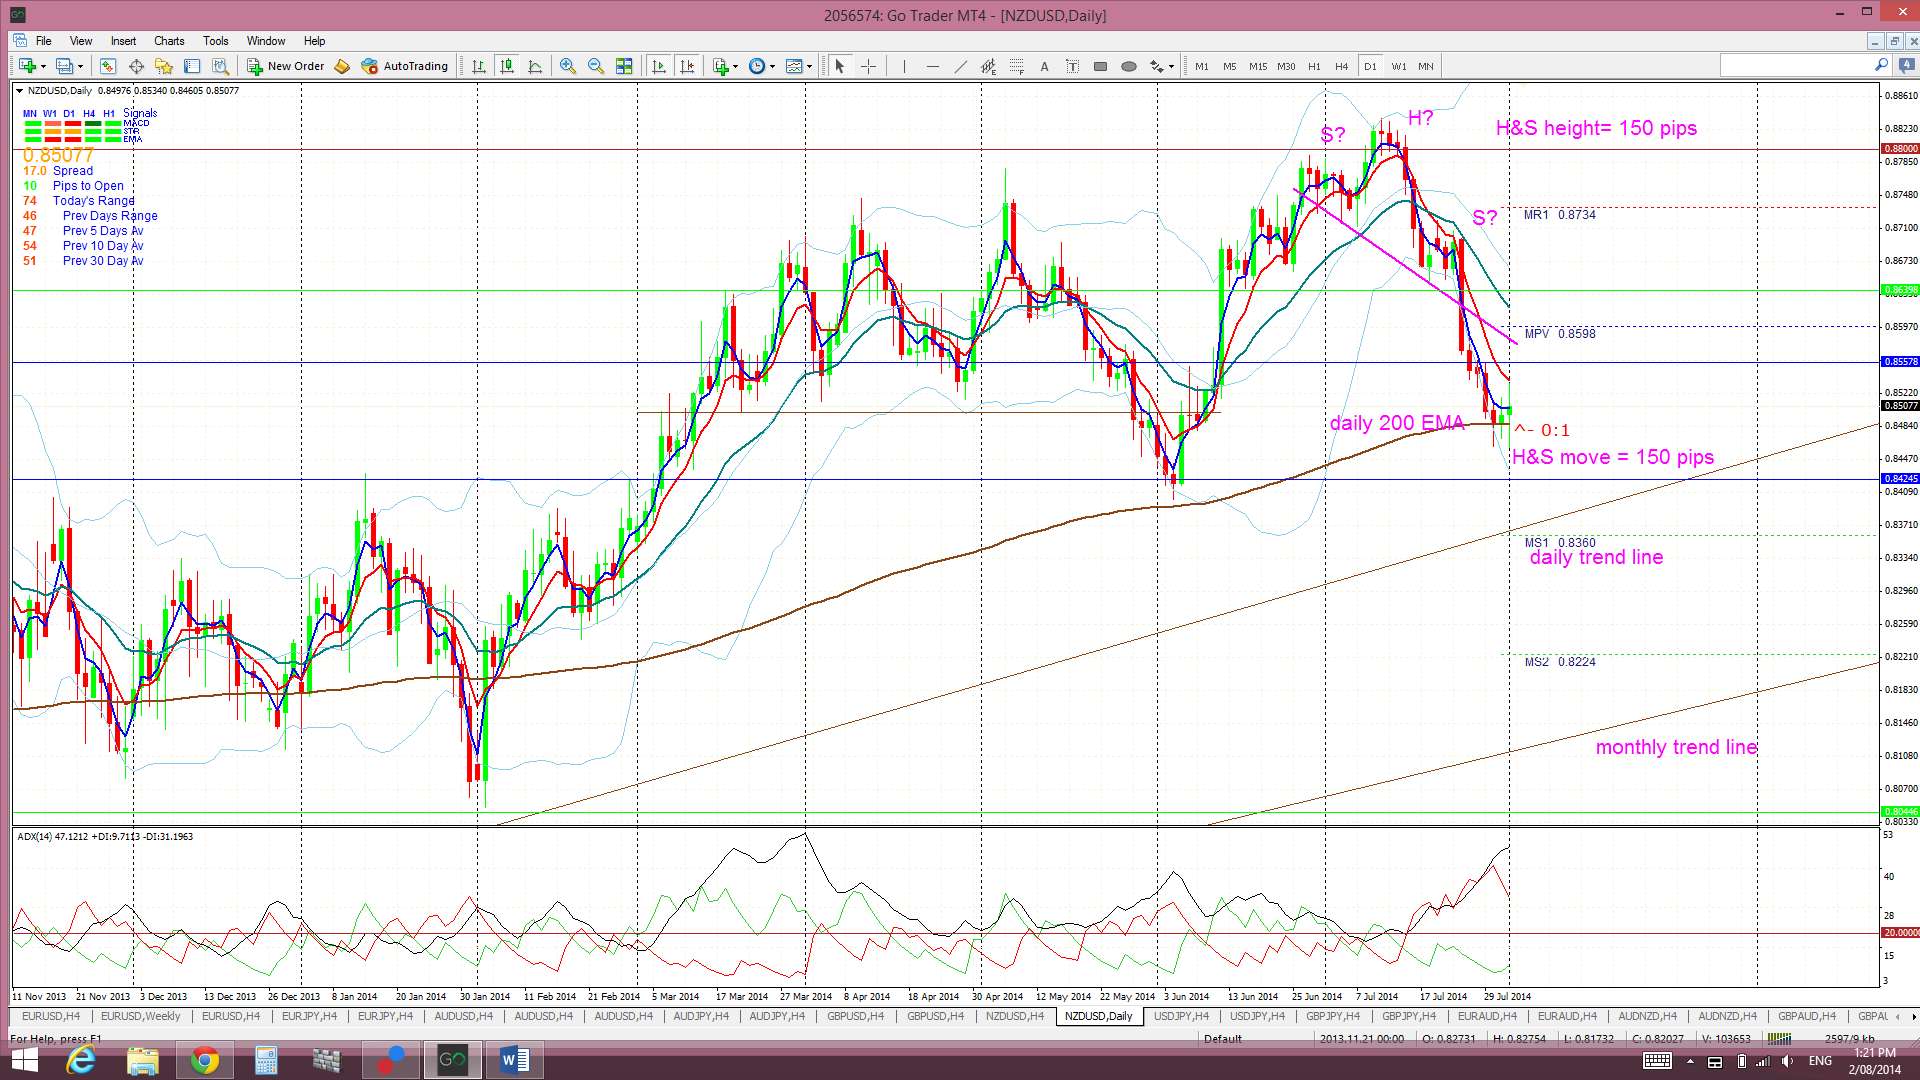
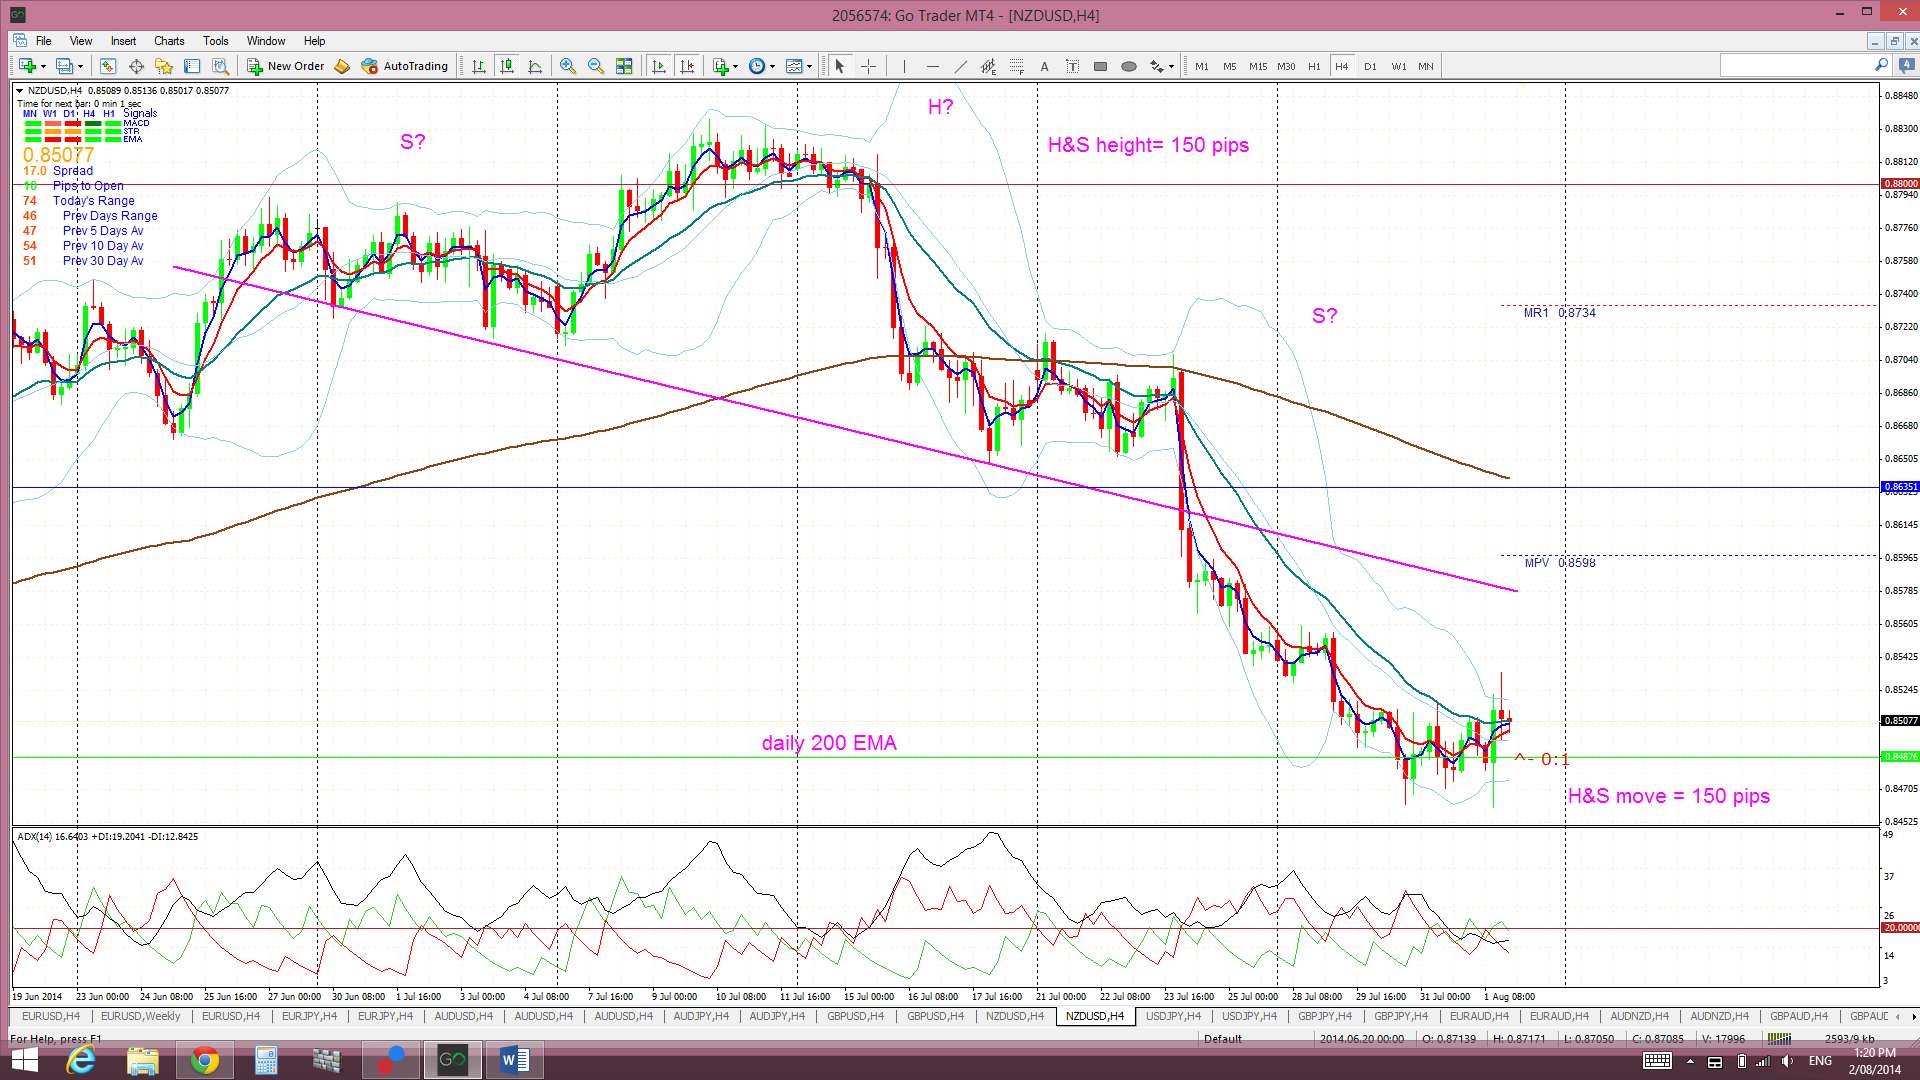
Kiwi: NZD/USD: The 4 hr chart’s bearish H&S completed during last week producing the full 150 pip quota of pips. The monthly chart still shows that whilst the Kiwi is trading within a bullish ascending triangle there is still plenty of room for a deeper pullback to either the weekly or monthly support trend lines.
Price is still trading below the Ichimoku Cloud on the 4hr and daily charts but above the Cloud on the weekly and monthly charts.
The weekly candle closed as a bearish candle. The July candle closed as a large bearish candle and, like the A/U, this has a bearish-reversal ‘Railway Track’ look to it as well.
Any renewed USD weakness could help to support this pair though. Watch out for NZD unemployment data on Thursday too.
- I’m watching for any new TC signal on this pair.
EUR/AUD: This pair chopped sideways to start the week but then rallied up to test the top of the daily chart’s bullish descending wedge pattern. It broke up through the upper trend line of this pattern on Friday and closed above this resistance and also above the monthly pivot. A continued hold above this wedge pattern and pivot would be bullish.
I’m still seeing the look of a possible H&S building on the weekly chart as well. This would tie in with any bullish breakout on the E/A from the descending wedge on the daily chart though.
The E/A is still trading above the Cloud on the 4hr but below the Cloud on the daily chart which suggest choppiness.
The weekly candle closed as a bullish candle and has given this chart a bit of a bullish-reversal ‘Railway Track’ appearance! The July candle closed as a bearish candle with a long lower shadow.
There is a lot of high impact data for both the EUR and AUD this week. Traders need to be mindful of these items when monitoring this pair.
- I’m watching for any new TC signal on this pair and the descending wedge trend lines.
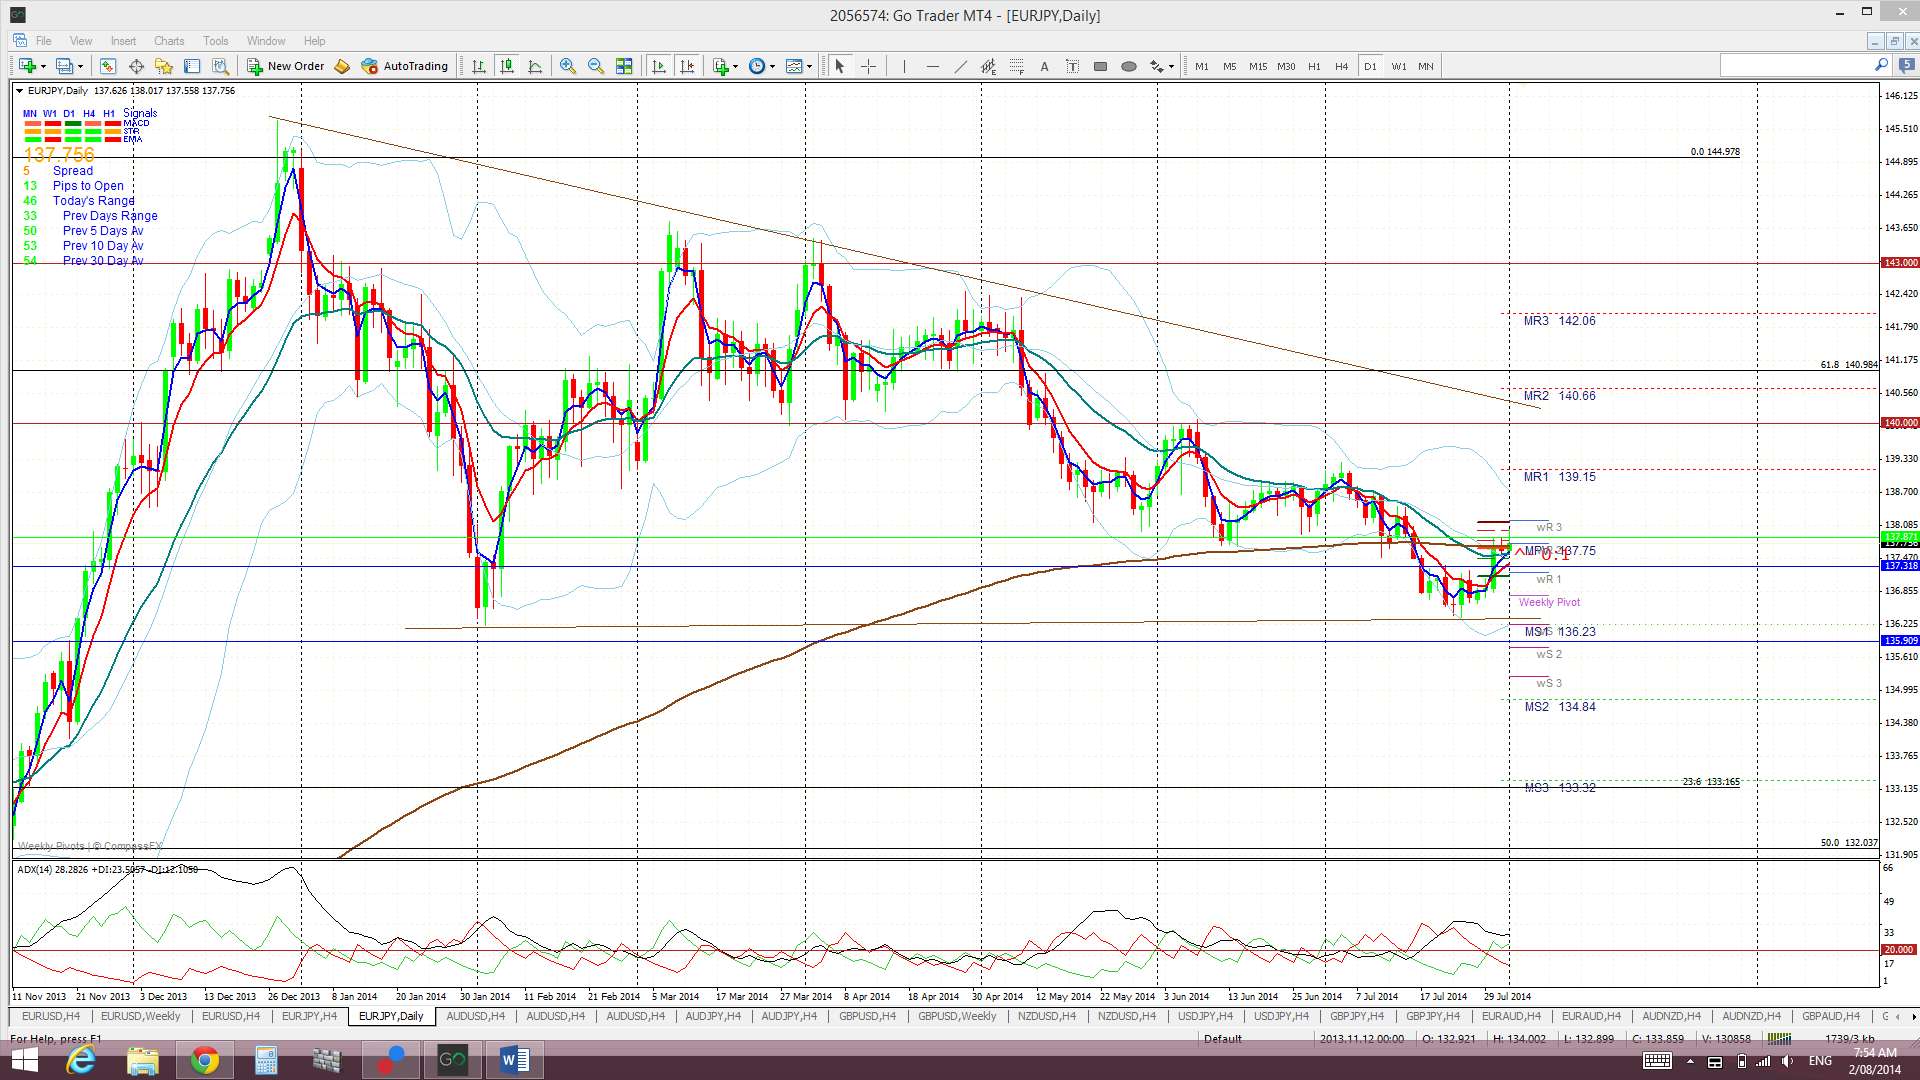
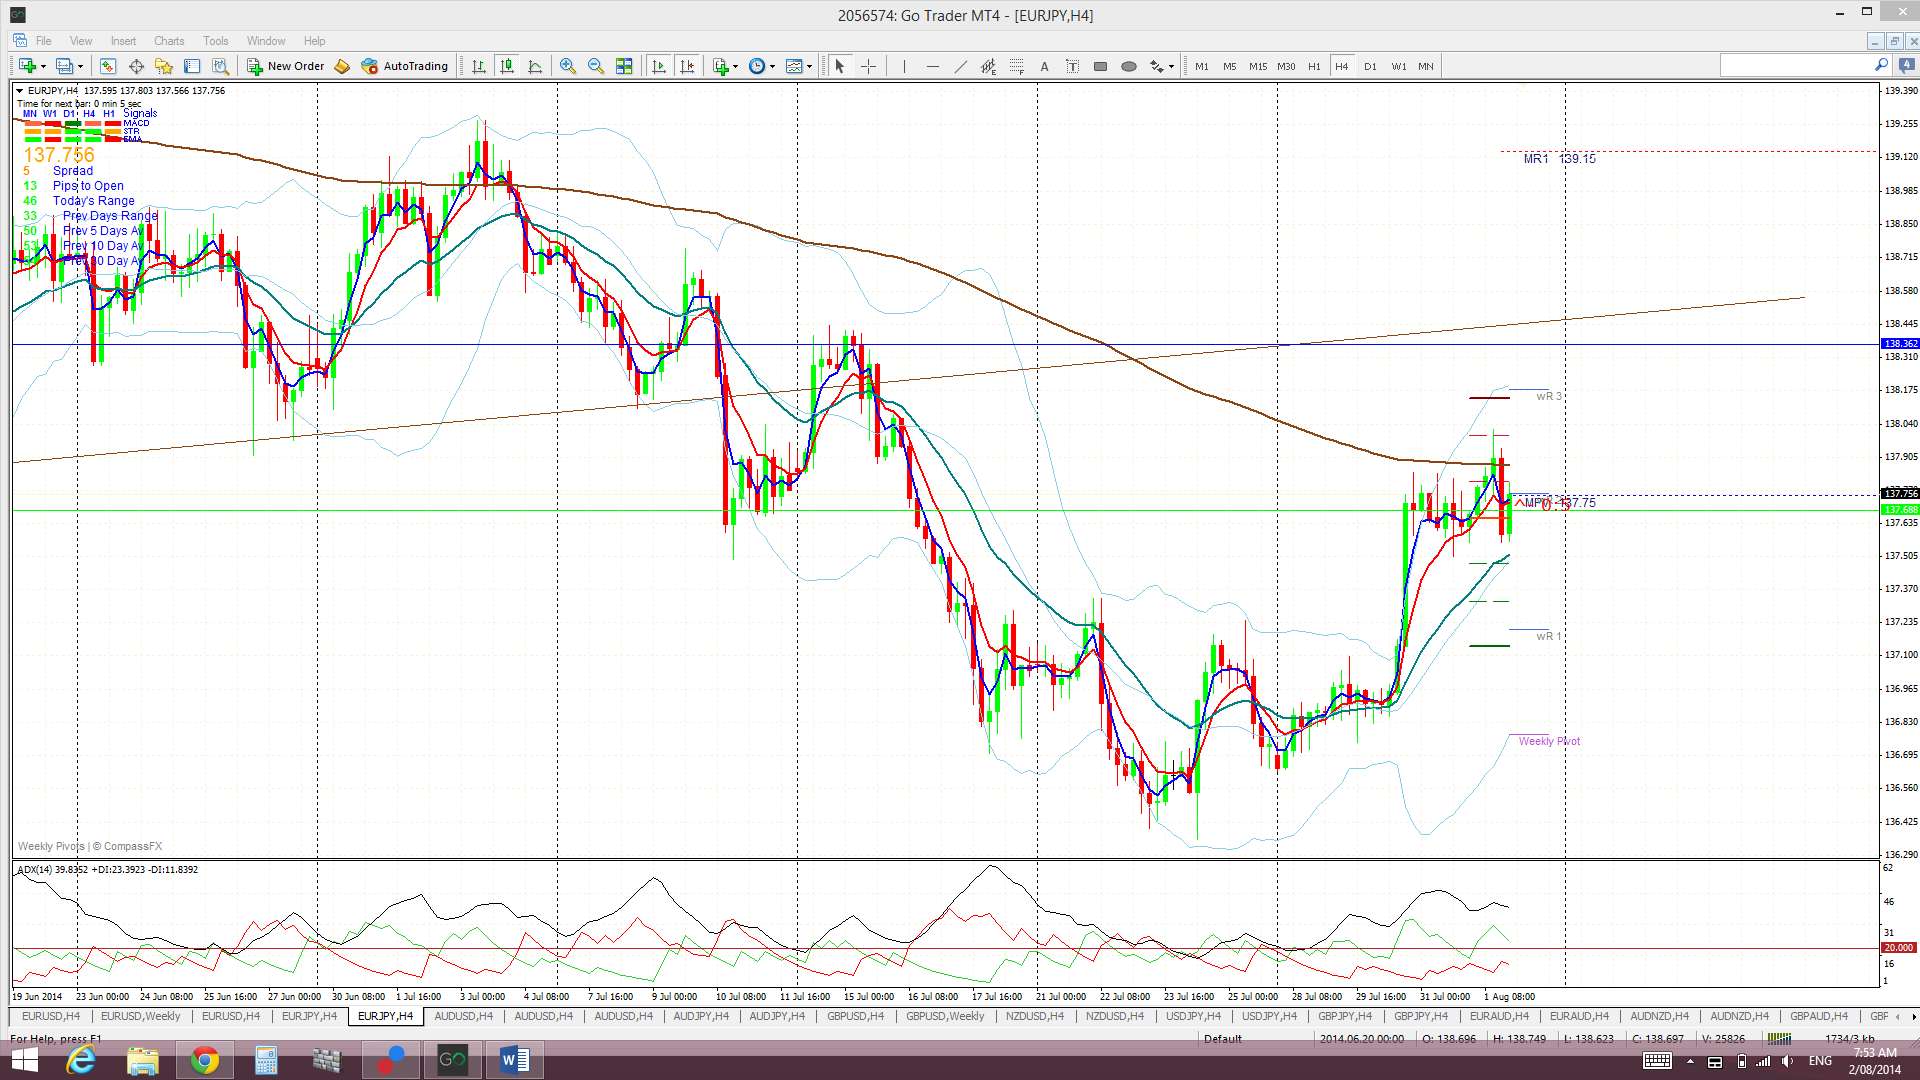
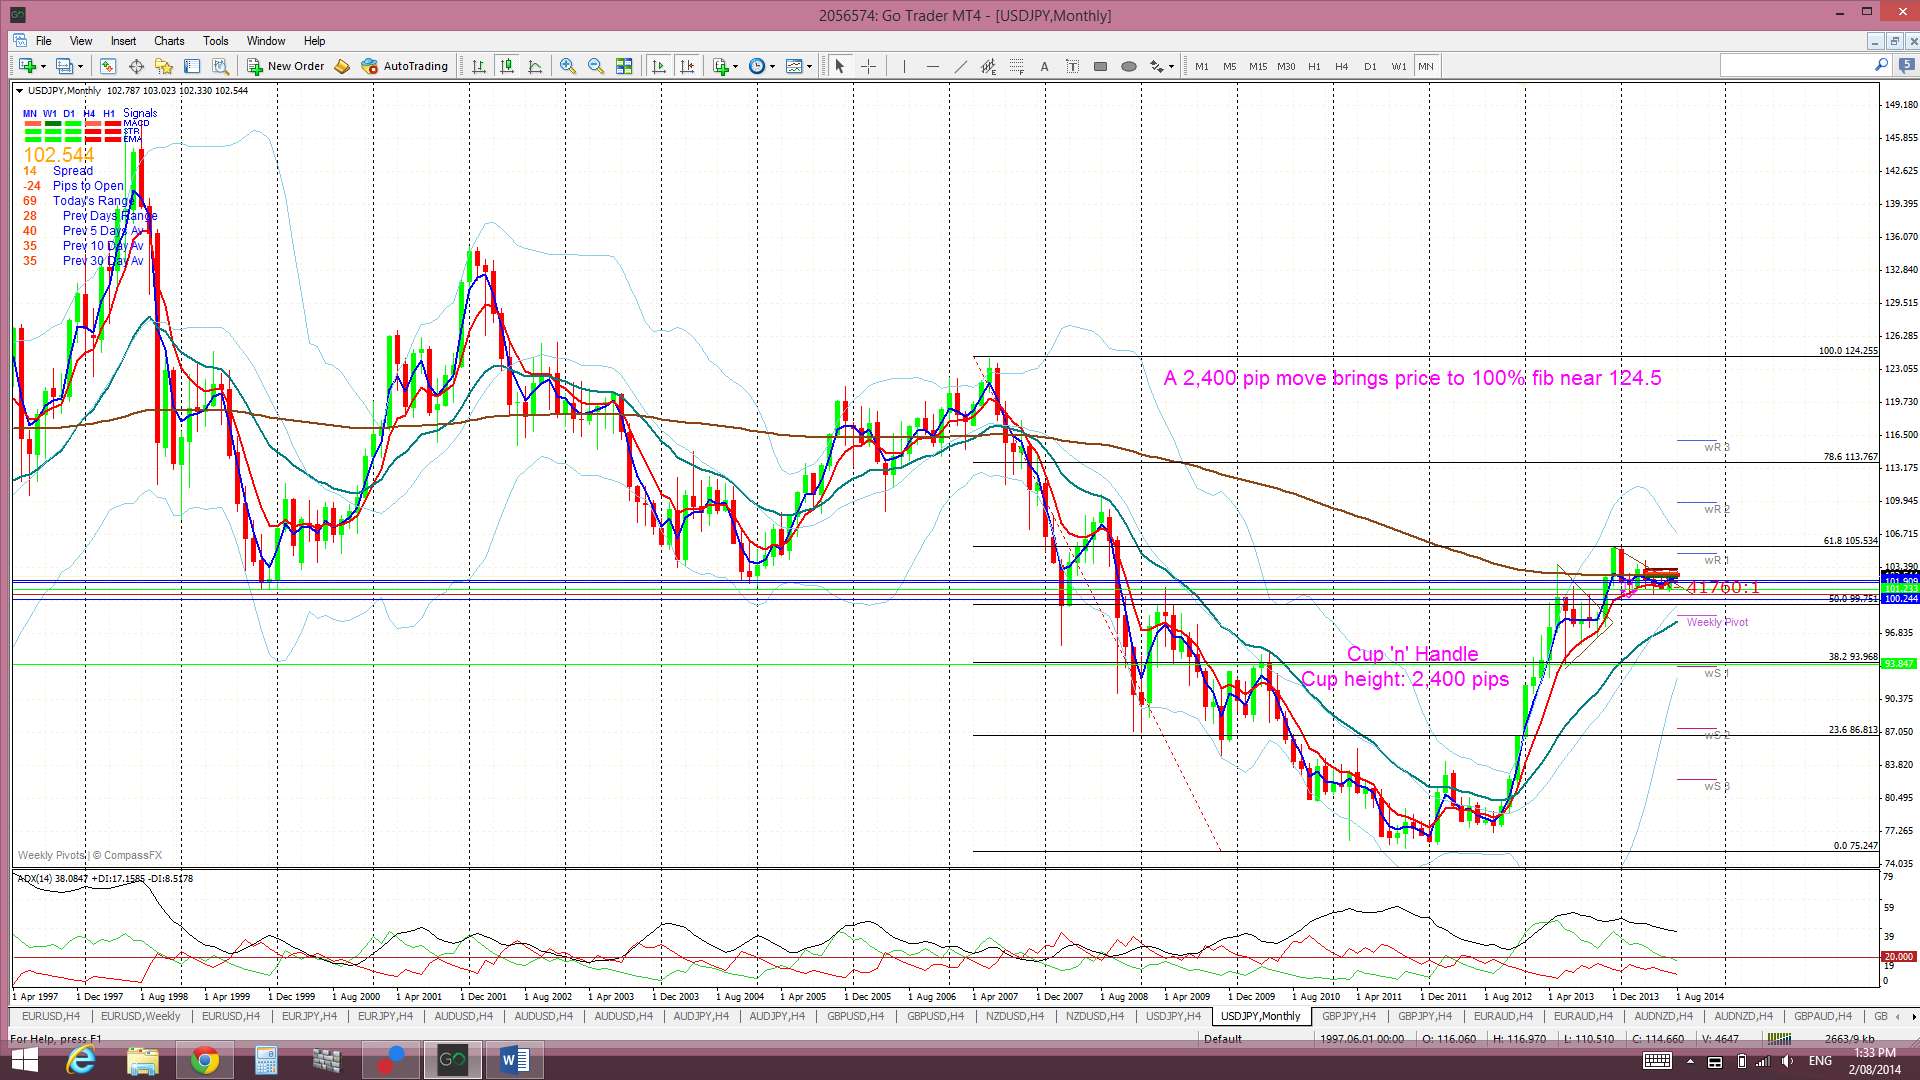
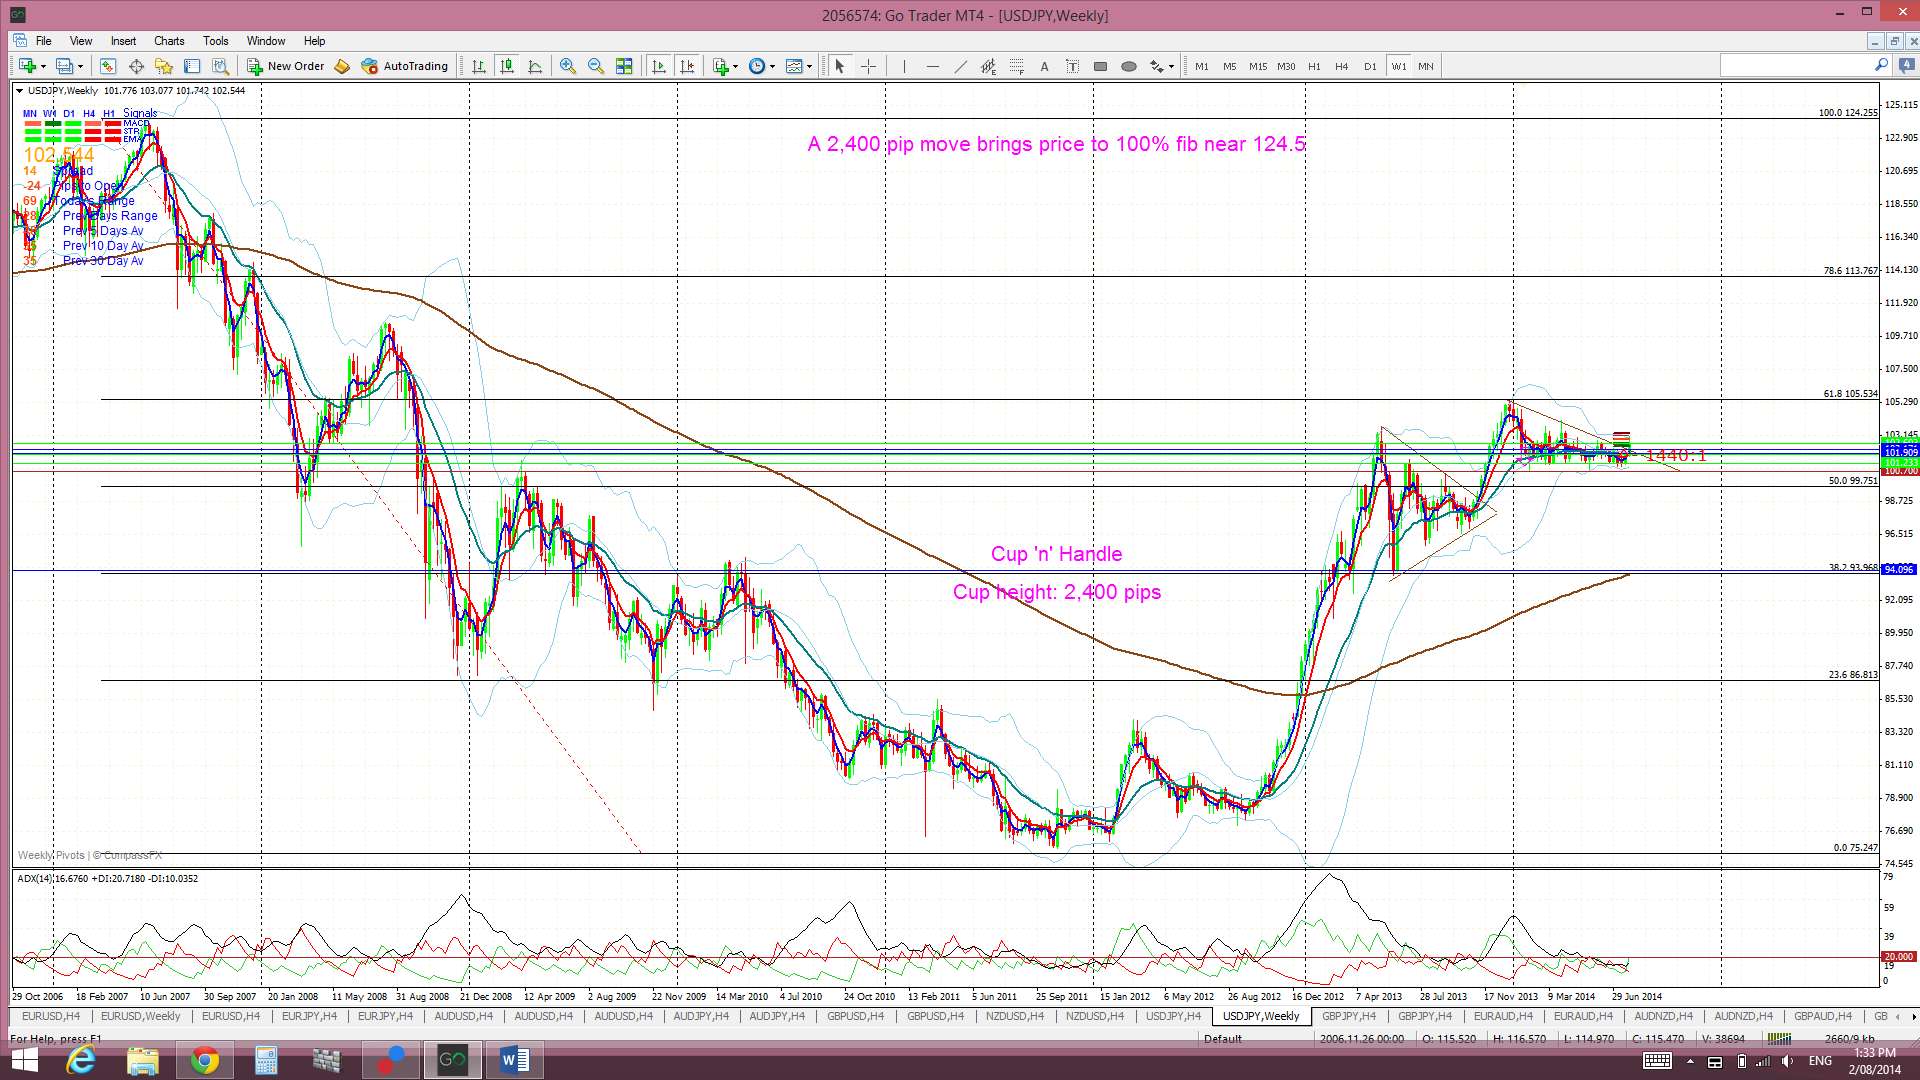
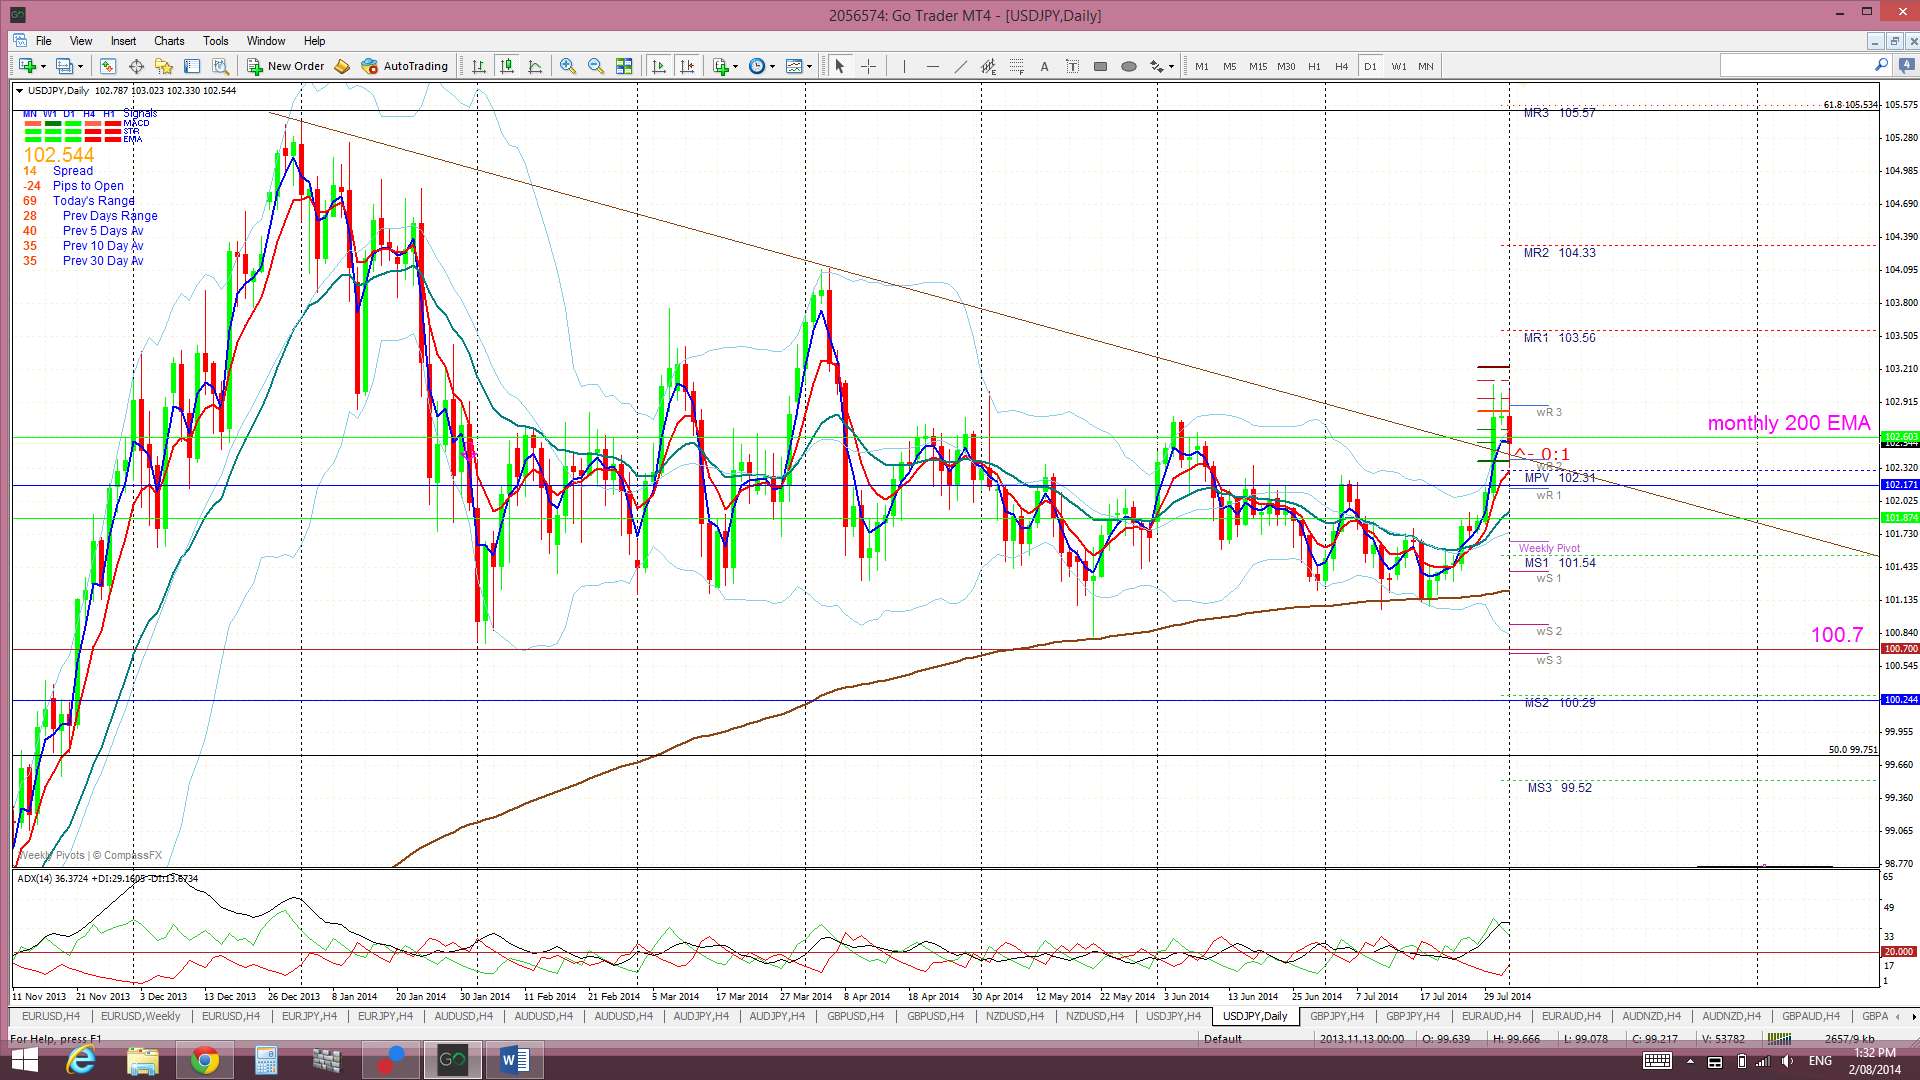
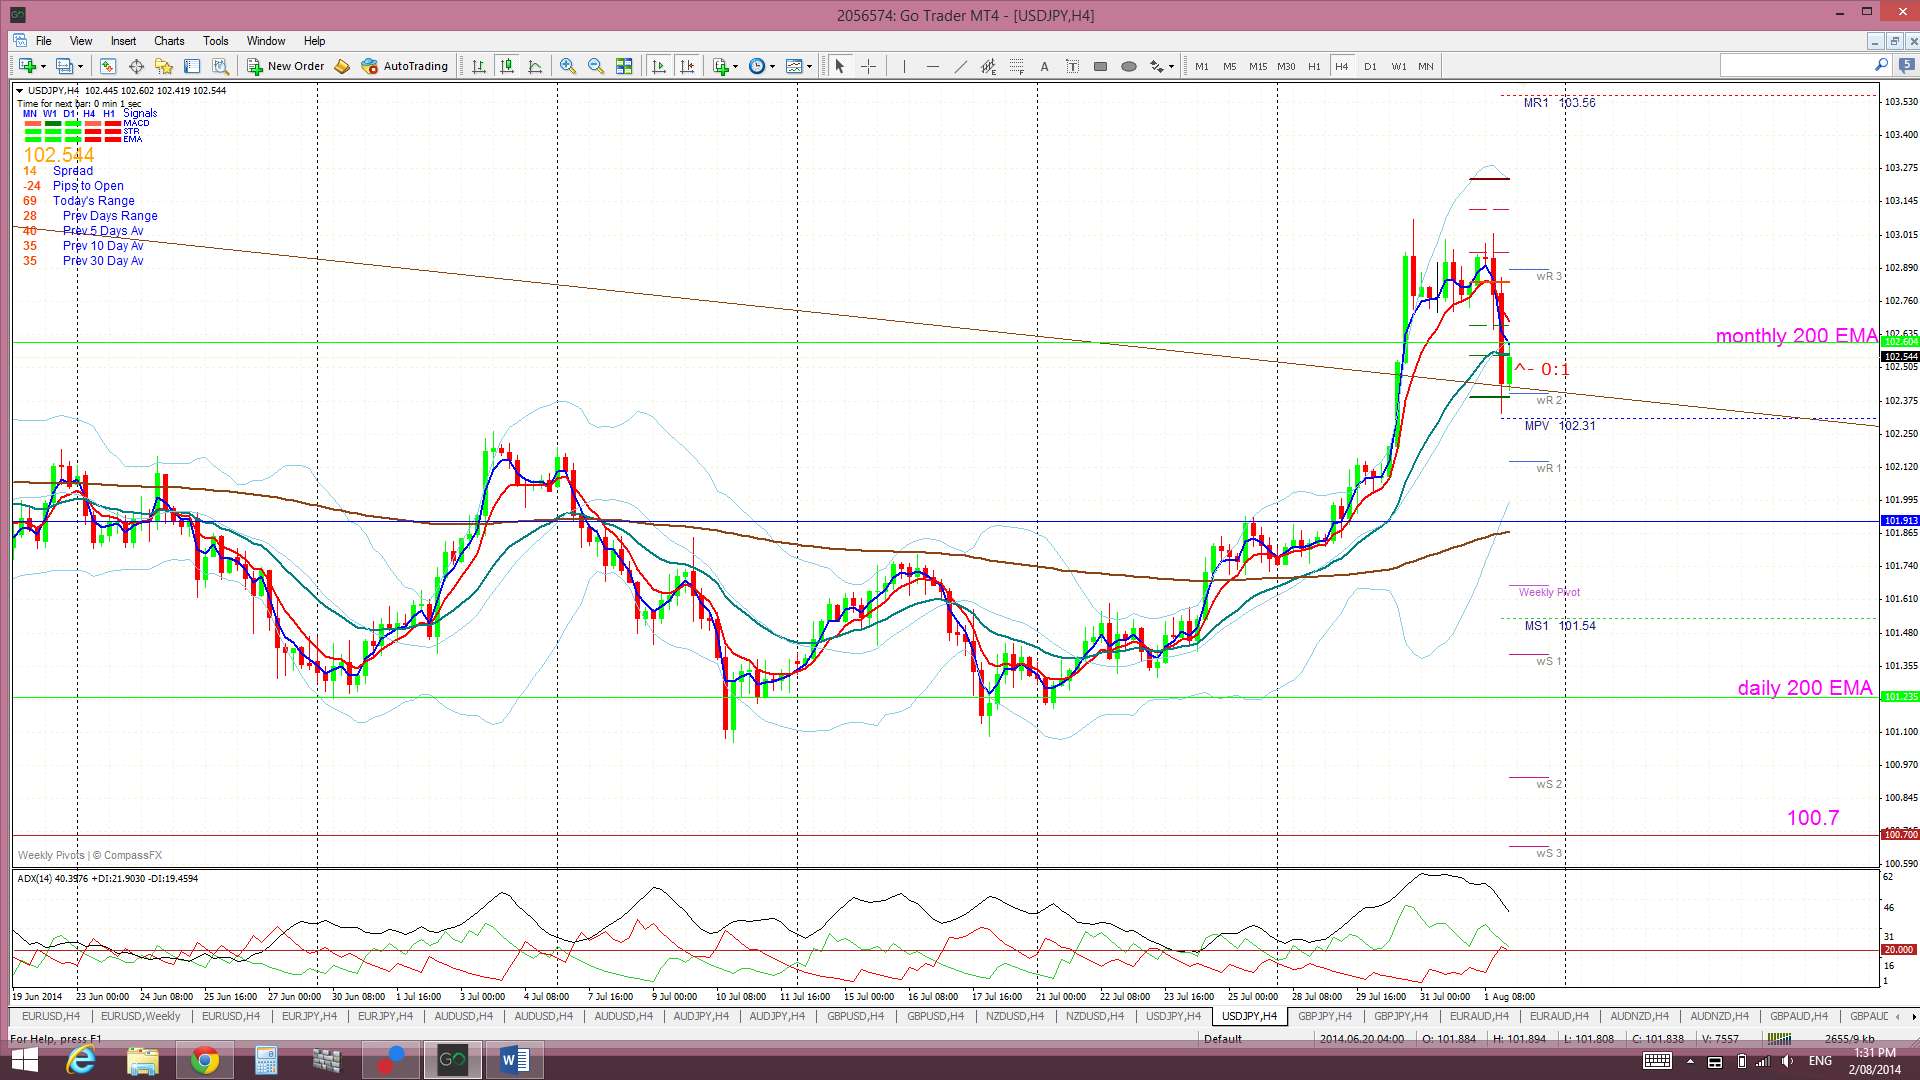
The Yen: U/J:The U/J traded higher last week due to increased USD strength. Price rallied particularly strongly after FOMC and this bullish move resulted in the U/J breaking up and out from the triangle pattern that it had been consolidating within for the last 7 months. Friday’s NFP result saw the USD weaken a bit and the U/J pulled back to test this broken trend line. It is worth noting that the U/J bounced up off this level late on Friday and closed above this ‘resistance’ now turned ‘support’.
Price is now trading above the Cloud on the 4hr, daily, weekly chart and monthly charts which is bullish. November was the first monthly candle close above the Ichimoku Cloud since mid-2007 and the bullish hold above the monthly Cloud continues to be noteworthy.
The weekly candle closed as a bullish candle. The July candle closed as a large bullish, almost ‘engulfing’ candle.
Weekly Chart Bullish Cup’ n’ Handle pattern: I am still seeing this pattern building on the weekly chart and the recent triangle break suggests that this pattern MIGHT be set for some continuation now. The theory behind these patterns is that the height of the ‘Cup’ pattern is equivalent to the expected bullish move from the ‘handle’ breakout. The height of the Cup for the U/J weekly chart is around 2,400 pips. The interesting point here is that a 2,400 pip bullish move up from the ‘Handle’ would put price up near the 124 level. This level is the last major swing high for the U/J from back in 2007 and represents the 100% fib pullback for the move down in 2007 to the lows of 2012. Possible targets along the way include the 61.8% fib retrace level at the 105.5 region and the 78.6% fib up near the 112 region.
The weekly chart still has a ‘Bull Flag’ look to it but a sustained breach of the 100.7 level would void this pattern.
There are two main risk events for the U/J this week: any renewed USD weakness following on from NFP and Friday’s BoJ monetary policy statement and Conference.
- I’m watching for any new TC signal and the upper triangle trend line.
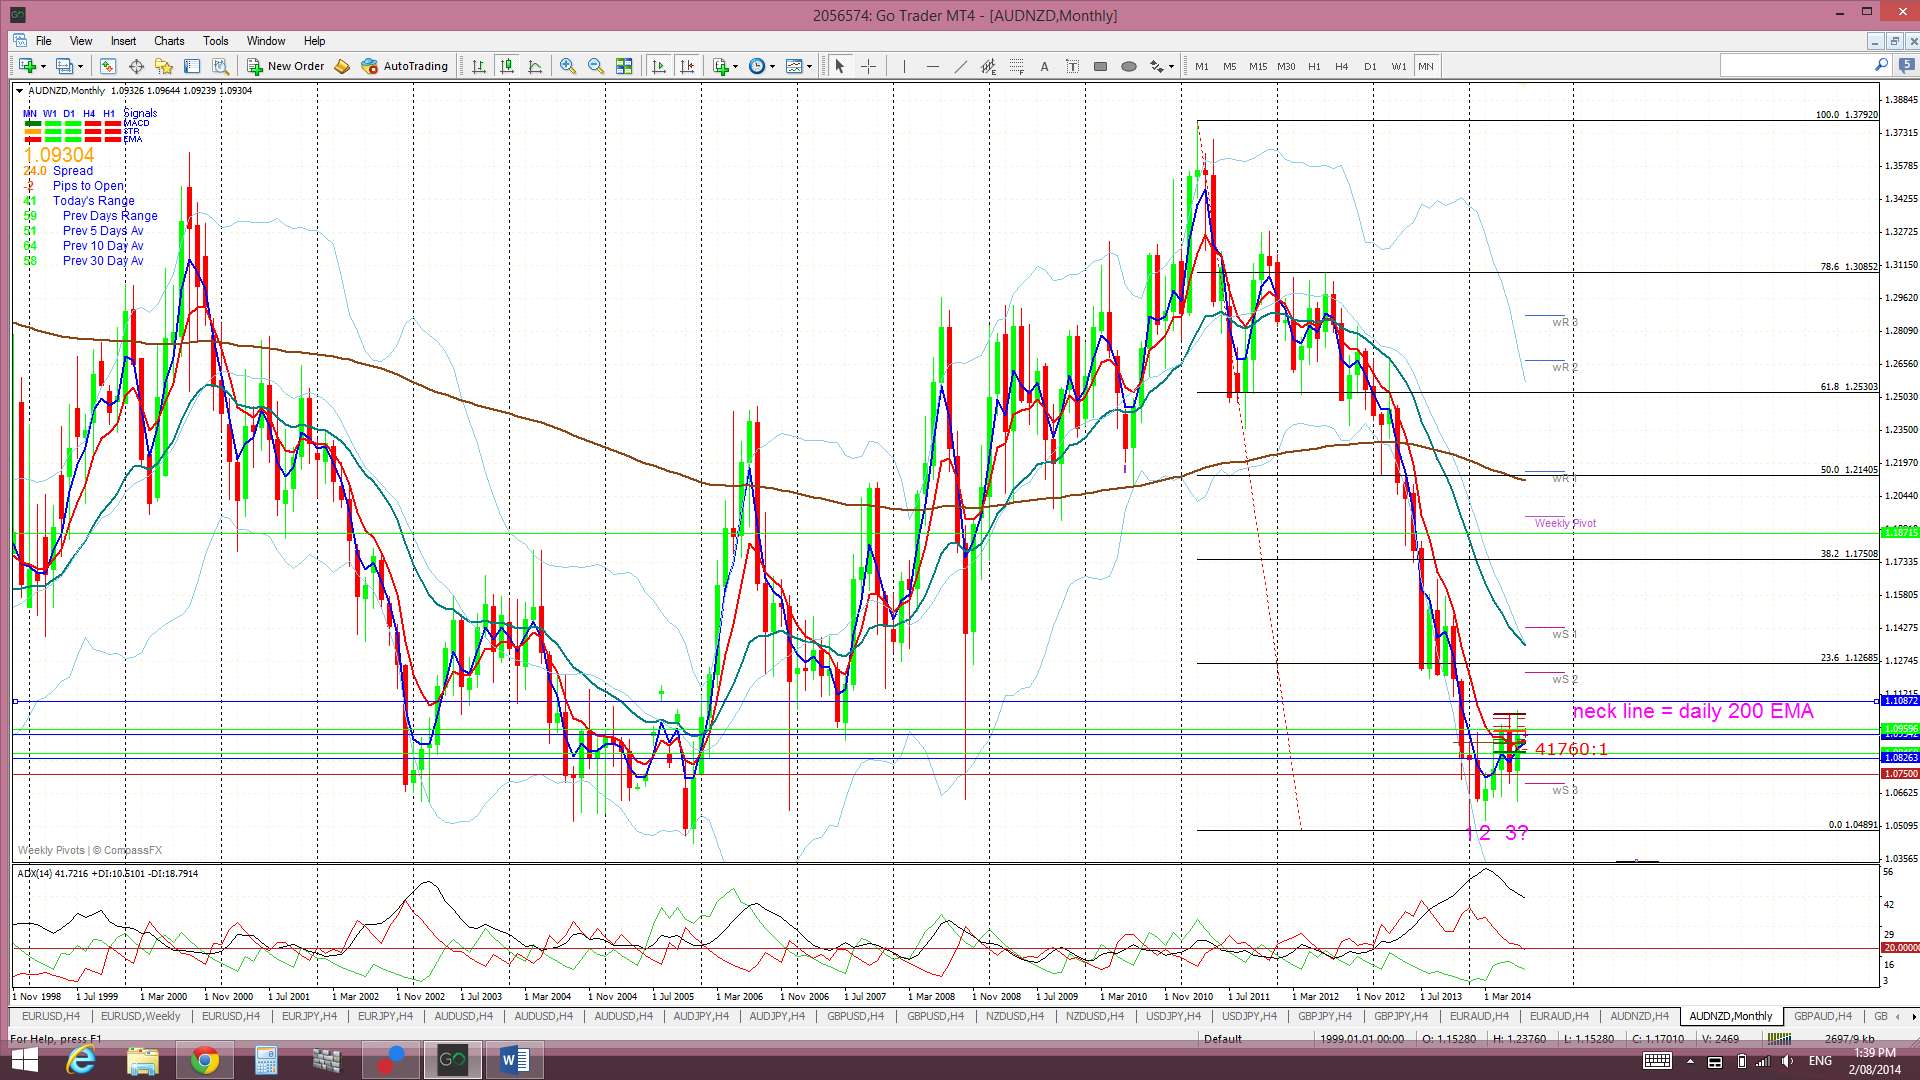
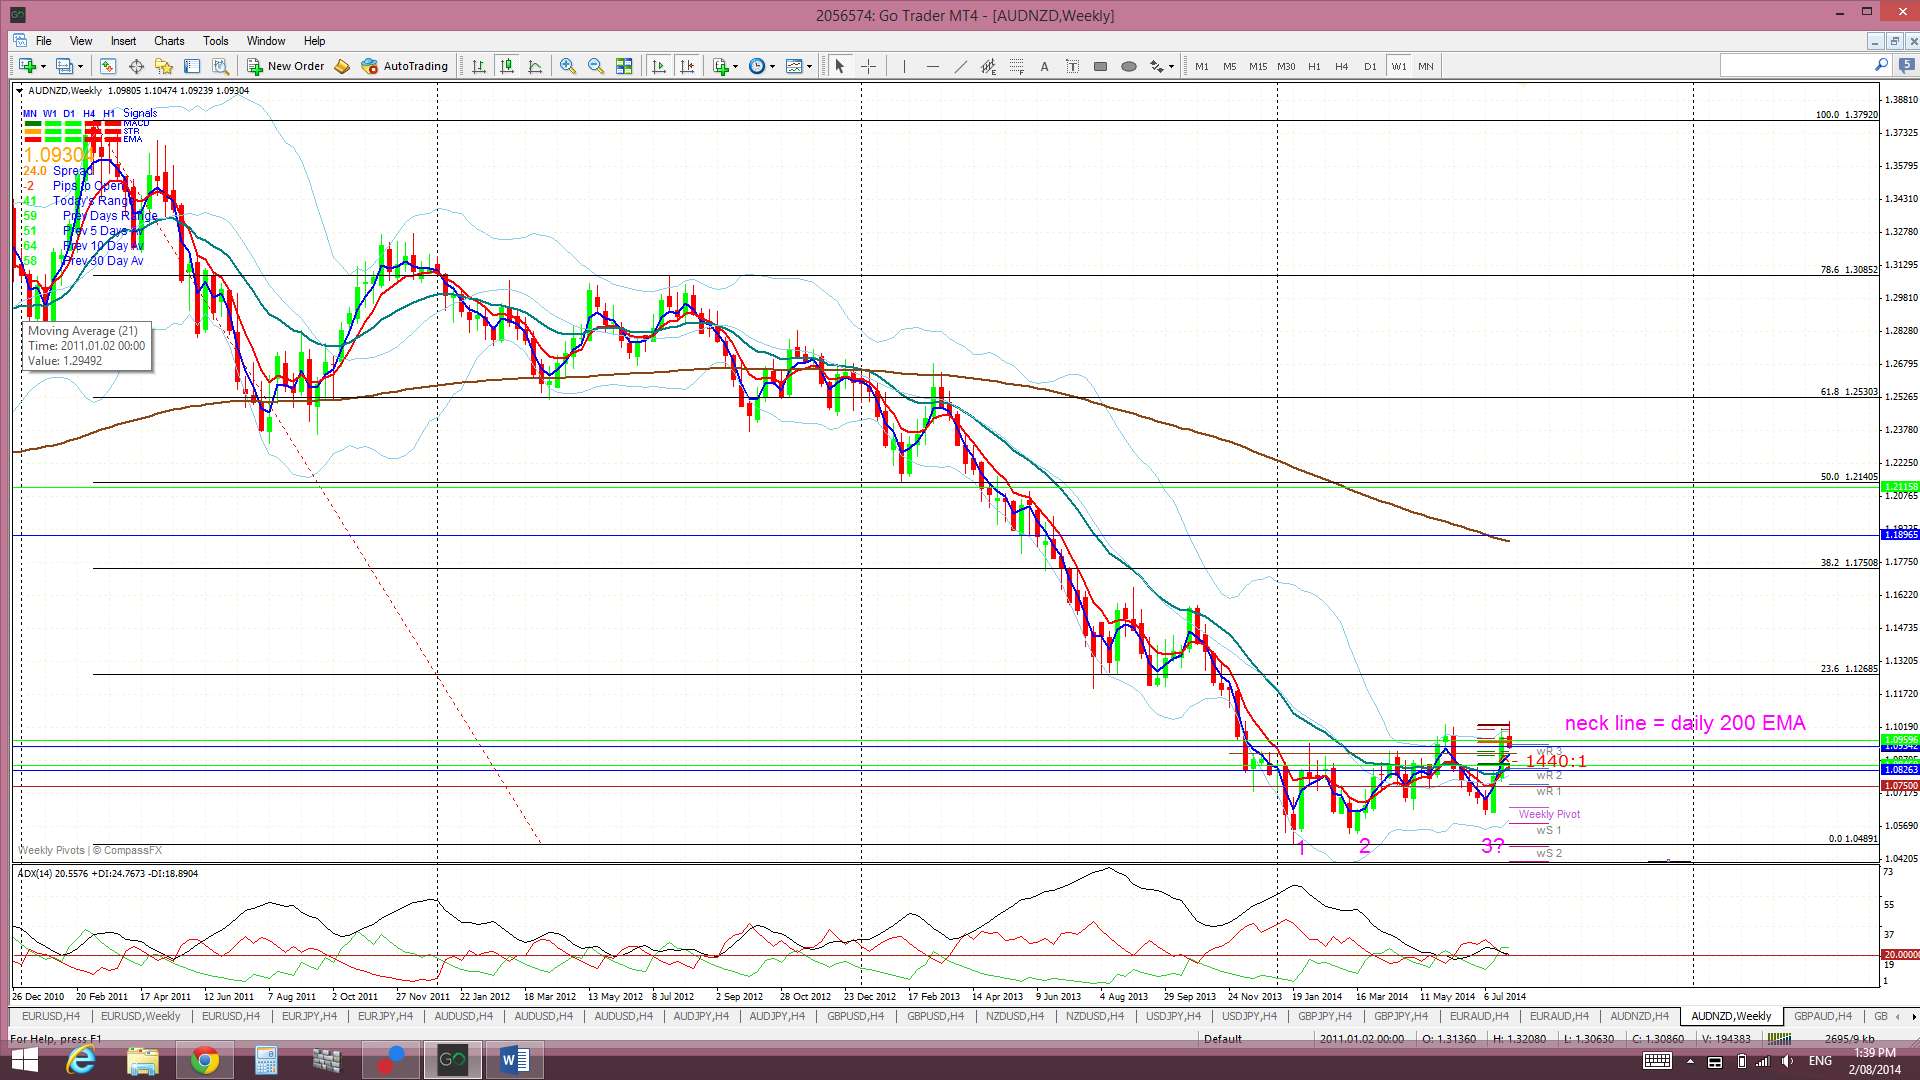
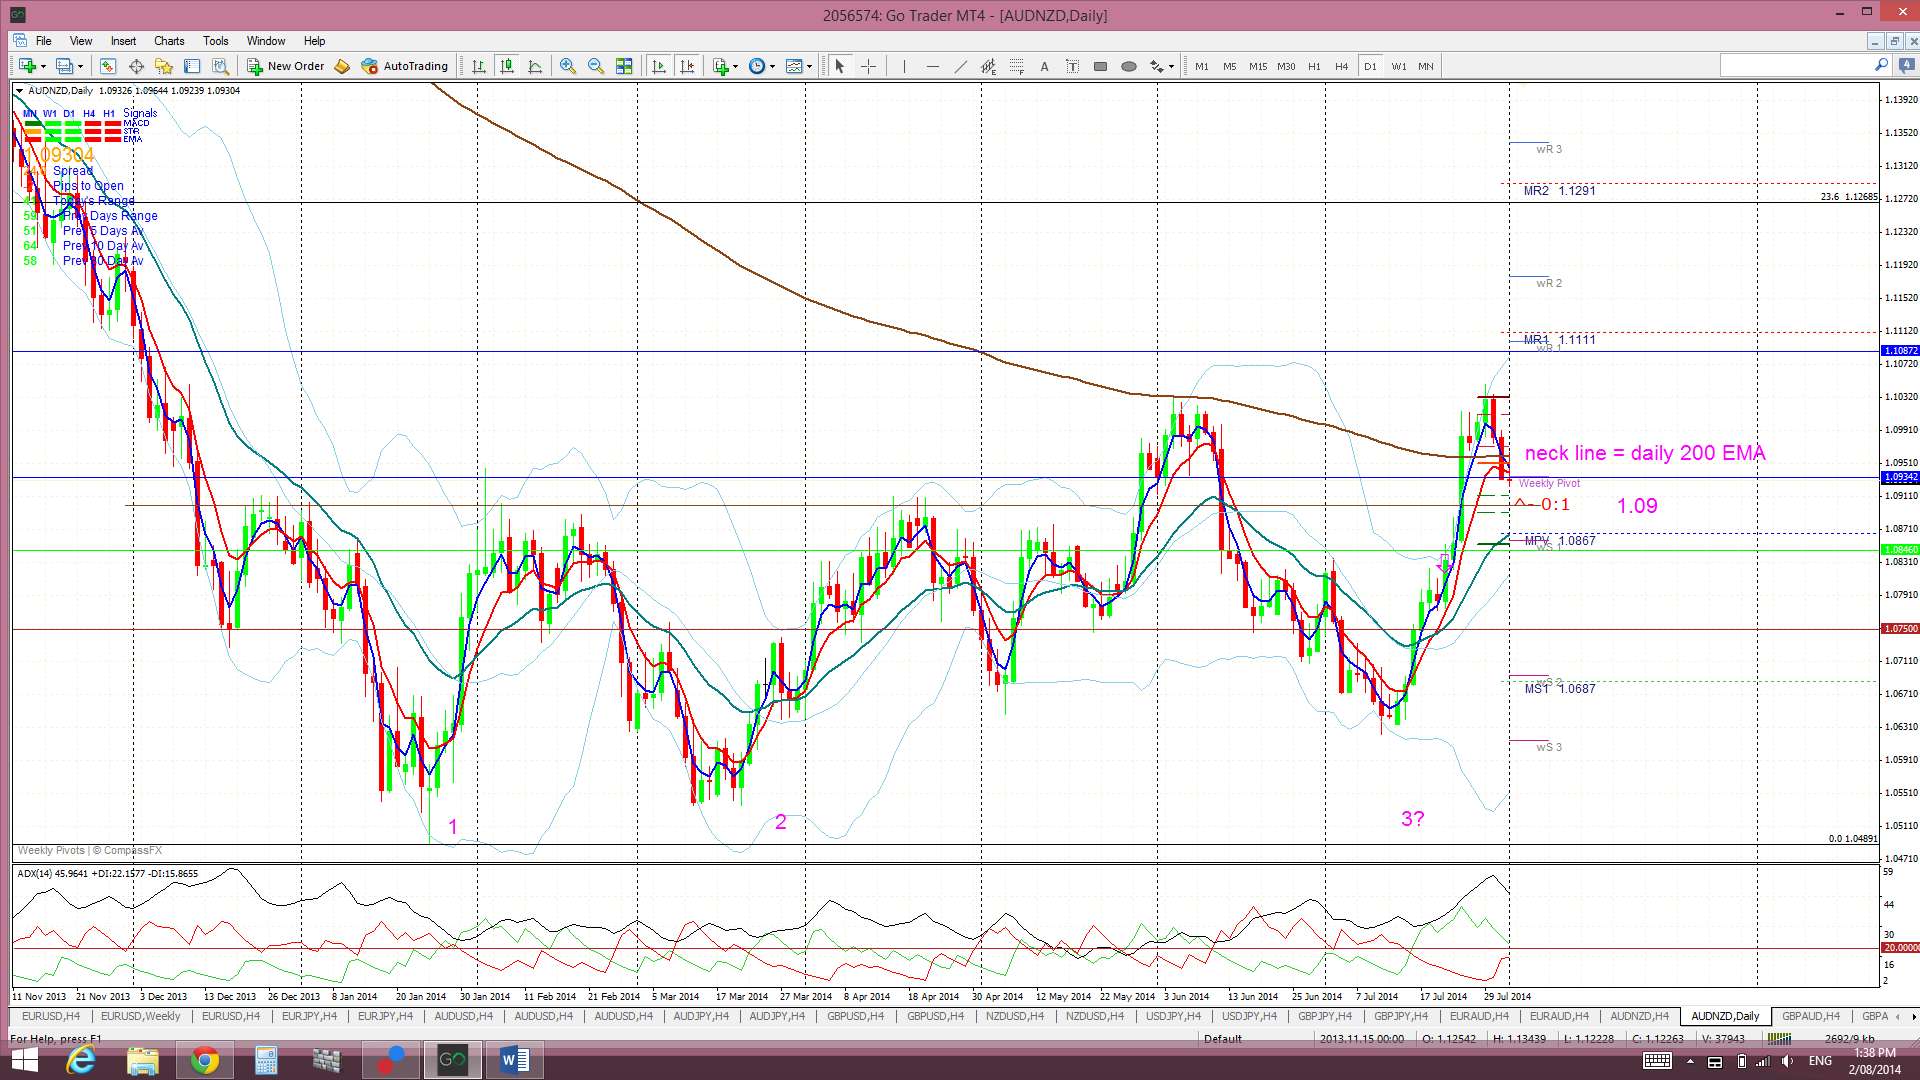
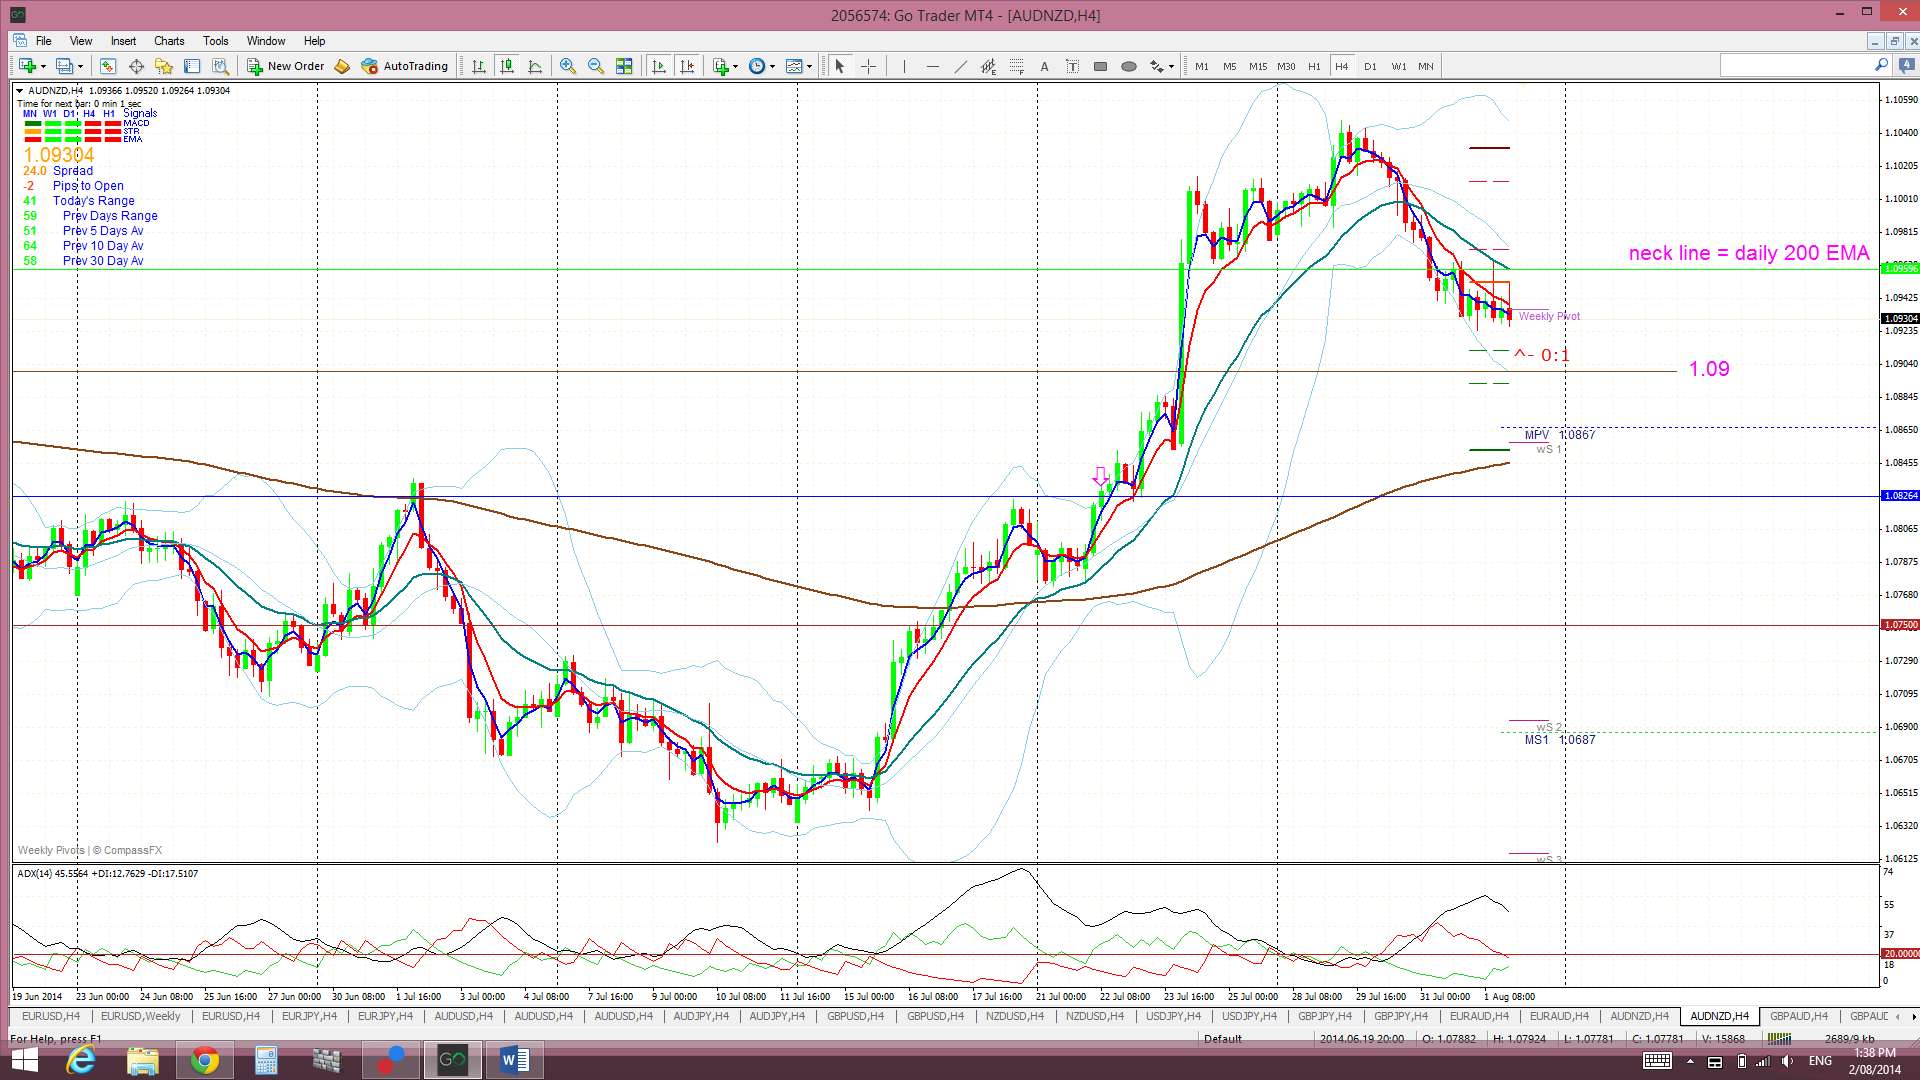
AUD/NZD: The A/N drifted a bit higher last week before succumbing to renewed weakness.
Price has closed back below the revised ‘neck line of the messy ‘Triple Bottom’ but is still above the previous ‘neck line of the 1.09 level.
The AUD/NZD is now trading in the top of the Cloud on the 4hr and above the Cloud on the daily. I had mentioned last week that the AUDD/NZD is attempting to move up through broad weekly Cloud and so any bullish continuation move could still be a bit choppy and, that is what we’ve seen.
The weekly candle closed as a bearish coloured candle with a bit of a bearish-reversal ‘Shooting Star’ look to it. The July candle closed as a bullish candle with a bit of bullish-reversal Railway Track’ look to it though! Clearly, some indecision here.
Traders need to be mindful of the high impact AUD and NZD scheduled for the coming week.
- I’m watching for any new TC signal and the Triple Bottom ‘neck line’.
GBP/AUD: This pair chopped sideways to start the week but then rallied a bit by mid-week. Friday’s weak GBP data contributed to this pair giving back all of its gains though.
Price is now trading below the Ichimoku Cloud on the 4hr and daily charts which is bearish. There is still rather broad bullish cloud below the weekly candle, although, the weekly candle is still sitting in the top edge of this weekly Cloud.
The weekly candle closed as a small bearish candle with a long upper shadow. The July candle closed as a bullish coloured Doji reflecting the recent indecision with this pair.
There is a lot of high impact data this week for both the GBP AND the AUD next week. Traders need to be mindful of these items as they monitor this pair throughout the week.
- I’m watching for any new TC signal on this pair.


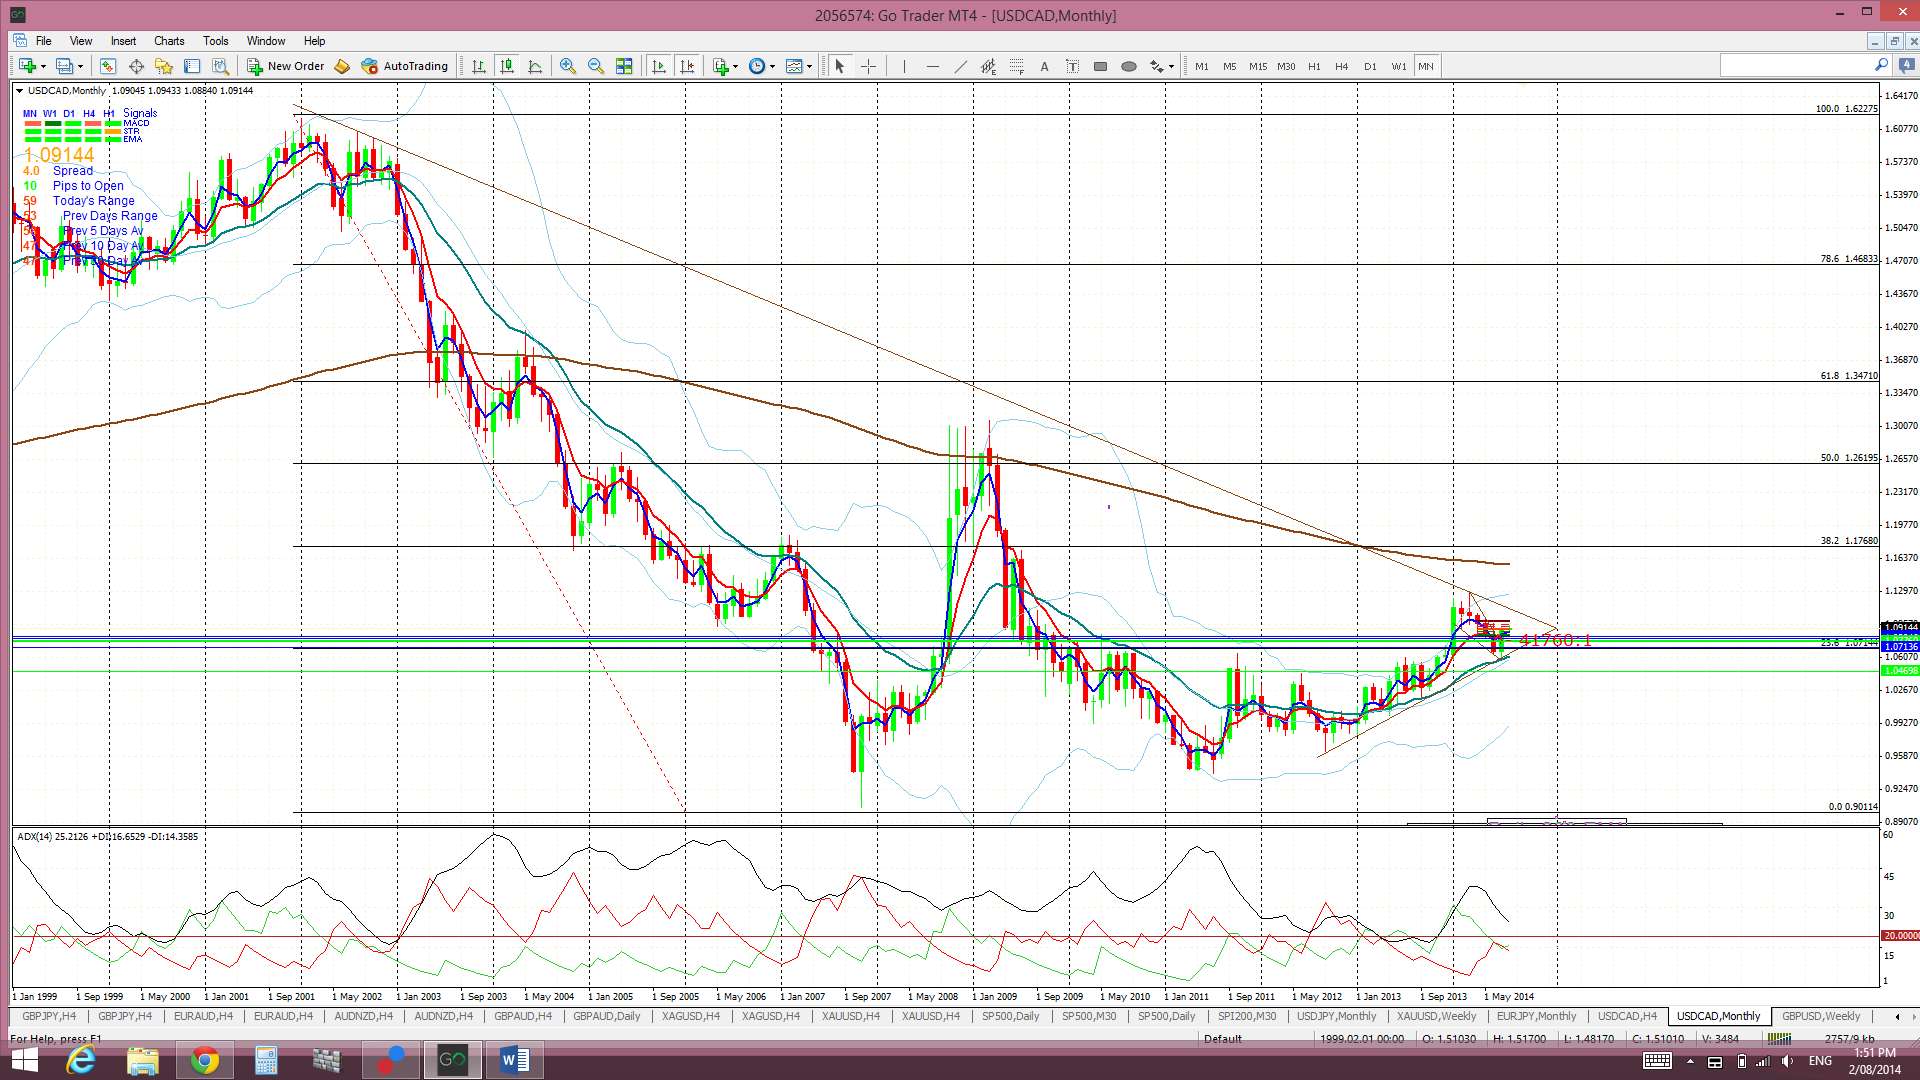
Loonie USD/CAD: The bullish descending wedge pattern breakout continued on the Loonie last week and has delivered up to 180 pips. This trade was helped by increased USD strength throughout the week. The USD weakened a bit on Friday but the Loonie held up fairly well.
The Loonie is now less than 300 pips away from a major bear trend line from the monthly’s chart’s triangle pattern and any bullish continuation will see the Loonie heading to test this trend line.
Price is trading above the 4hr and daily Cloud which is bullish.
The weekly candle closed as a large bullish candle after last week’s bullish engulfing candle. The July candle closed as a bullish engulfing candle.
There is a bit of CAD high impact data next week that may impact here.
- I’m watching for any new TC signal and the monthly chart’s triangle pattern.


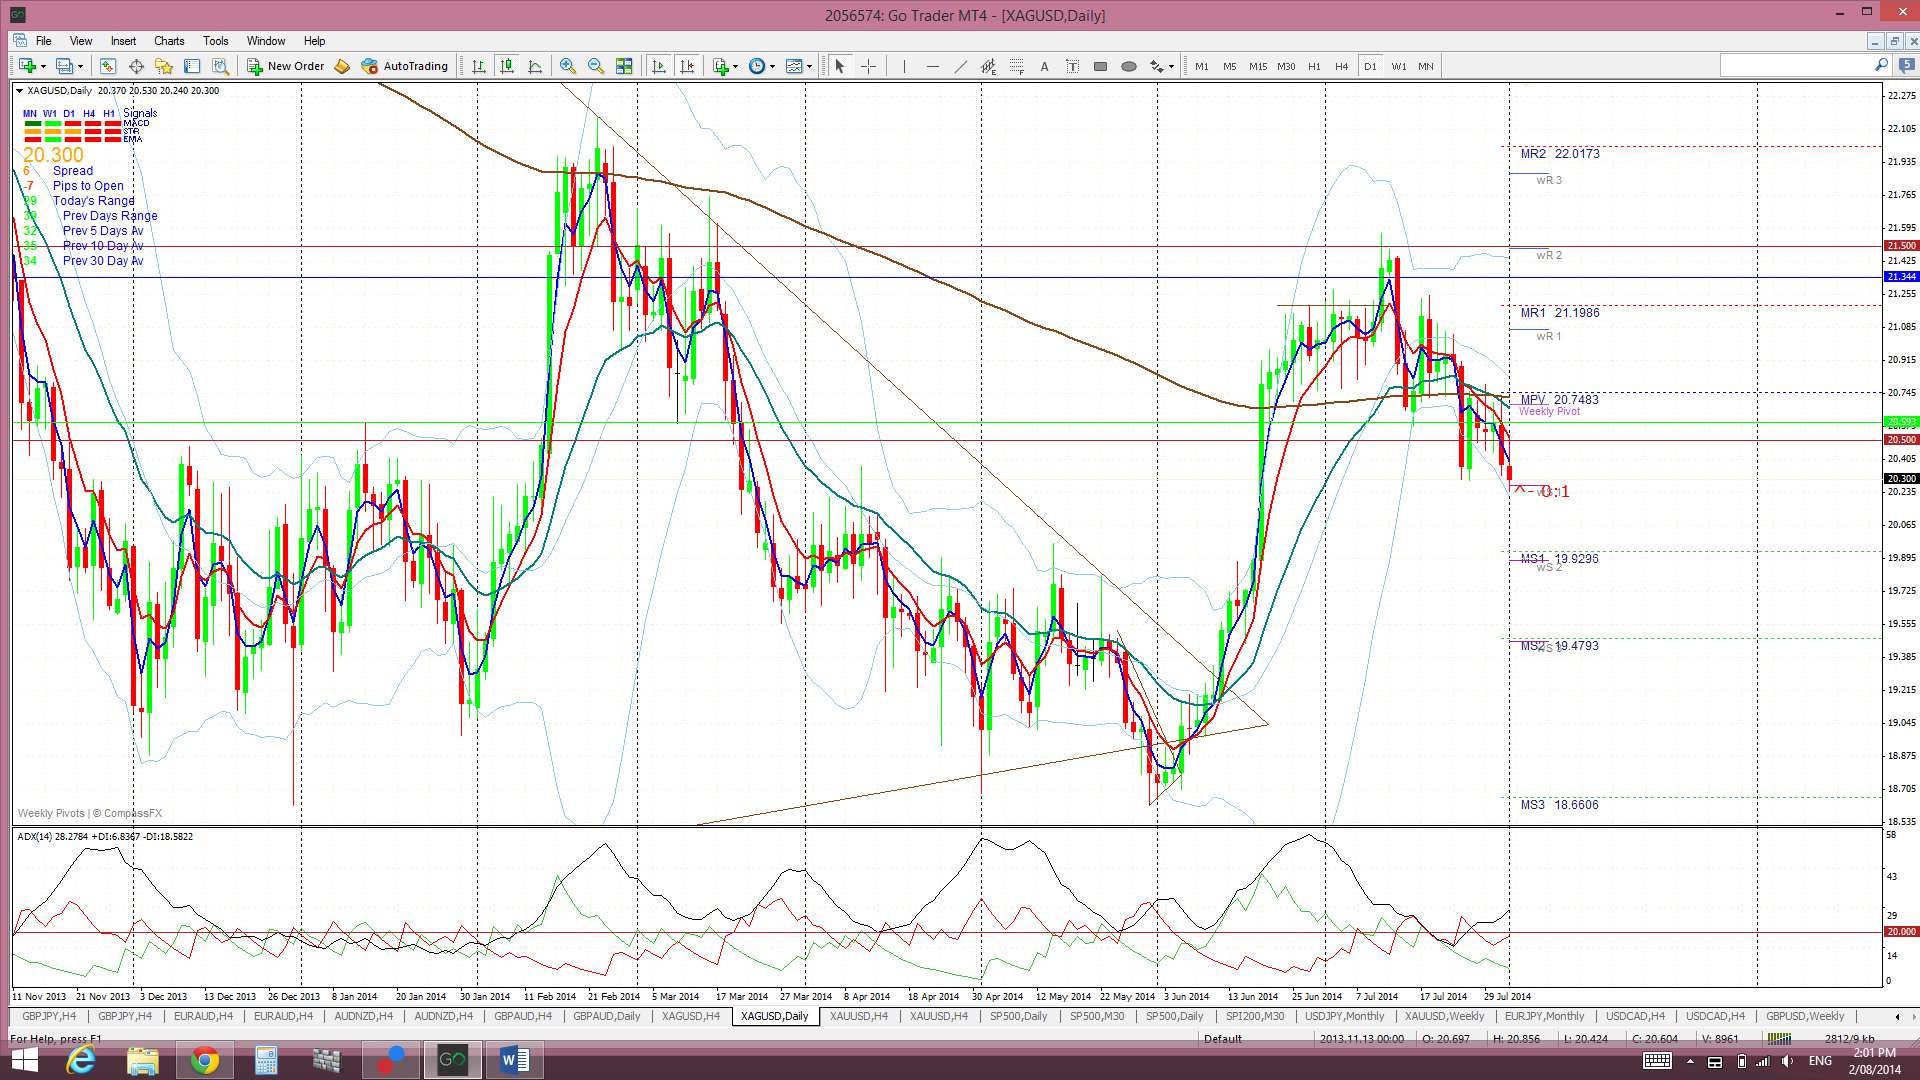
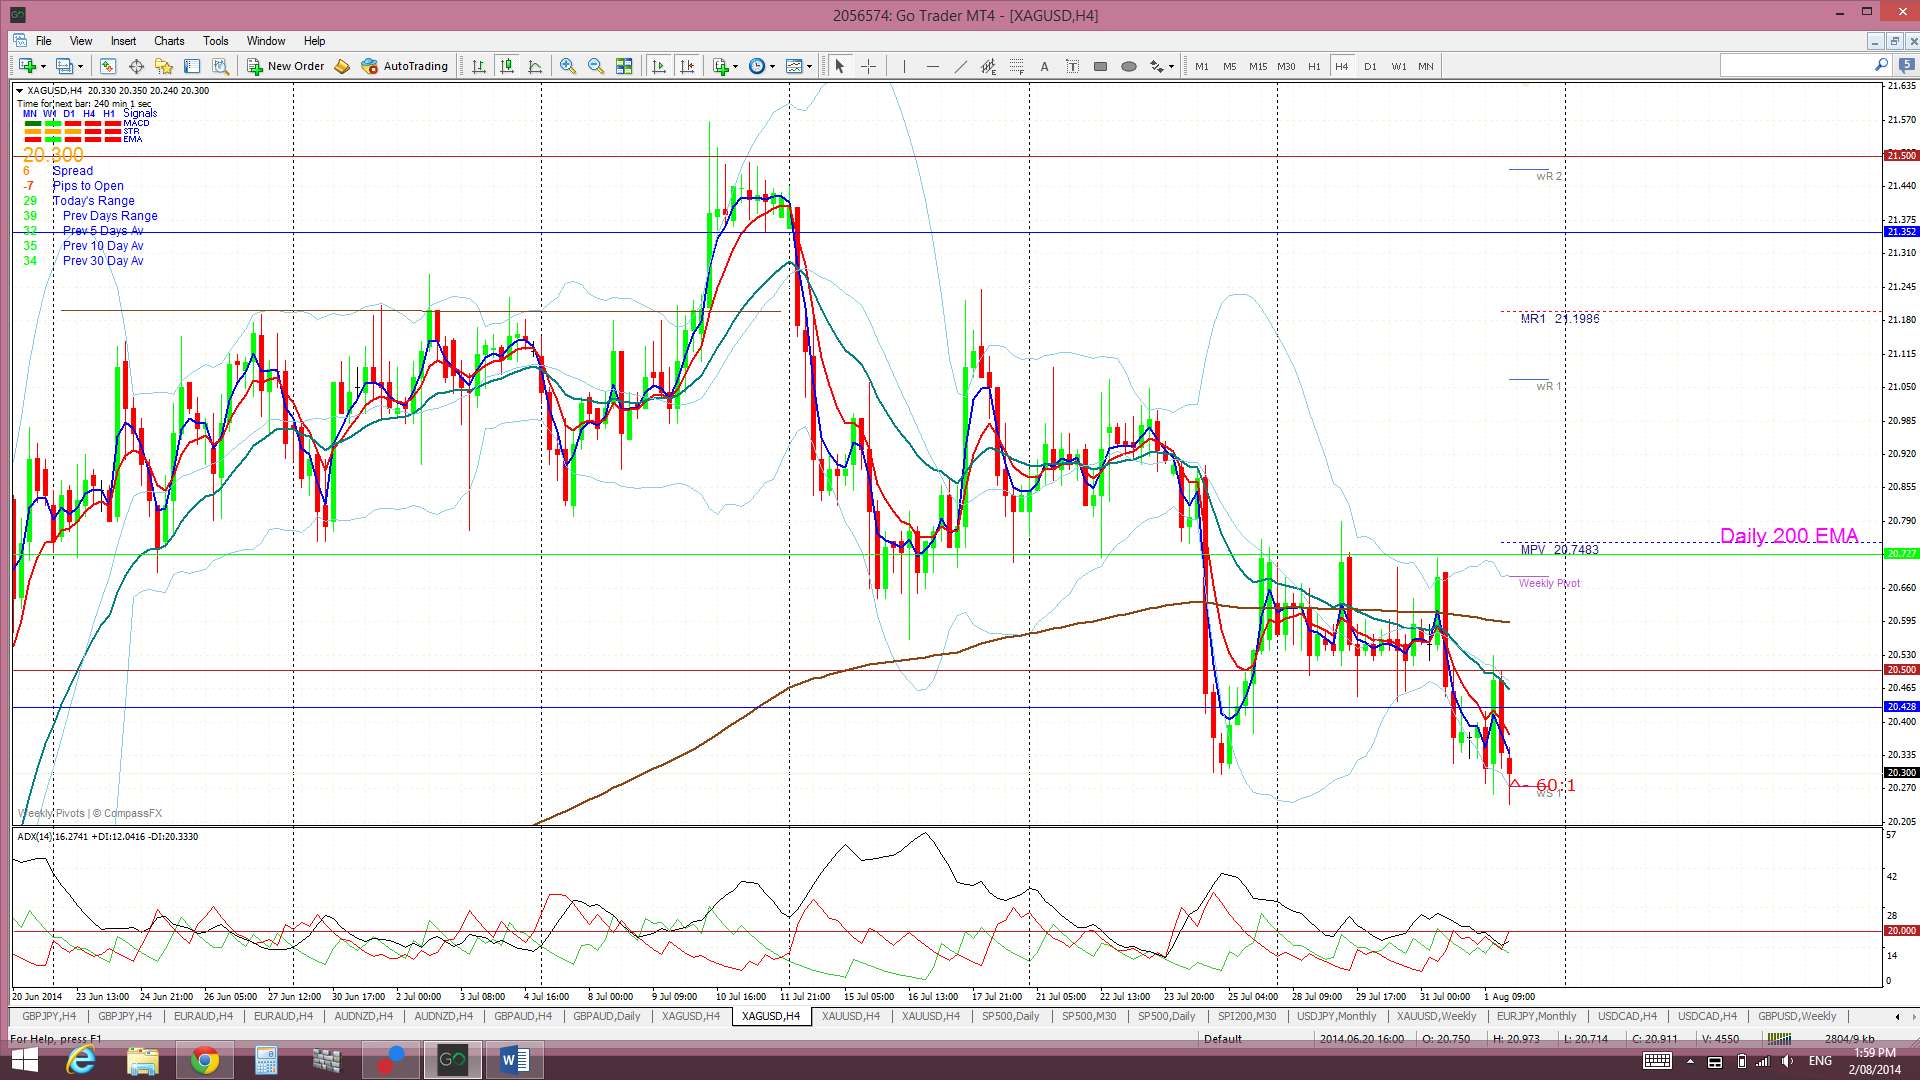
Silver & Gold: both of these struggled last week due to the continuing USD strength. Any renewed USD weakness, following on from NFP, could help to support these two though:
Silver: Silver chopped along above the support of the $20.50 level until Thursday. Continued USD strength finally saw this support fail. The bit of USD weakness that crept in on Friday did little to help this metal.
Silver is trading below the Ichimoku Cloud on the 4hr chart, above on the daily chart but below on the weekly and monthly charts.
The weekly candle closed as a bearish candle. The July candle closed as a bearish coloured ‘Inside’ candle.
- I’m watching for any new TC signal and the $20.50 level.


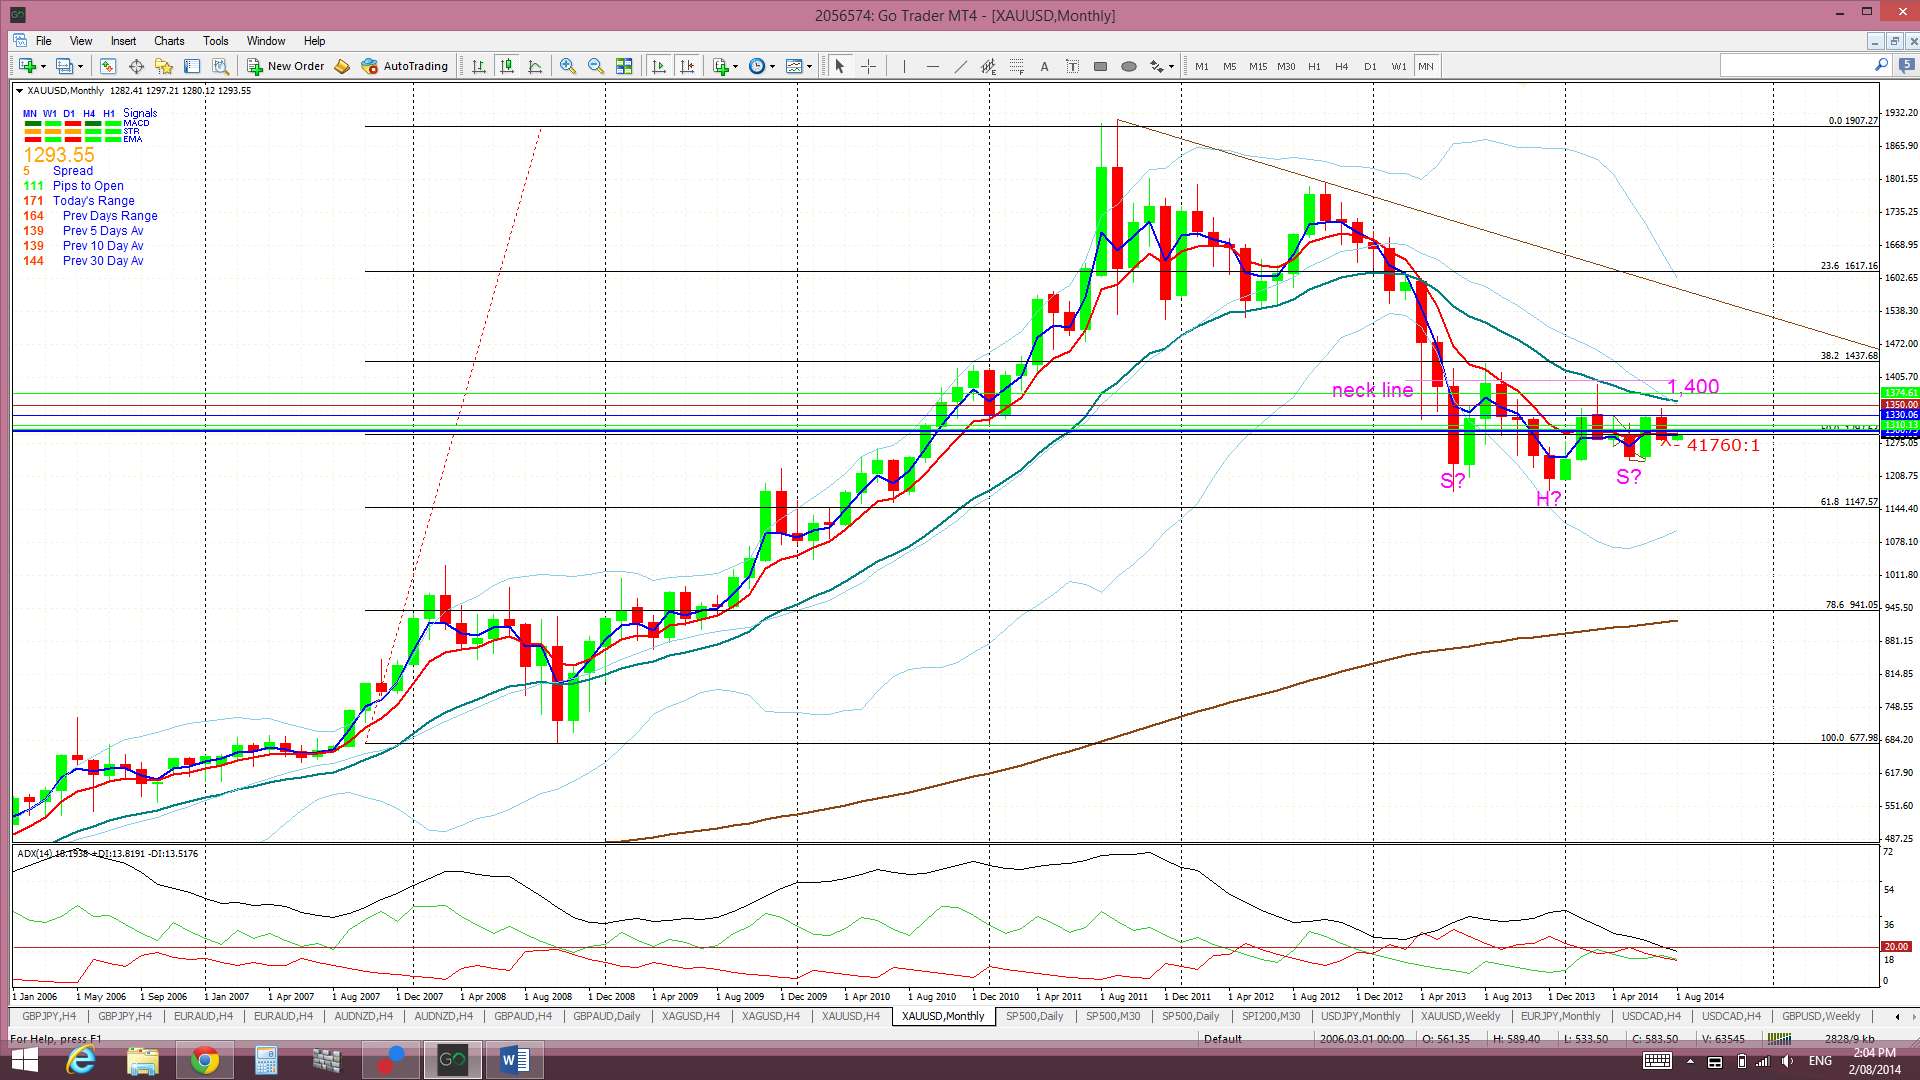
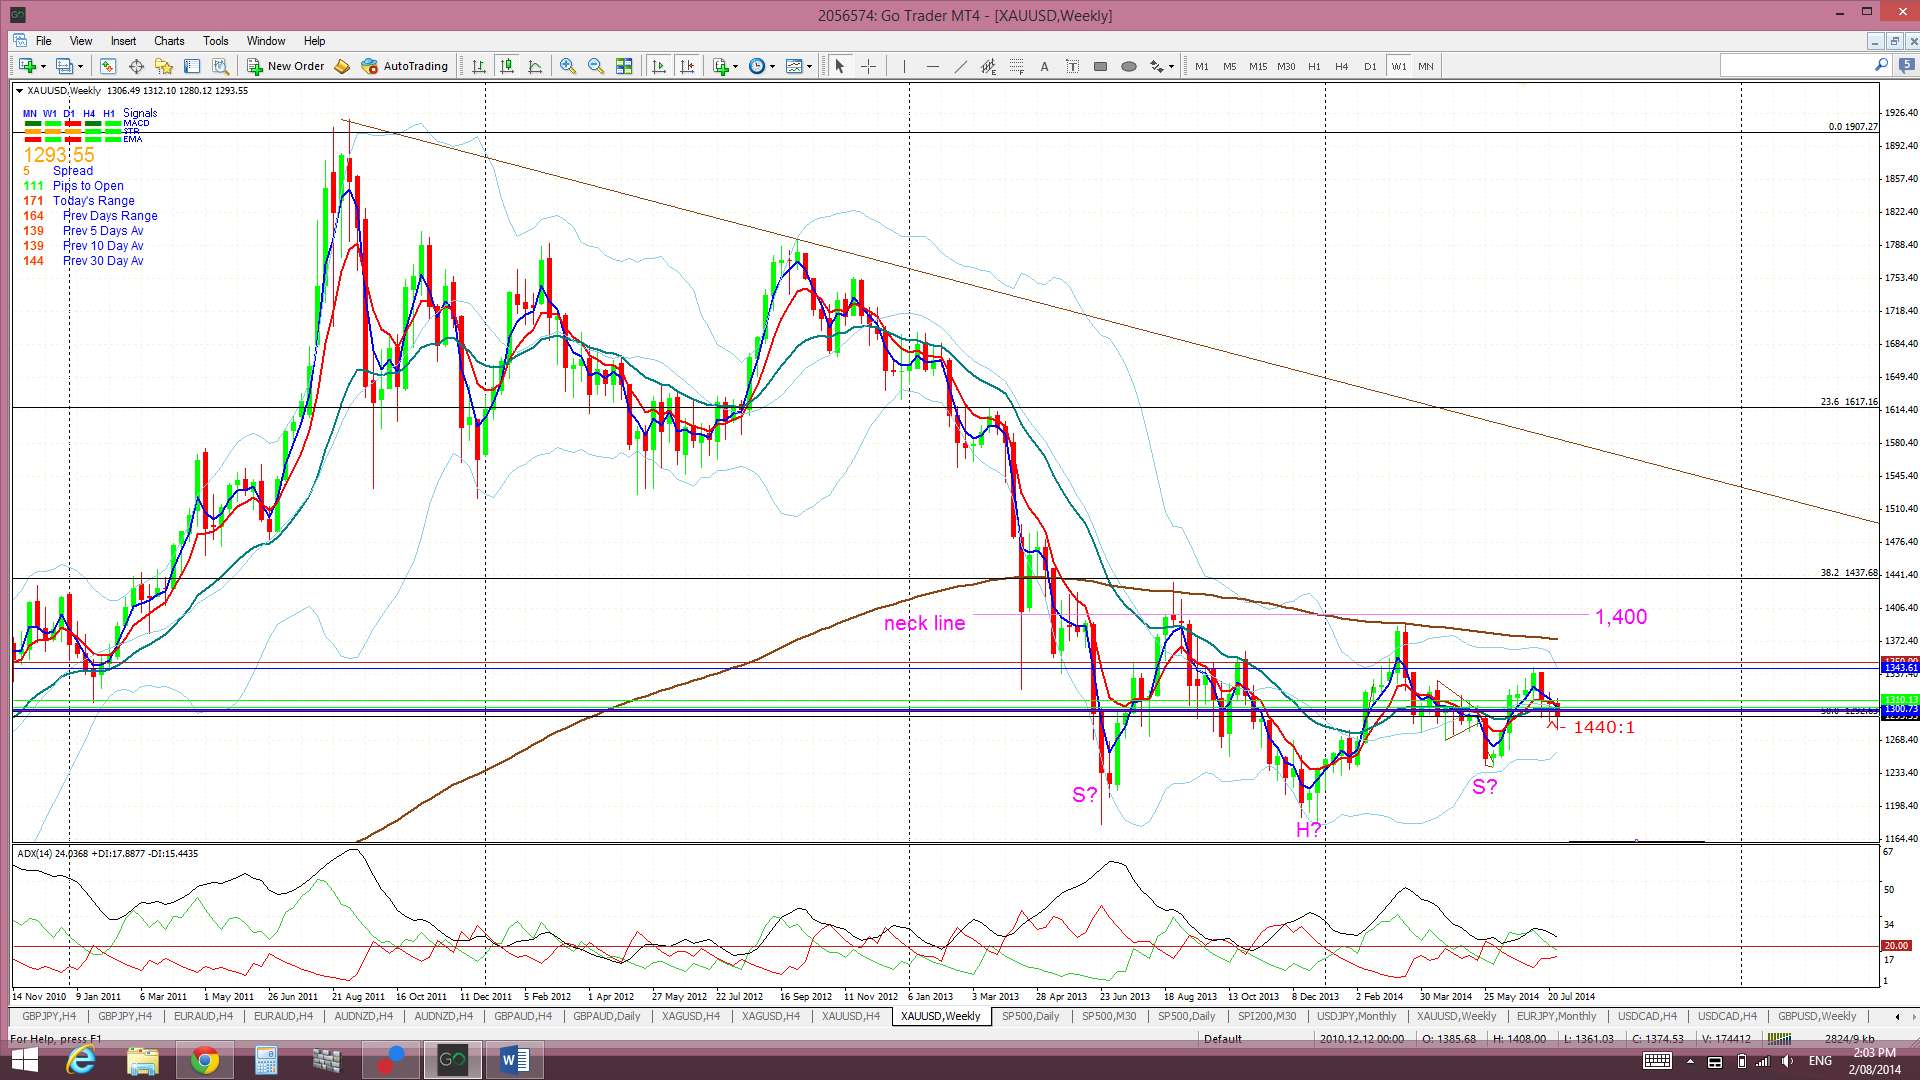
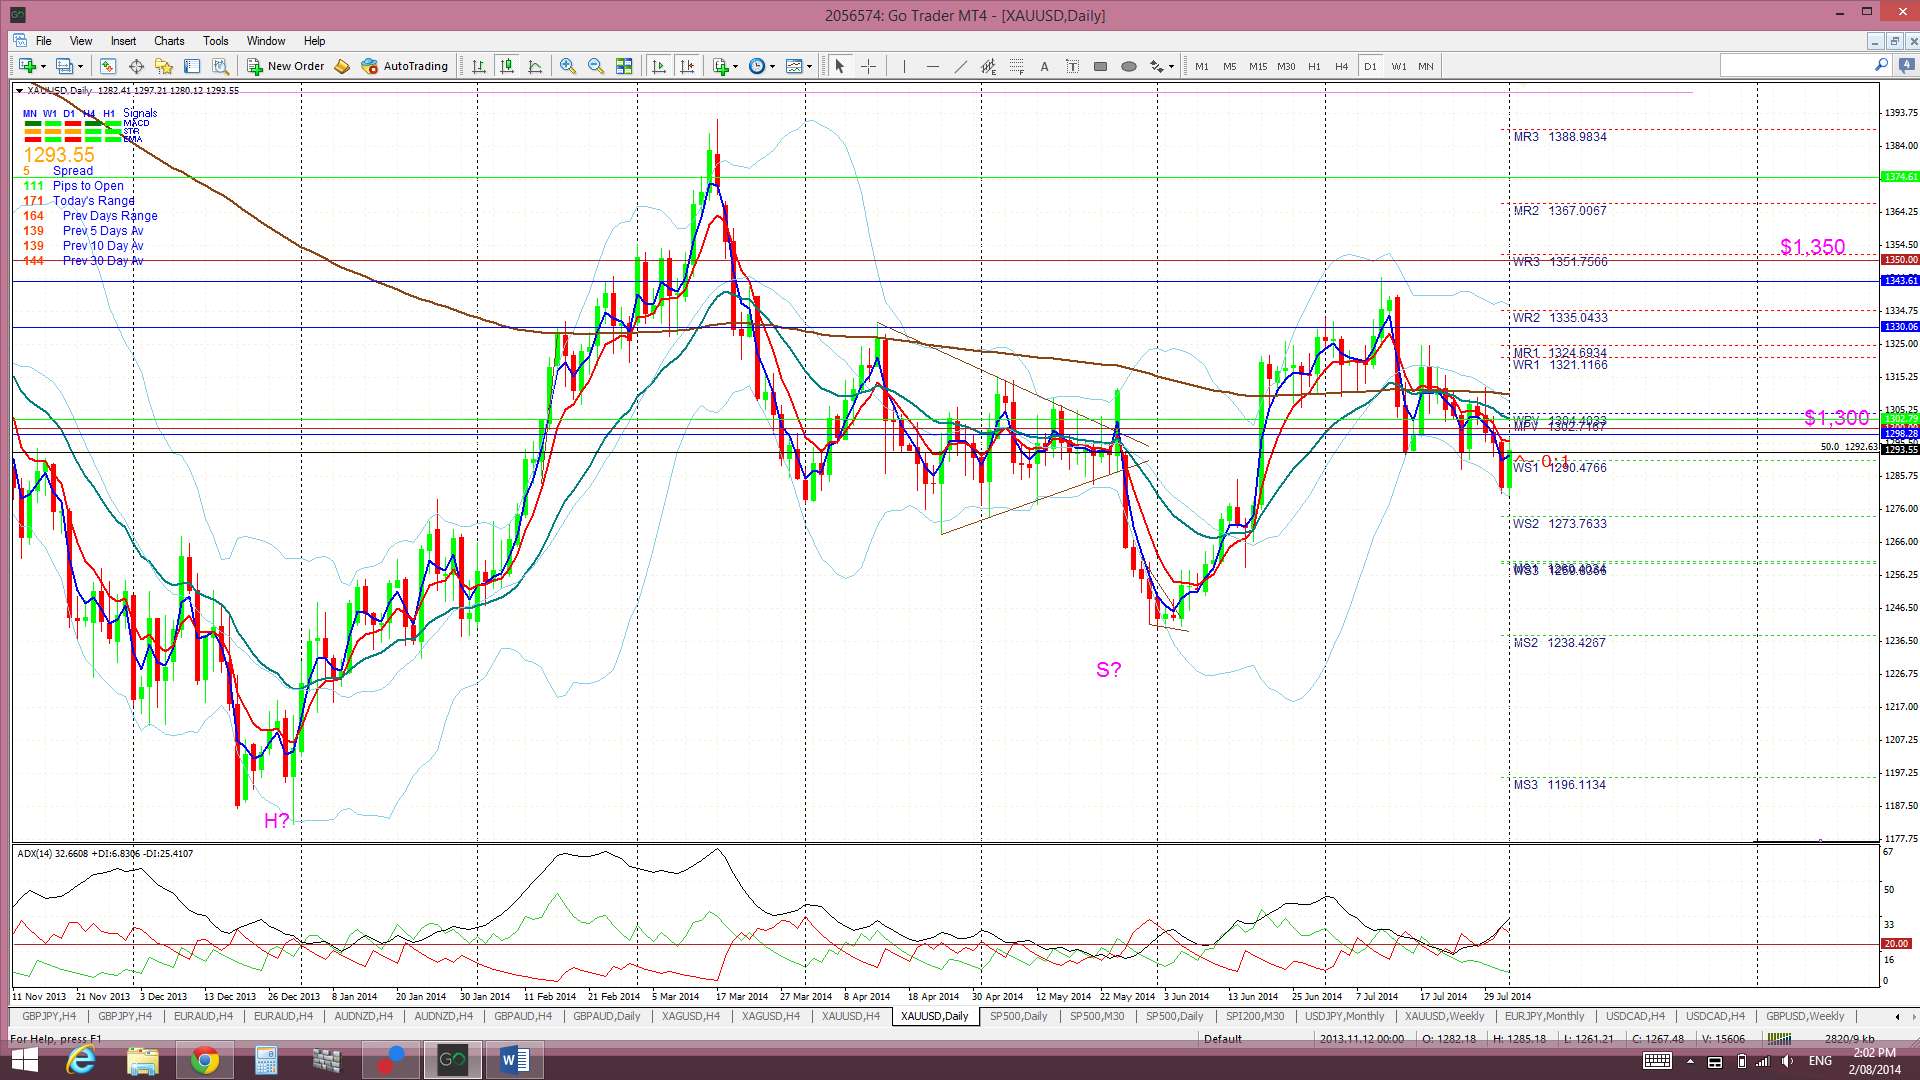
Gold: Gold traded lower last week. The first support to give way was the $1,300 level but this was soon followed by a break down through the 50% fib pull back level of the 2008-2011 bull move. However, the USD weakness that crept in on Friday helped to lift Gold back above this 50% fib.
The bullish ‘inverse H&S’ pattern is still forming up on the weekly chart though. The ‘neck line’ of this inverse H&S is still up around the $1,400 region, which is also up near the weekly 200 EMA level.
Gold is trading below the Ichimoku Cloud on the 4hr chart, above on the daily chart, in the bottom of the Cloud on the weekly and just below the Cloud on the monthly chart. It is worth remembering that the November candle was the first monthly candle close below the Ichimoku Cloud since January 2002, a period of almost 12 years! Price had pulled back up to test the Cloud but the March, April and May candles closed back below the monthly Cloud. The June monthly candle closed back up in the bottom of the Cloud. This may be a case now of Gold forming a base, as the ‘inverse H&S’ would suggest, and starting to climb its way back. The July candle closed just below the monthly Cloud.
The weekly candle closed as a bearish candle. The July candle closed as a bearish coloured, almost ‘Inside’ candle.
It is worth noting that Gold has completed a 61.8% fib pull back of the bull move from the last swing low, back in October 2008, to the highs of 2011. Thus, this is as good a place as any to try to carve out a basing pattern.
- I’m watching for any new TC signal on this pair and the ‘Inverse H&S’ pattern on the weekly chart.

The post Trade Week Analysis for 04/08/14 appeared first on www.forextell.com.