Last week: Geopolitical tension eased a bit last week and some 4 hr chart trends returned to the markets. There were three valid TC signal that all delivered pips: EUR/USD = 100 (closed). E/J = 70 (closed) and A/J = 110 (open).
This week:
The USDX has finally made a bullish weekly close above the 81.50 level. The index is also trading above the Ichimoku Cloud on the hourly, 4 hr, daily, weekly and monthly time frames which is bullish. I still would not be surprised to see the 81.50 level tested, even if there is to be bullish continuation on the index. A review of the USDX and EURX can be found through this link.
This week is a much lighter week data wise.
The Jackson Hole Symposium continued after the markets closed and into the w/e. Thus, traders need to watch for any Symposium commentary that could potentially impact sentiment when the markets do re-open.
I am away this week and updates will be brief and less frequent. The hotel I am staying at has reduced internet capabilities and I have not been able to upload all my charts. This post has taken a lot longer than usual because of these issues and I have not had enough time to edit so apologies in advance for any issues.
Events in the Ukraine and the Middle East continue to have the potential to undermine any developing ‘risk’ appetite and needs to be monitored.
Stocks and broader market sentiment:
In much the same way as last week, the four main US stock indices, the S&P500, DJIA, NASDAQ and Russell 2000, all closed with bullish weekly candles in spite of another bearish Friday. There was some renewed concern about the situation in the Ukraine again last Friday which saw stocks slip back a bit but the four indices have held above their daily support trend lines for another week.
It is worth noting that the Emerging Markets ETF is looking quite bullish as it trades just under a triangle trend line and under key $45 resistance. A bullish breakout here would support bullish continuation across the broader stock markets:
EEM: Emerging Markets ETF

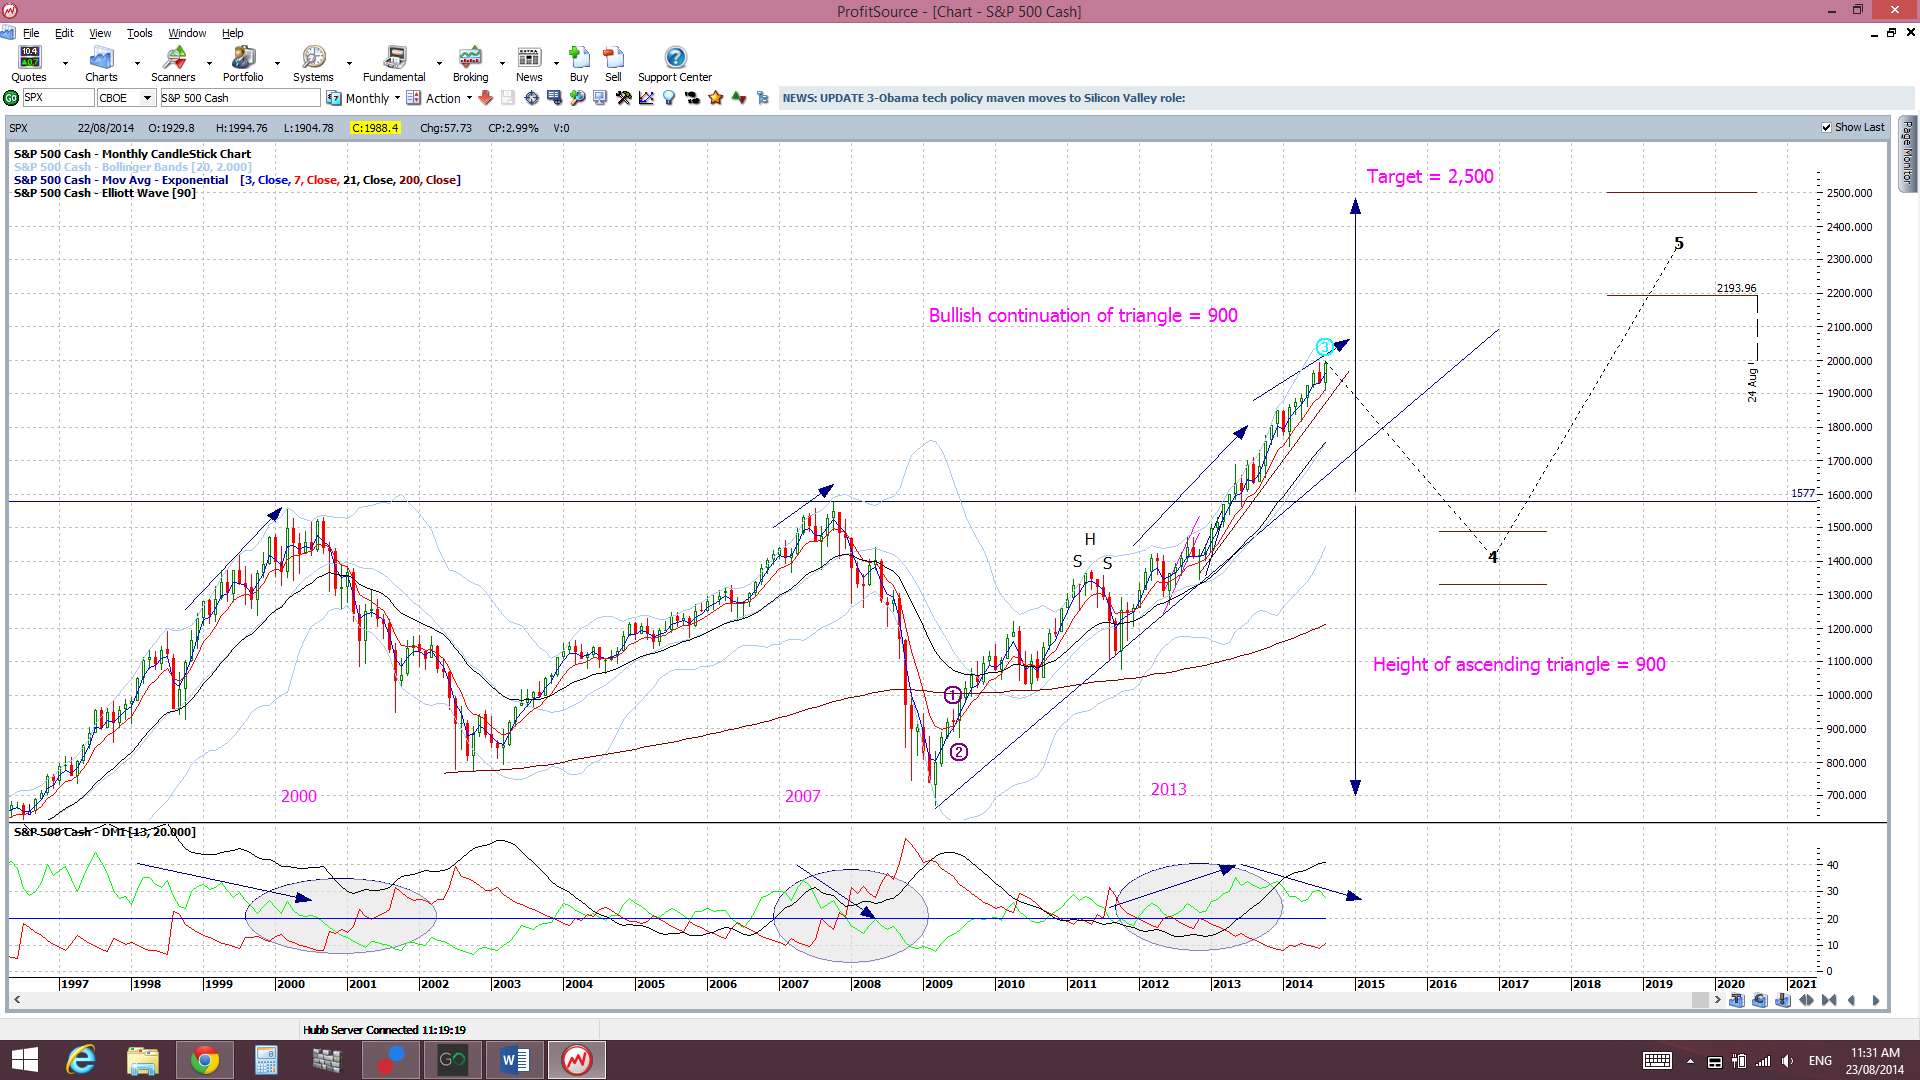
I am still seeing divergence on the monthly S&P500 monthly chart though and whilst this might just be warning of a pause, as the index navigates new highs, the chance of a pullback cannot be ruled out either. There has not been any real deep pull back since the break up through the 1,577, 1,600, 1,700 and 1,800 levels and the major break of the 1,577 level was only tested once. Thus, I am still being cautious here now even though the daily support of the S&P500 has not been broken.
It is worth noting that a 61.8% fib pull back of the recent bull run (Nov 2012-present) would bring price down to near the 1,577 area. This remains significant as it is the breakout level of the previous highs from the 2000 and 2007 peaks. I would expect this region could be a target if there was any pullback on the S&P500.
Thus, with all of this, I continue to watch out for further clues as to any new momentum move, long or short though! In particular I’m looking out for:
S&P500 daily chart: I’m watching for any break of the daily trend line but price is holding above this for the time being. The index also continues to hold above the top trend line of the bullish ascending triangle (1,900). I do note that the index has the potential to form another ‘Double Top’ here. Next week will be interesting to see if there is bullish continuation thereby avoiding any ‘Double Top’.
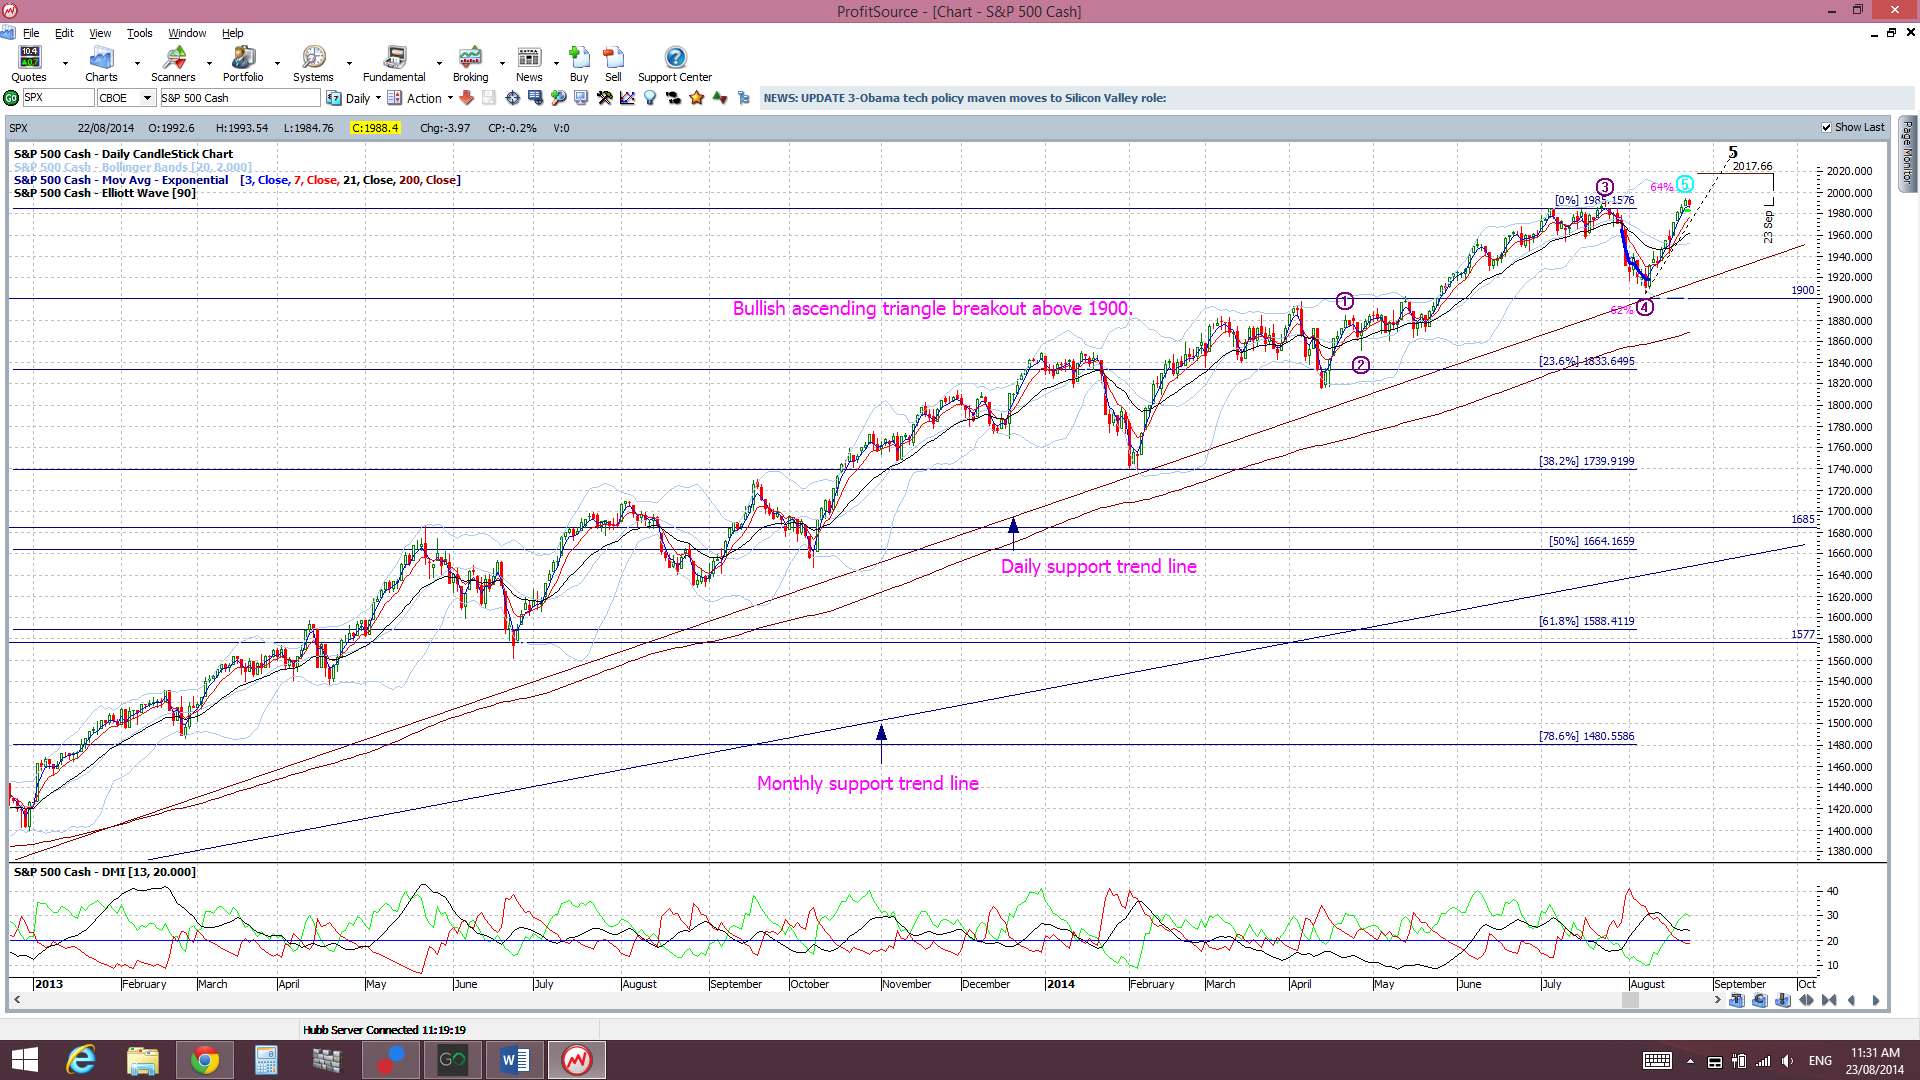
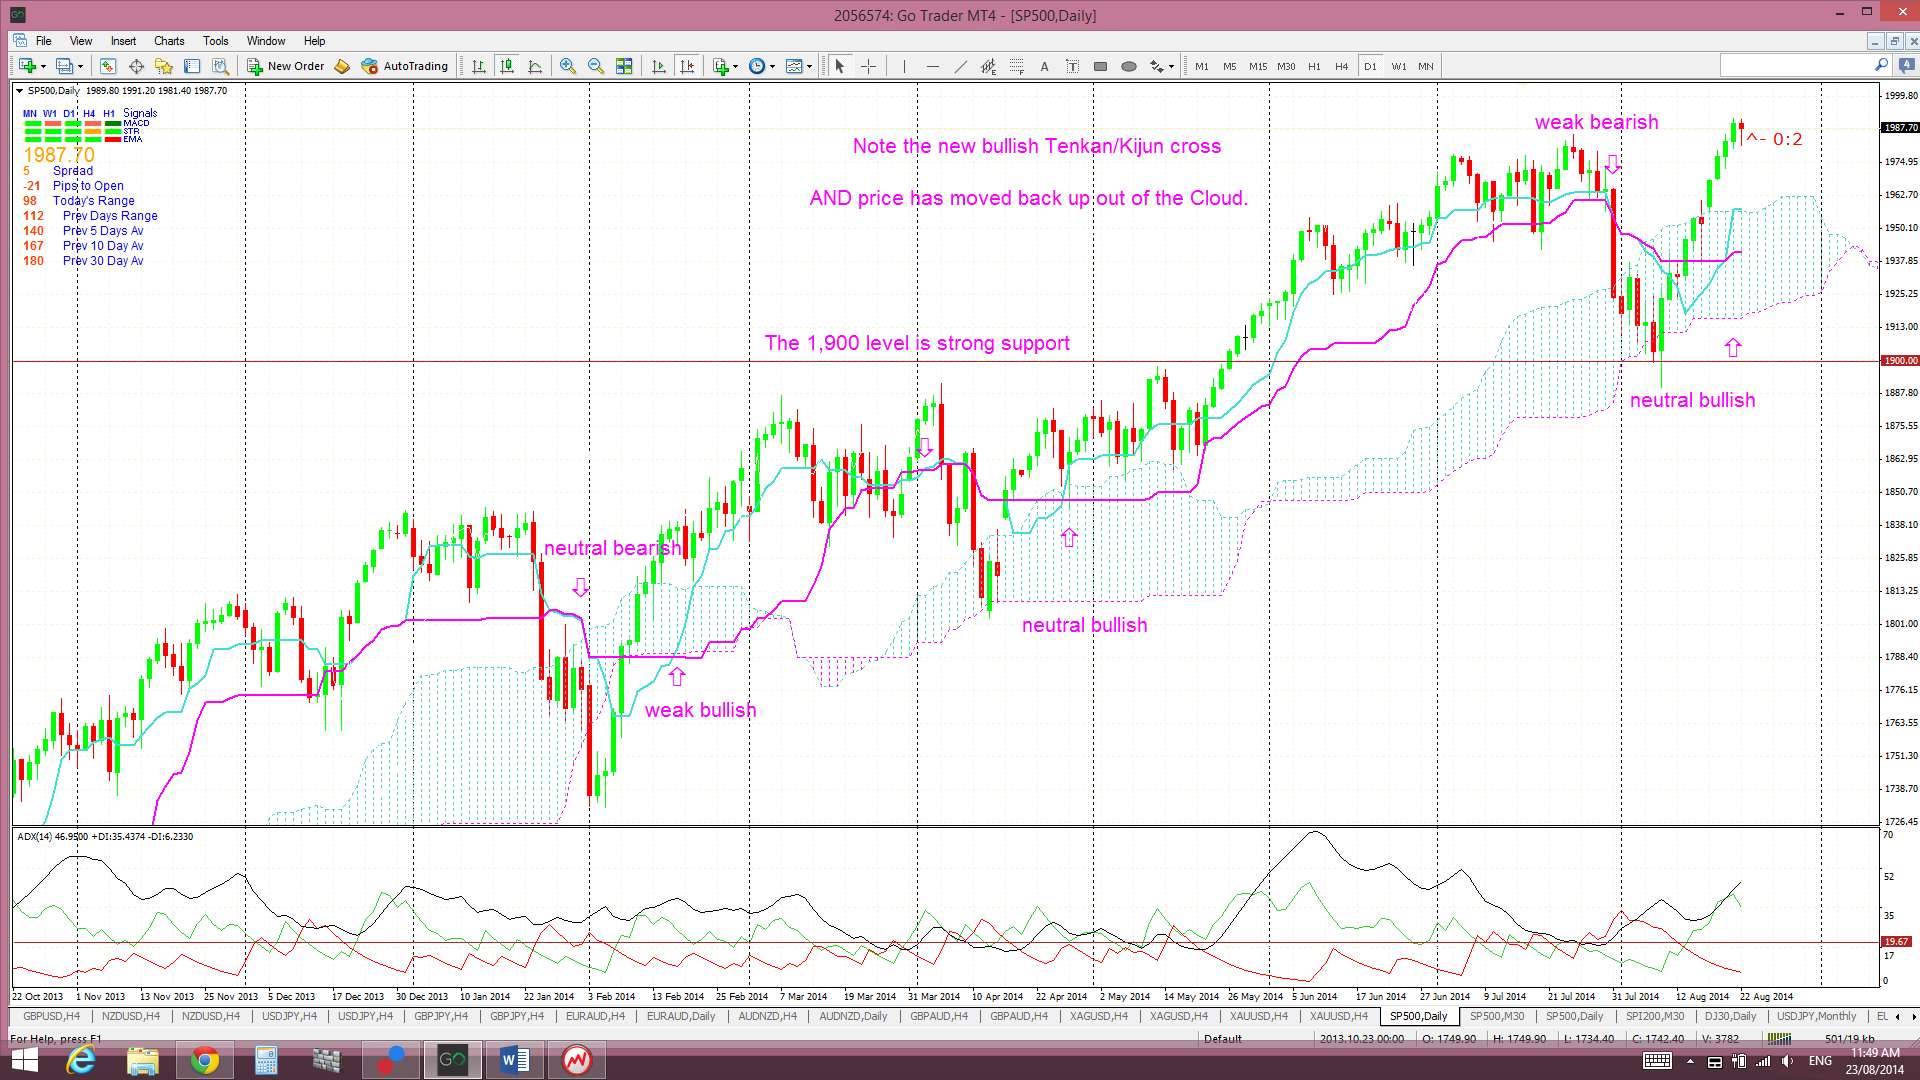
Ichimoku S&P500 chart: a clear cross of the blue Tenkan-sen line below the pink Kijun-sen line. However, there was a recent bullish Tenkan/Kijun cross on the index and it is also now trading above the Cloud which is rather bullish. This latest bullish cross is deemed a ‘neutral’ signal though as it evolved within the Cloud.
S&P500 monthly chart: a break of the monthly support trend line (see monthly chart). The monthly trend line remains intact. A break of this support level would suggest to me of a more severe pull back or correction. The look of this ‘market top’ still appears quite different to that of the previous two market tops from back in 2000 and 2007. I am seeing divergence on the monthly chart though. This may just be as the index pauses and ponders this new high or it could be warning of a pull back. Elliott wave suggest a big correction here though. I am still thinking that the 1,600 level might be the new base line for this index. The saying that ‘Old resistance becomes new Support’ holds here. I still believe that it would not be at all surprising to this 1,600 level tested again. It has only been tested once by a monthly candle since the bullish breakthrough and I would expect a significant level such as this to be tested more than once. Maybe I’m wrong here though as there have now been thirteen consecutive months of candles that have closed above this key level, and, without testing this region at all. To add to this thought of bearish pull back potential, the previous candle close ‘highs’ from back in 2000 and 2007 were down near the 1577/1580 area so it is entirely feasible that price may even test this region again before any continued move upwards. I actually won’t be too comfortable with any bullish continuation move on the S&P500 until this 1,577 level is tested again but, for the moment, the trend seems to be continuing higher.
Russell 2000 Index: this small caps index is a bit of a US market ‘bellwether’ and I see the 1,100 level as key support here. The index held above this level again last week:

Trading Calendar Items to watch out for:
- Sun 24th: Jackson Hole Symposium Day 3.
- Mon 25th: GBP Bank Holiday. EUR German Ifo Business Climate. USD New Home Sales.
- Tue 26th: NZD Trade Balance. USD Core Durable Goods & Consumer Confidence.
- Wed 27th: nil
- Thurs 28th: AUD Private Capital Expenditure. EUR German Prelim CPI. USD Prelim GDP, Unemployment Claims & Pending Home Sales.
- Fri 29th: NZD ANZ Business Confidence. EUR CPI Flash Estimates. CAD GDP.
Forex:
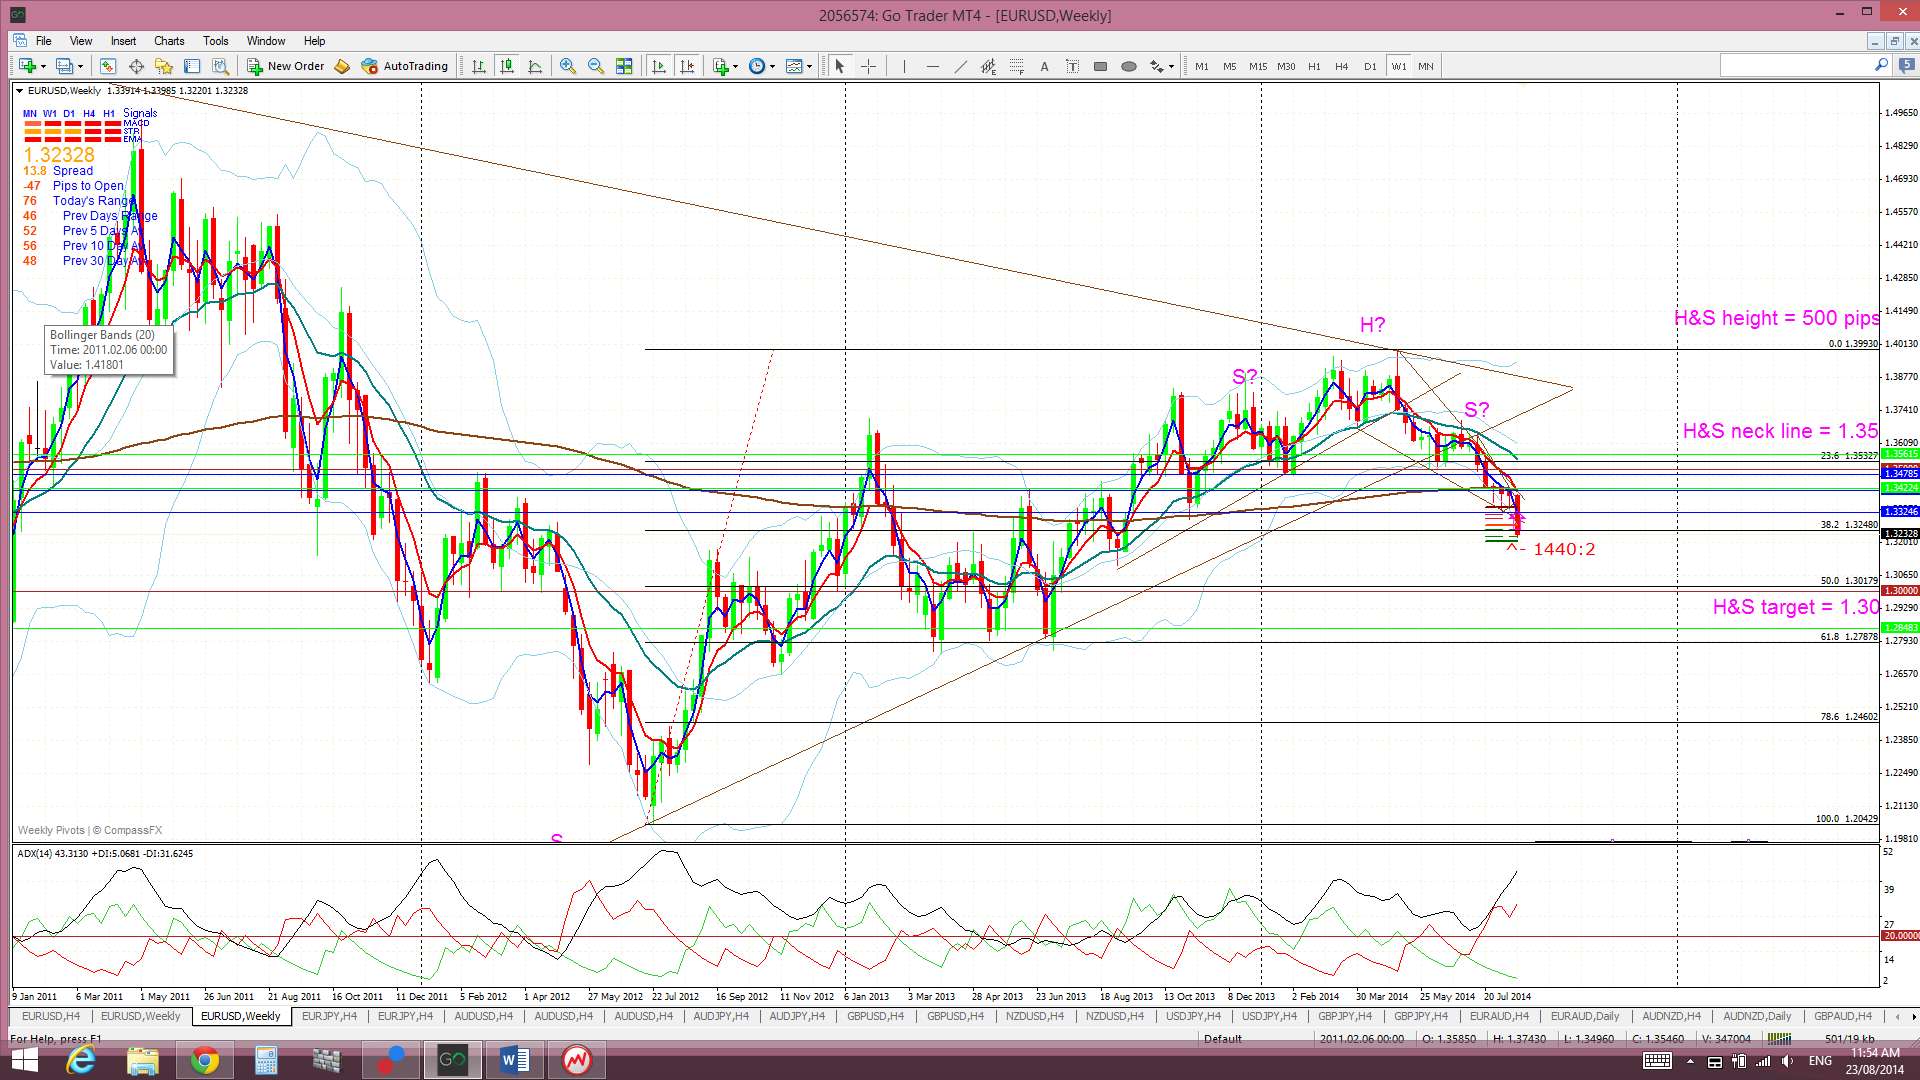
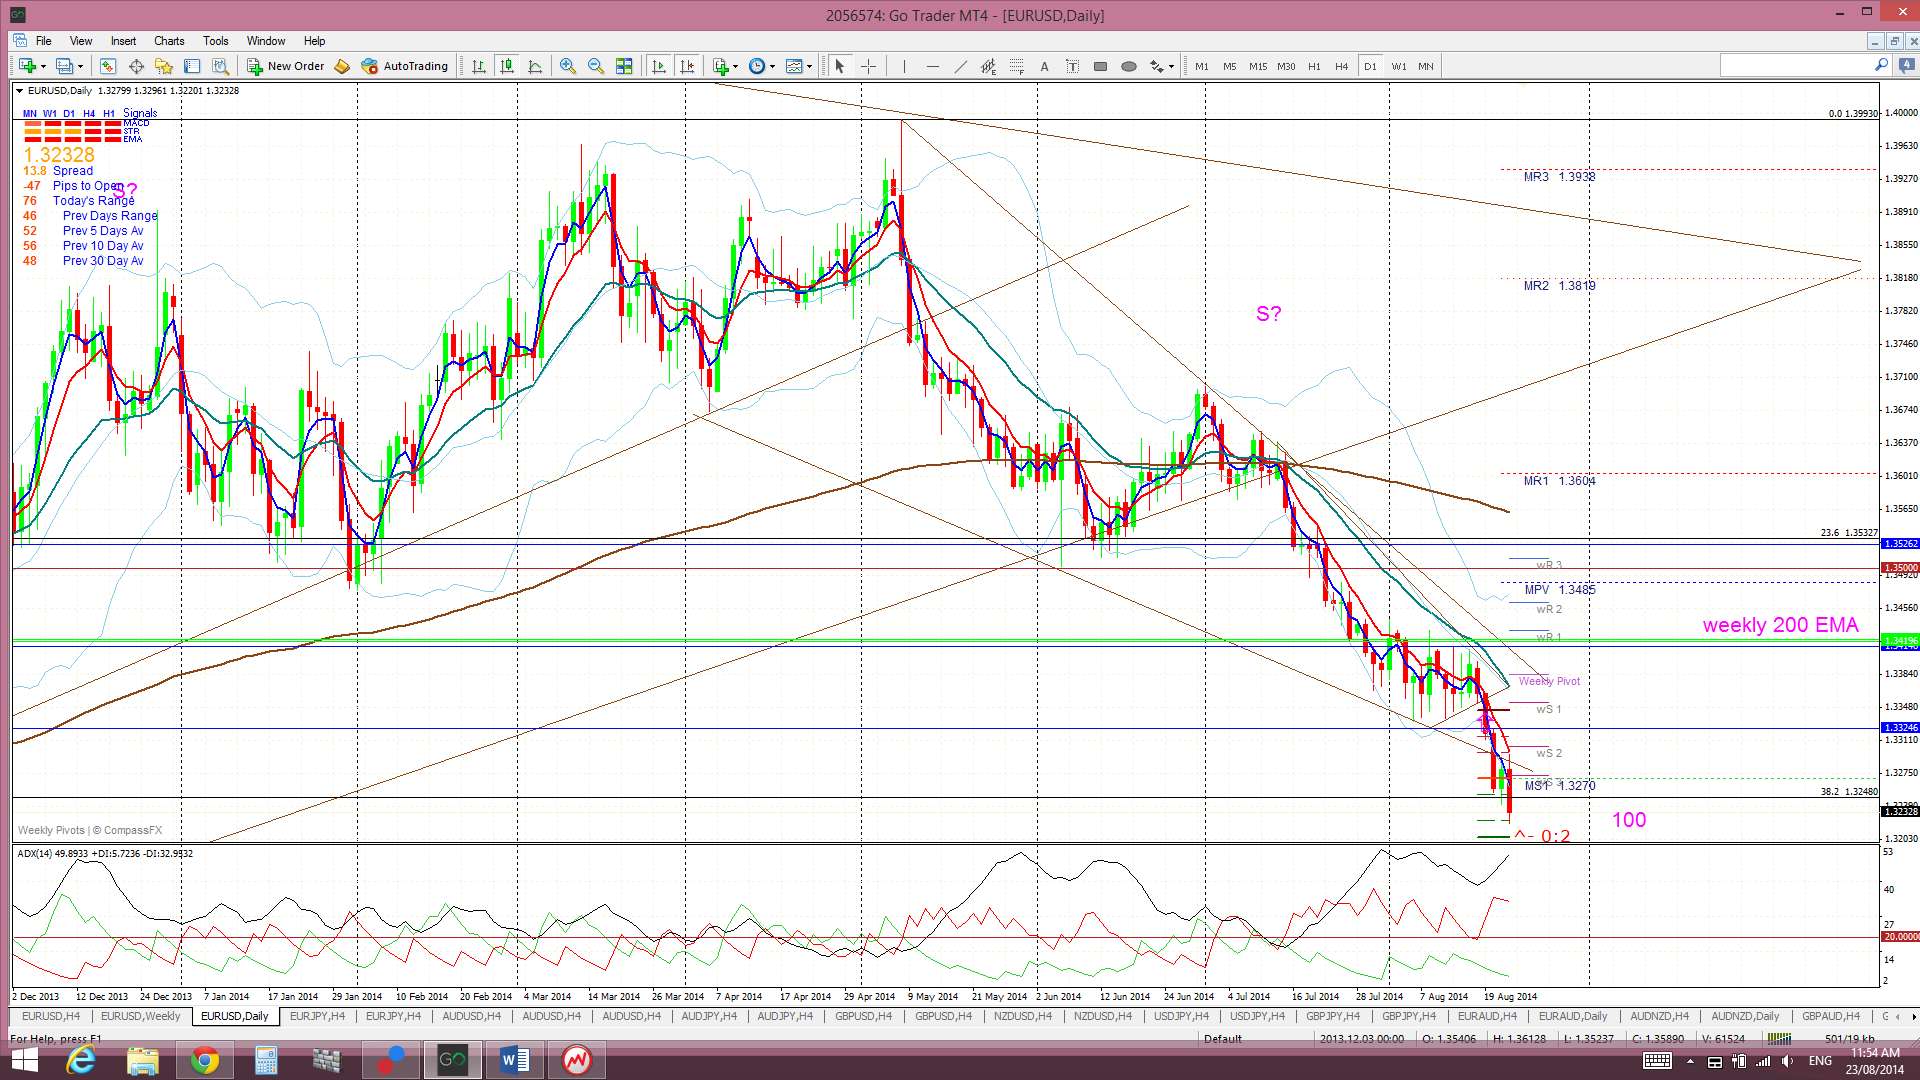
E/U: The E/U chopped lower again last week and broke down through the 4hr chart’s triangle pattern, the daily chart’s descending wedge and below the bottom of the weekly Ichimoku Cloud. This move triggered anew TC signal that has closed off now but not before delivering up to 100 pips.
Weekly H&S? The weekly chart’s bearish ‘H&S’ is still evolving with the ‘neck line’ of 1.35 now clearly broken. The height of this weekly H&S pattern is about 500 pips. The theory of these technical patterns is that any bearish follow through can be expected to extend by the same order of magnitude as the height of the pattern. Thus, the projected target for this H&S pattern is 500 pips below the 1.35 level. This would predict the E/U to target the 1.3 level which is just above the monthly 200 EMA. This move has now delivered up to 270 pips. The 1.35 level remains the key level to watch here: A close and hold back above the 1.35 would void this pattern but a respect would suggest the neck line is simply being tested before bearish continuation.
I had mentioned that there is plenty of support below current price and that any bearish follow through may be choppy which is what we continue to see. Support levels below current price include the:
- 50% fib level of this latest Bull Run.
- monthly 200 EMA AND
- 61.8% fib level of this latest Bull Run.
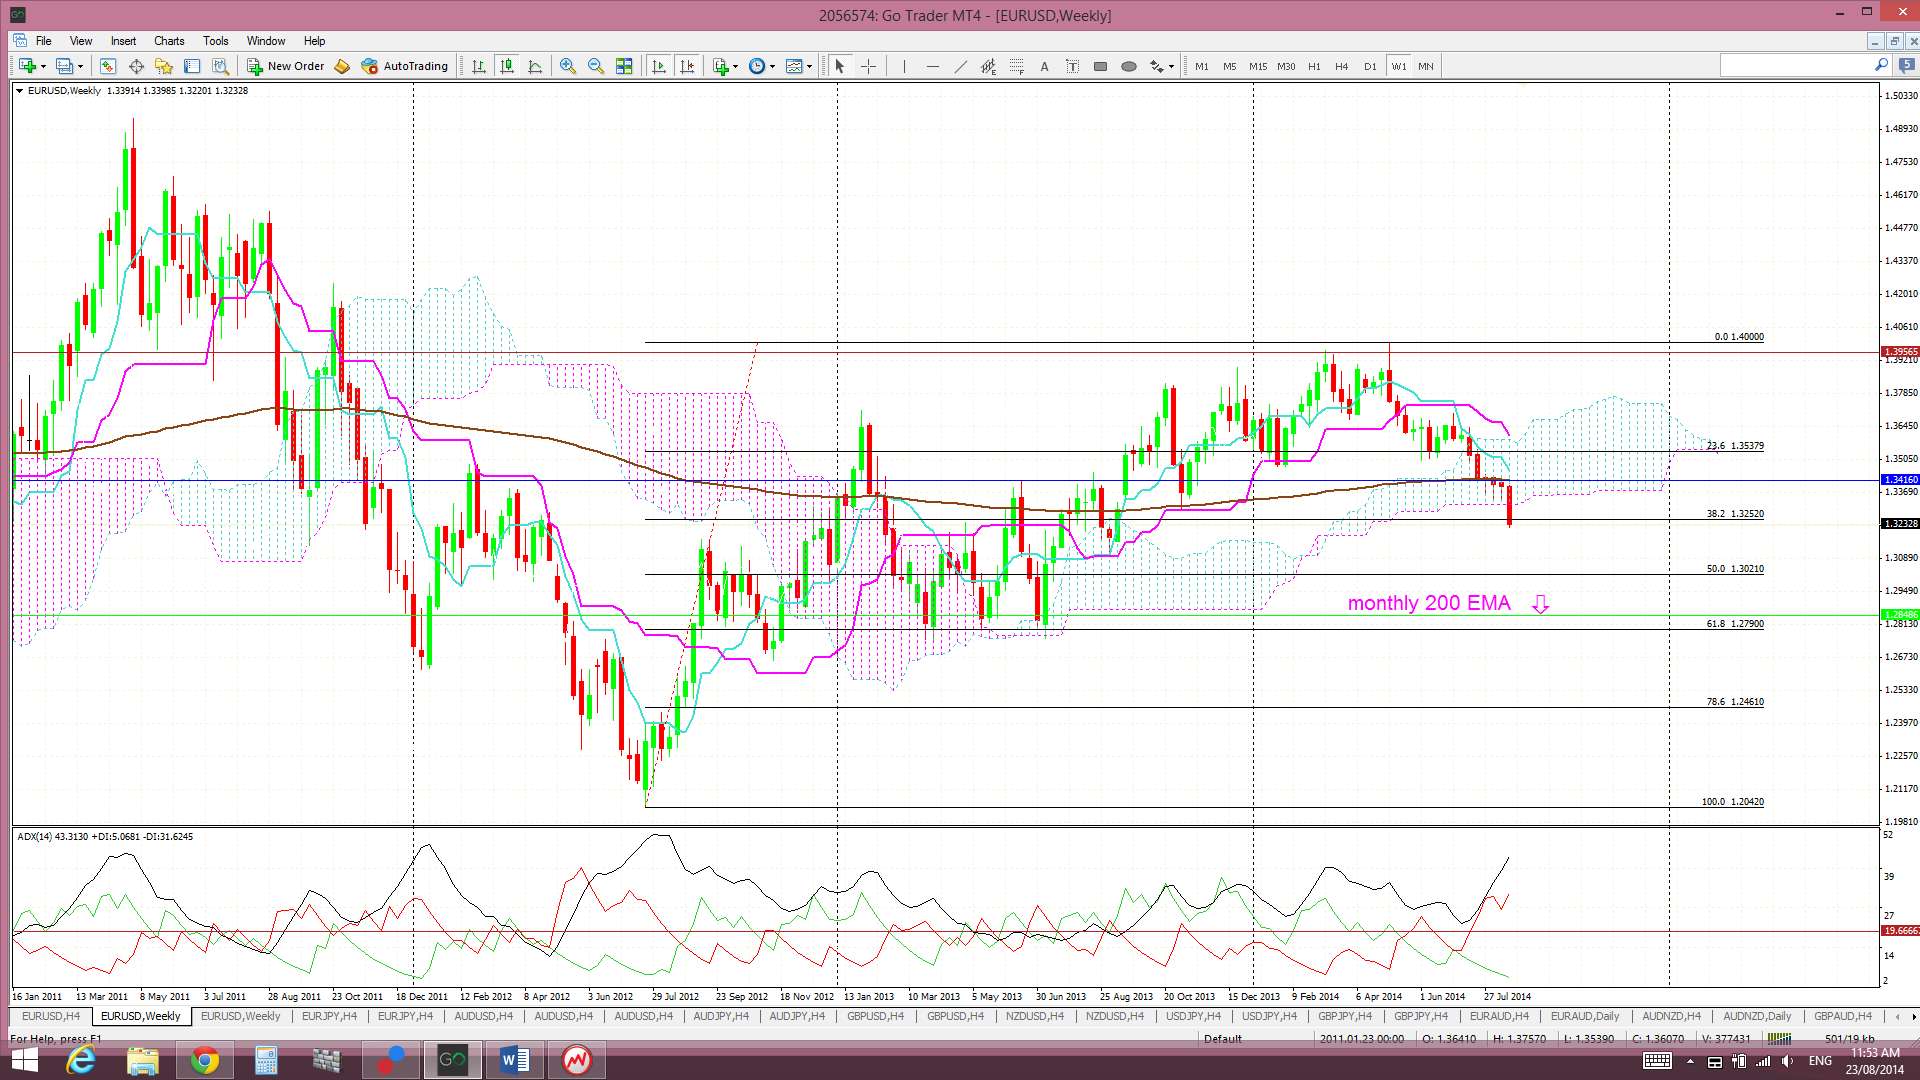
Price is now trading below the Ichimoku Cloud on the 4hr, daily chart, weekly and monthly charts which is a major bearish development.
The weekly candle closed as a large bearish candle.
- I’m watching for any new TC signal.

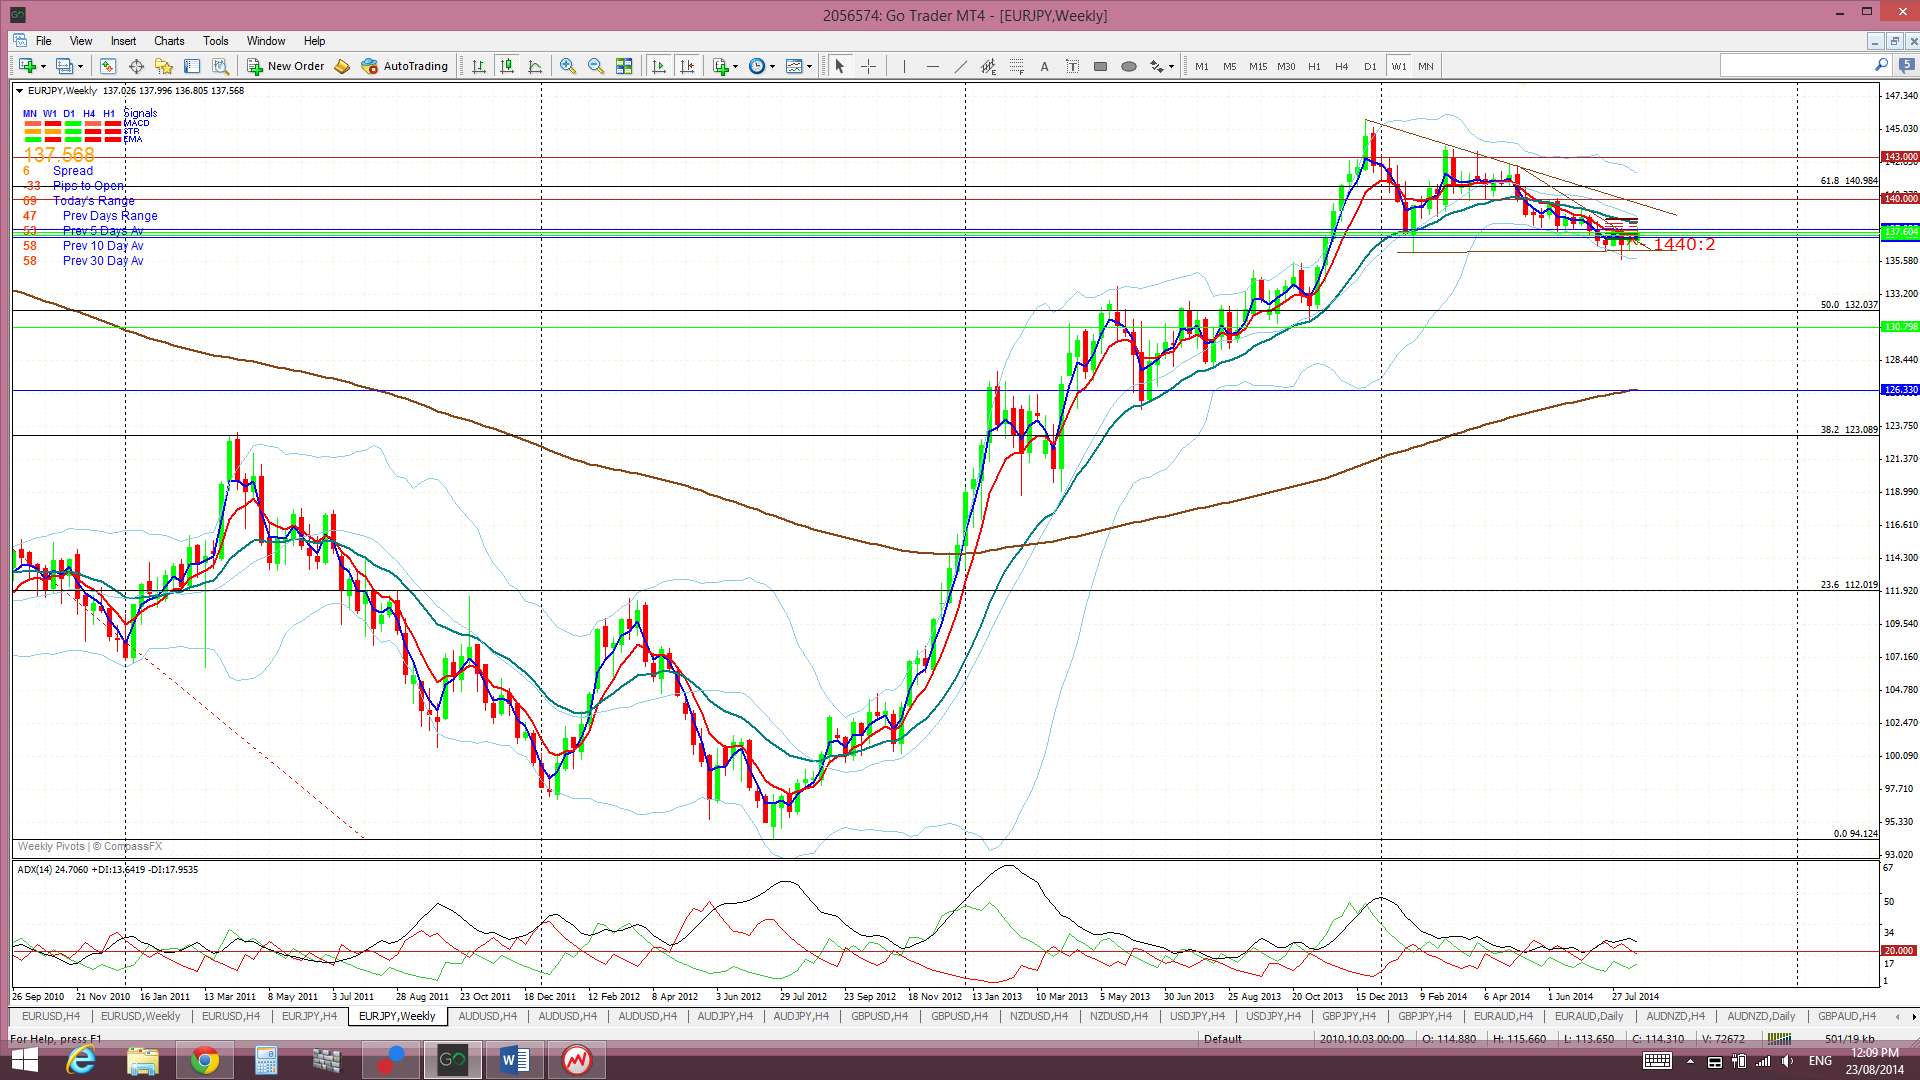
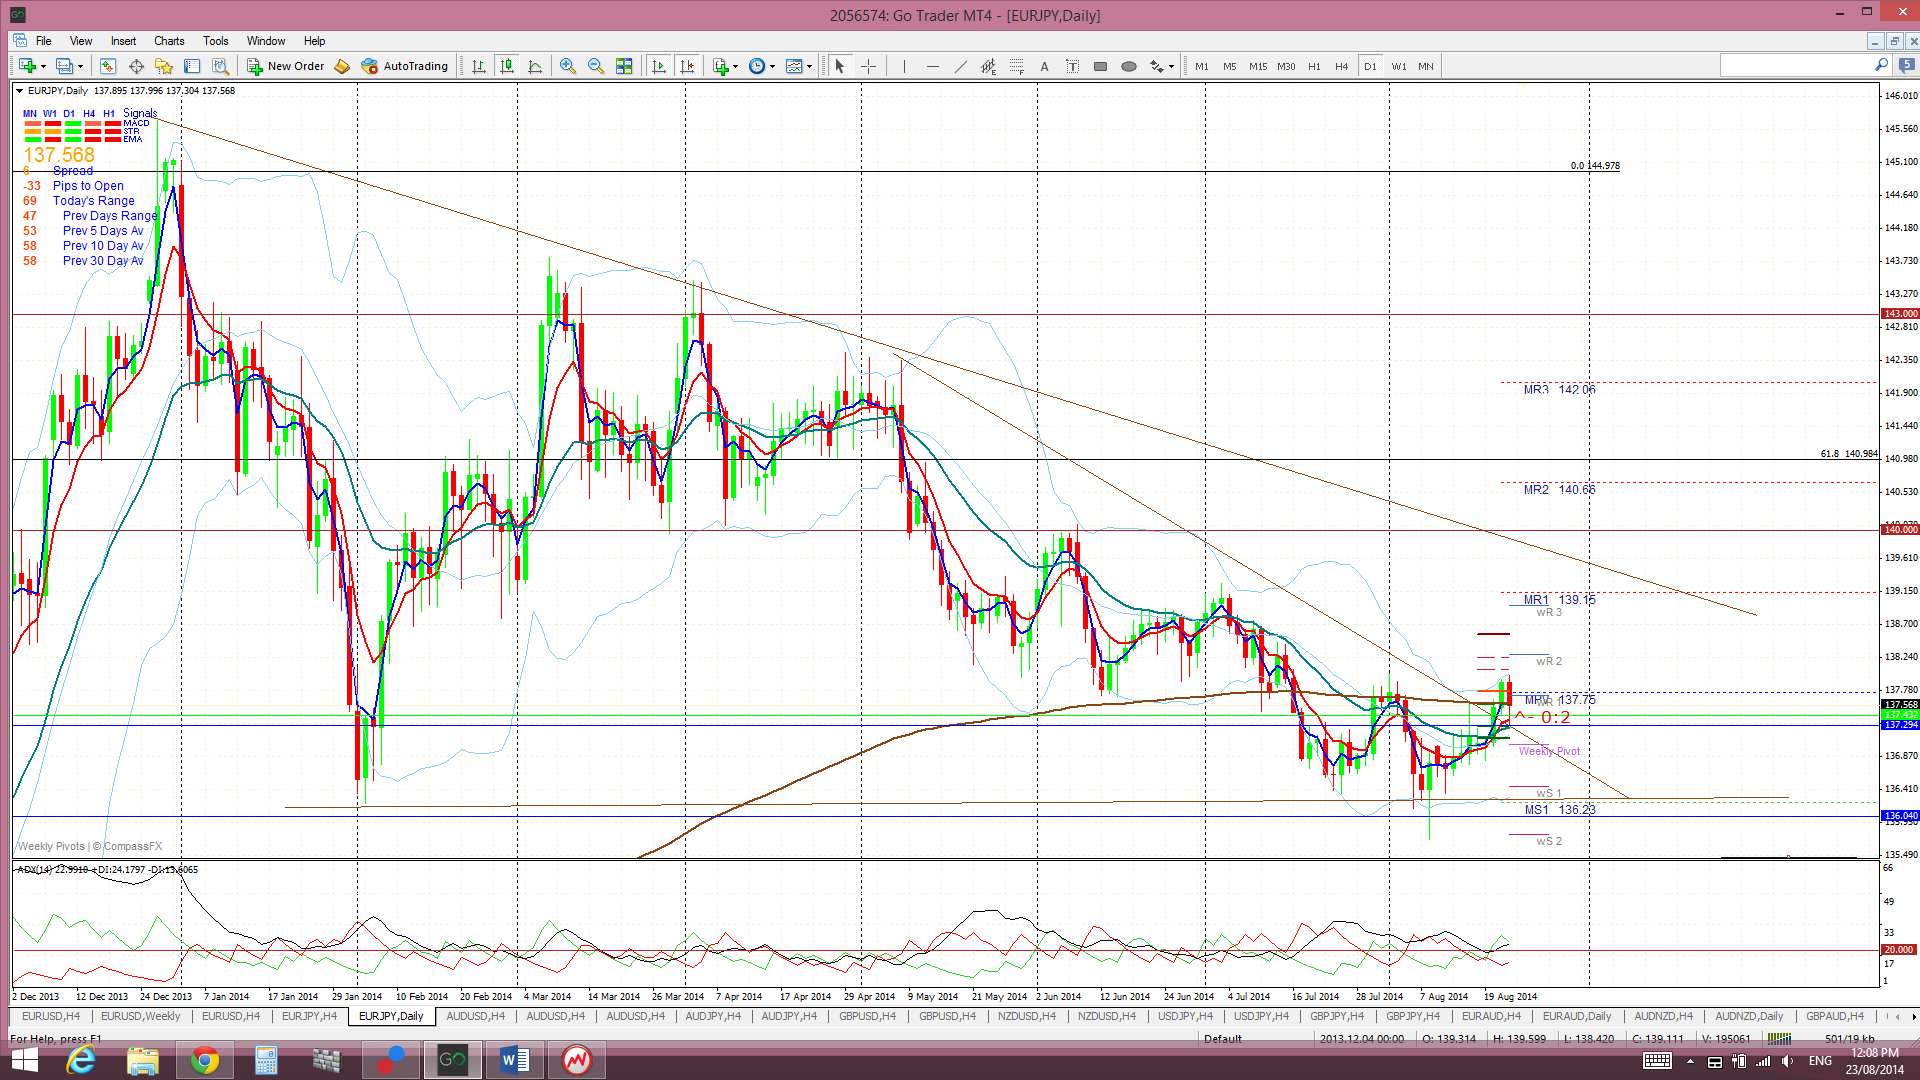
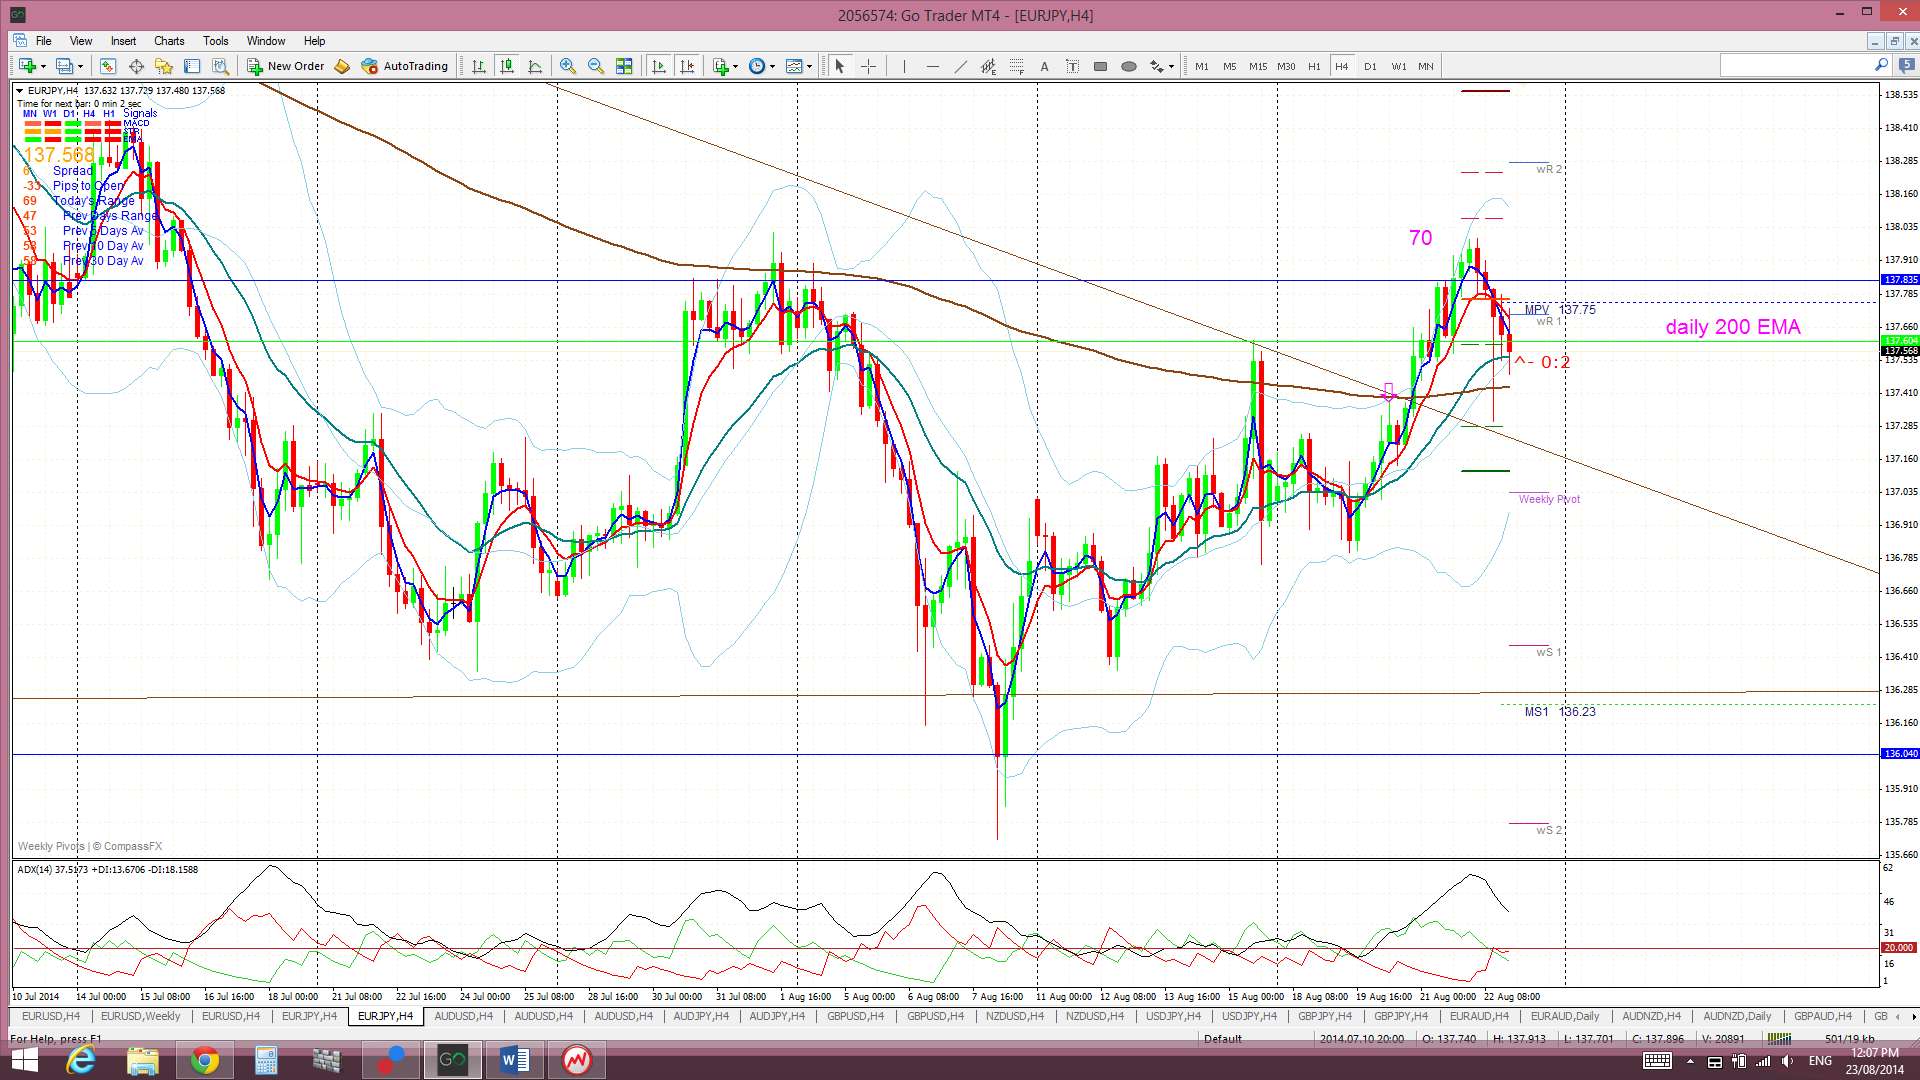
E/J: The E/J chopped higher last week and broke up through the daily chart’s bear trend line and the daily 200 EMA resistance level. This move triggered a new TC signal that gave up to 70 pips before closing off on Friday. Renewed Ukraine concern on Friday resulted in some Yen strength which seems to have caused the pull back here. Though, from a technical view, the daily Ichimoku Cloud could also be blamed for causing the E/J to stall:
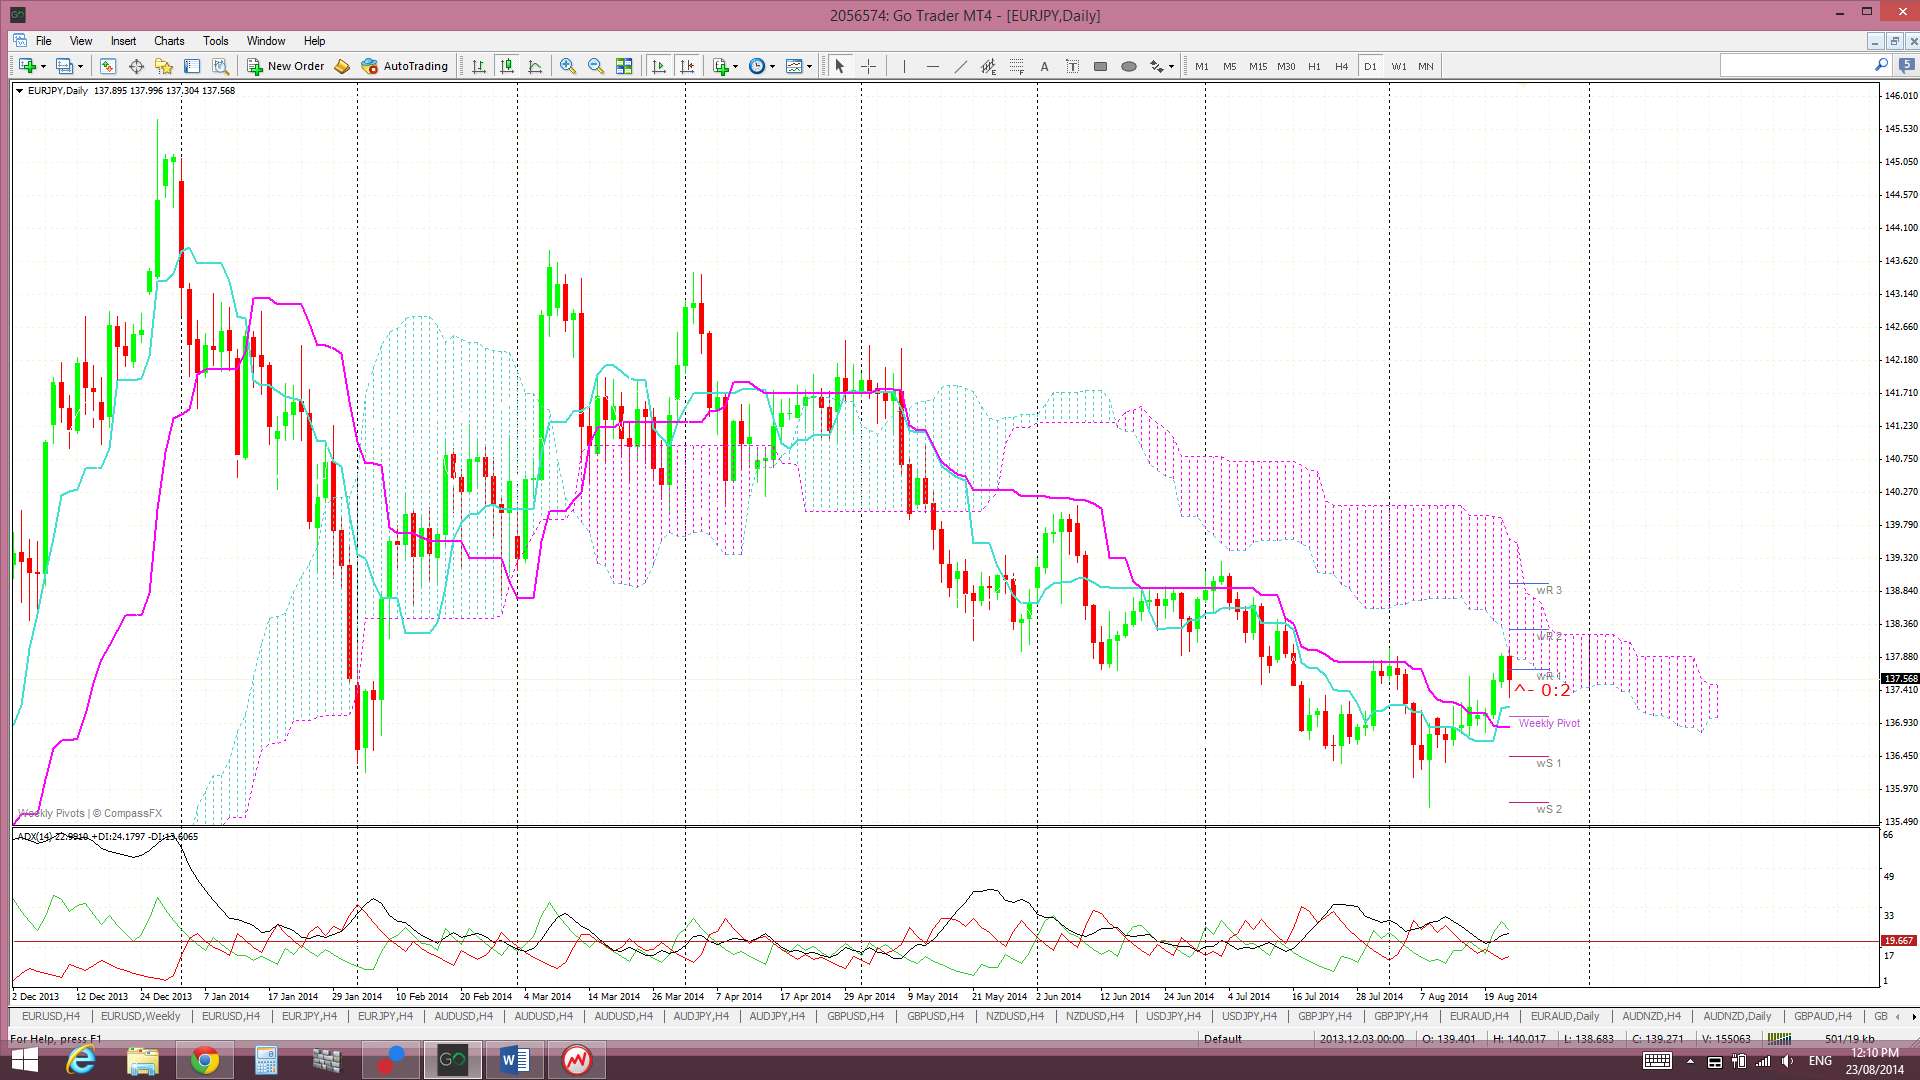
The E/J closed the week sitting back at the safety of the daily 200 EMA BUT still up and out from the triangle pattern. Thus, I will be looking for signs of any bullish continuation here.
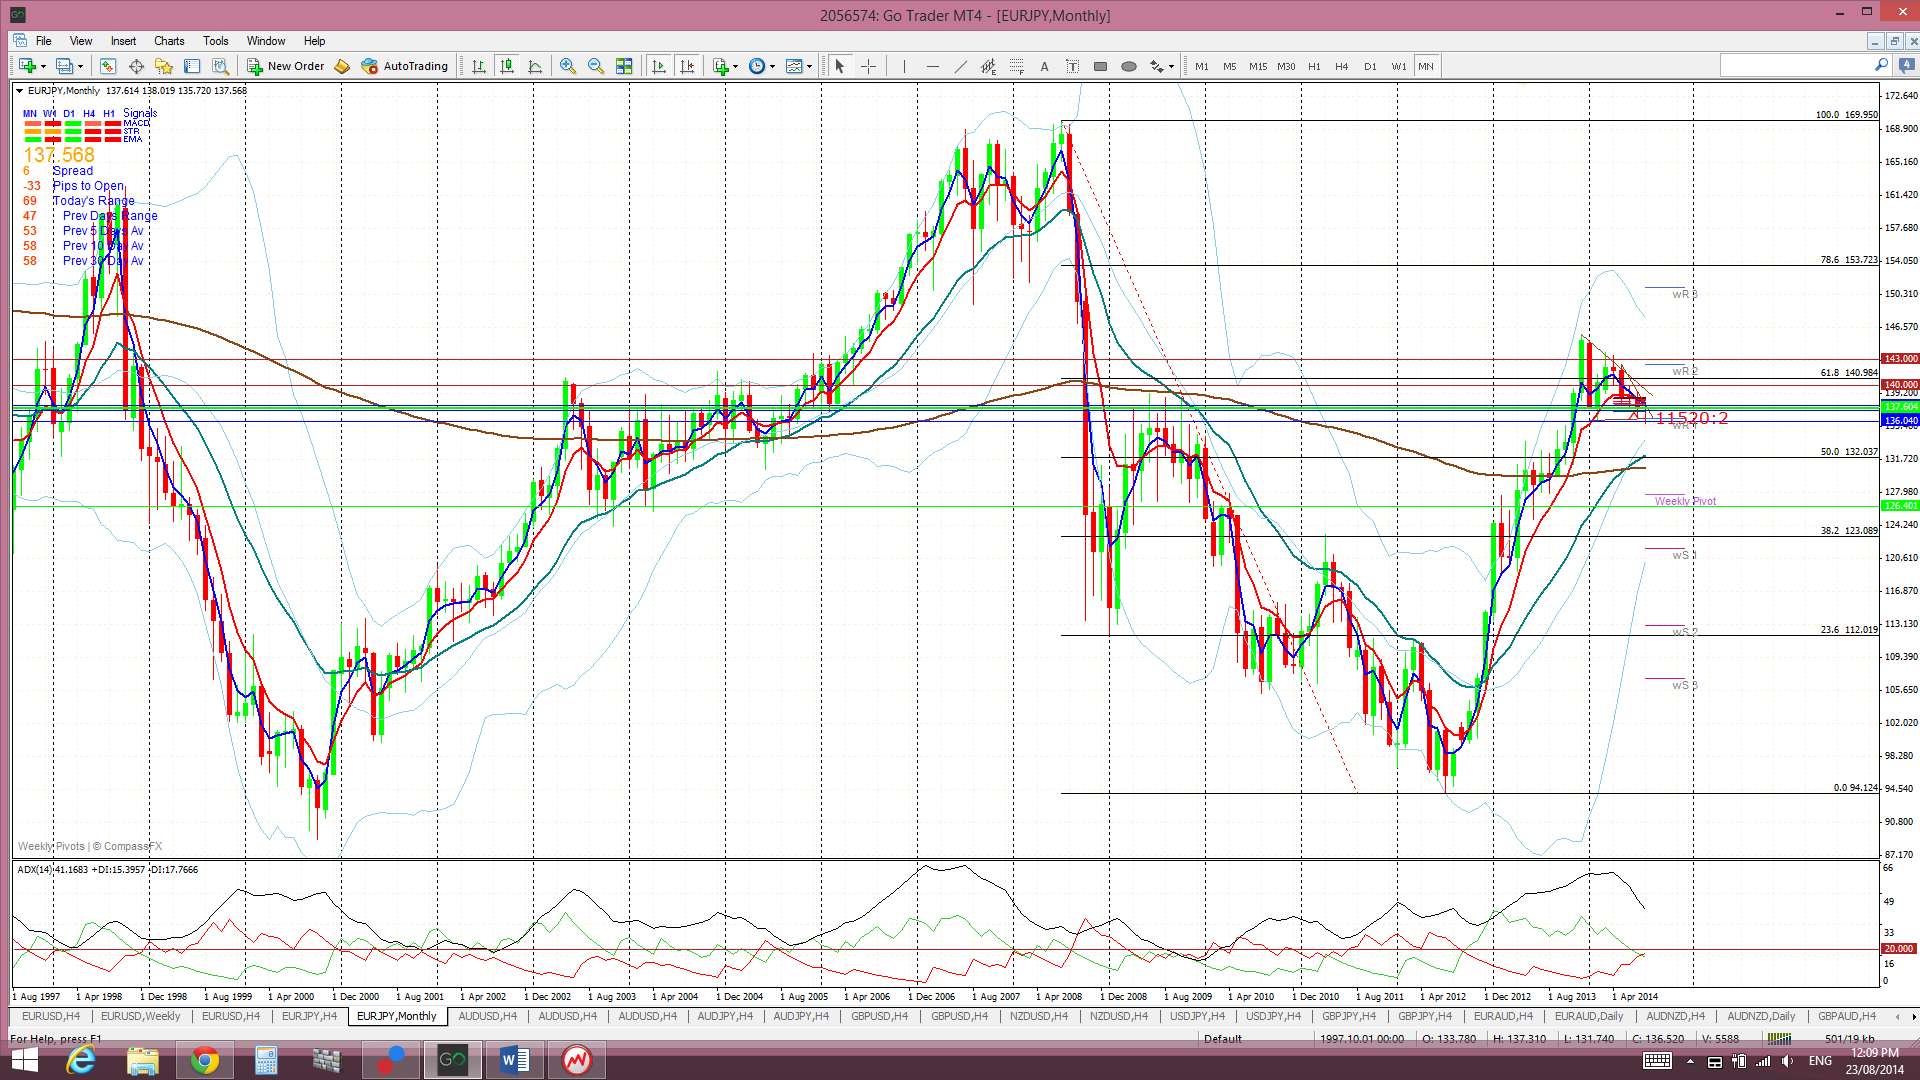
Price is still trading above the Cloud on the 4hr charts, below on the daily chart, in the Cloud on the weekly but above the Cloud on the monthly chart. The November and December candles were the first to close above the resistance of the monthly Ichimoku Cloud since 2008.
The weekly candle closed as a small bullish candle.
The weekly and monthly charts still show the E/J looking ‘Bull Flag’ like to me!
- I’m watching for any new TC signal on this pair and the daily 200 EMA.
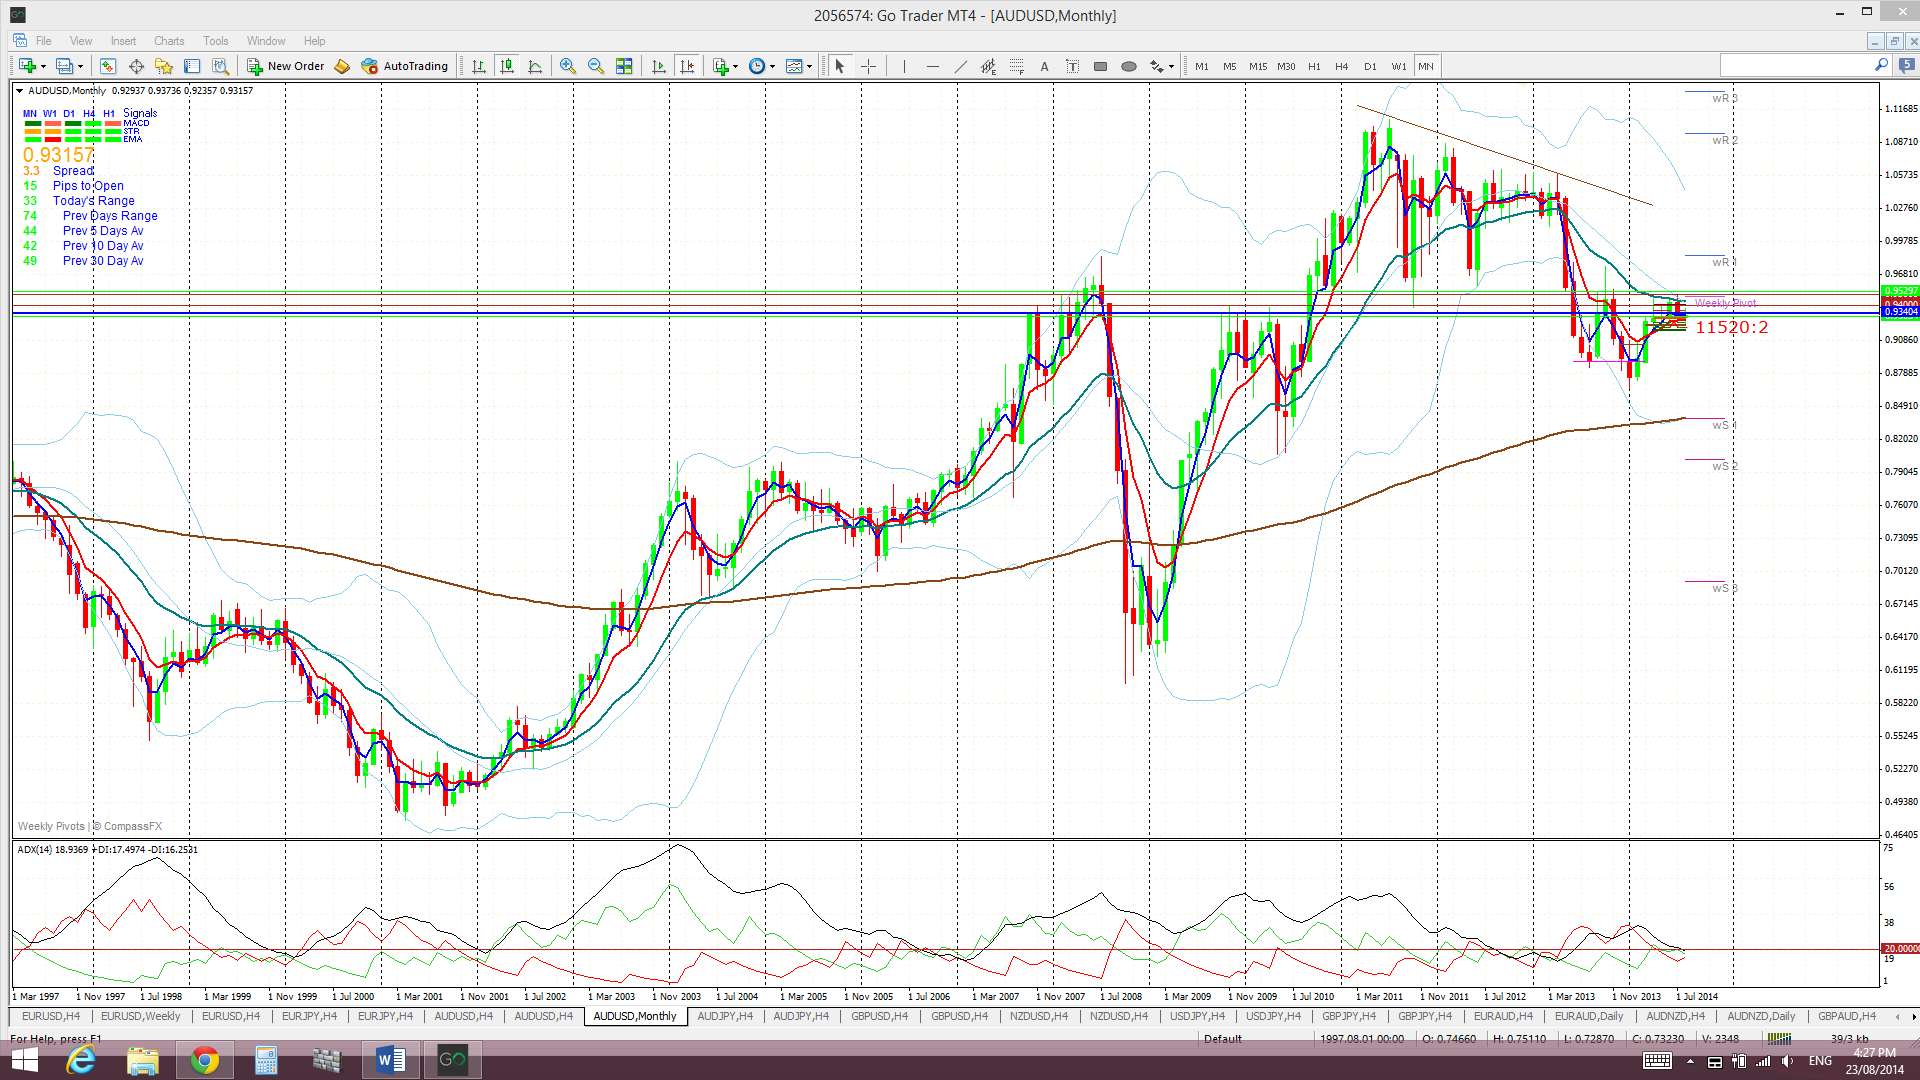
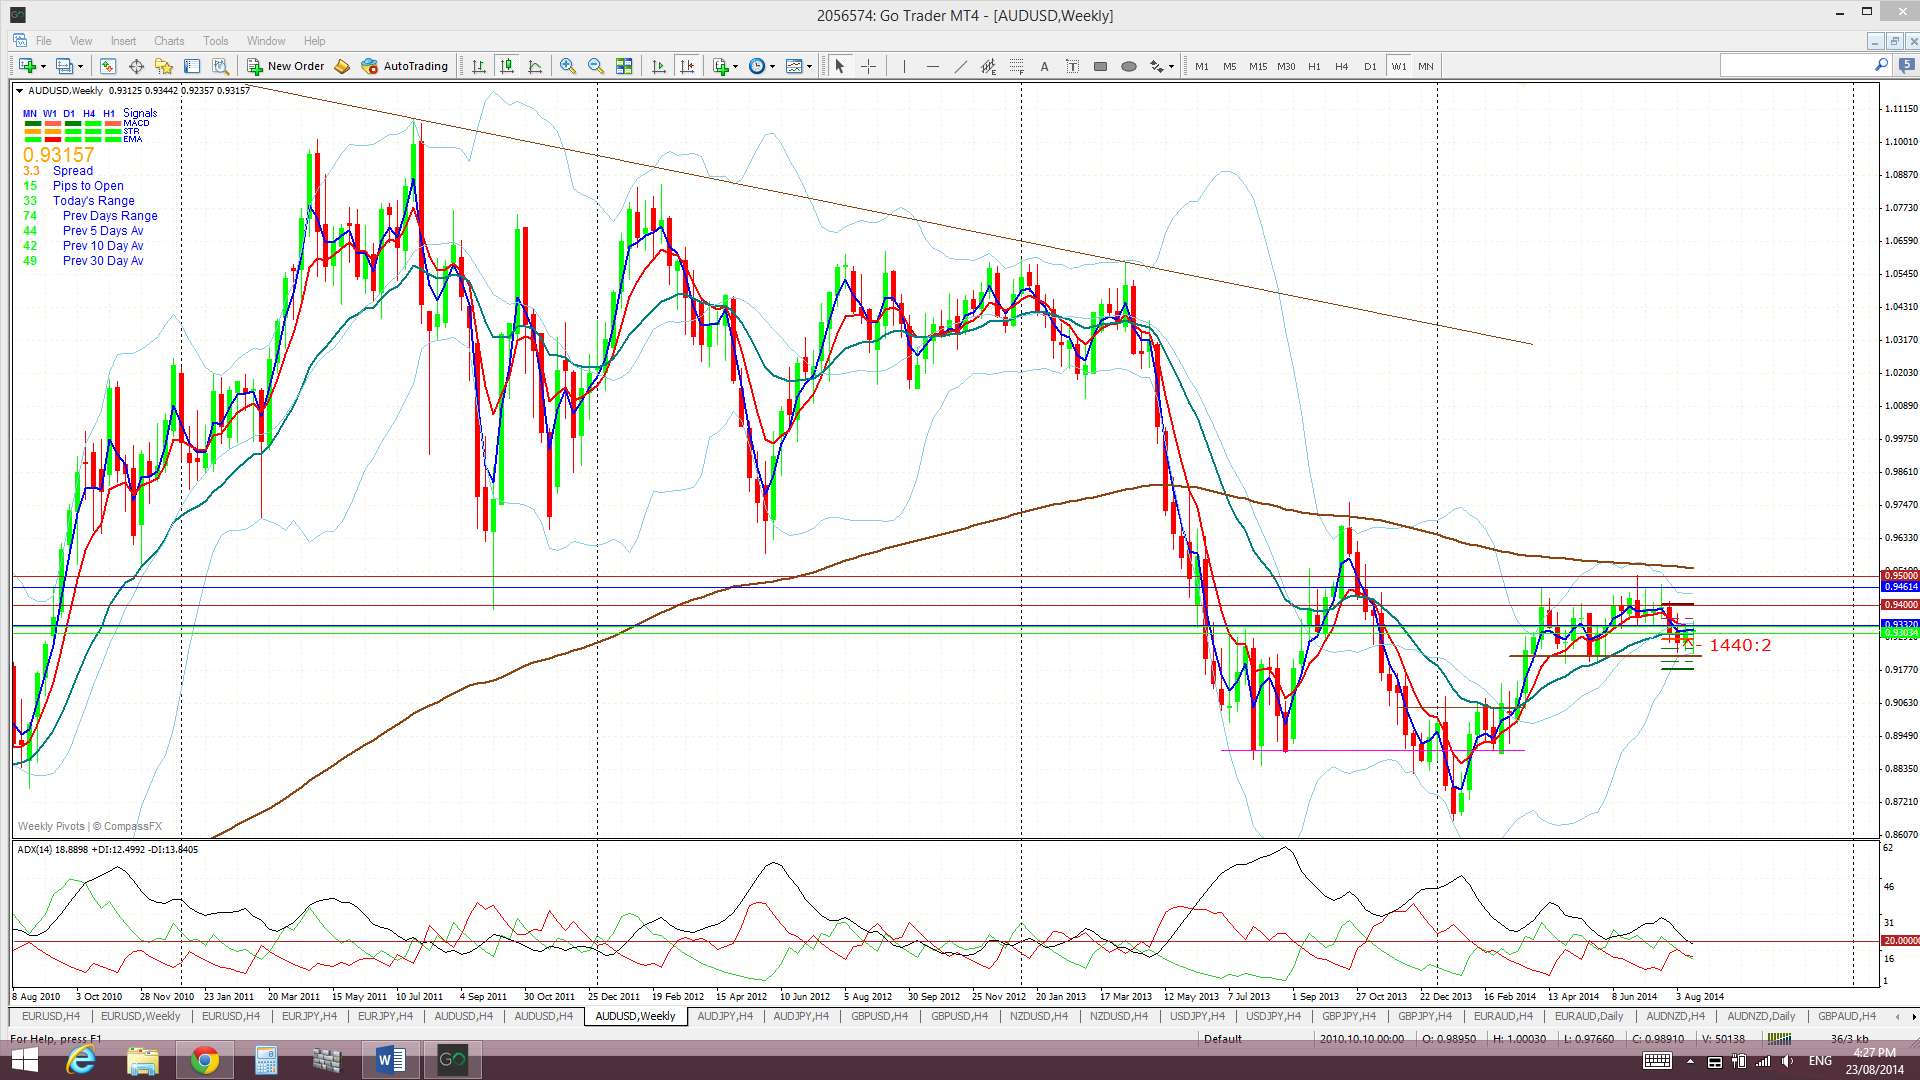
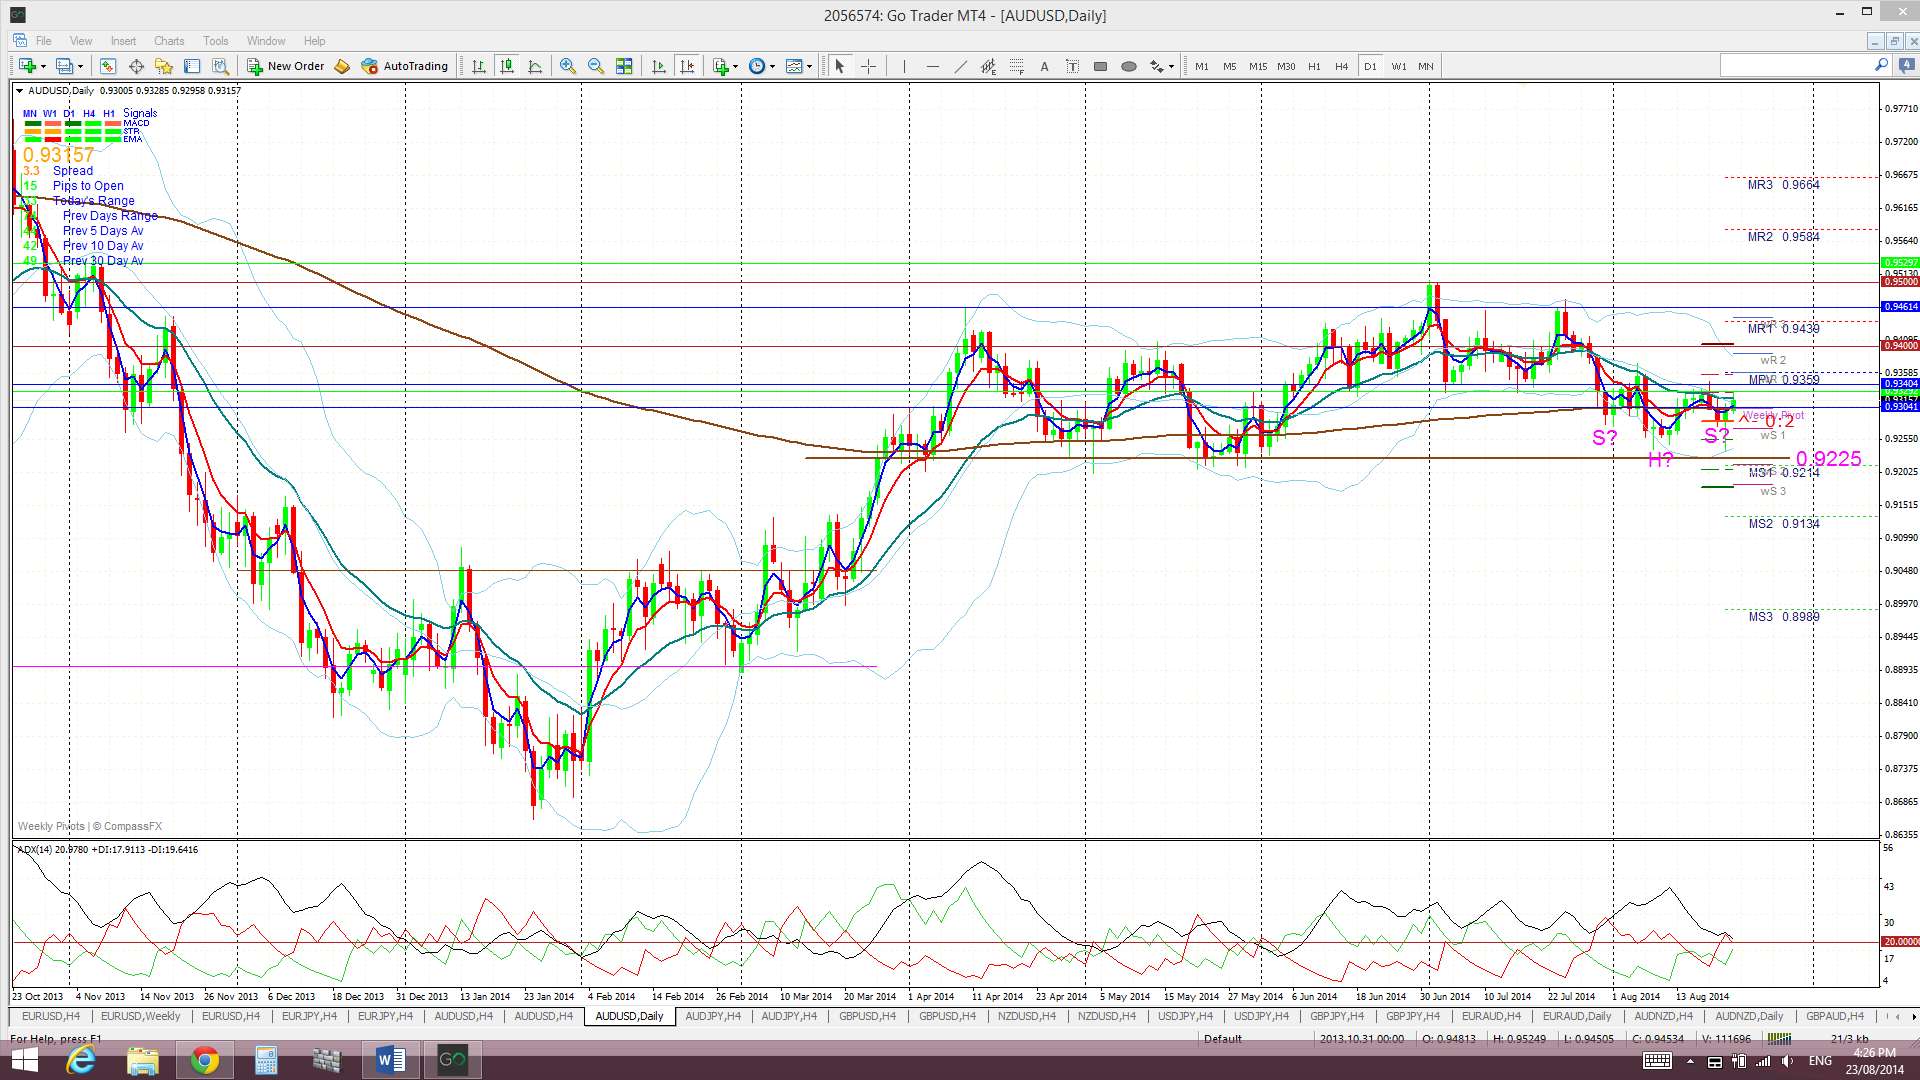
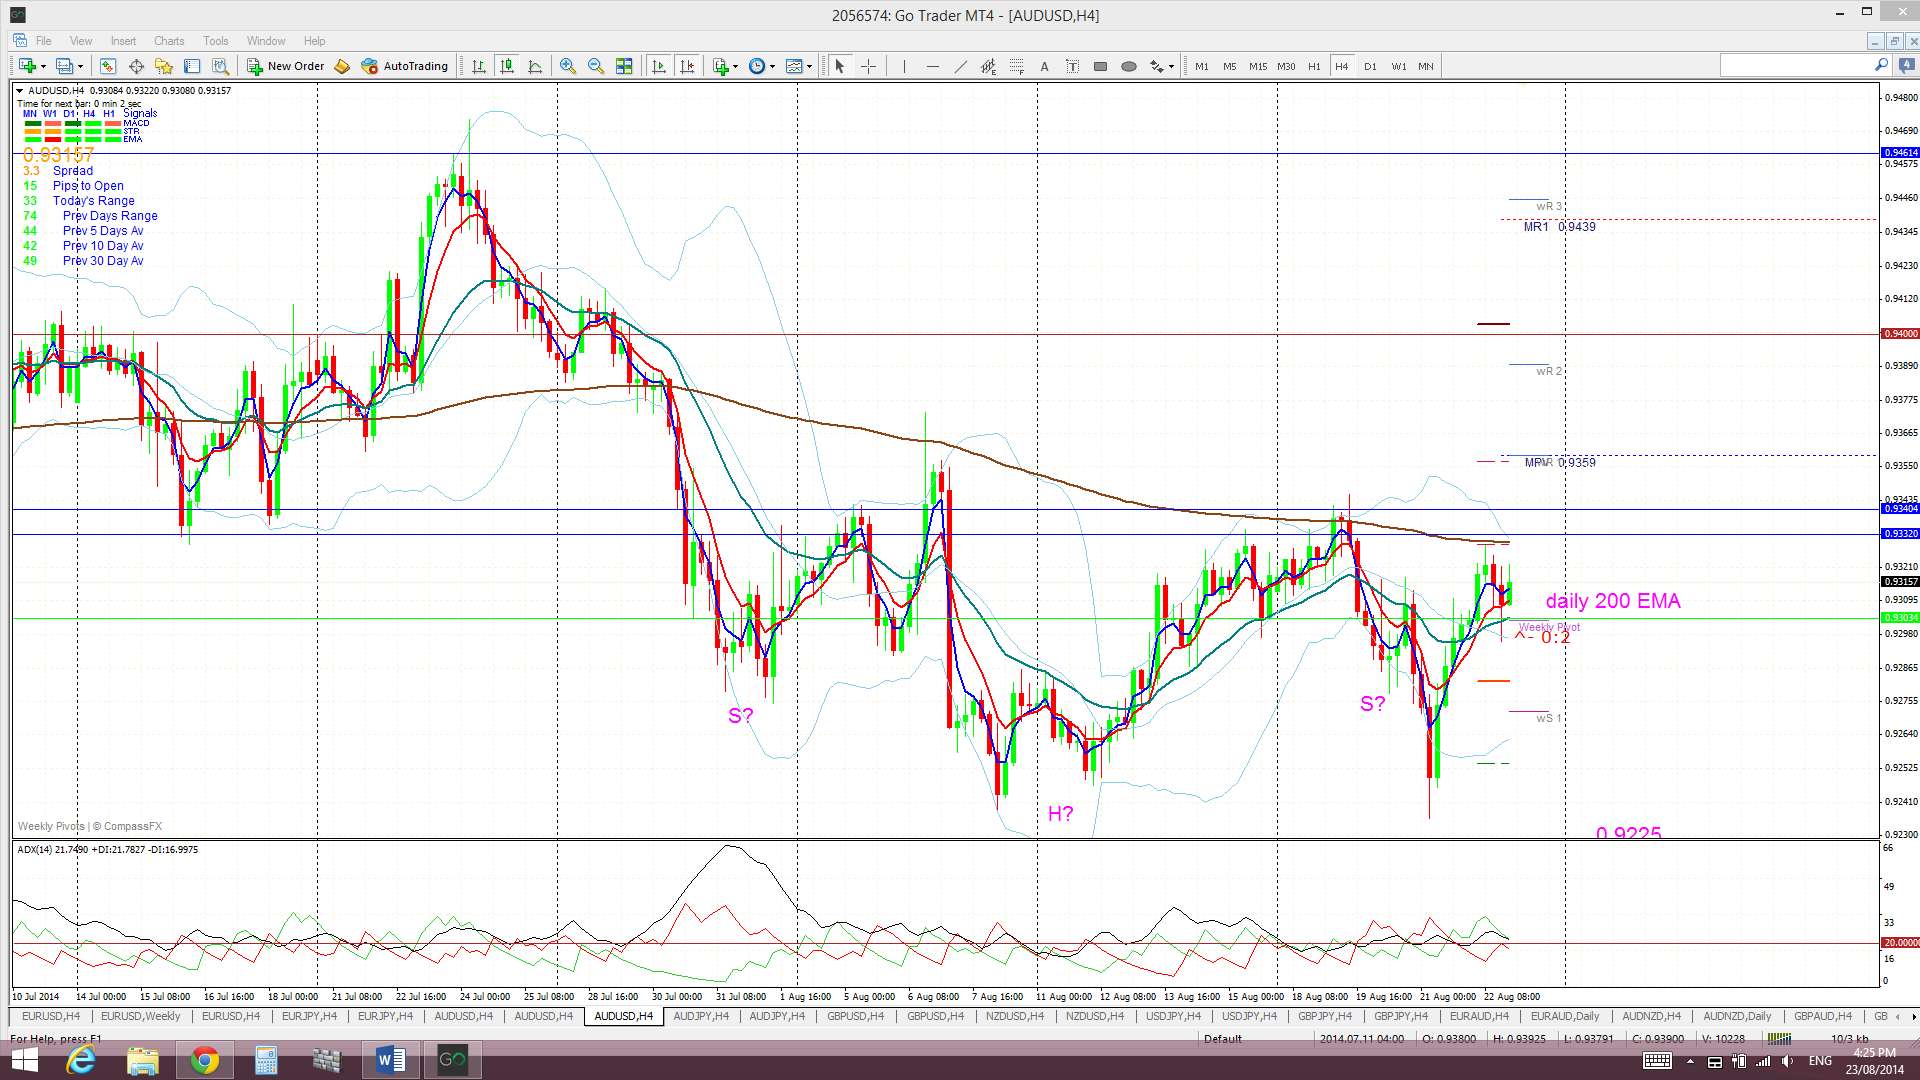
A/U: The AUD chopped up and down last week either side of the daily 200 EMA and this was again in spite of a strengthening USD.
Price is still trading above the Cloud on the 4hr chart, just below the Cloud on the daily chart and in the middle of the Cloud on the weekly and monthly charts.
The weekly candle closed as a bullish coloured Doji candle reflecting some indecision here.
- I’m watching for any new TC signal on this pair and the 0.9225 level.
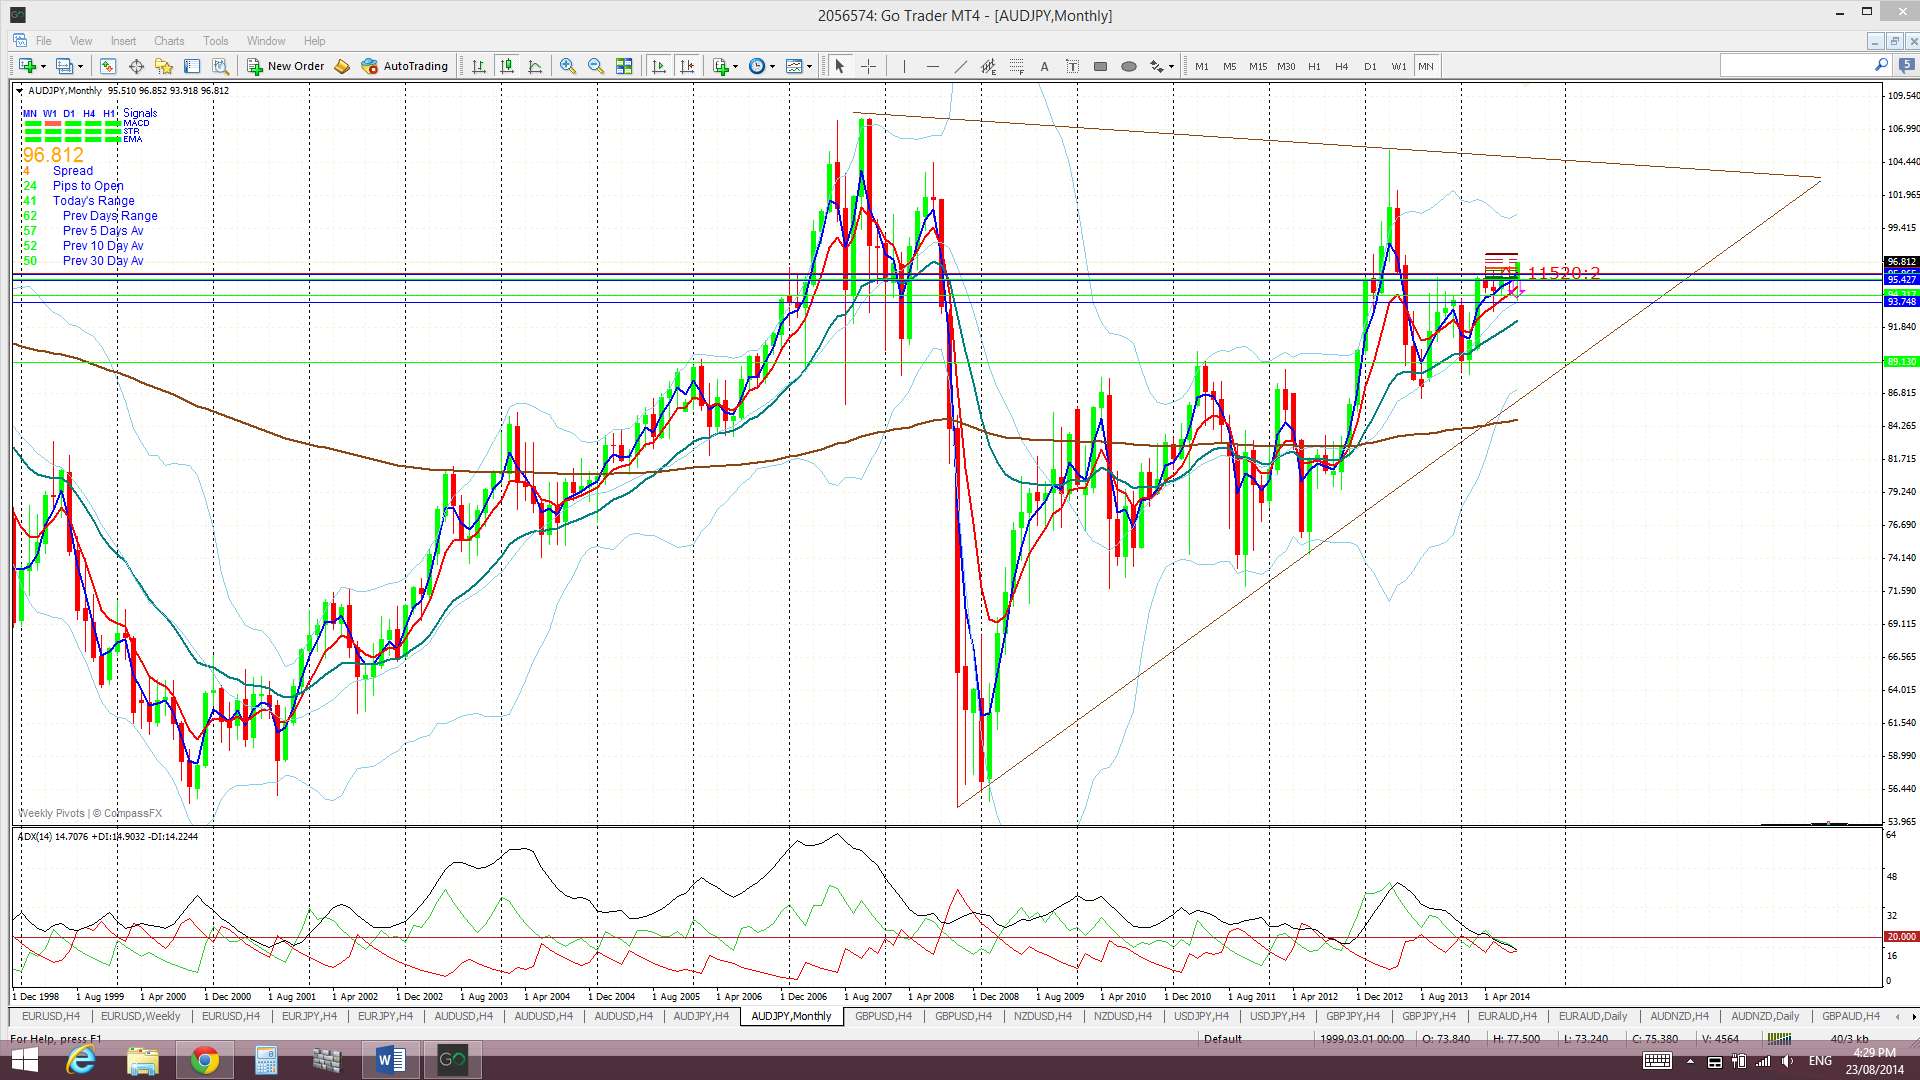
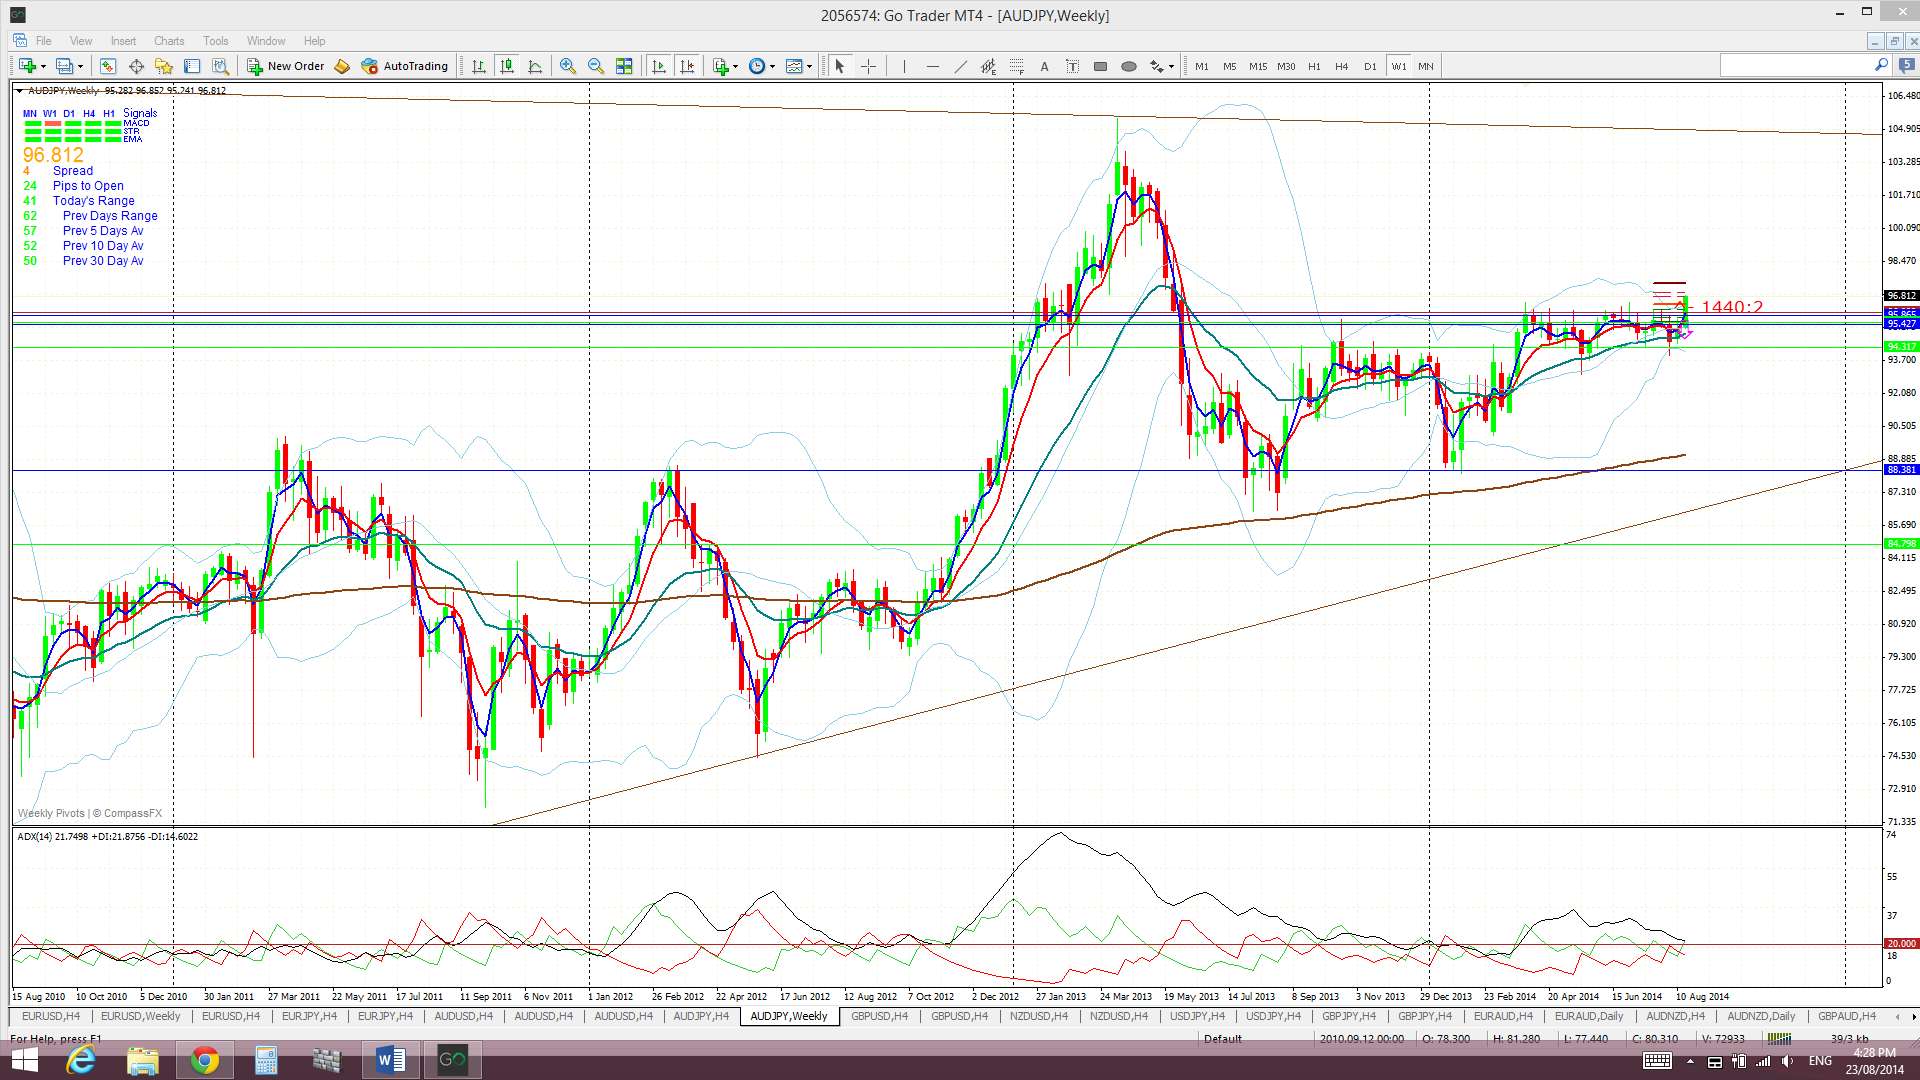
A/J: The A/J moved higher last week and this triggered a new TC signal that has delivered up to 110 pips. This bullish move also resulted in the A/J moving back above the key 96 S/R level. The weekly close above this level is quite bullish and the monthly chart reveals the significance of this 96 level.
Price is now trading above the Cloud on the 4hr, daily, weekly and monthly charts which is a significant bullish development.
The weekly candle closed as a bullish candle.
- There is an open TC signal on this pair.


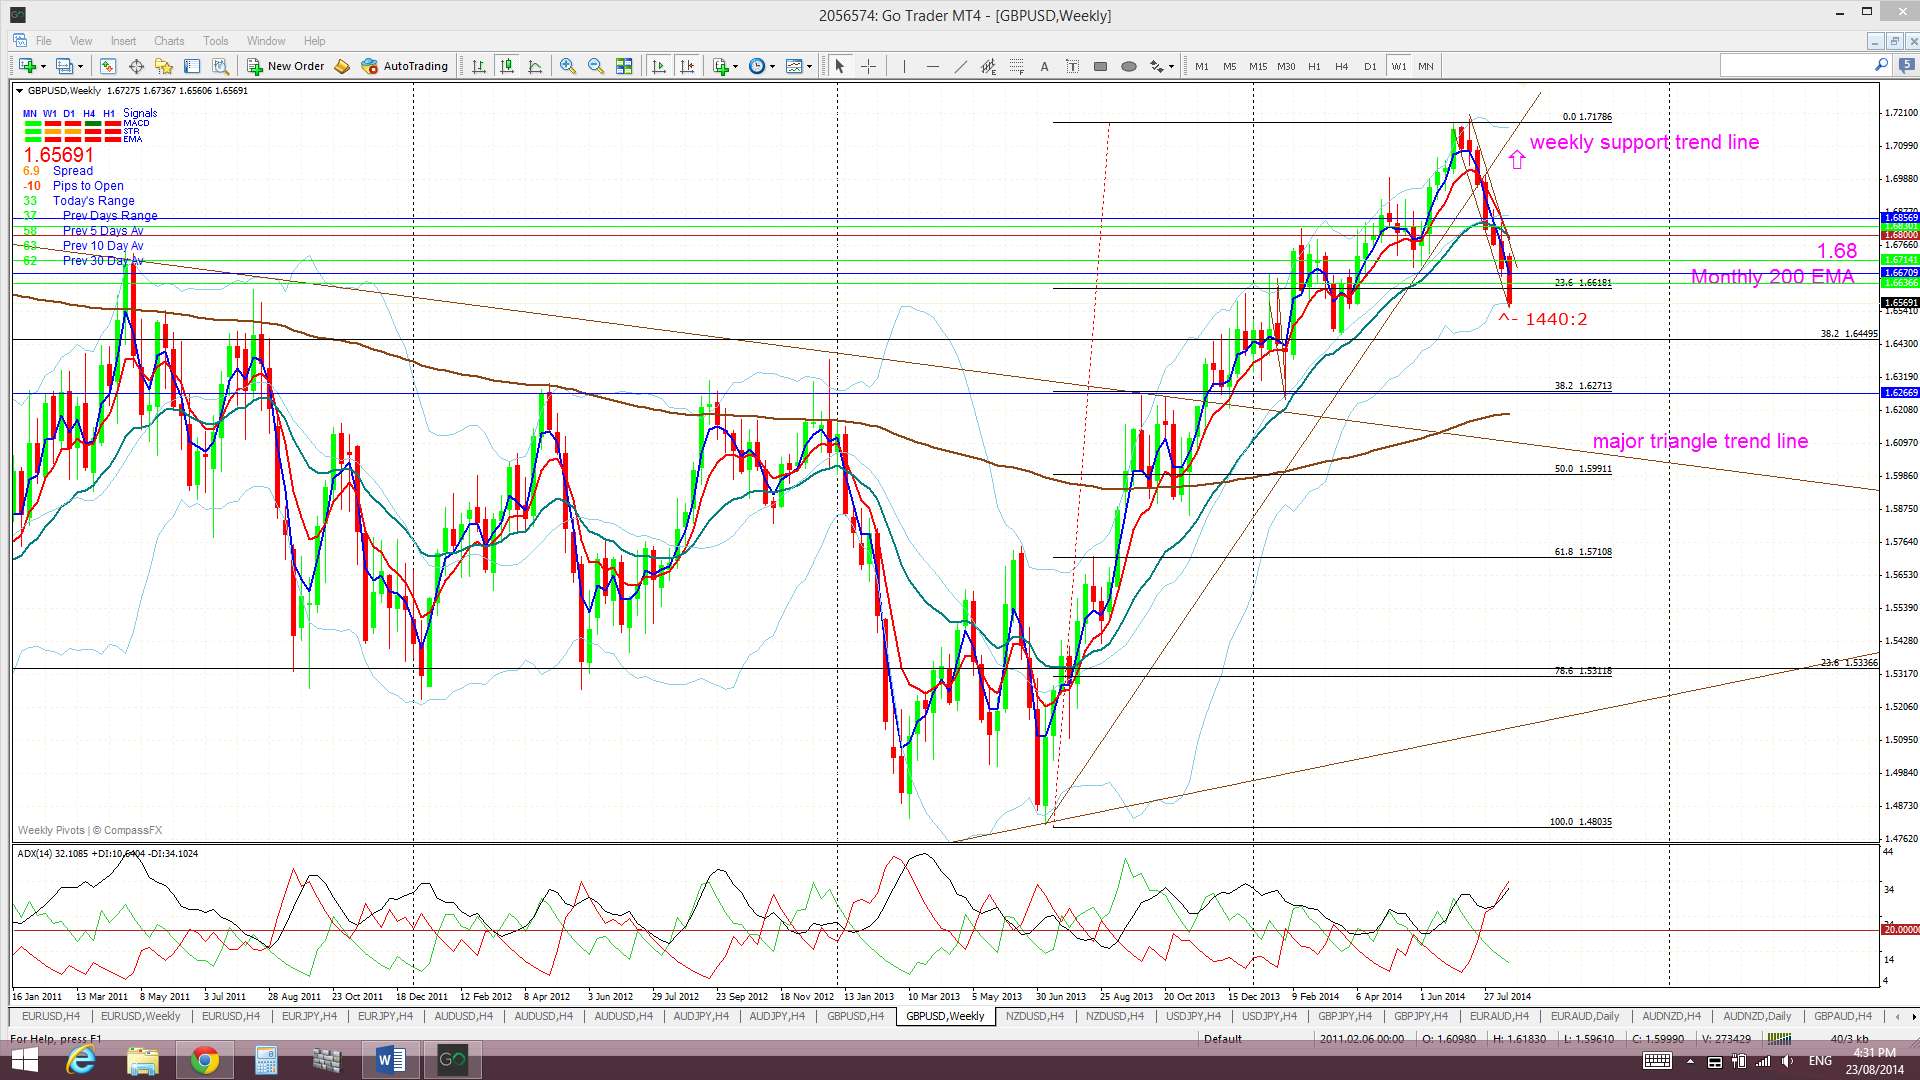
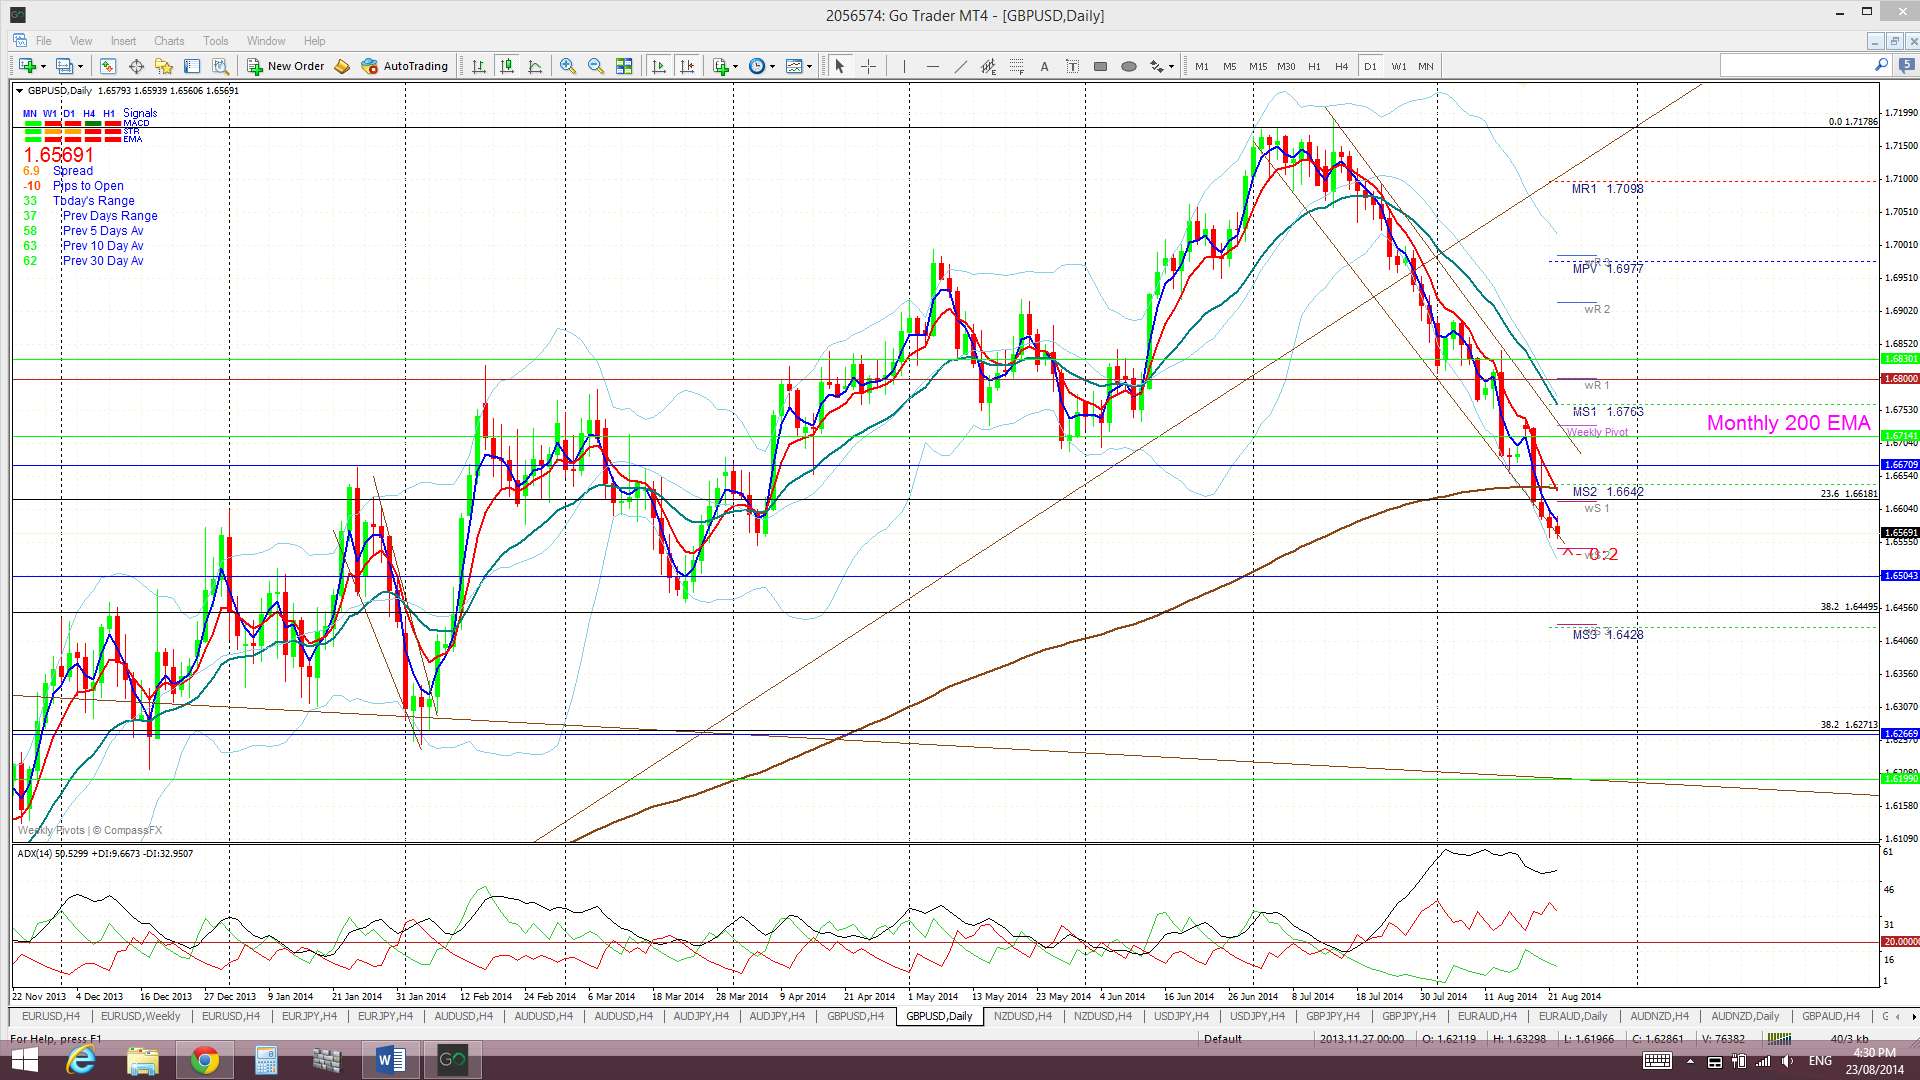
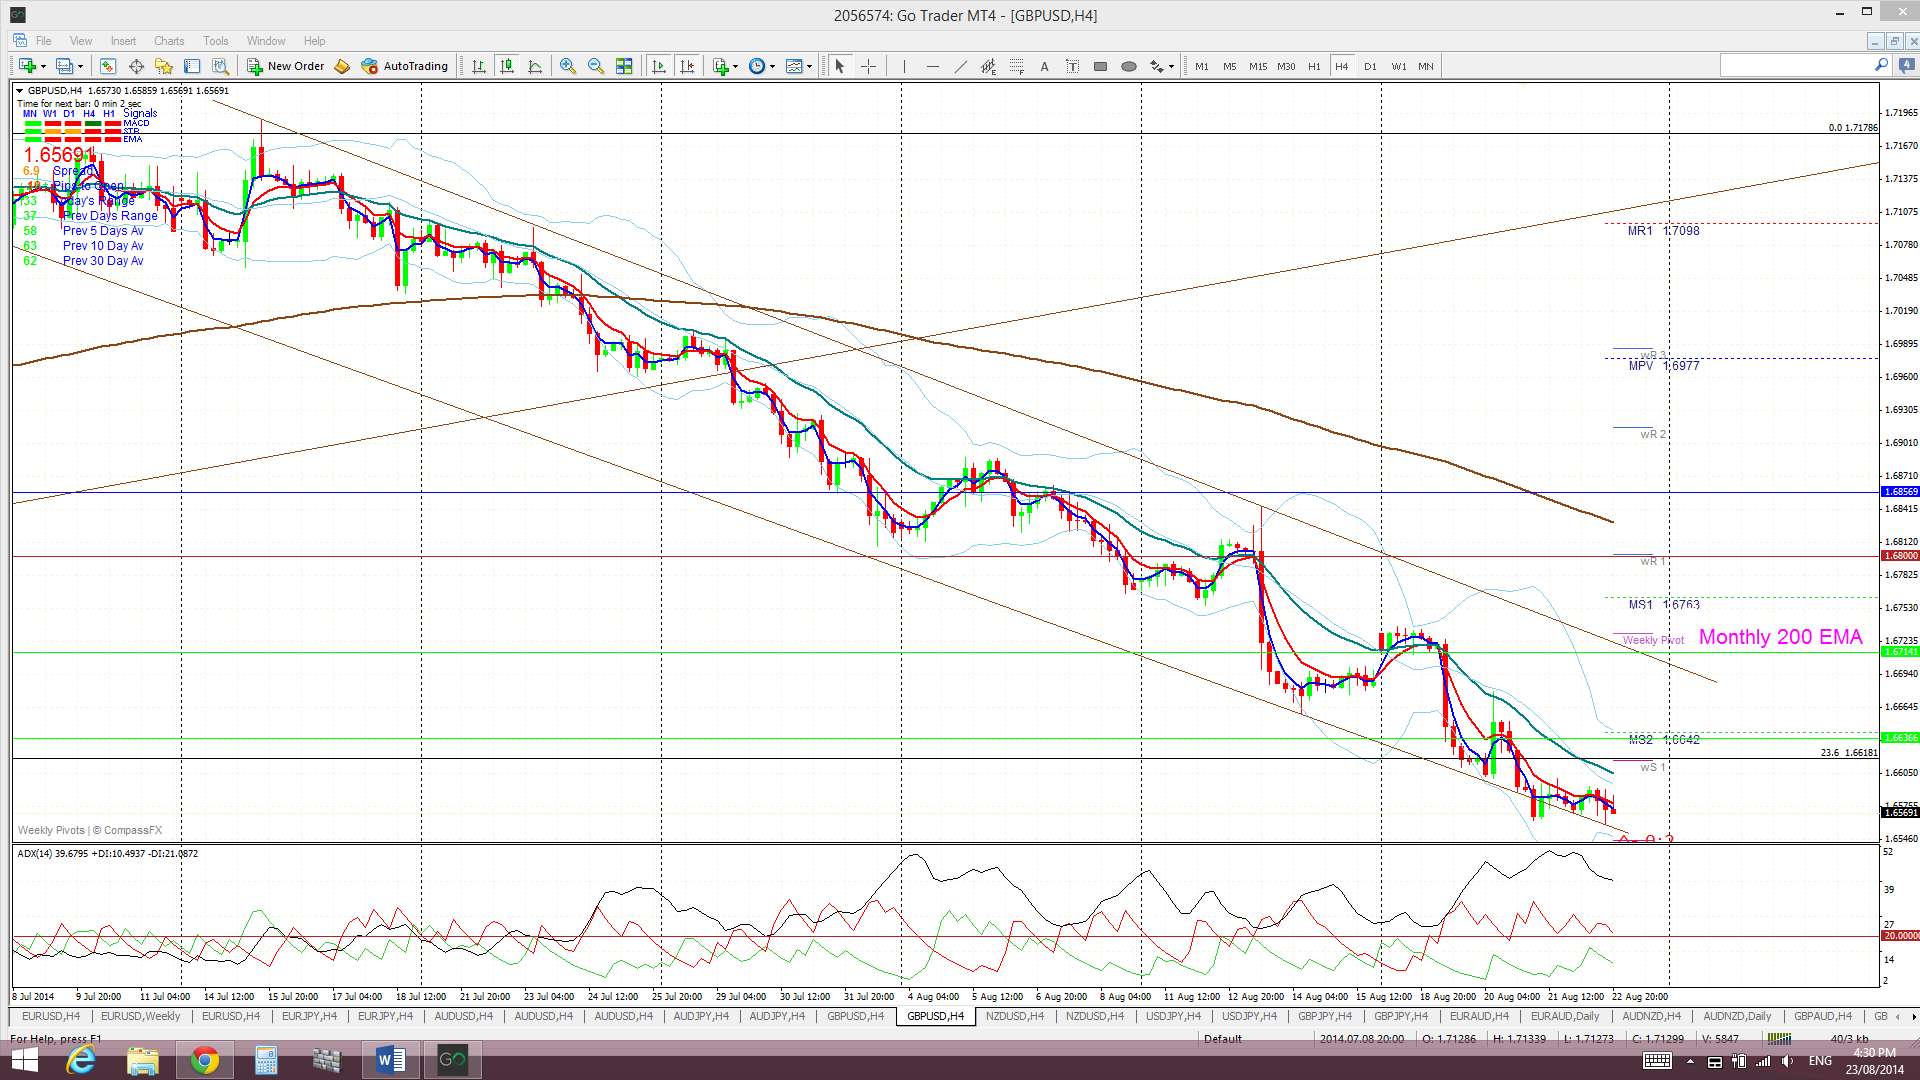
G/U: The Cable tried to reclaim the monthly 200 EMA at the start of the week but this effort failed. Price continued to decline from there but, apart from a short lived dip, it remained trading within the descending channel. The trading channel continues to give the weekly chart a bit of a ‘Bull Flag’ appearance.
A second weekly candle close and hold below the weekly support trend line, the 1.68 level and the monthly 200 EMA suggests that a deeper pull back may be in store here though. Possible targets still include:
- The weekly 200 EMA, just below the 38.2 % fib of the recent bull move (360 pips away).
- The monthly chart’s previously broken trend line ( 470 pips away)
- The 1.6 region. This is near the 50% fib of the recent bull move (550 pips away)
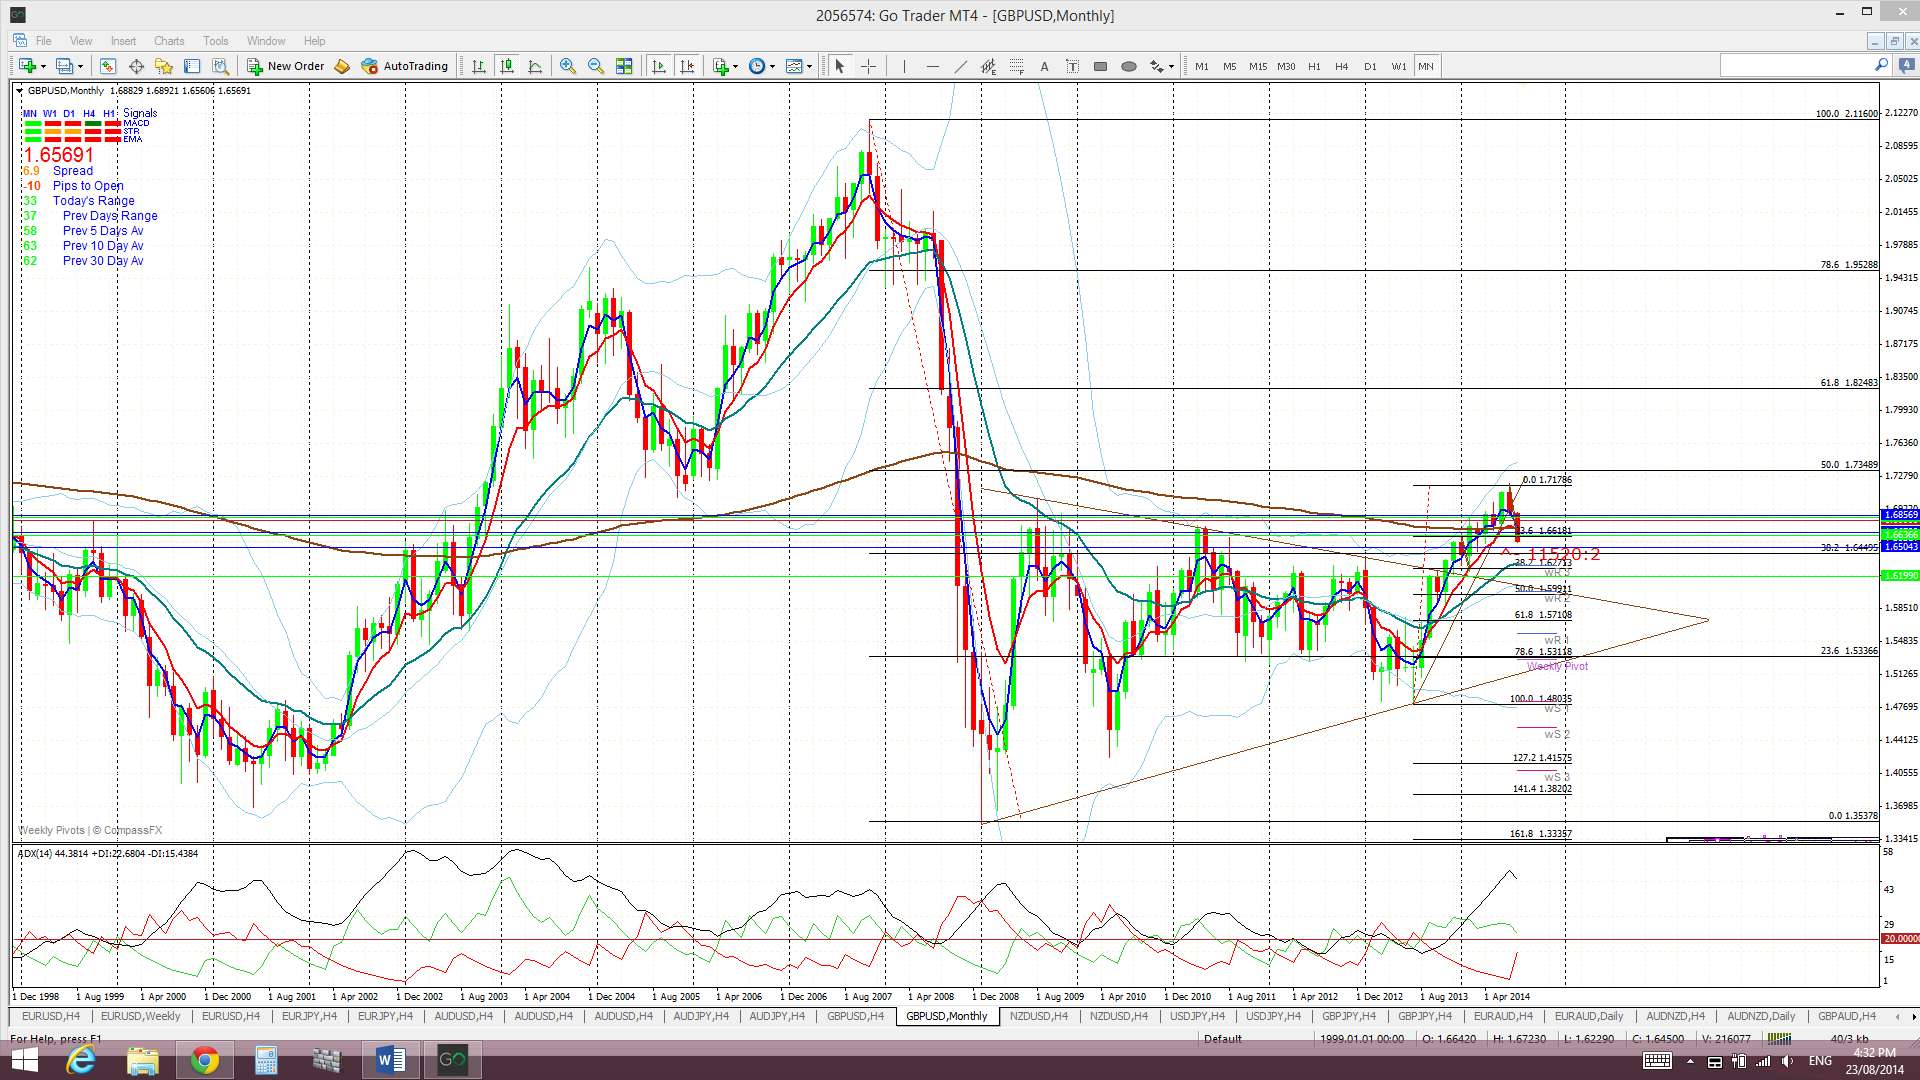
Bullish targets for any return back above the monthly 200 EMA: This level remains a key level to watch here and any new move back above this level would be quite bullish. It is important to remember that February was the first monthly close above this S/R level since September 2008 and, also, the highest monthly close since the bear move of 2007-2009. These were major achievements. A possible target for any continued bullish movement is best determined from the monthly chart. The 50 % fib level of the 2007-2009 bear move is up at around the 1.73 region and the 61.8 % fib is at the 1.82 region. Both of these levels might be possible profit targets. The 61.8% fib level is now about 1,700 pips away.
Price is still trading below the Cloud on the 4hr and daily chart, above the Cloud on the weekly and near the top edge of the Cloud on the monthly chart. The weekly Cloud chart looks rather interesting though and I’ll be watching to see if this Cloud mass offers any support to the Cable. The Cloud is bullish, rather broad and sloping upwards and so may offer some decent support. The top of the weekly Cloud kicks in at around the 1.63 level and this is a significant S/R level in itself which can be seen from a condensed view of the weekly chart:
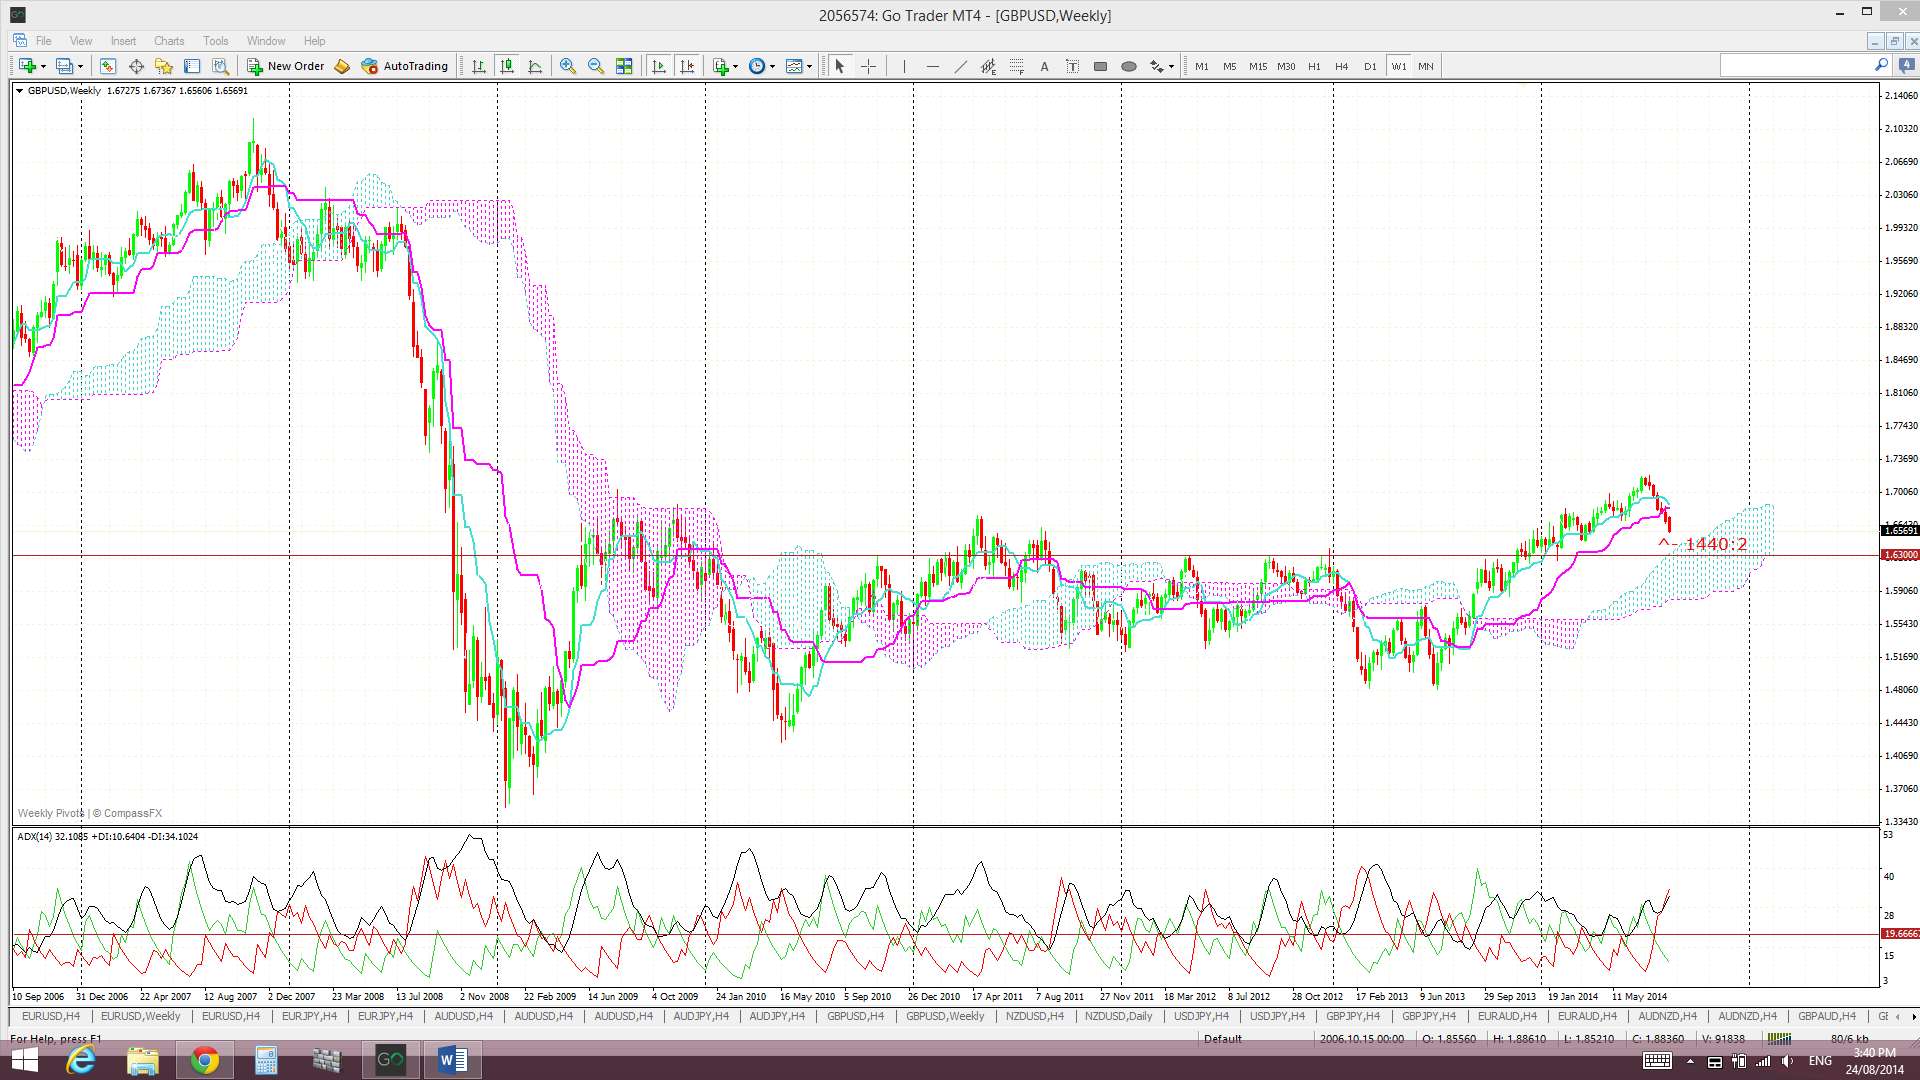
The weekly candle closed as a large bearish candle.
- I’m watching for any new TC signal on this pair, the monthly 200 EMA and the top of the weekly Cloud.
GBP/JPY: The GBP/JPY chopped higher last week but was capped by the 4hr and monthly 200 EMAs.
I am still seeing a bearish ascending wedge pattern on the weekly chart that also looks like a ‘Bull Flag’ pattern on the monthly chart! Watch for any trend line breaks for further clues here.
Price is now trading above the Ichimoku Cloud on the 4hr chart, below on the daily chart but above the Cloud on the weekly and monthly charts.
The weekly candle closed as a bullish candle and this was the first bullish Cloud after 6 bearish weeks.
I’m watching for any new TC signal on this pair, the 173 level and the monthly 200 EMA.
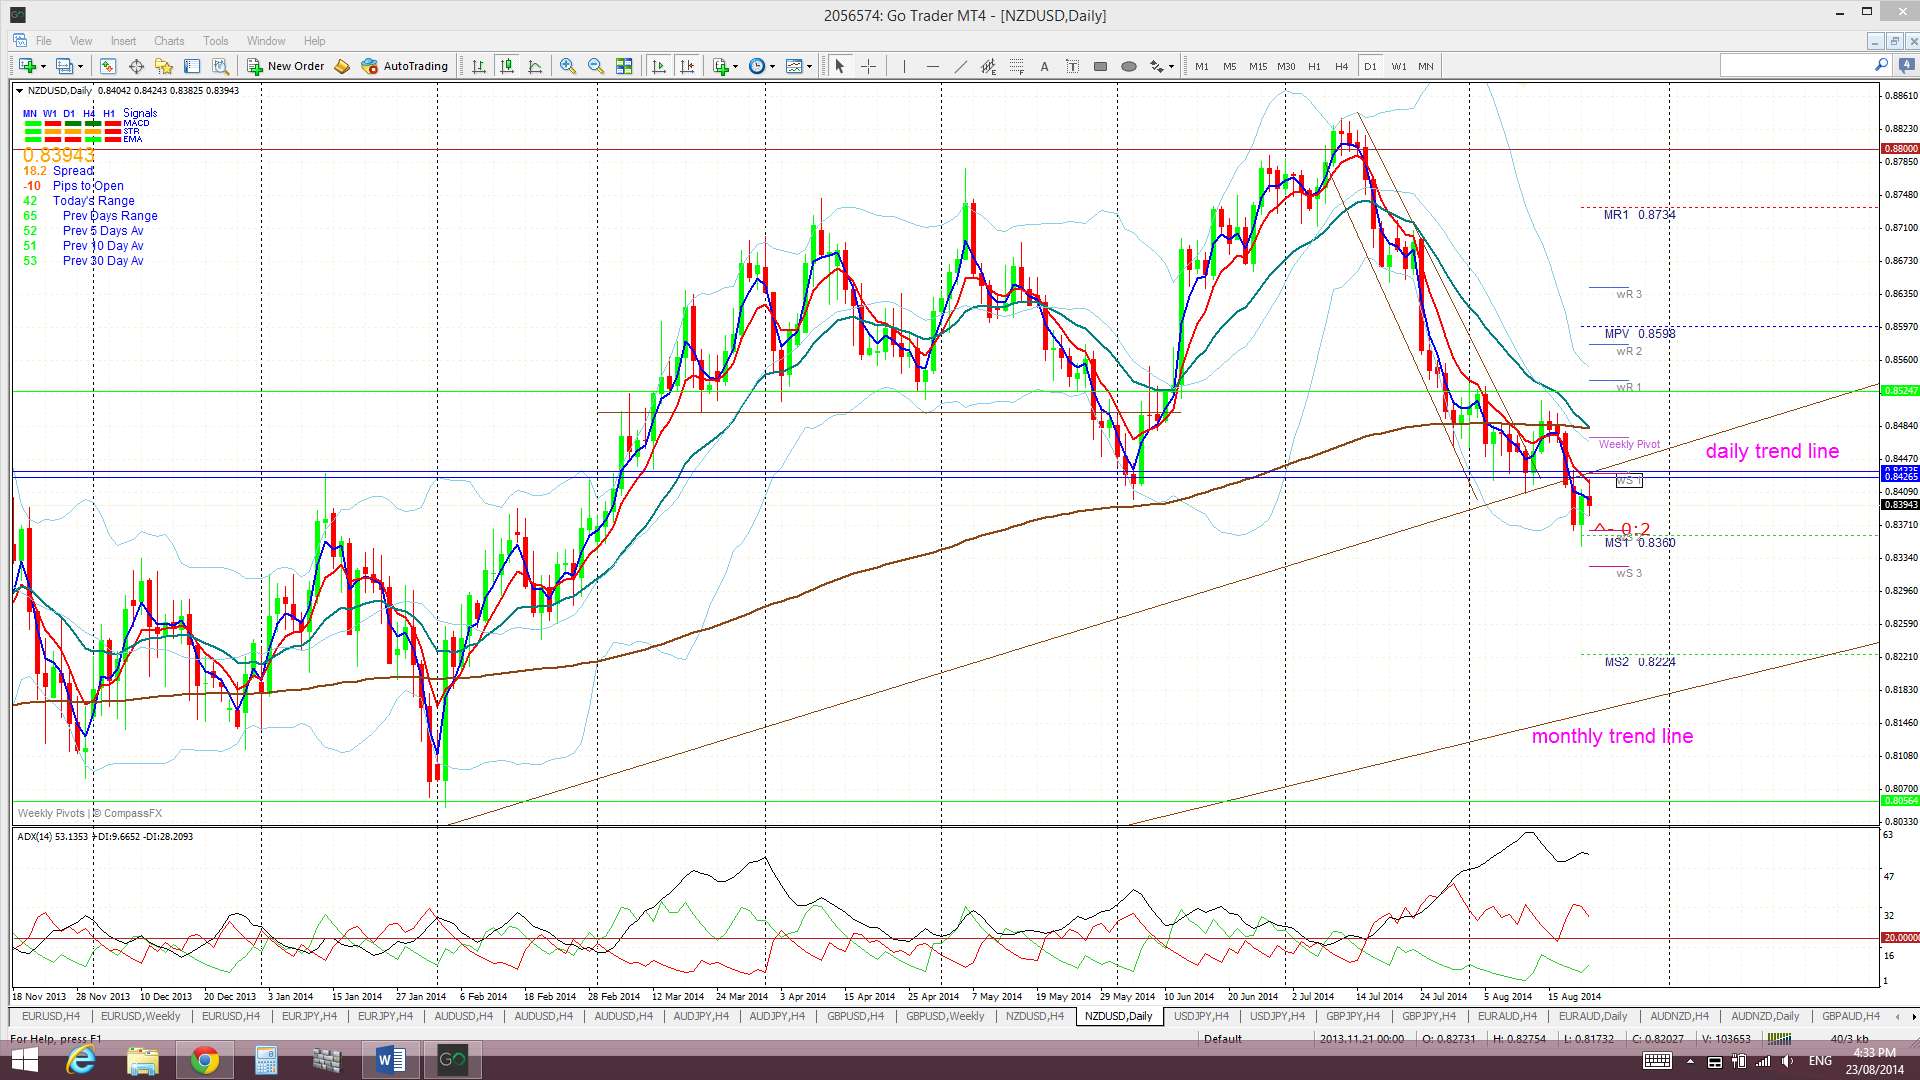
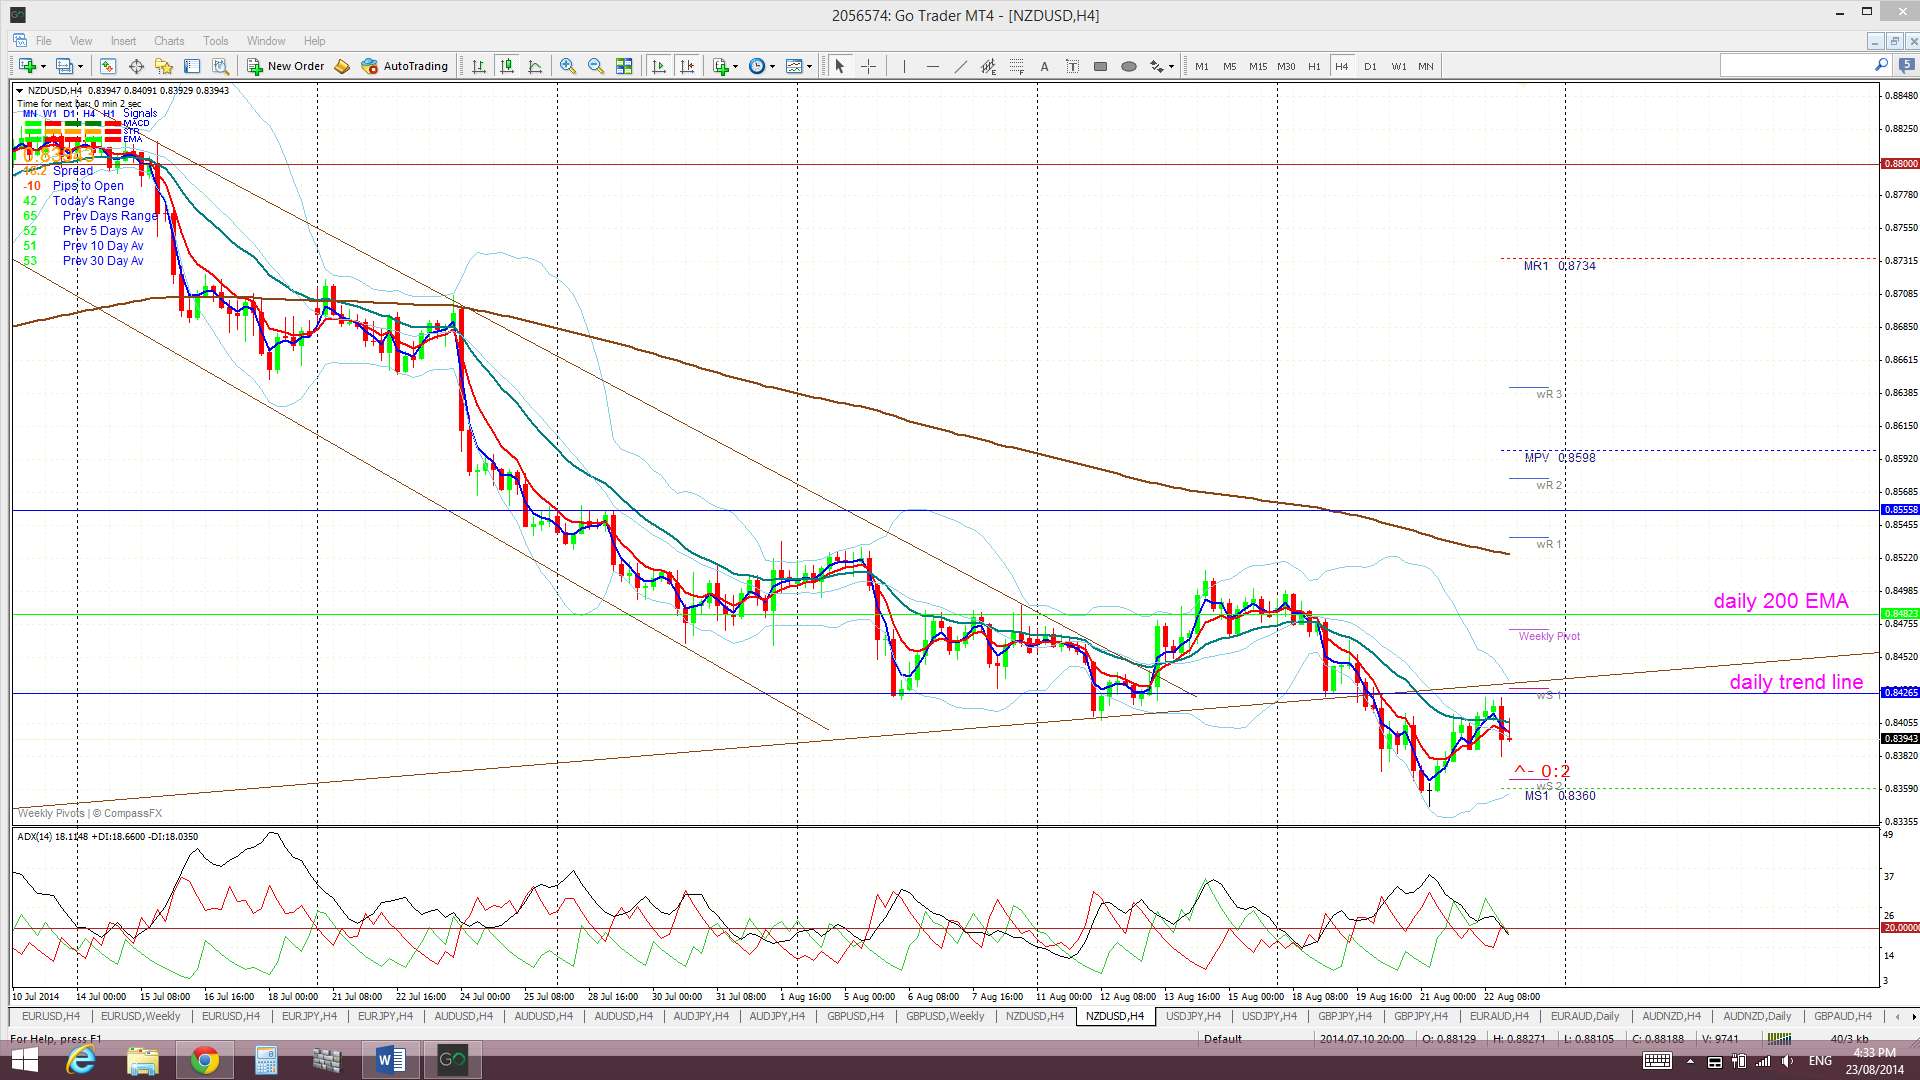
Kiwi: NZD/USD: The Kiwi drifted lower last week and fell through the daily support trend line. It recovered some lost ground towards the end of the week but couldn’t manage to close back above this support trend line.
The failure to hold above the daily support trend line suggests a deeper pull back to the monthly support trend line (220 pips away) might be a possibility here.
Price is now trading below the Ichimoku Cloud on the 4hr and daily charts but above on the weekly and monthly charts.
The weekly candle closed as a bearish engulfing candle.
- I’m watching for any new TC signal on this pair, the daily 200 EMA and the daily support trend line.


EUR/AUD: This pair drifted lower last week and I missed reading a valid TC signal. I would prefer to wait for any wedge breakout that occurs WITH momentum though anyway.
I’m still seeing the look of a possible H&S building on the weekly chart as well and this would tie in with any bullish breakout on the E/A from the descending wedge on the daily chart.
The E/A is trading below the Cloud on the 4hr and daily charts which is bearish.
The weekly candle closed as a large bearish candle after last week’s bearish engulfing candle.
I’m watching for any new TC signal on this pair and the descending wedge trend lines.
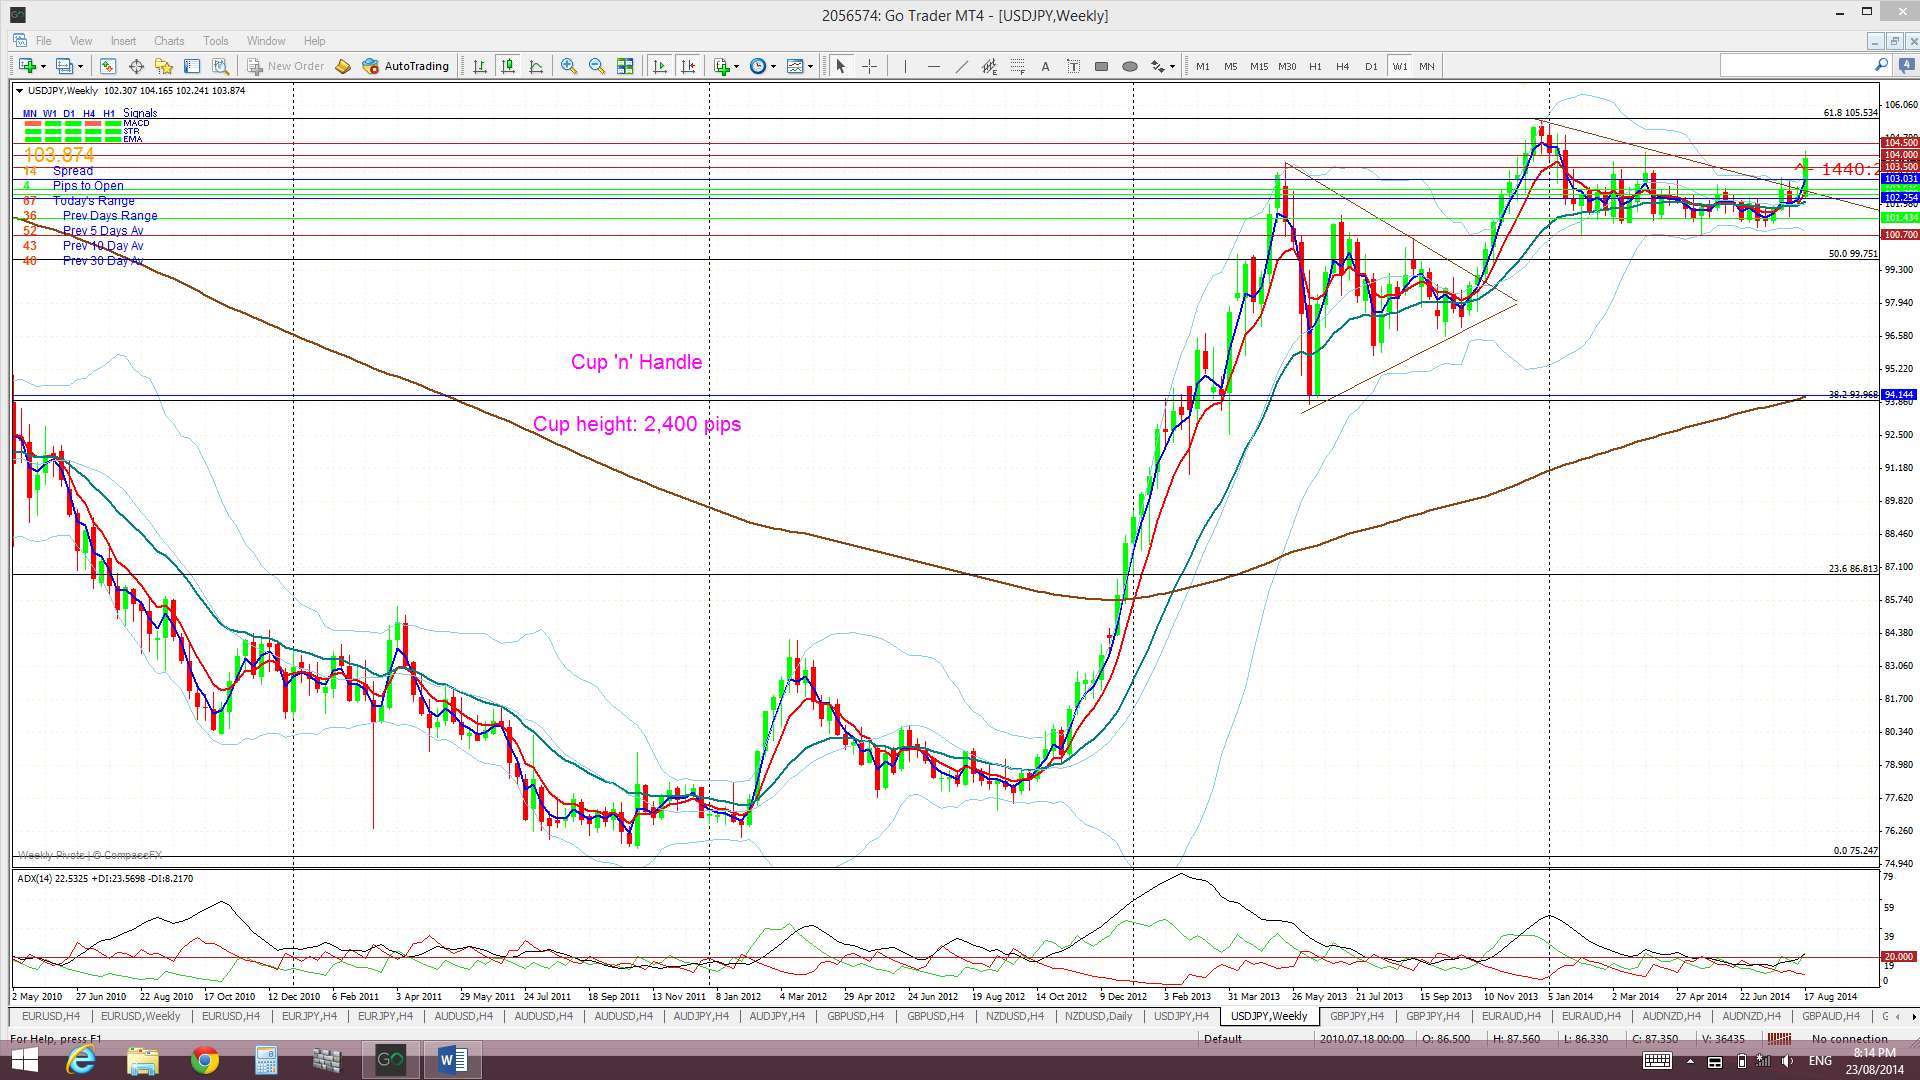
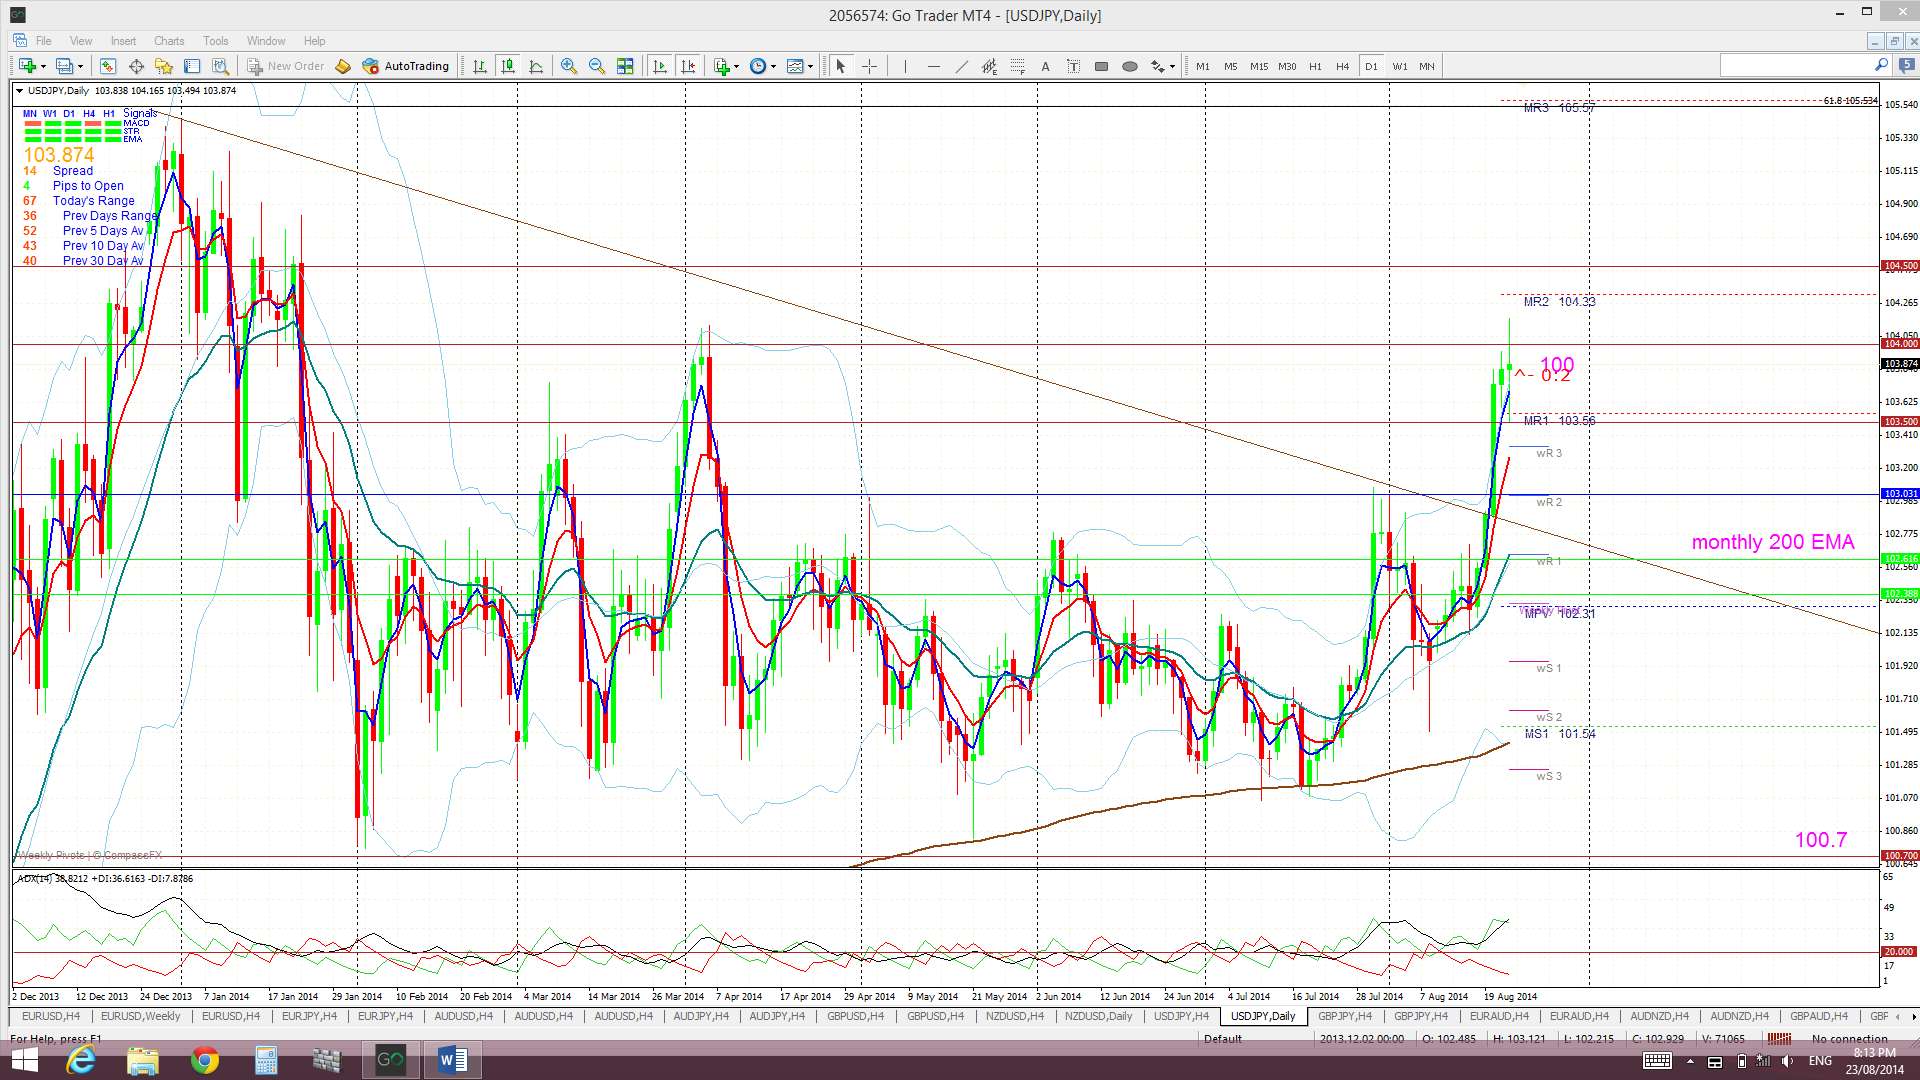
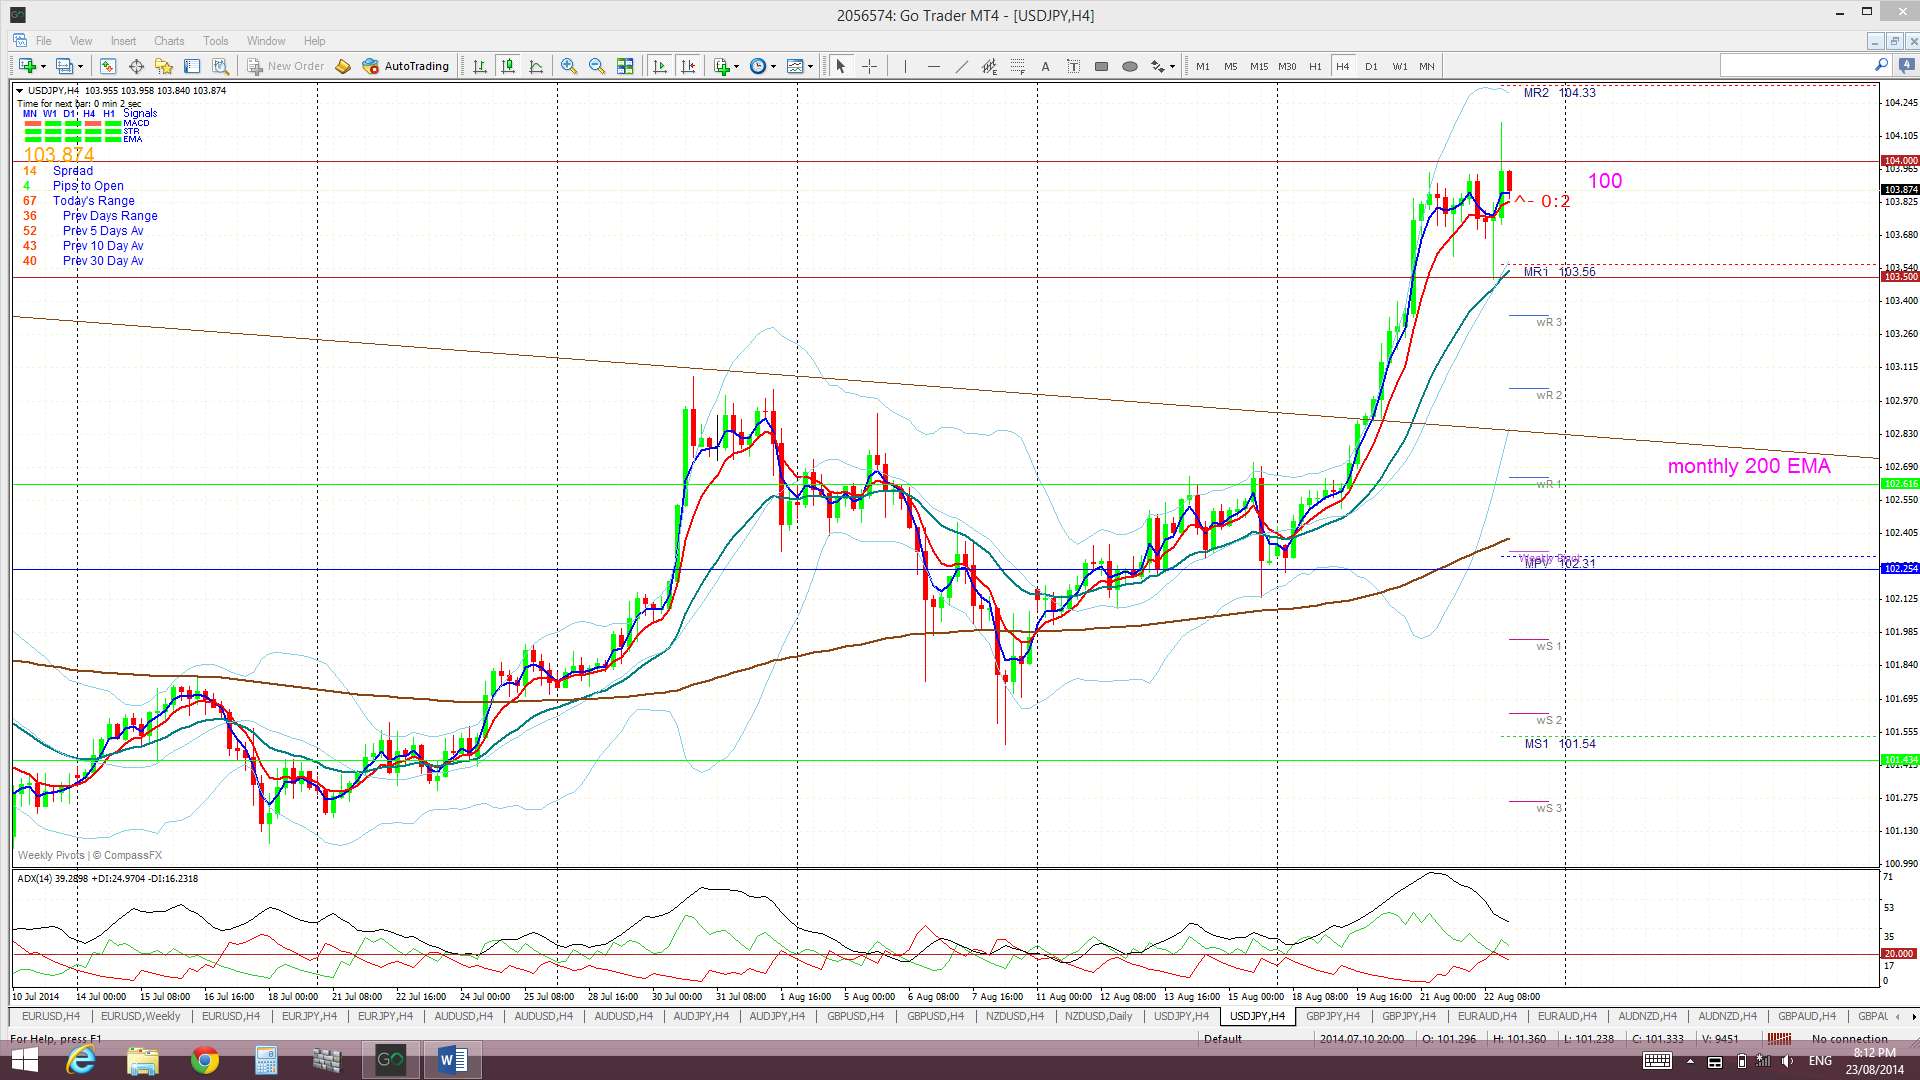
The Yen: U/J:The U/J moved higher again last week due to continuing USD strength. It finally managed to make a break and hold above the monthly 200 EMA resistance level and a breakout from the weekly chart’s triangle pattern. This move didn’t trigger any new TC signal but the triangle breakout move yielded up to 100 pips. I wrote a separate article on the U/J and this bullish move during last week and this can be found through this link.
Price is now trading above the Cloud on the 4hr, daily, weekly and monthly charts which is a significant bullish development. November was the first monthly candle close above the Ichimoku Cloud since mid-2007 and the bullish hold above the monthly Cloud continues to be noteworthy.
The weekly candle closed as a large bullish candle.
Weekly Chart Bullish Cup’ n’ Handle pattern: I am still seeing this pattern building on the weekly chart and the recent triangle breakout supports the development of this pattern. The theory behind these patterns is that the height of the ‘Cup’ pattern is equivalent to the expected bullish move from the ‘handle’ breakout. The height of the Cup for the U/J weekly chart is around 2,400 pips. The interesting point here is that a 2,400 pip bullish move up from the ‘Handle’ would put price up near the 124 level. This level is the last major swing high for the U/J from back in 2007 and represents the 100% fib pullback for the move down in 2007 to the lows of 2012. Possible targets along the way include the 61.8% fib retrace level at the 105.5 region and the 78.6% fib up near the 112 region.
The weekly chart’s ‘Bull Flag’ looks to have evolved with this latest triangle breakout.
Price stalled at the end of the week just below the 104 resistance level.
- I’m watching for any new TC signal and the 104 level.

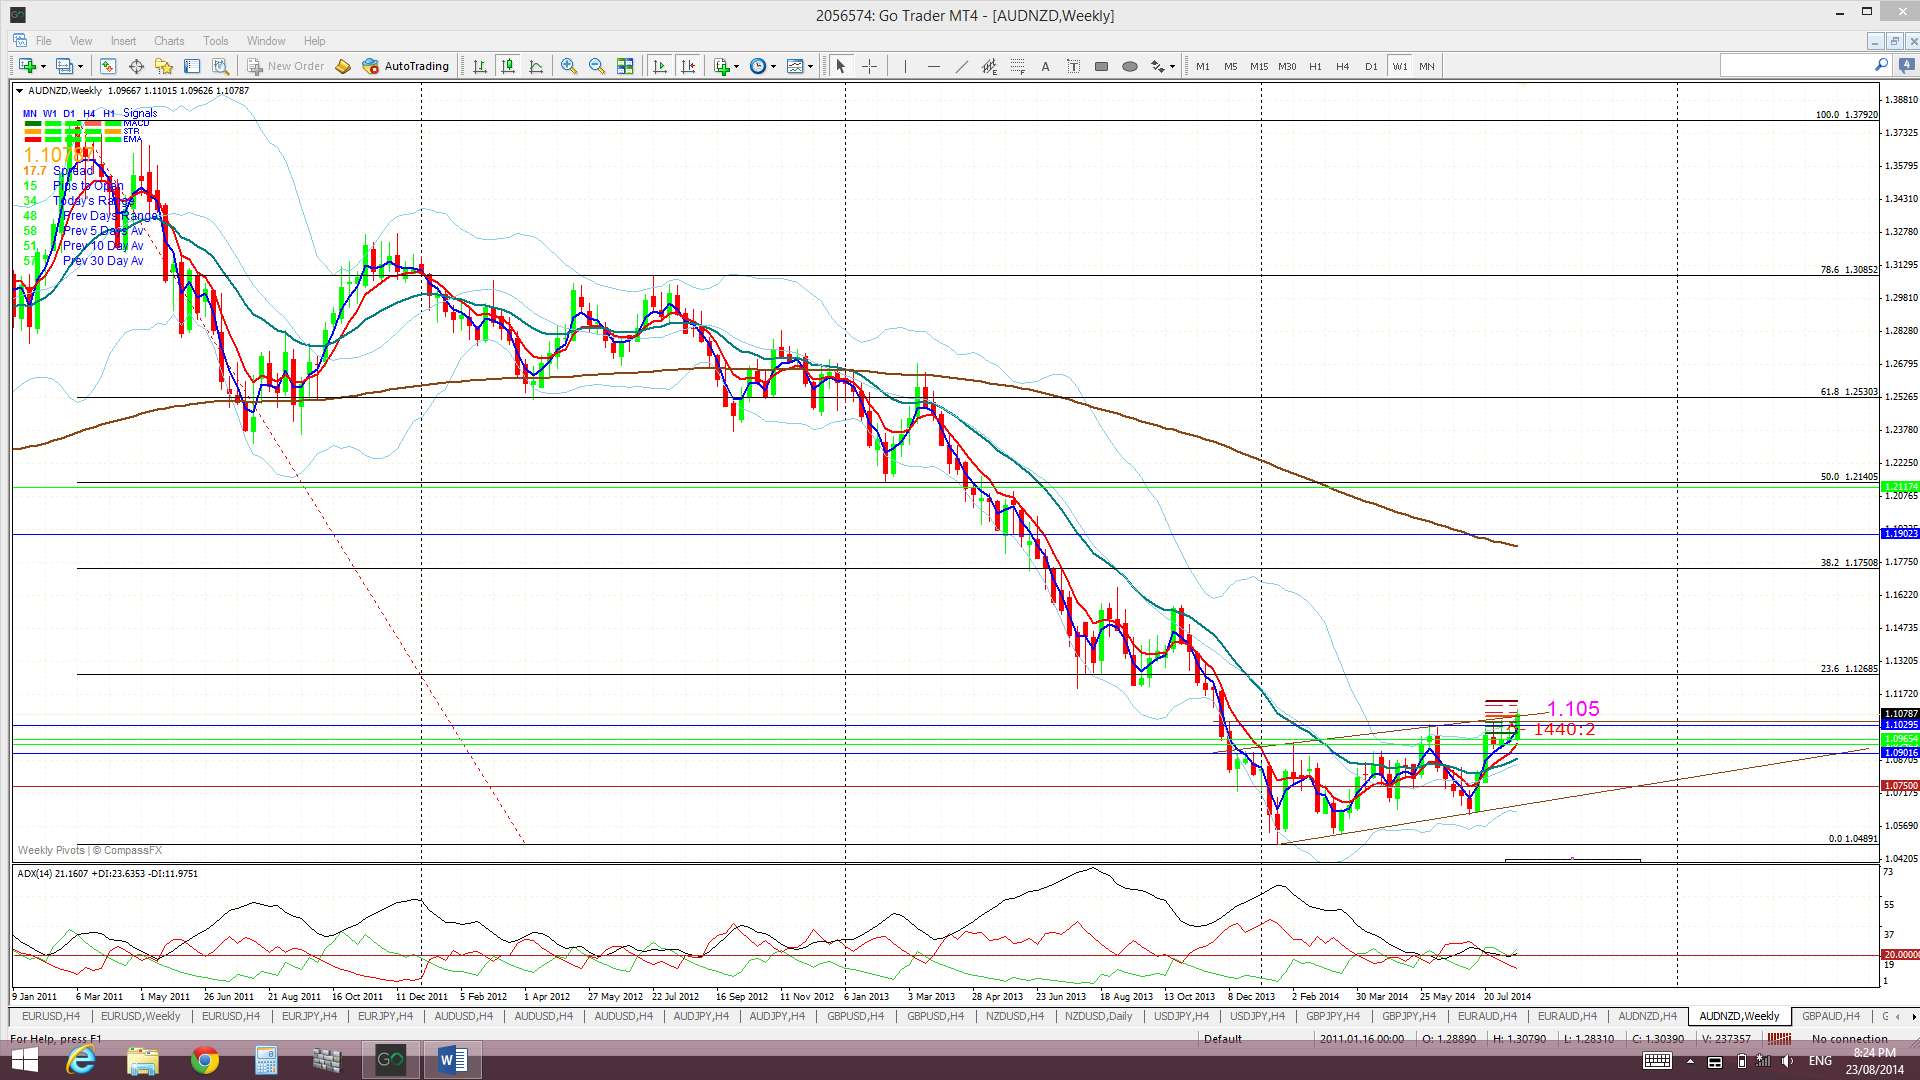
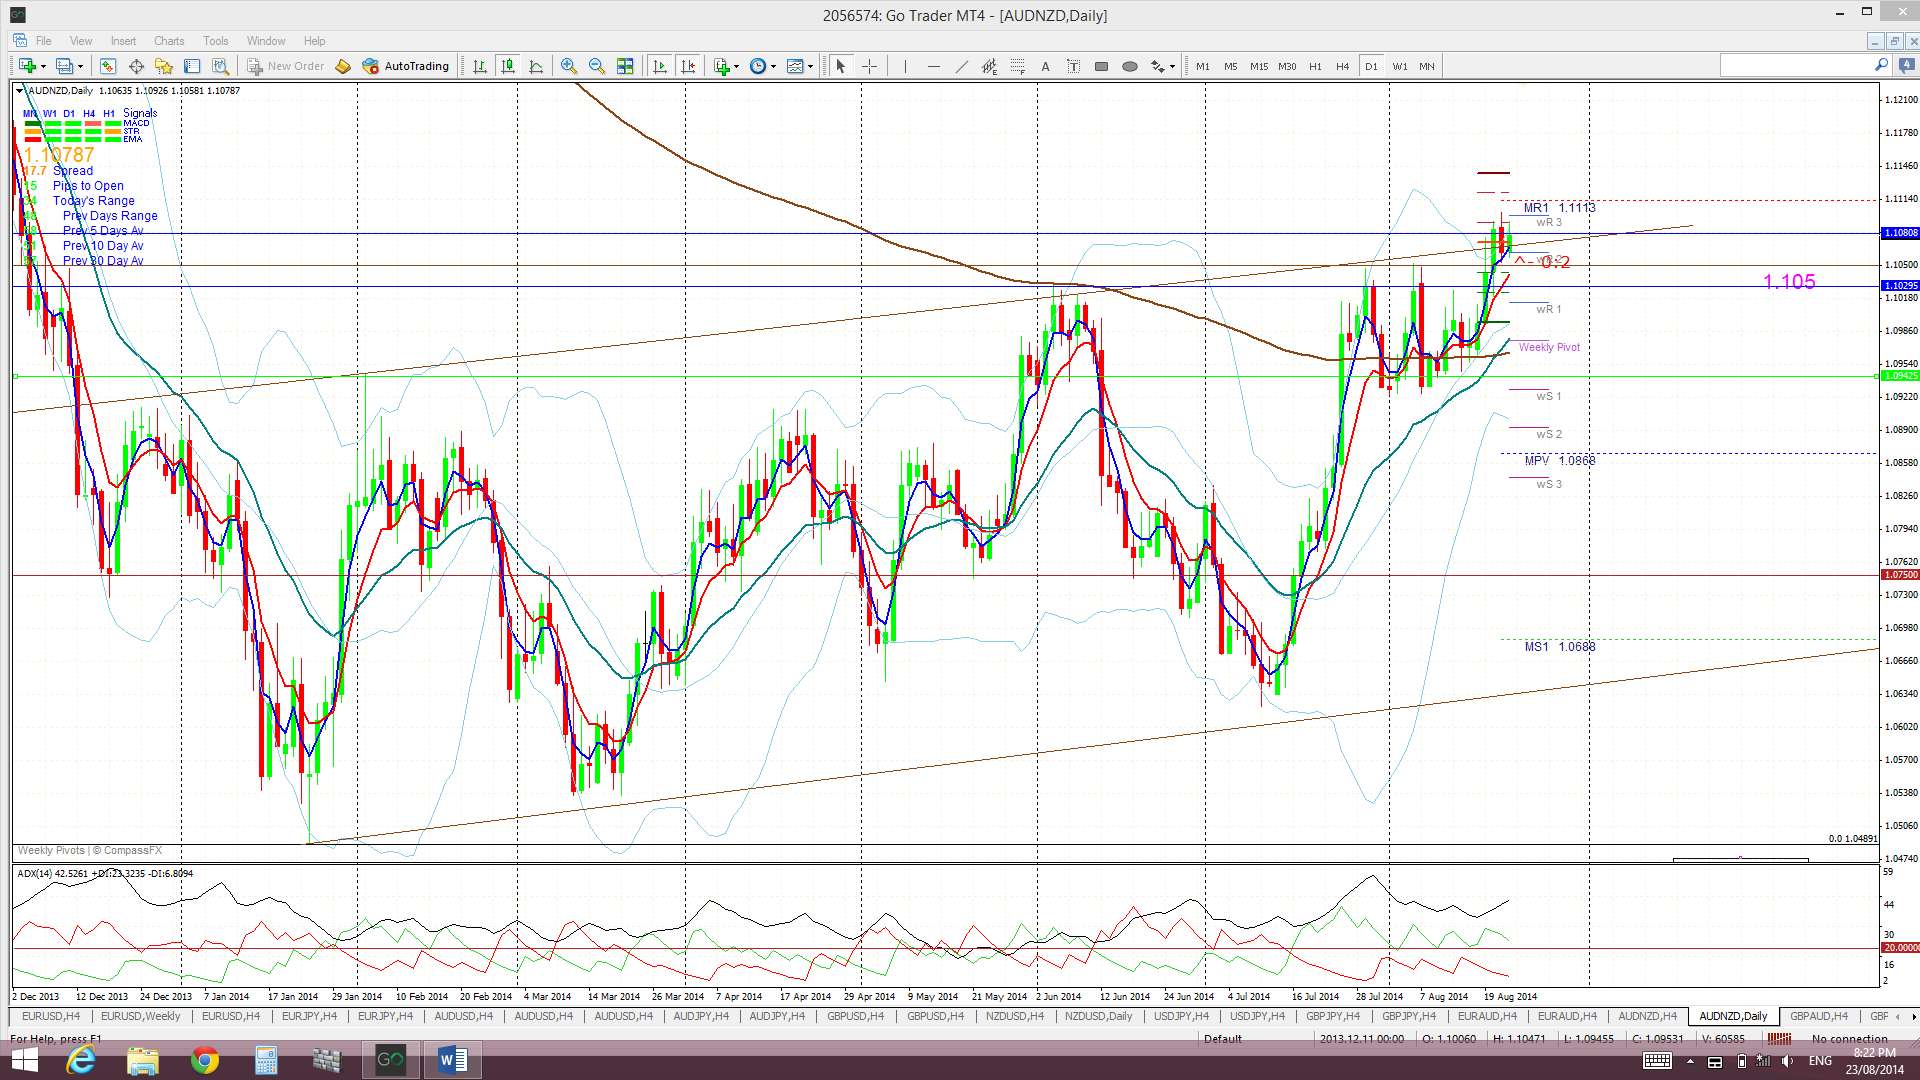
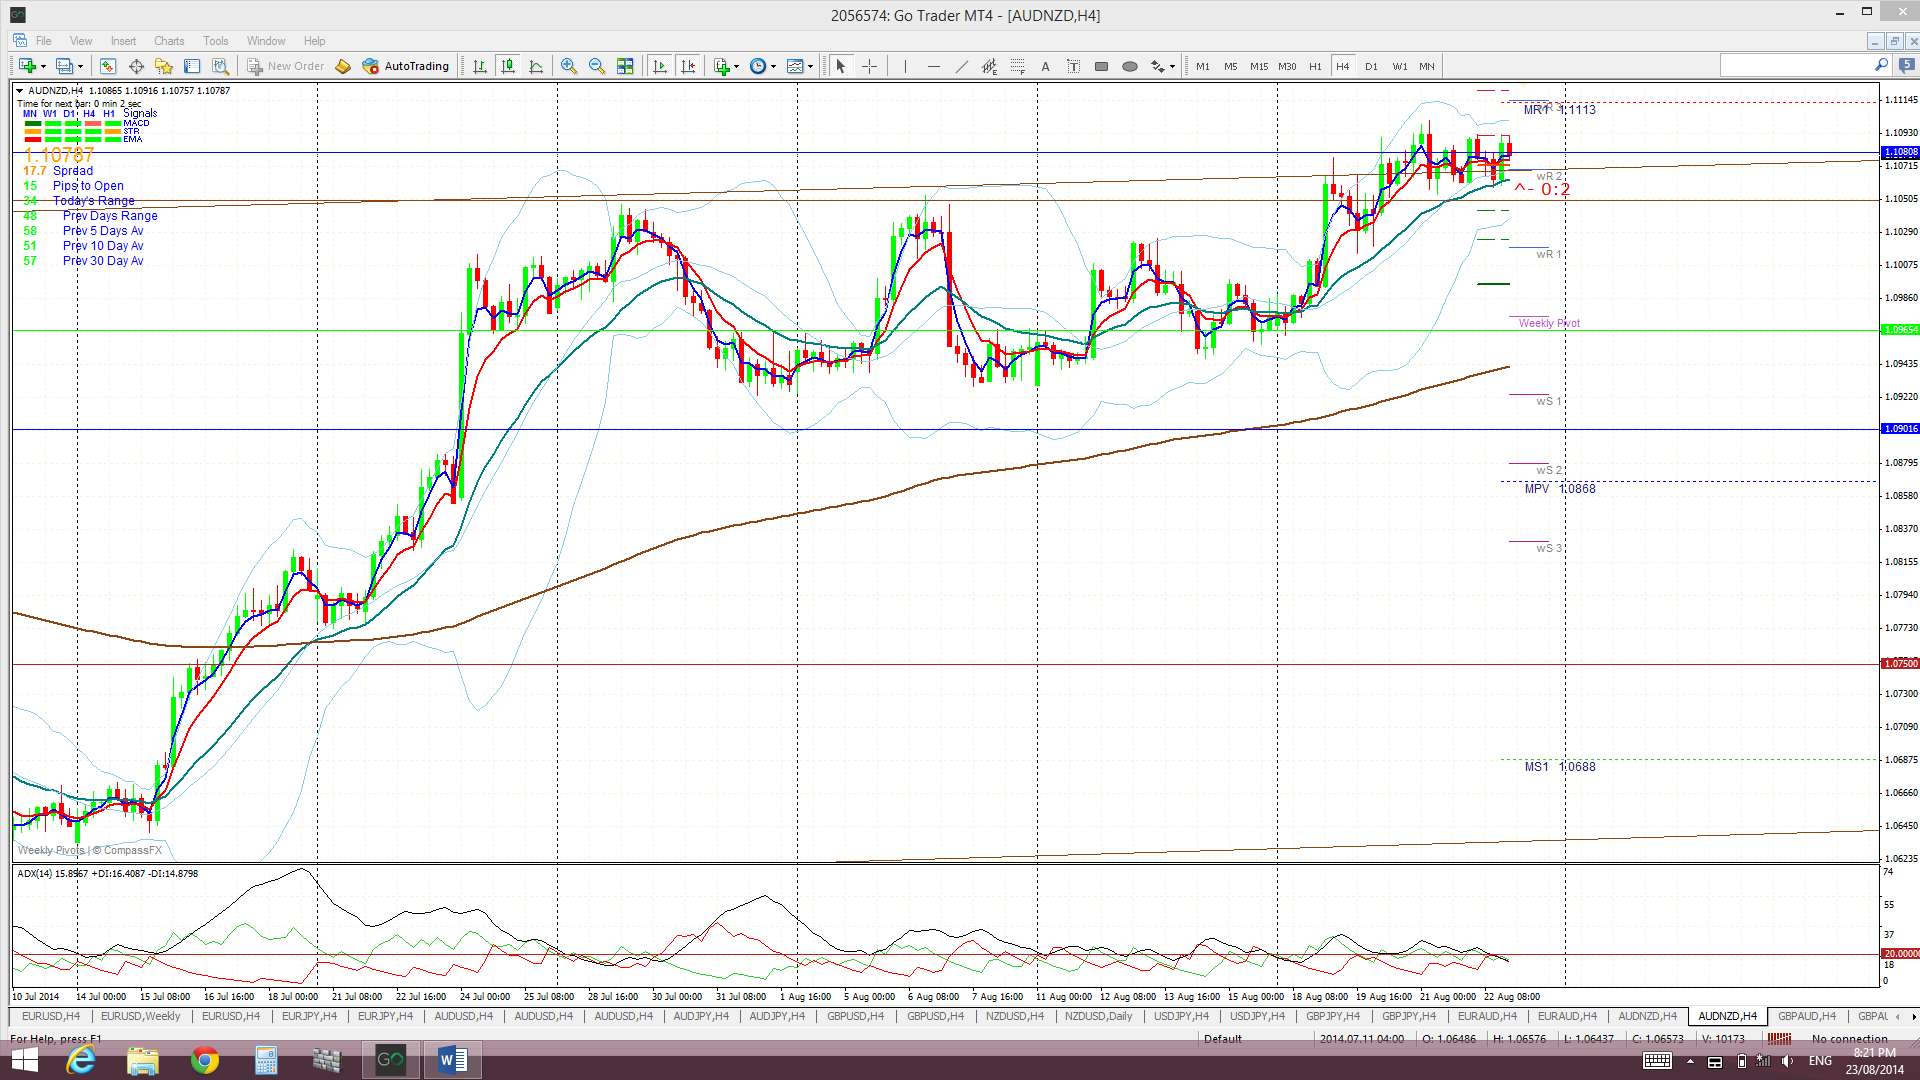
AUD/NZD: Price rallied above the 1.105 resistance level on Tuesday but chopped around just above this level for the rest of the week. I had been seeing the AUD/NZD trading in more of a bullish ascending triangle pattern with a top horizontal resistance level of 1.105 and this weekly close above the 1.105 now suggests a bullish triangle breakout.
The AUD/NZD is now trading above the Cloud on the 4hr and daily charts which is bullish. The AUD/NZD is still attempting to move up through broad weekly Cloud and so any bullish continuation move could still be a bit choppy.
The weekly candle closed as a large bullish candle.
- I’m watching for any new TC signal and the 1.105 level.

GBP/AUD: This pair attempted to close back above a broken daily support trend line but couldn’t manage to hold this level. This pair returned to chopping lower but still within the daily chart’s larger trading channel pattern.
Price is still trading below the Ichimoku Cloud on the 4hr and daily charts.
The weekly candle closed as a large bearish candle.
I’m watching for any new TC signal.
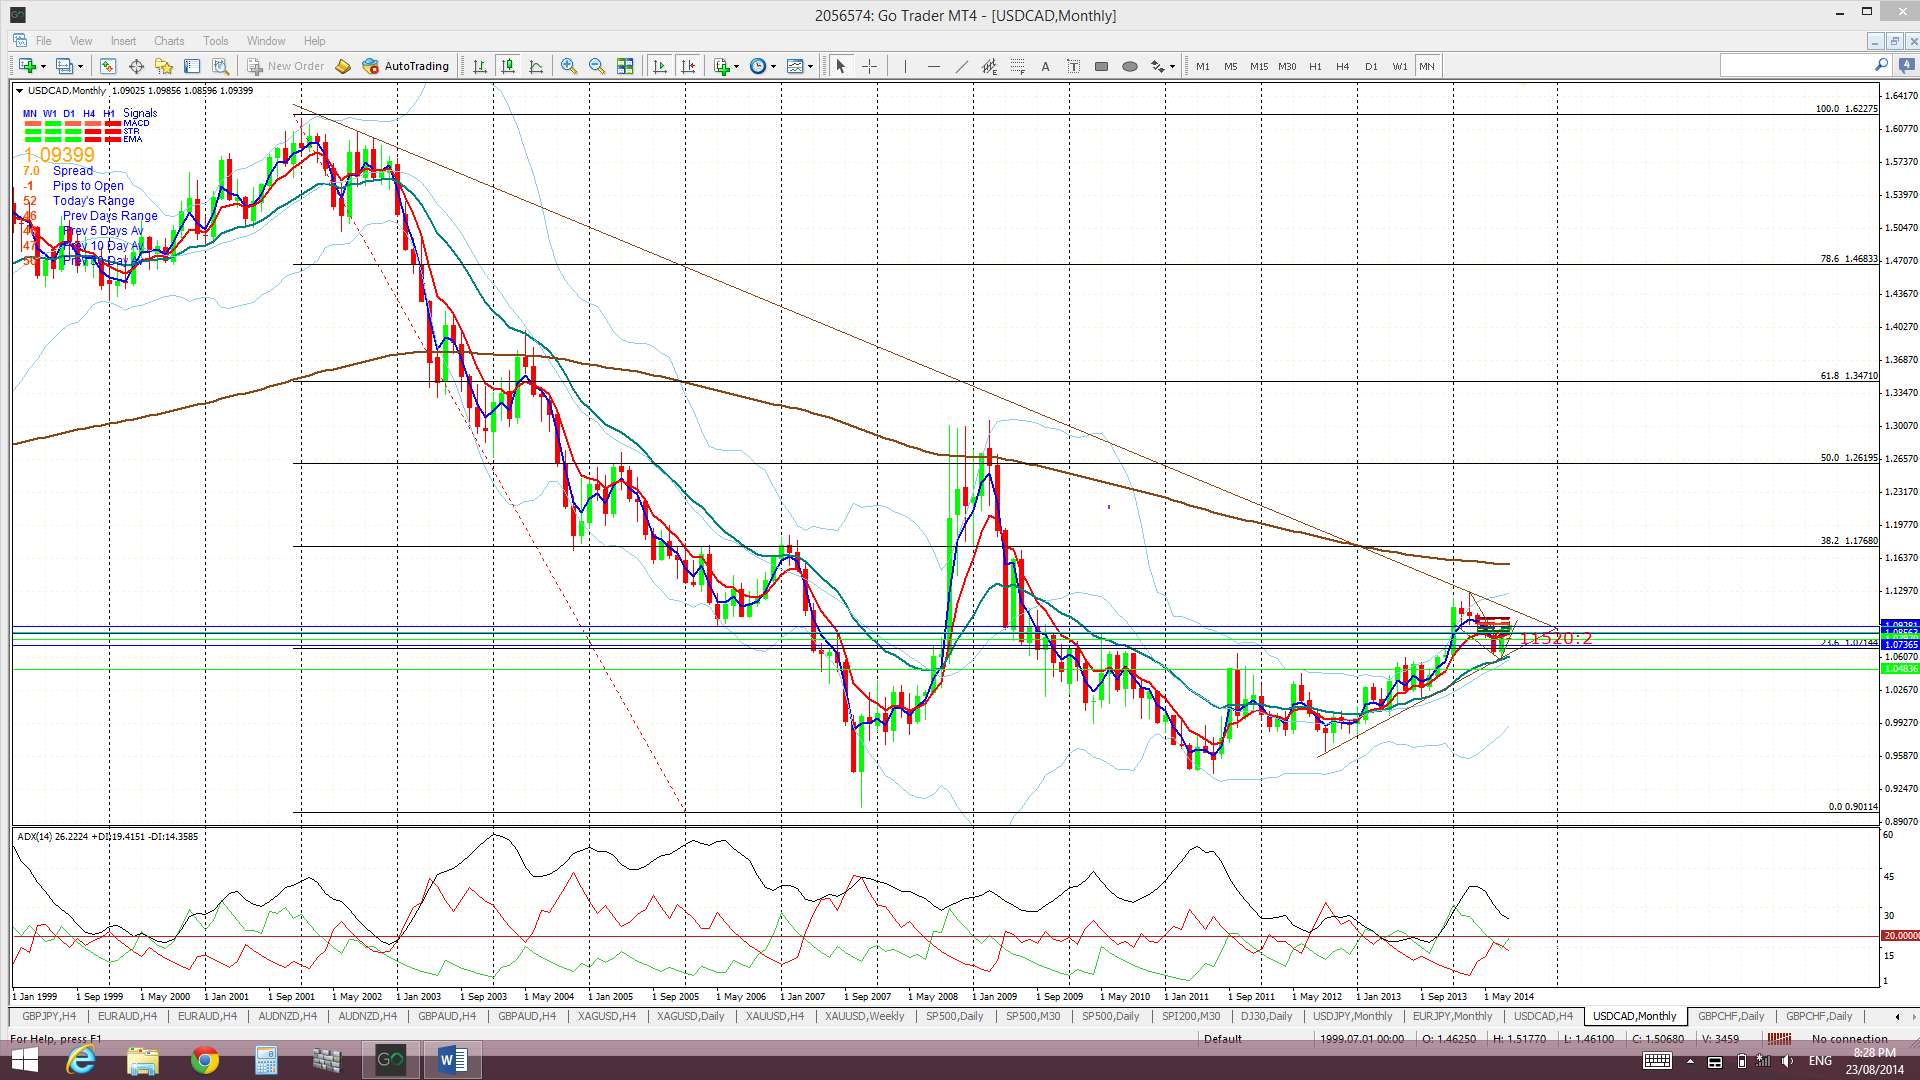
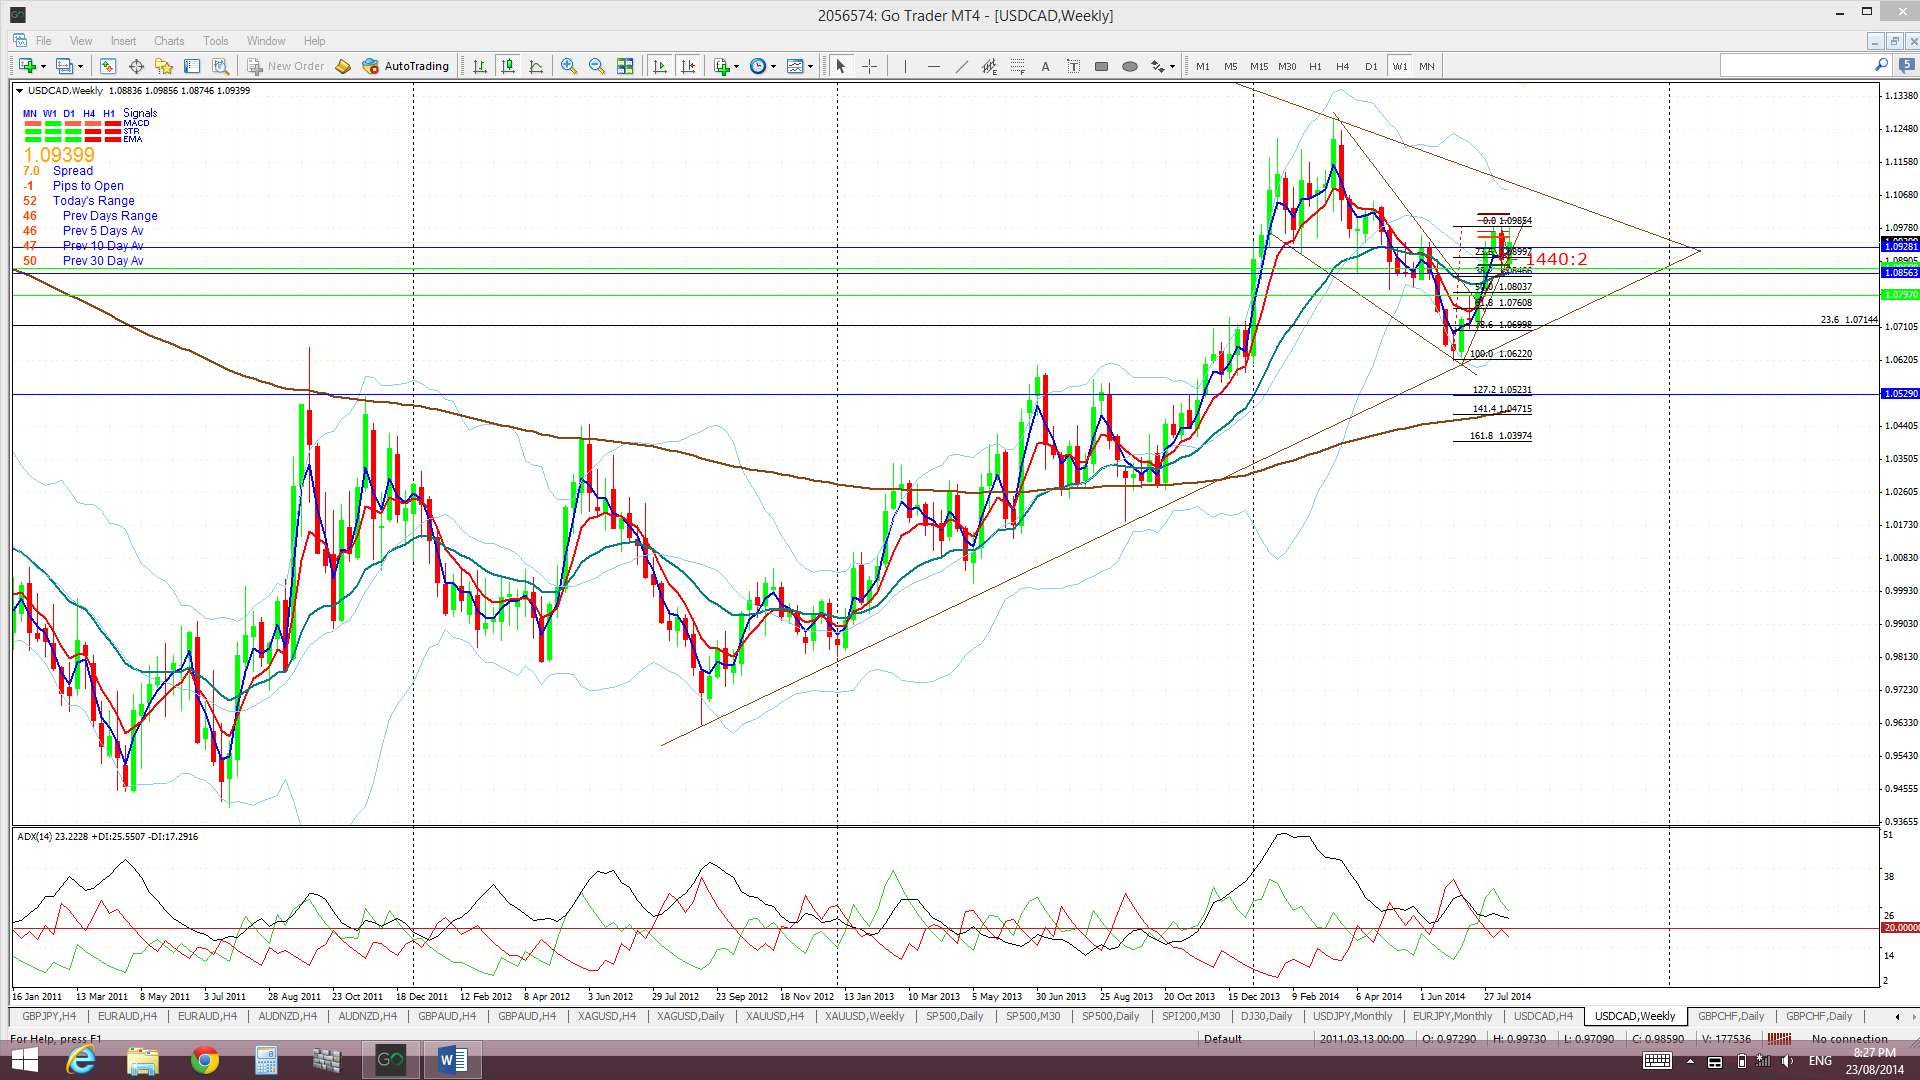
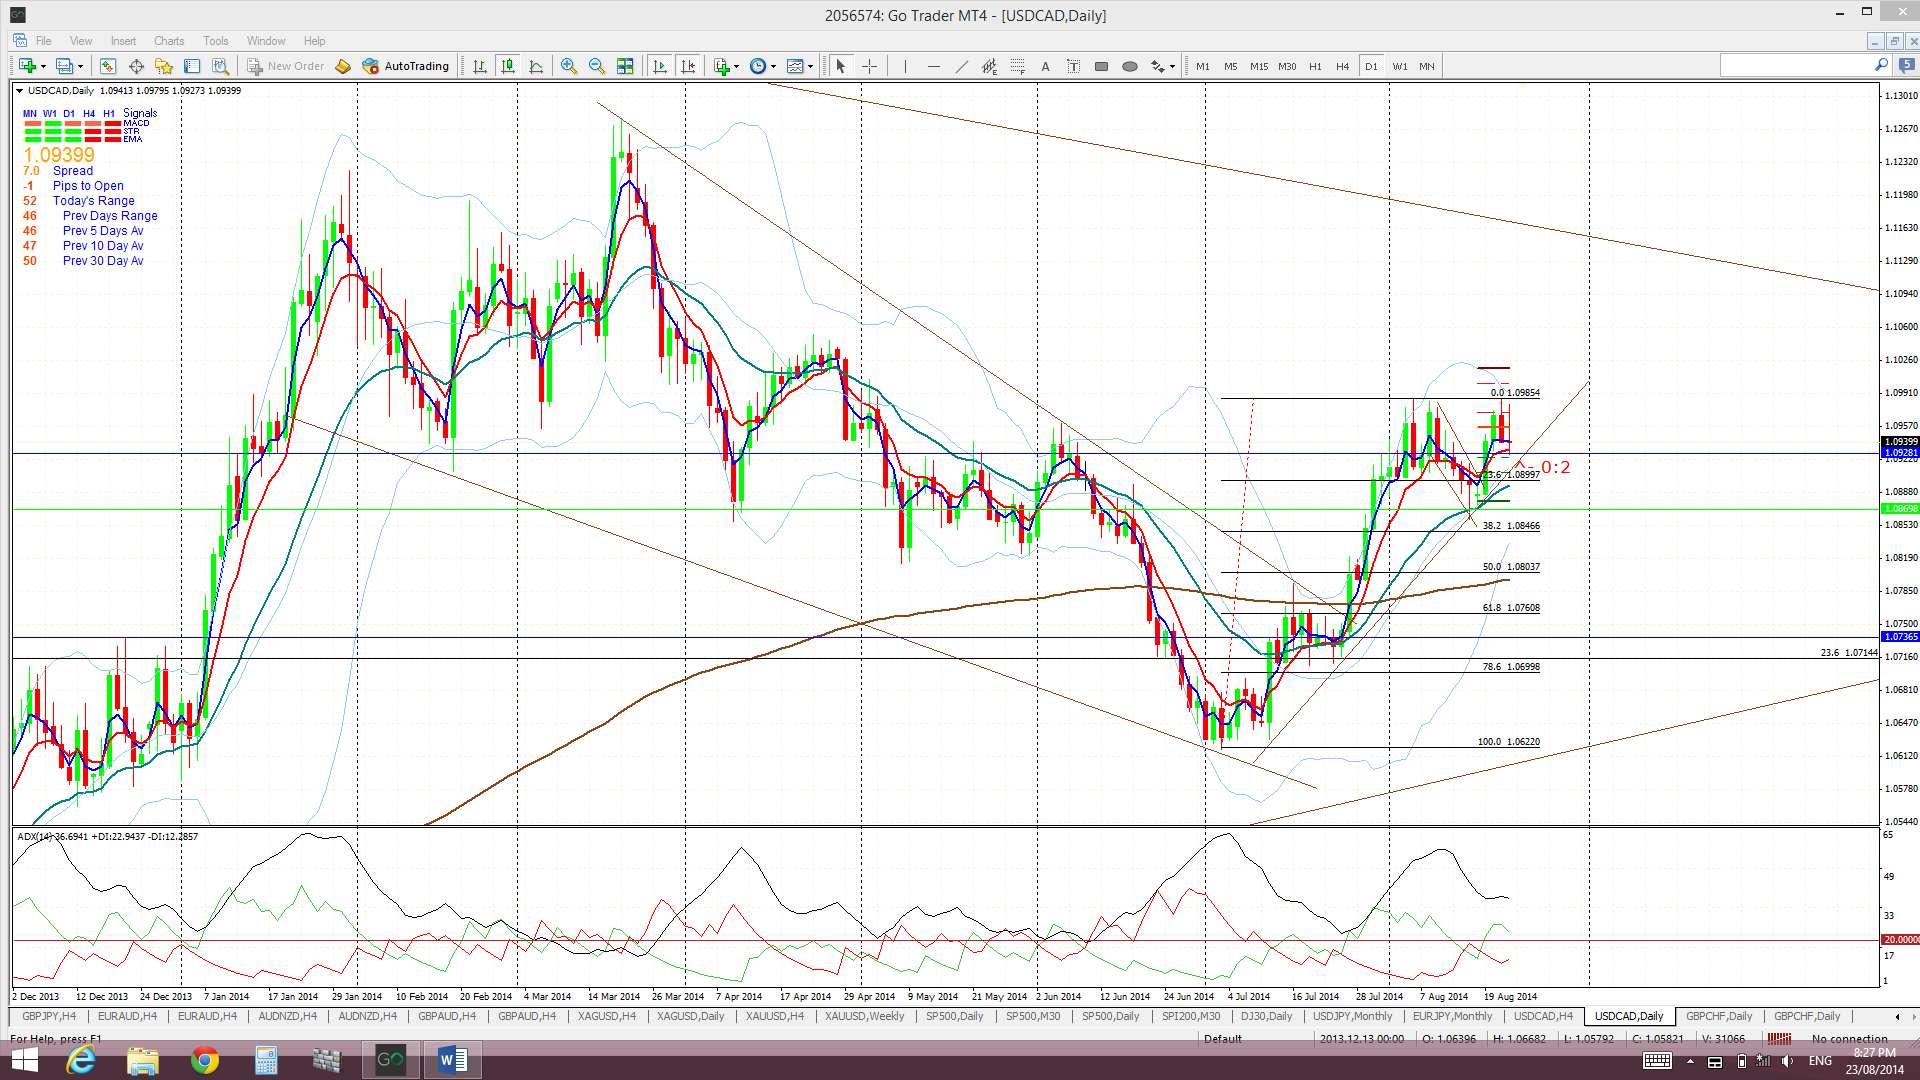
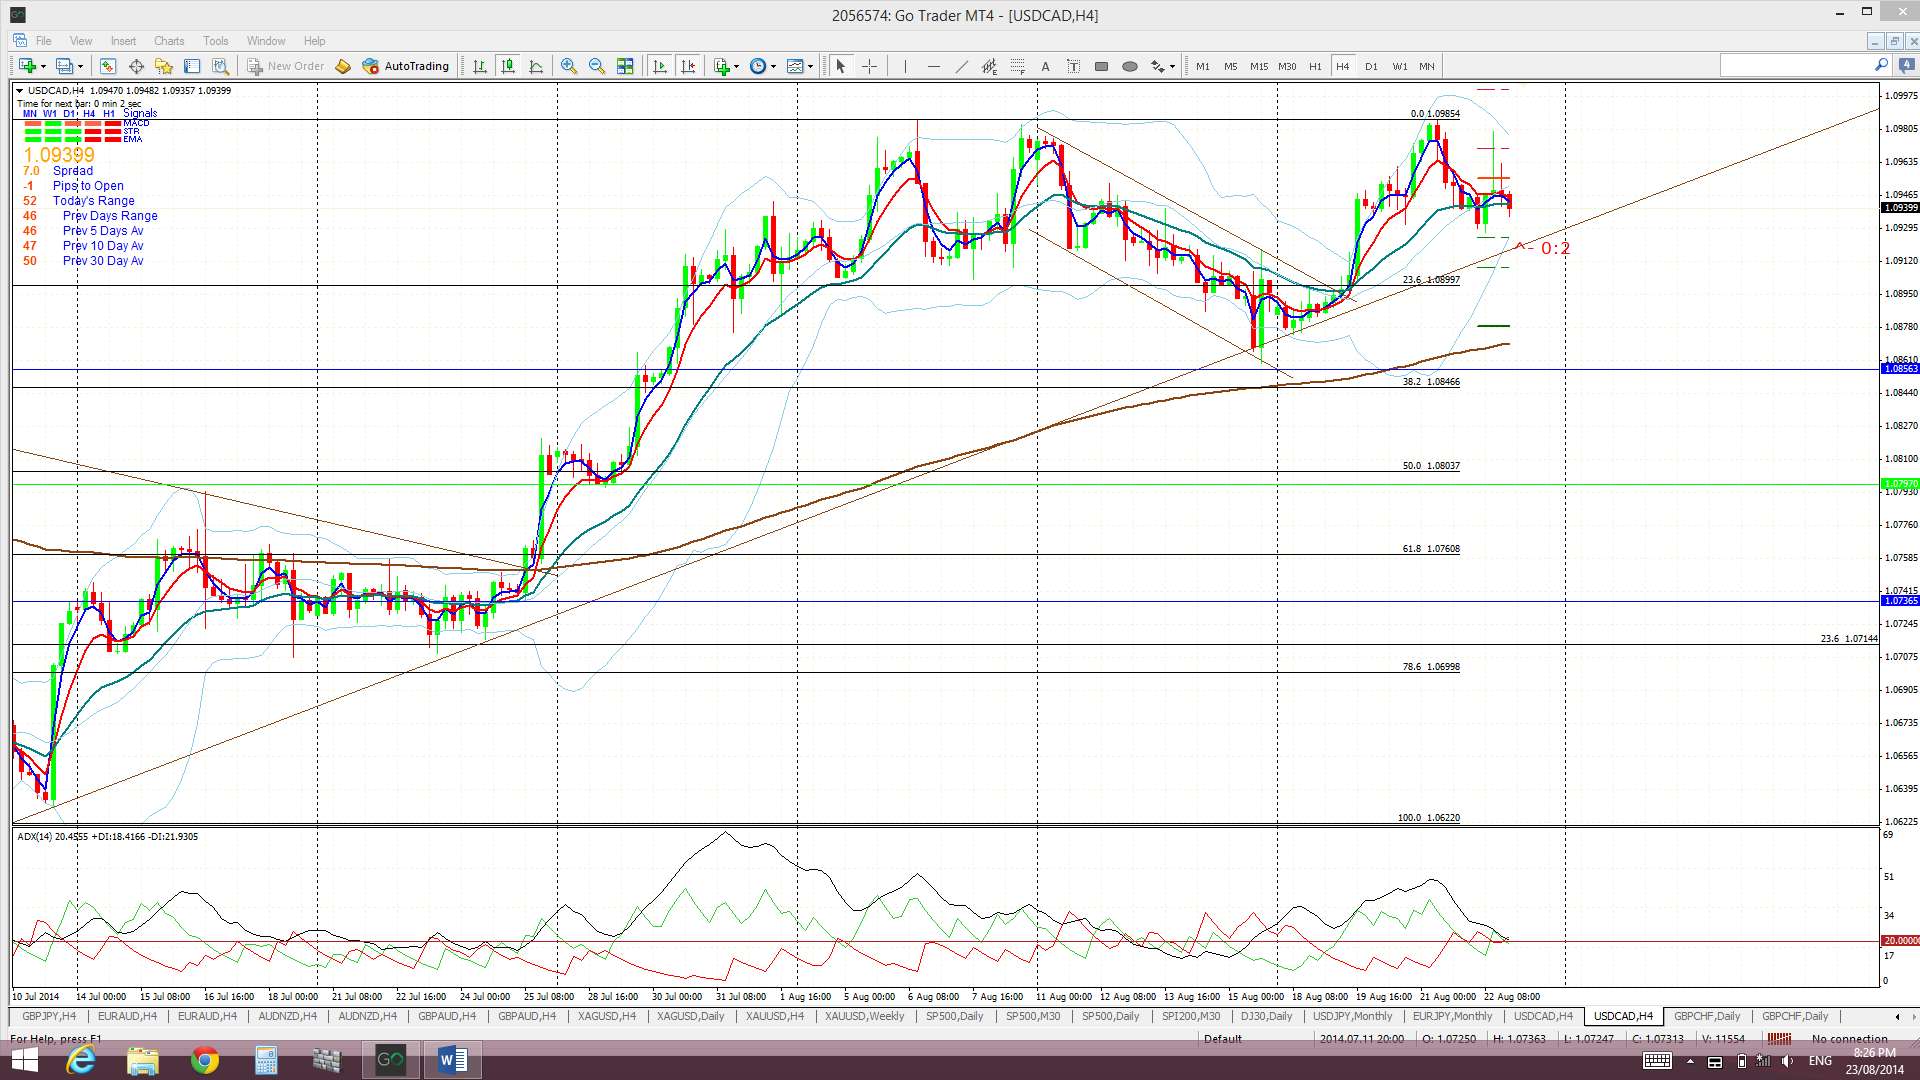
Loonie USD/CAD: The Loonie broke out and up from the bullish descending wedge pattern last week. This move didn’t trigger a valid TC signal but the technical breakout move alone yielded almost 90 pips. Price stalled at the end of the week just under the resistance of the 1.10 level again.
The Loonie is still trading above a daily support trend line and is edging up closer towards the monthly charts triangle trend line. This bear trend line is only about 200 pips above current price and has been in play since 2001 thus, price might become more choppy as it approaches this trend line.
Price is now trading above the Cloud on the 4hr and daily charts which is bullish.
The weekly candle closed as a bullish candle.
- I’m watching for any new TC signal and the monthly chart’s triangle pattern.
Silver: Silver chopped lower last week with increasing USD strength and easing concern with geopolitical issues. It is holding just above the $19 level and the 78.6% fib of the recent bull move.
Silver is still trading below the Ichimoku Cloud on the 4hr chart daily, weekly and monthly charts which is bearish.
The weekly candle closed as a bearish coloured ‘Spinning Top’ candle.
I’m watching for any new TC signal.
Gold: Like Silver, Gold chopped lower due to increasing USD strength and easing geopolitical concern. It slipped below the $1,300 support level early in the week and remained below this level for the rest of the week.
The bullish ‘inverse H&S’ pattern can still be seen forming up on the weekly chart although it is starting to look a bit messy. The ‘neck line’ of this inverse H&S is still up around the $1,400 region, which is also up near the weekly 200 EMA level.
Gold is now trading below the Ichimoku Cloud on the 4hr, daily and monthly charts and at the bottom edge of the Cloud on the weekly chart.
The weekly candle closed as a bearish candle.
It is worth remembering that Gold has completed a 61.8% fib pull back of the bull move from the last swing low, back in October 2008, to the highs of 2011. Thus, this is as good a place as any to try to carve out a basing pattern.
I’m watching for any new TC signal on this pair and the ‘Inverse H&S’ pattern on the weekly chart.
The post Trading Week 25/08/14 appeared first on www.forextell.com.