USDX
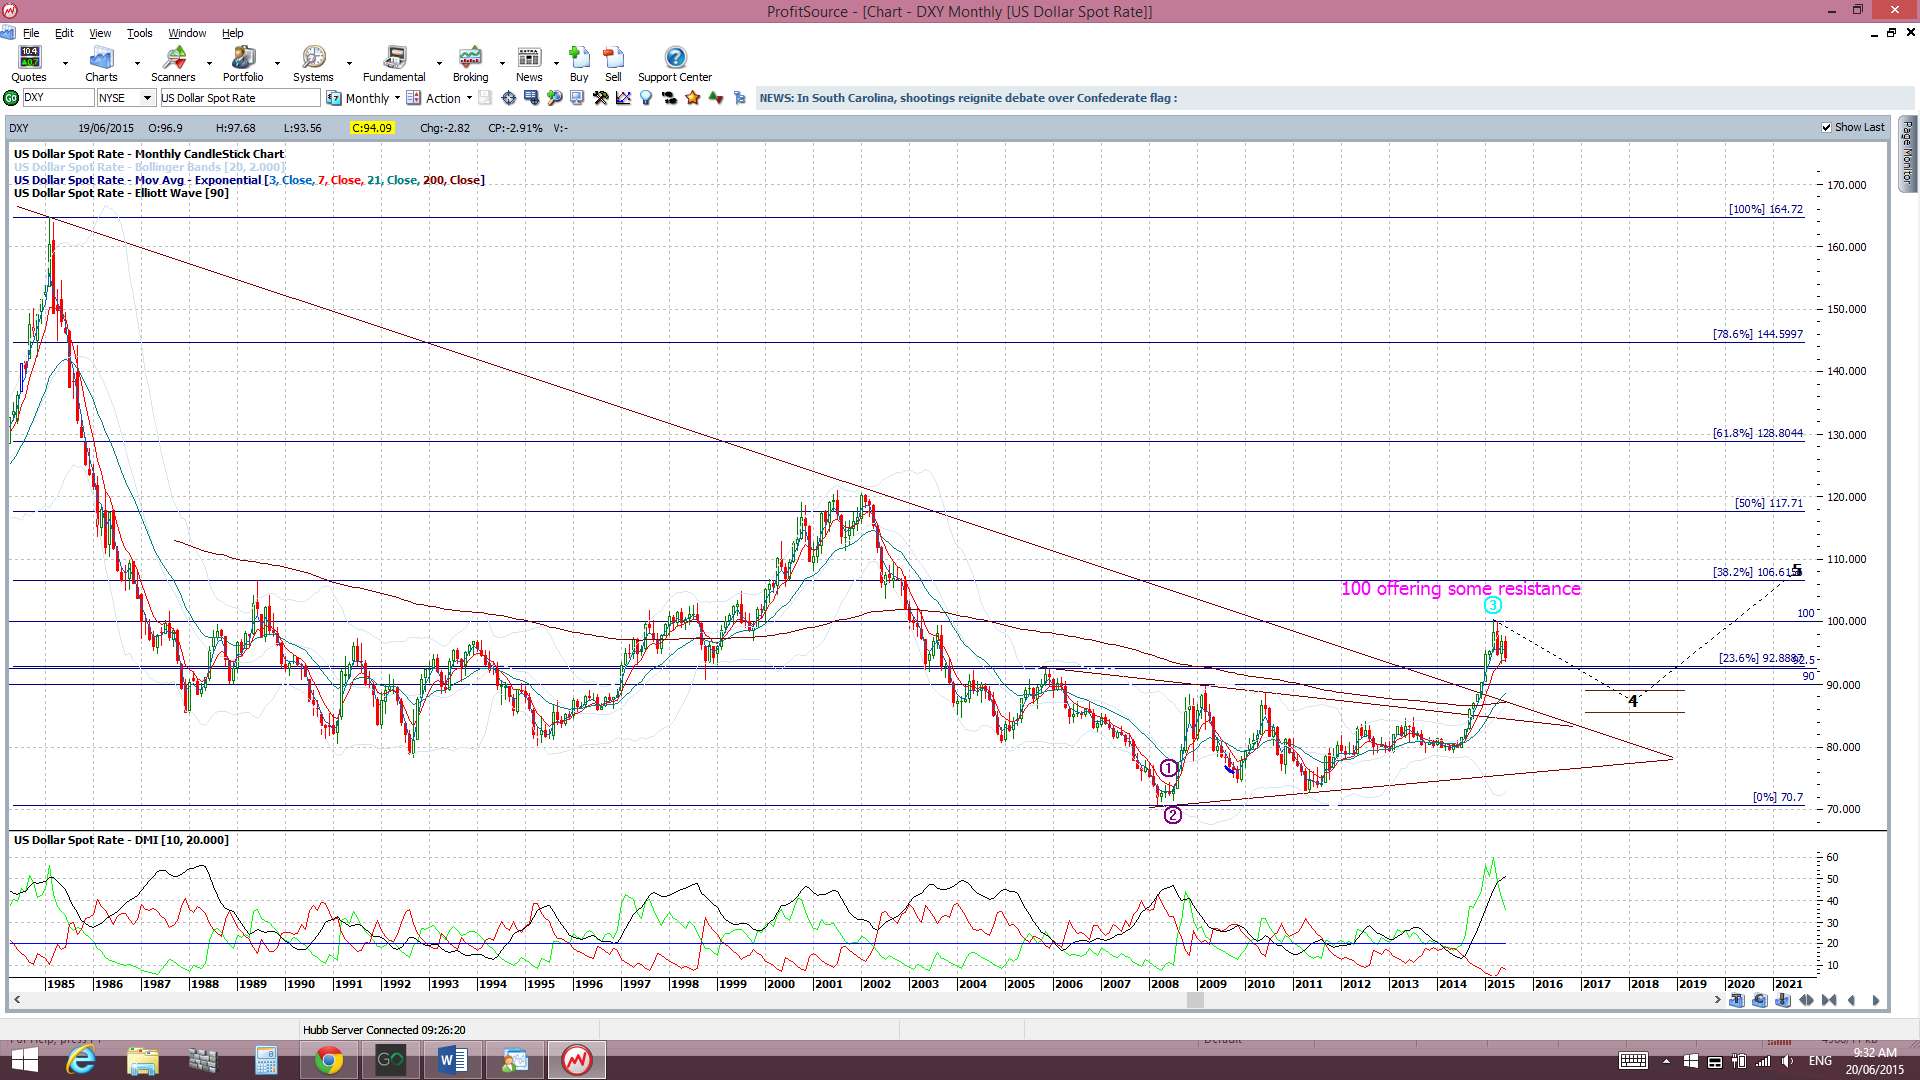
Monthly: The June candle is printing a bearish, essentially, engulfing candle.
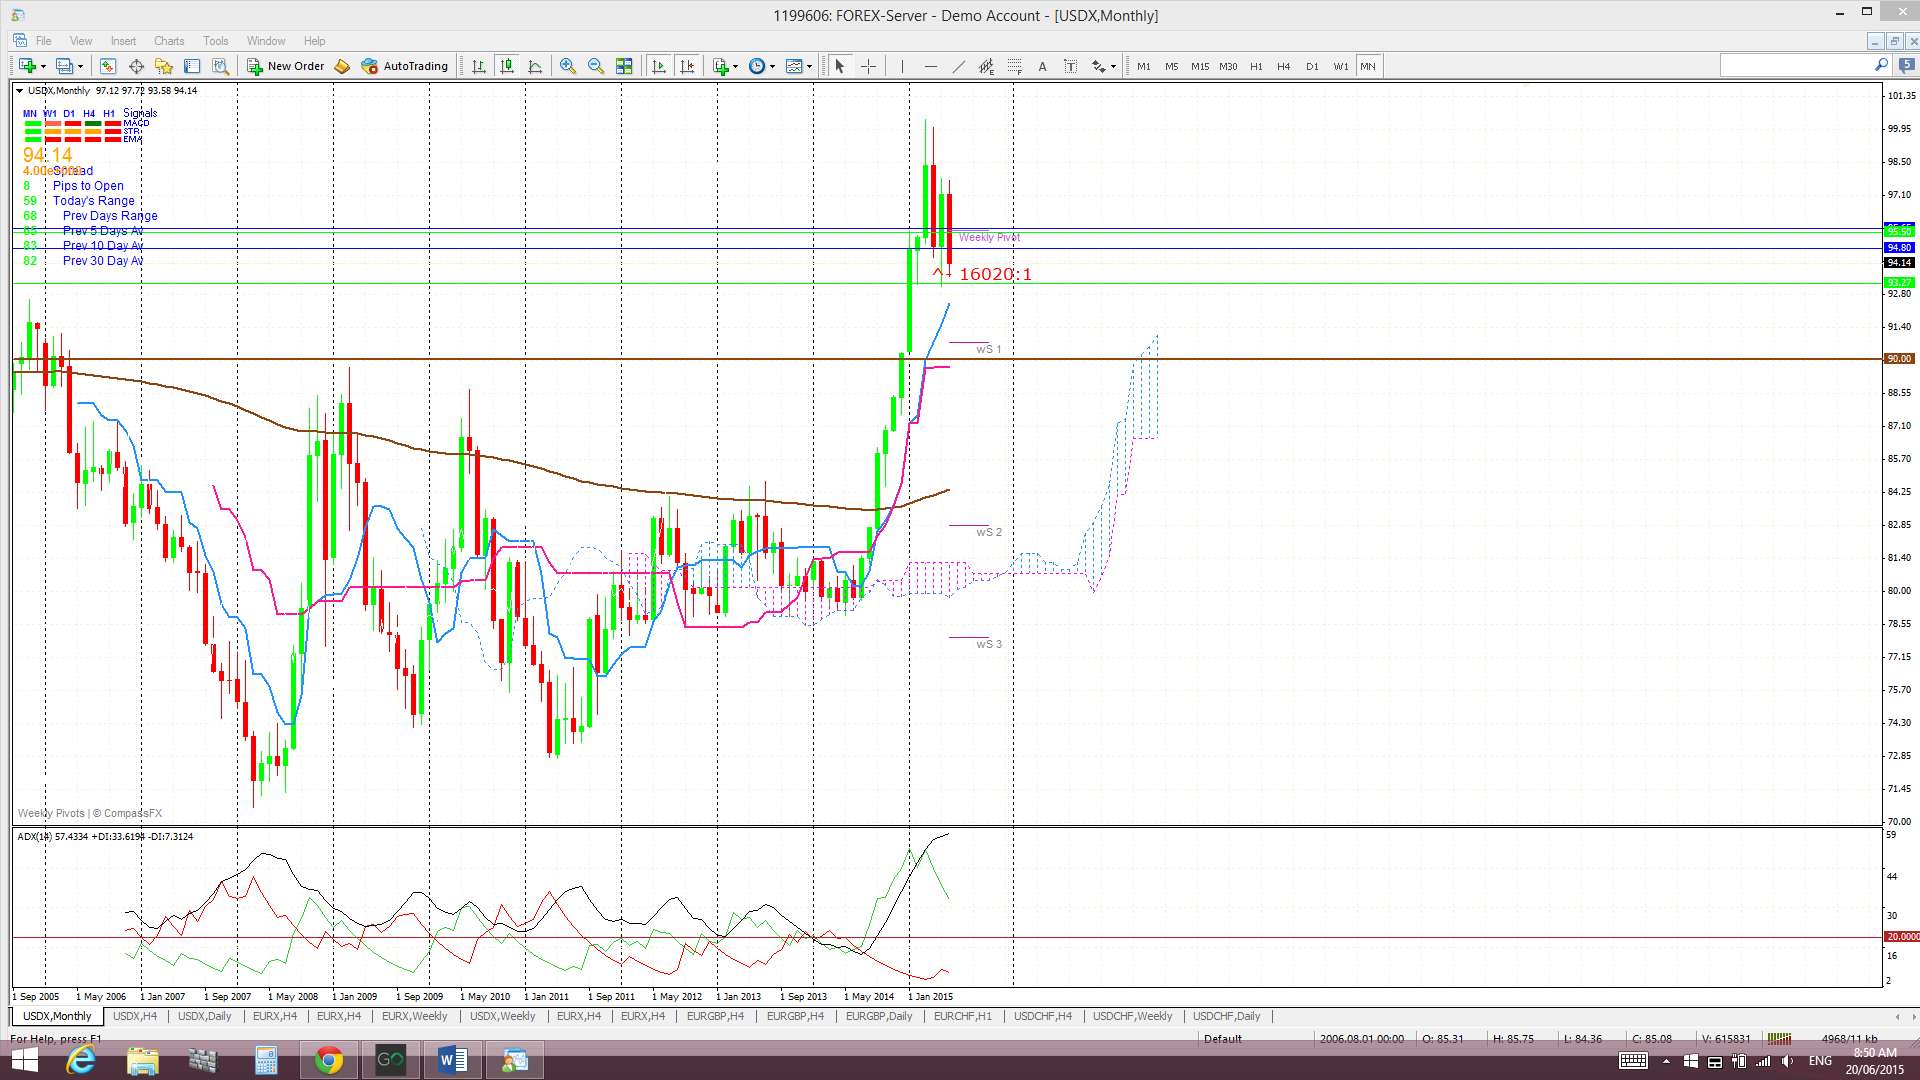
Monthly Ichimoku: The June candle is trading above the Cloud.
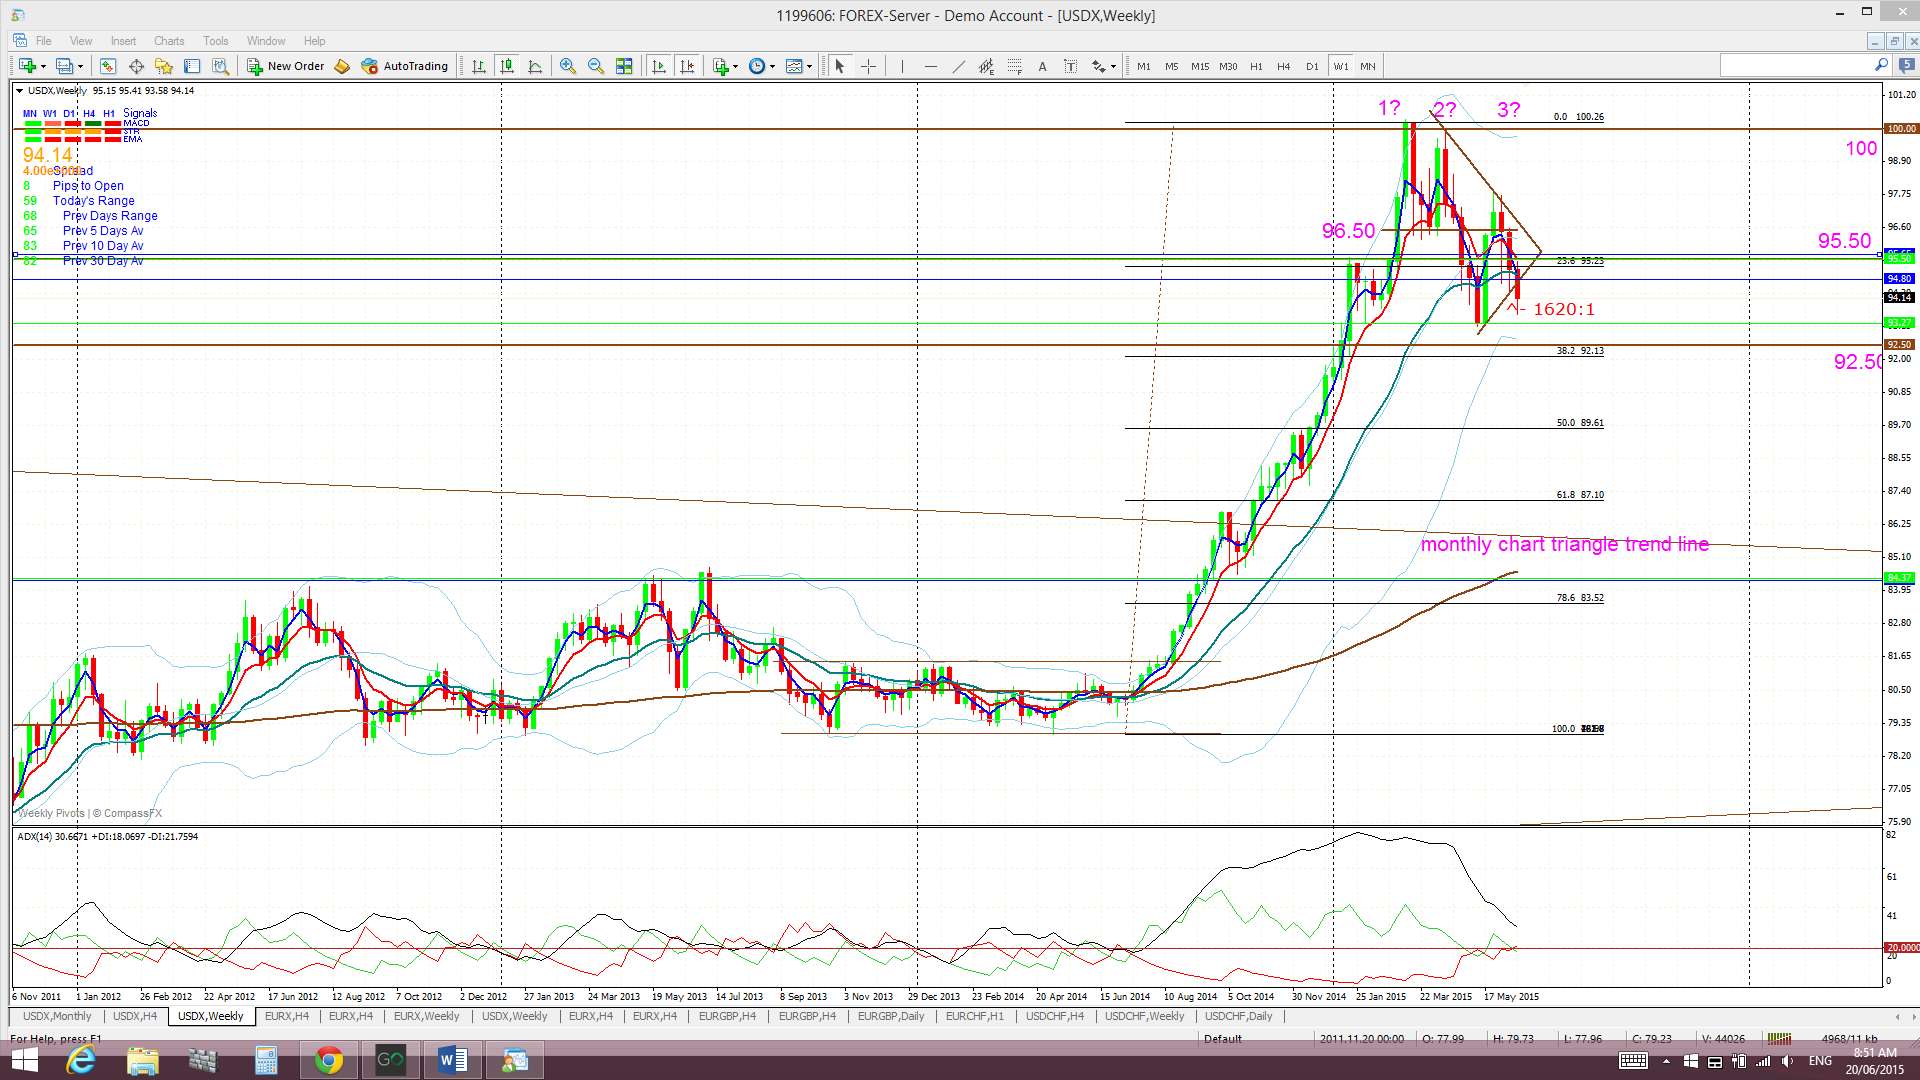
Weekly: Last week’s candle closed as a bearish candle and below the S/R level of 95.50. However, the continued choppy action is still giving this chart a bit of a Bull Flag appearance and we need to see a clear breakout of this Flag region, either above 100 or below 92.50, to confirm or cancel this pattern. It is still worth remembering that a 61.8% fib pull back of this lengthy US$ rally would bring price down to near the previous monthly triangle breakout region.
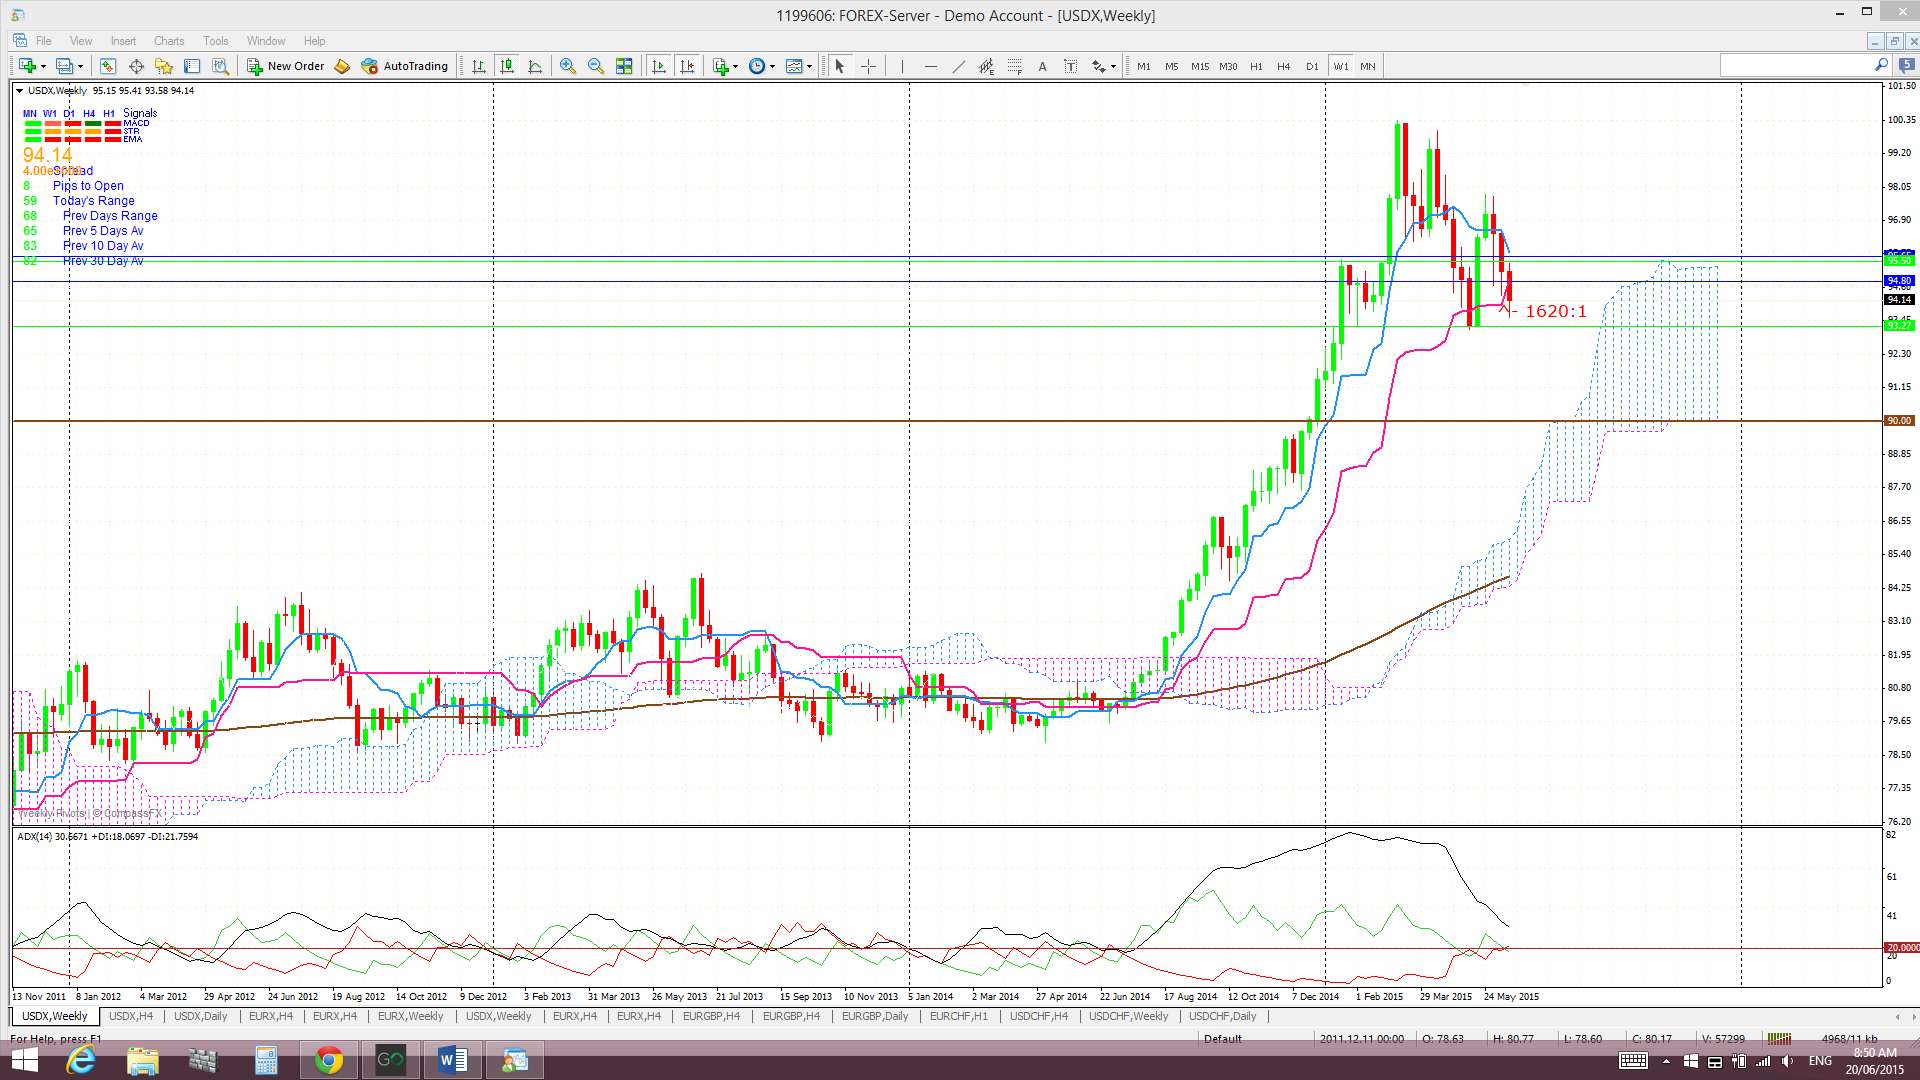
Weekly Ichimoku: The weekly candle closed ABOVE the weekly Cloud.
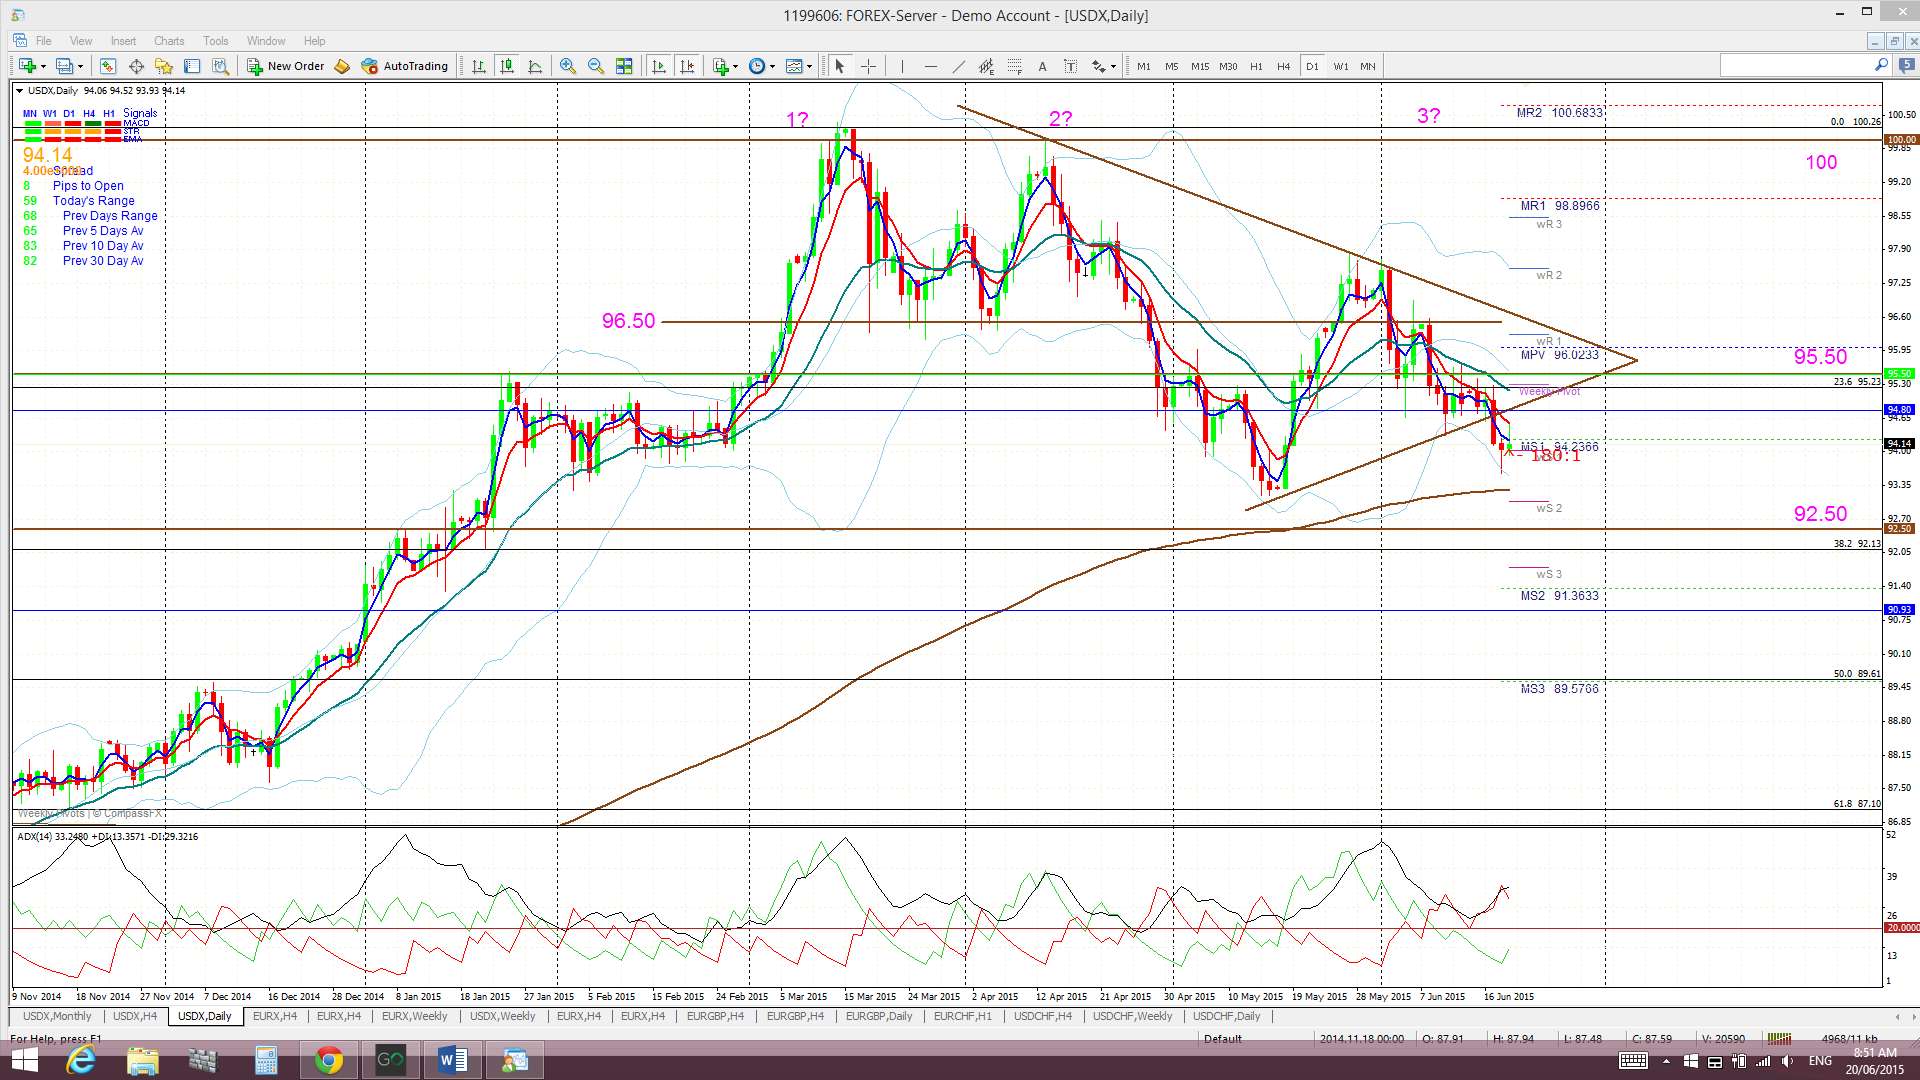
Daily: Price chopped lower last week but Friday’s candle closed as a bullish-reversal ‘Inverted Hammer’. We’ll have to wait until next week to see if there is any follow through from this candle. The 100 level remains as overall resistance above current price but any move back up to the 100 region would most likely bring on ‘Triple Top’ jitters.
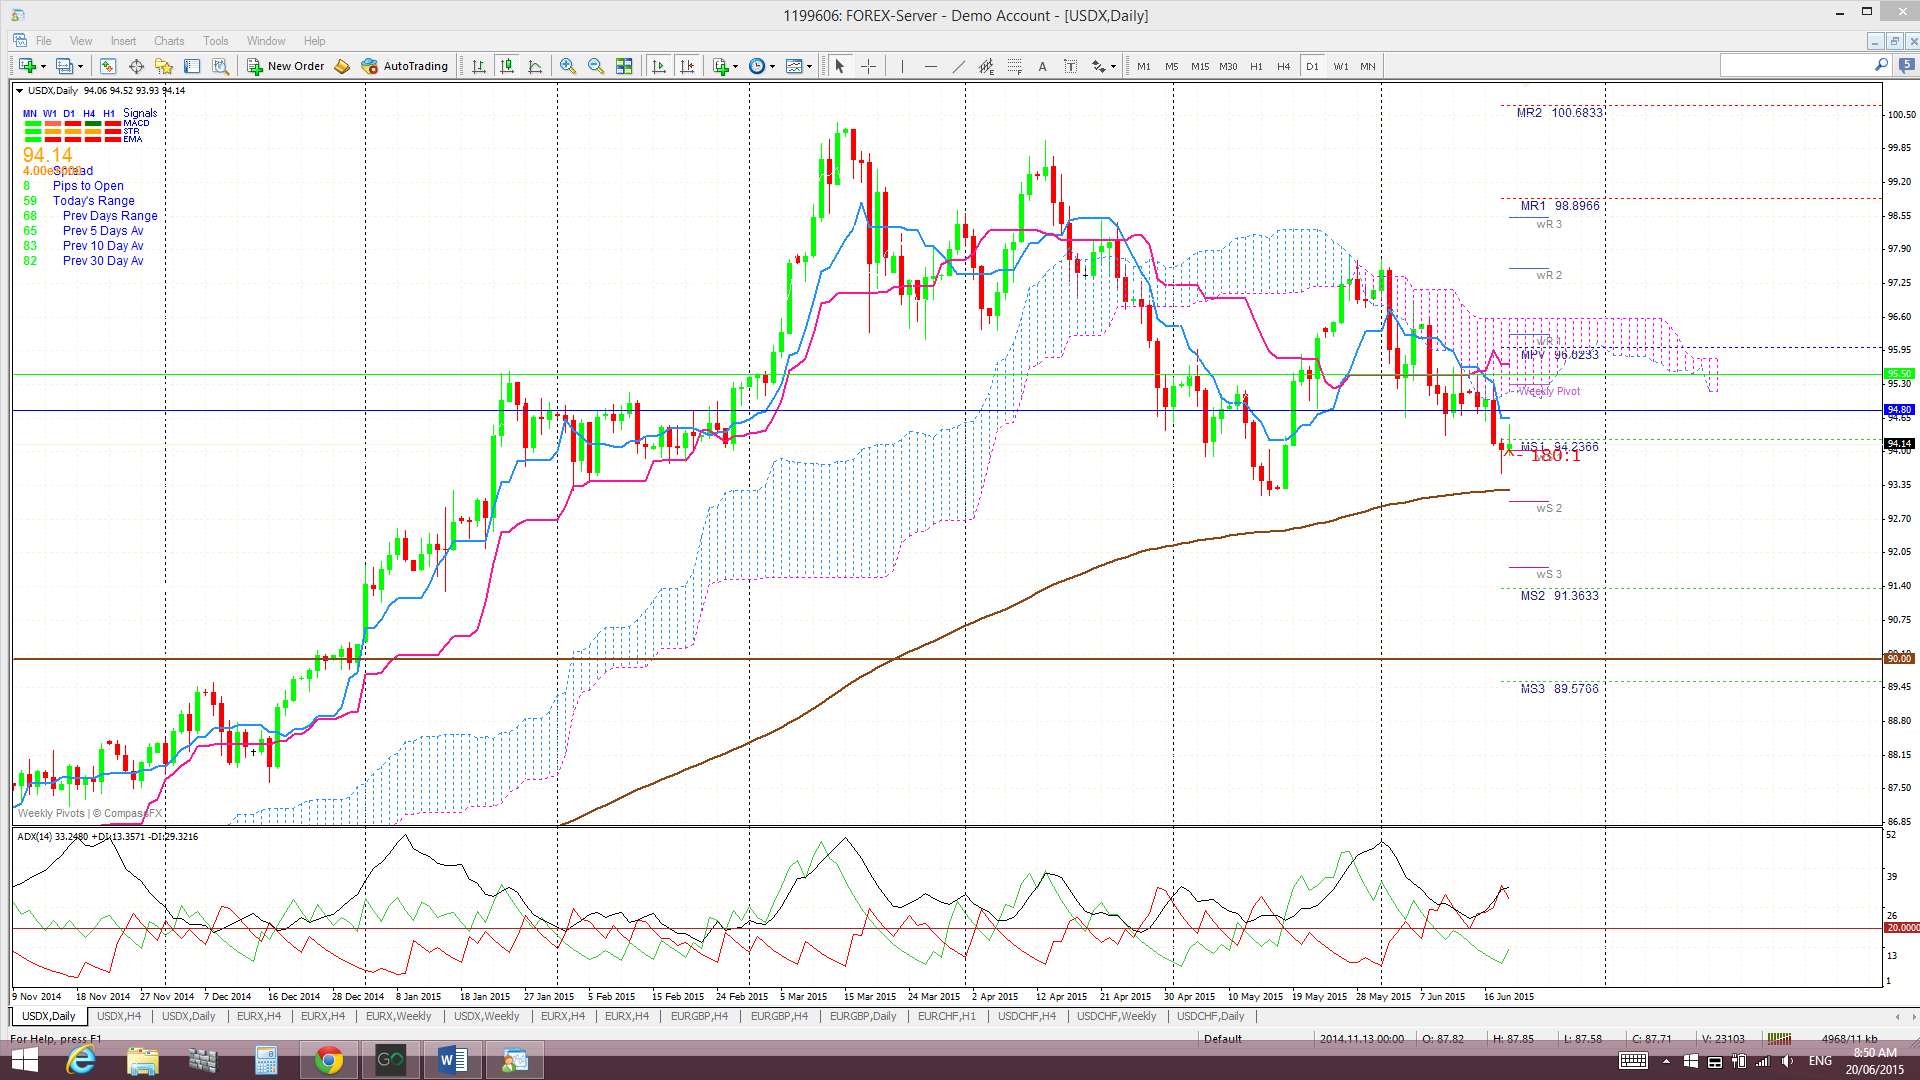
Daily Ichimoku Cloud chart: Price traded below the daily Cloud for much of last week. Note also that there has been a new bearish Tenkan/Kijun cross.
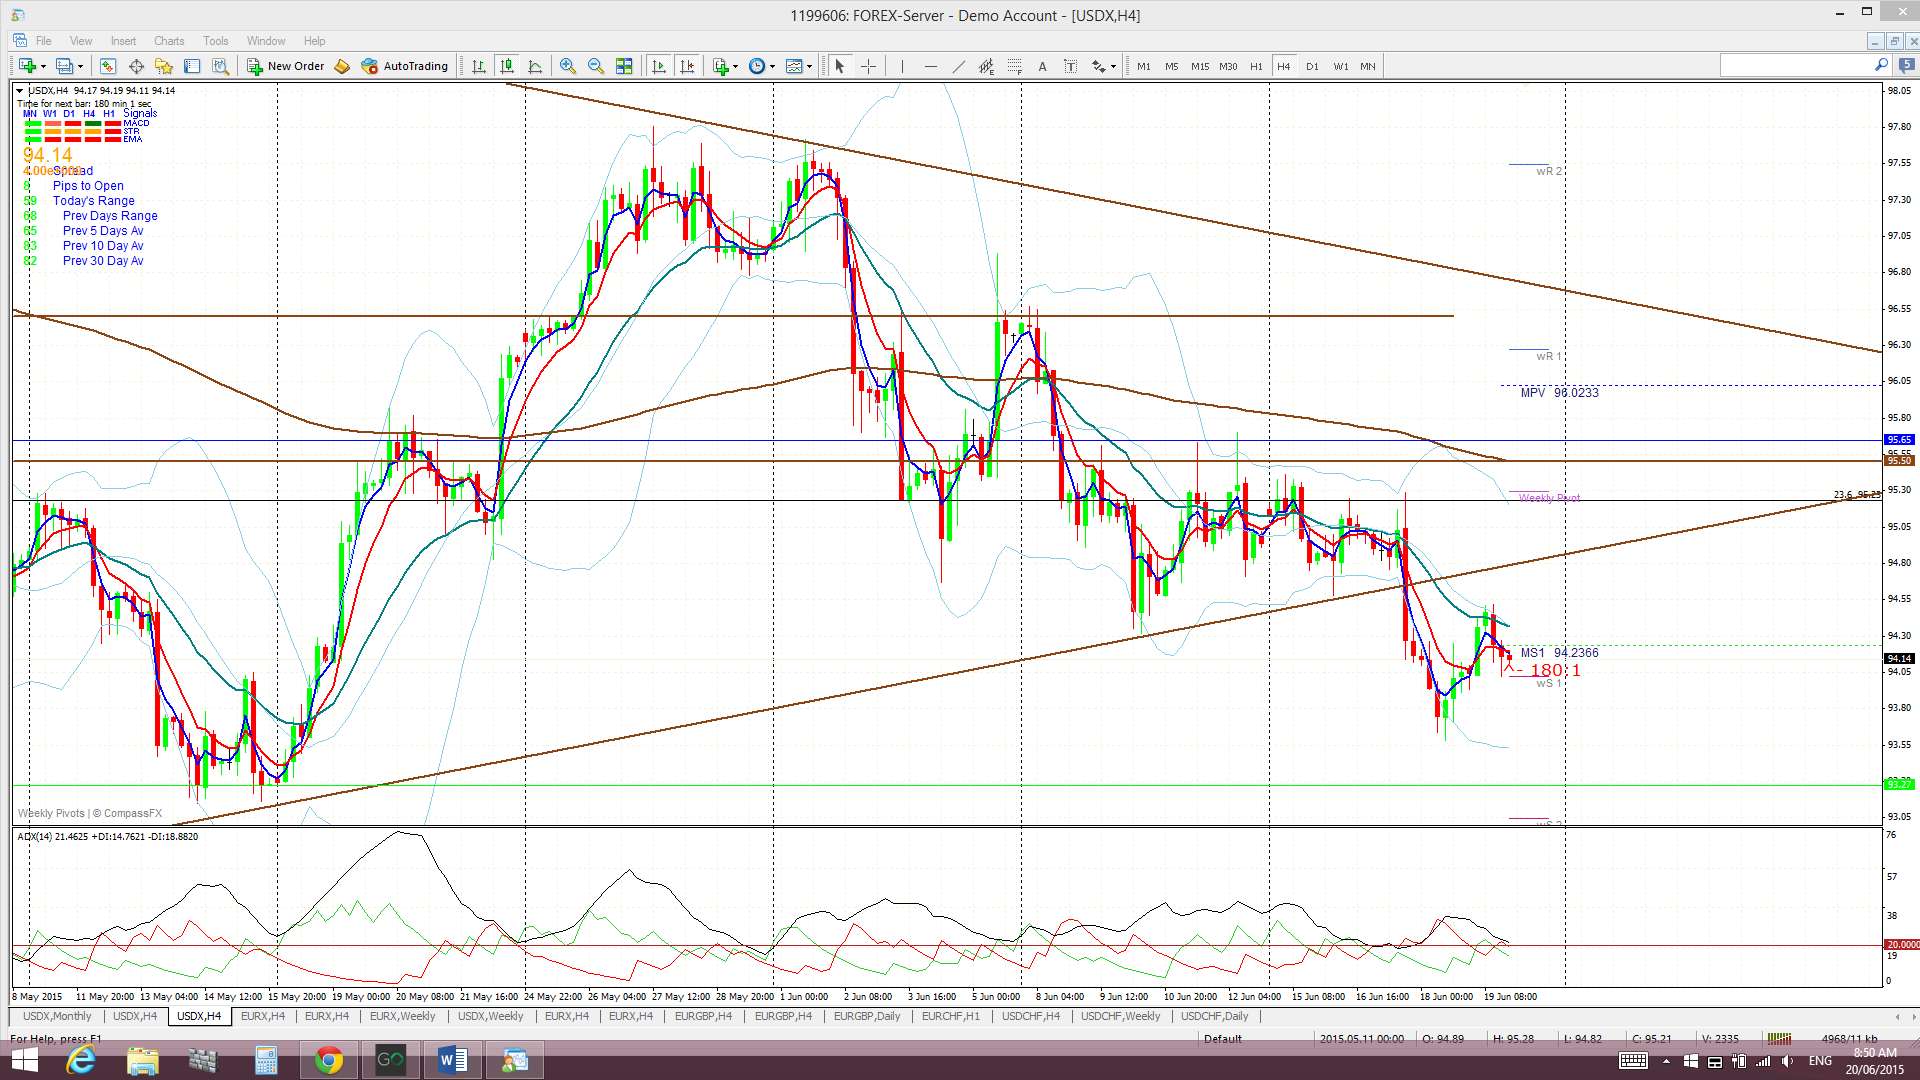
4hr: Price chopped lower last week as price and found overhead resistance from the 95.50 level.
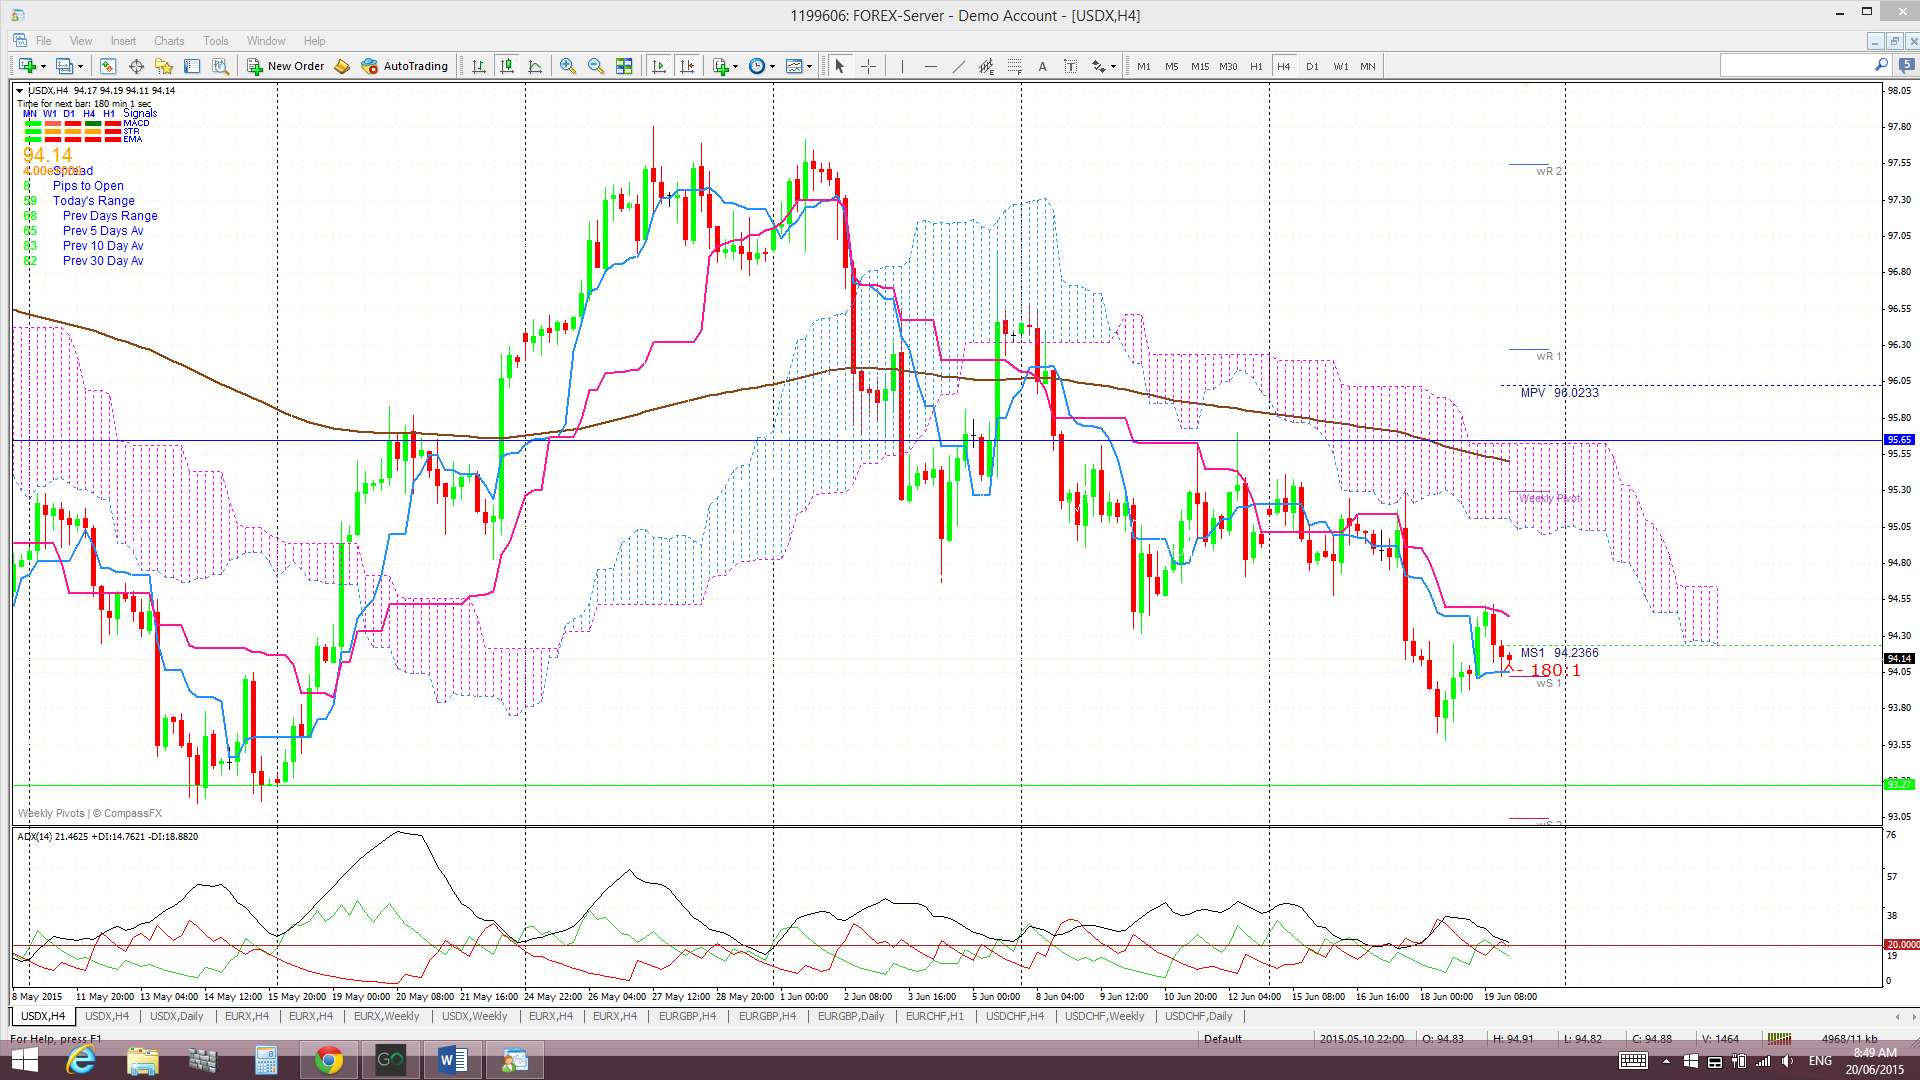
4hr Ichimoku Cloud chart: Price traded below the 4hr Cloud last week. This chart is aligned with the the daily chart and suggests SHORT US$.
EURX
Monthly: The June candle is printing an, almost, bullish engulfing candle and is above the key 96 ‘Double Bottom’ level. Price action still has a possible ‘Bear Flag’ appearance and so traders need to watch for trend line breakouts with momentum to help gauge sentiment.
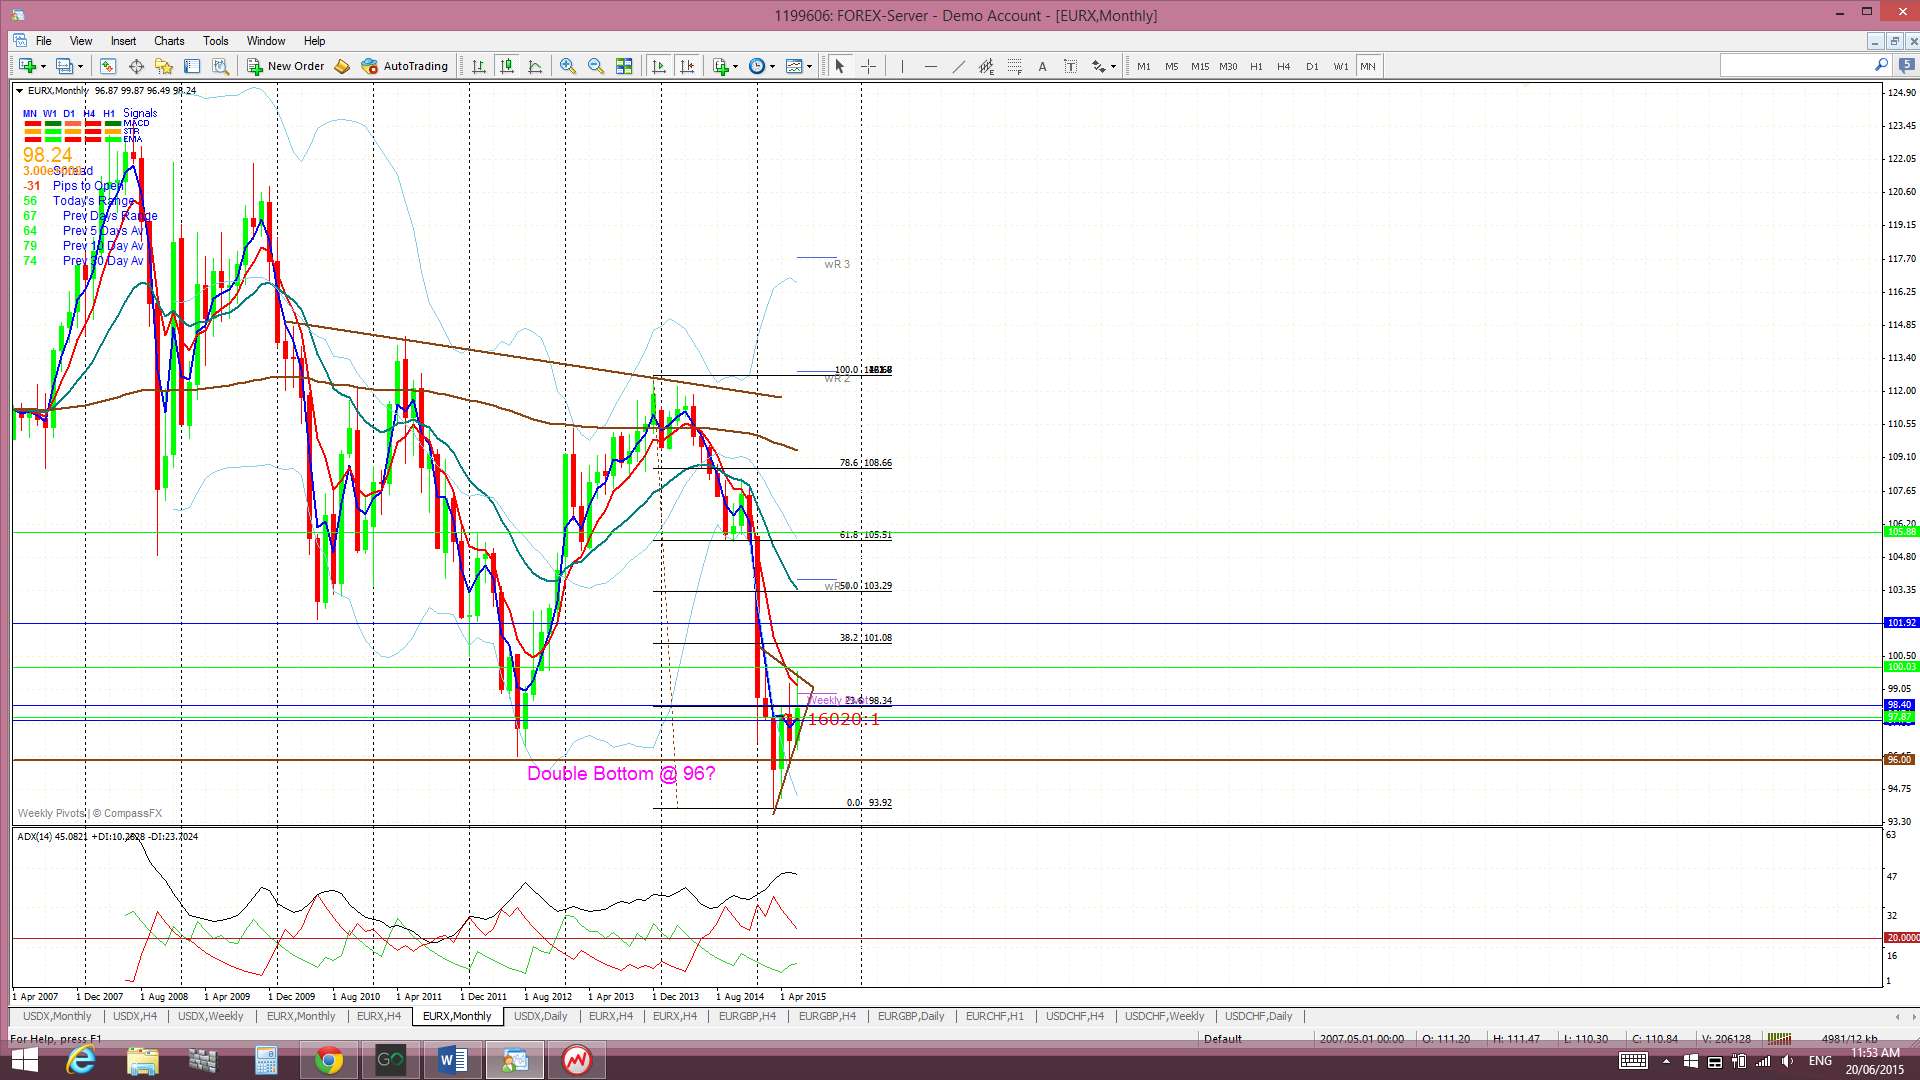
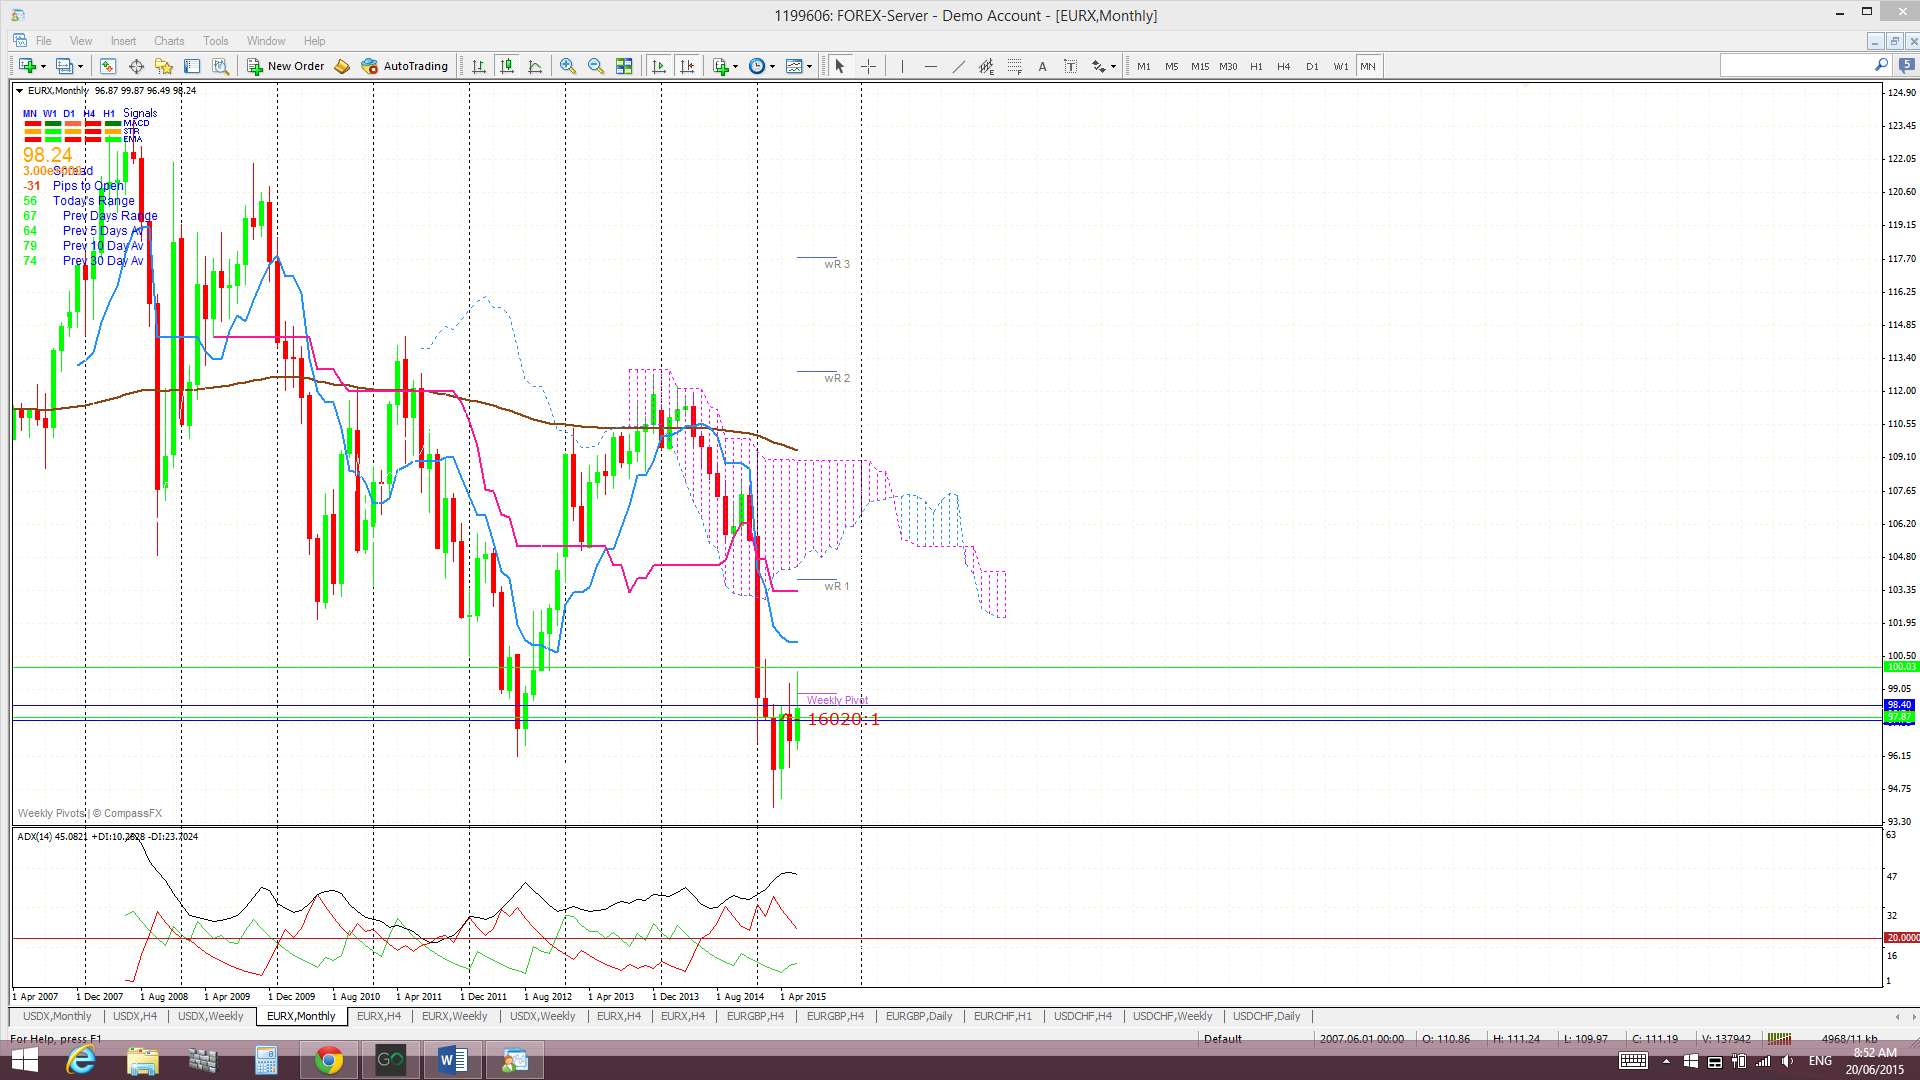
Monthly Ichimoku: The June candle is trading below the Cloud.
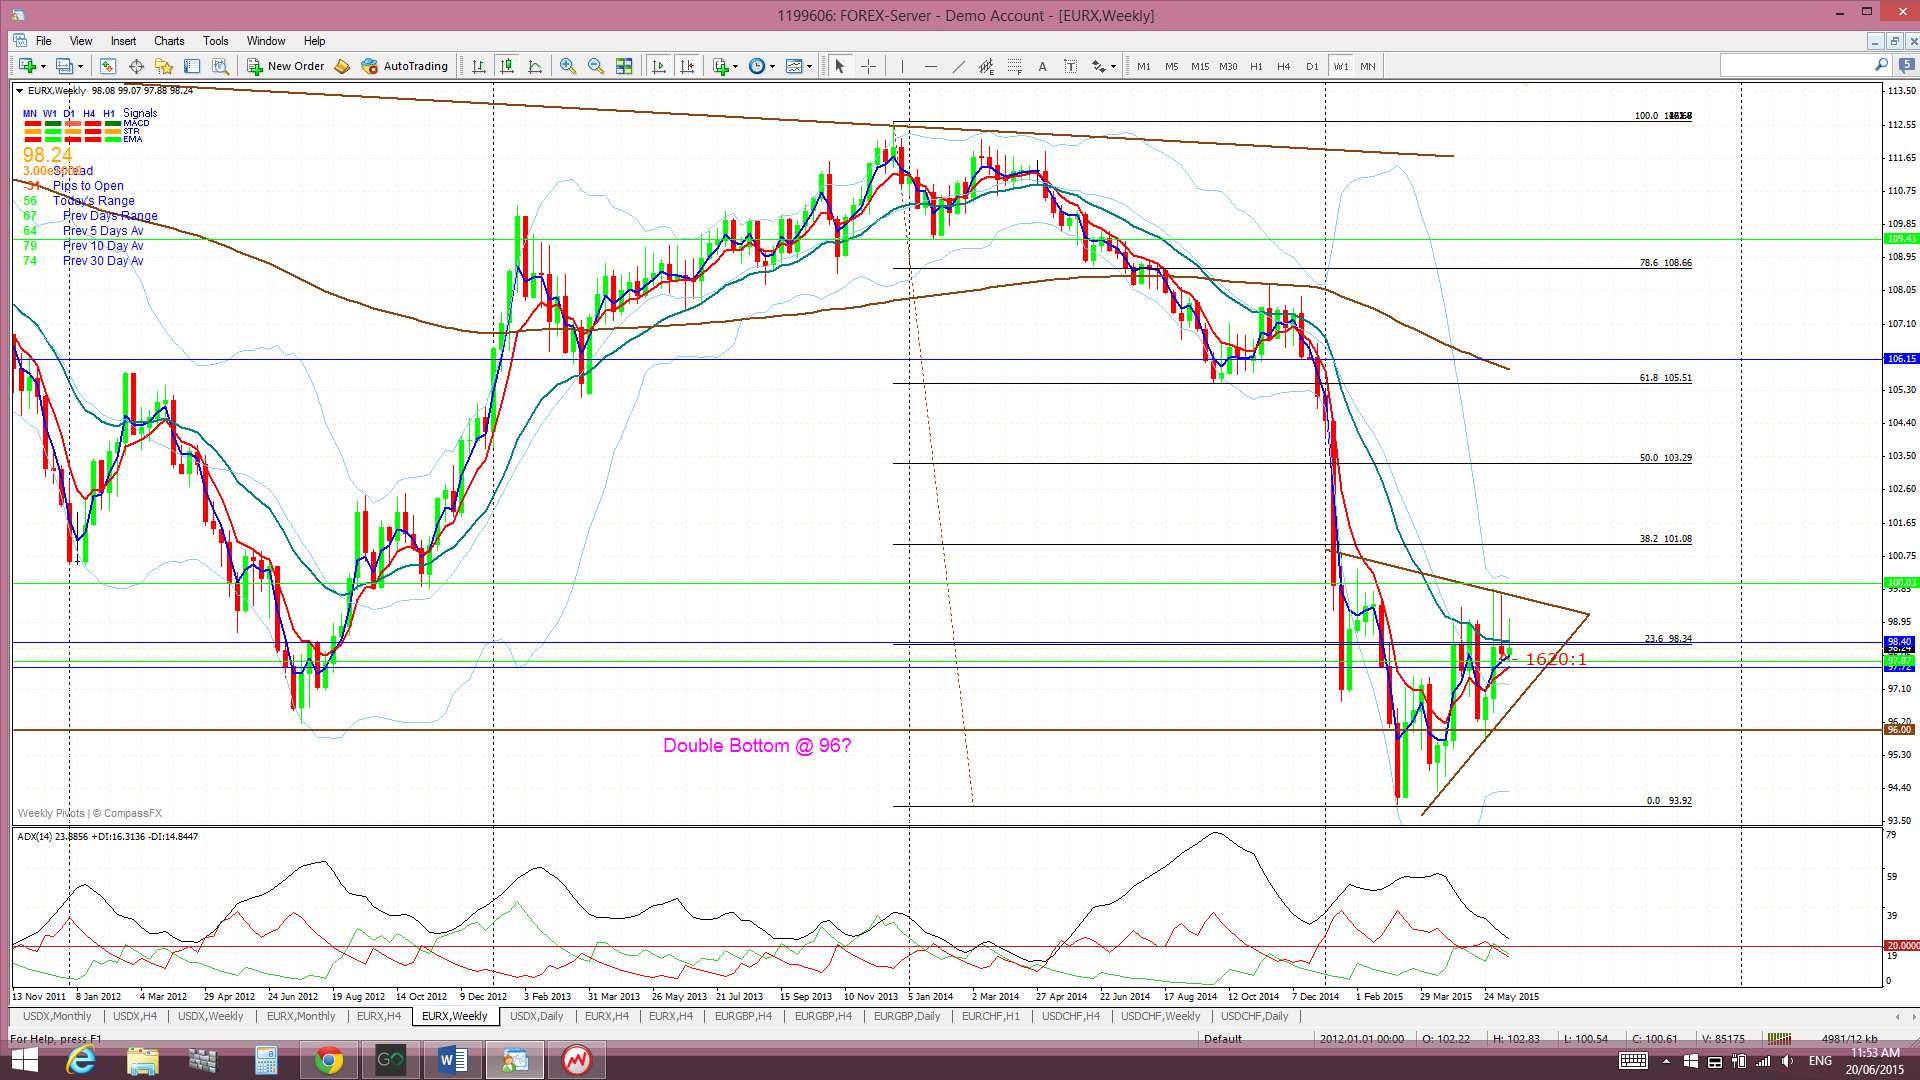
Weekly: The weekly candle closed as a small bullish coloured candle and still above the key 96 level. The candle had a long upper shadow as have two other recent candles and these point to failed attempts to break higher. The weekly chart shows that a 61.8% fib retracement of the recent lengthy bear move is back up near the 105.50 level and weekly 200 EMA. Any hold above 96 and continued recovery effort might see the index target this region. Note there are still two conflicting technical patterns here; the basing-style bullish pattern of a ‘Double Bottom’ but, also, a possible Bear Flag. Watch for trend line breaks with momentum to gauge which one will dominate.
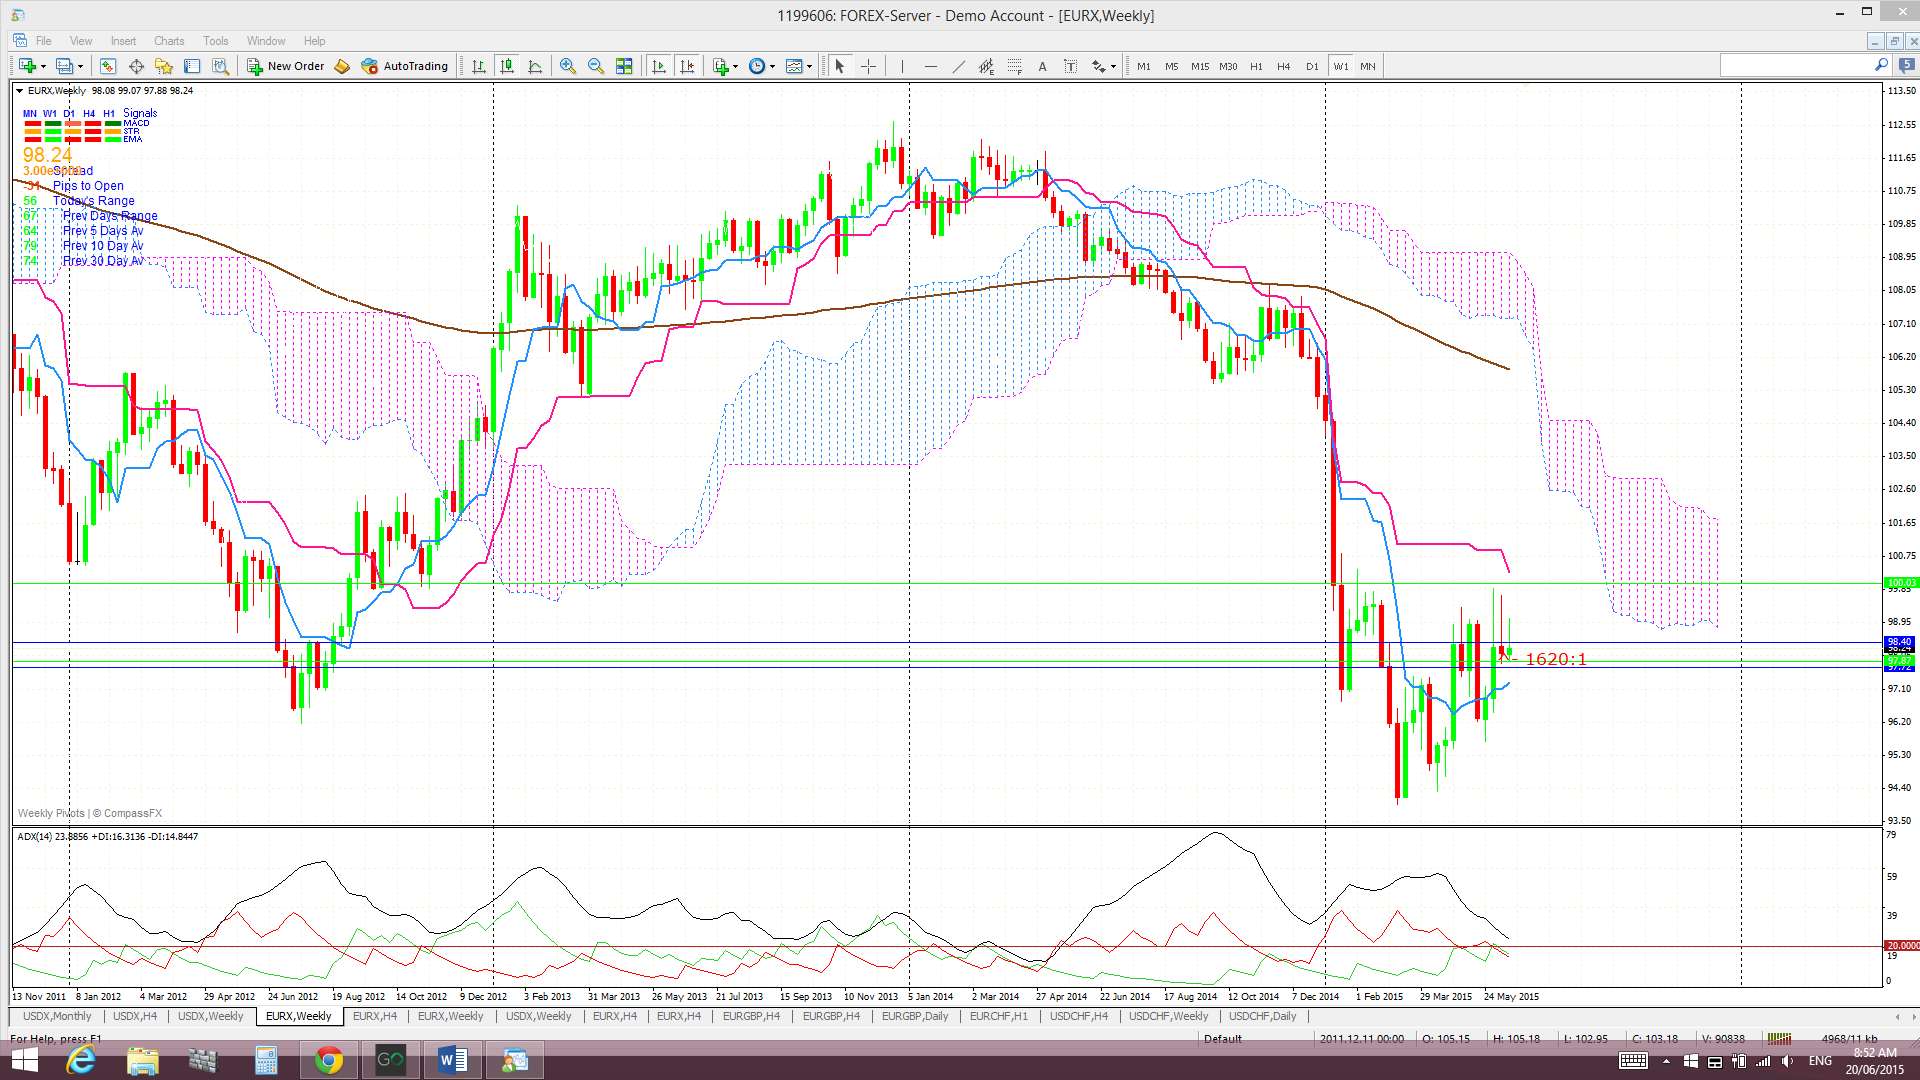
Weekly Ichimoku: Price is still trading well below the weekly Cloud.
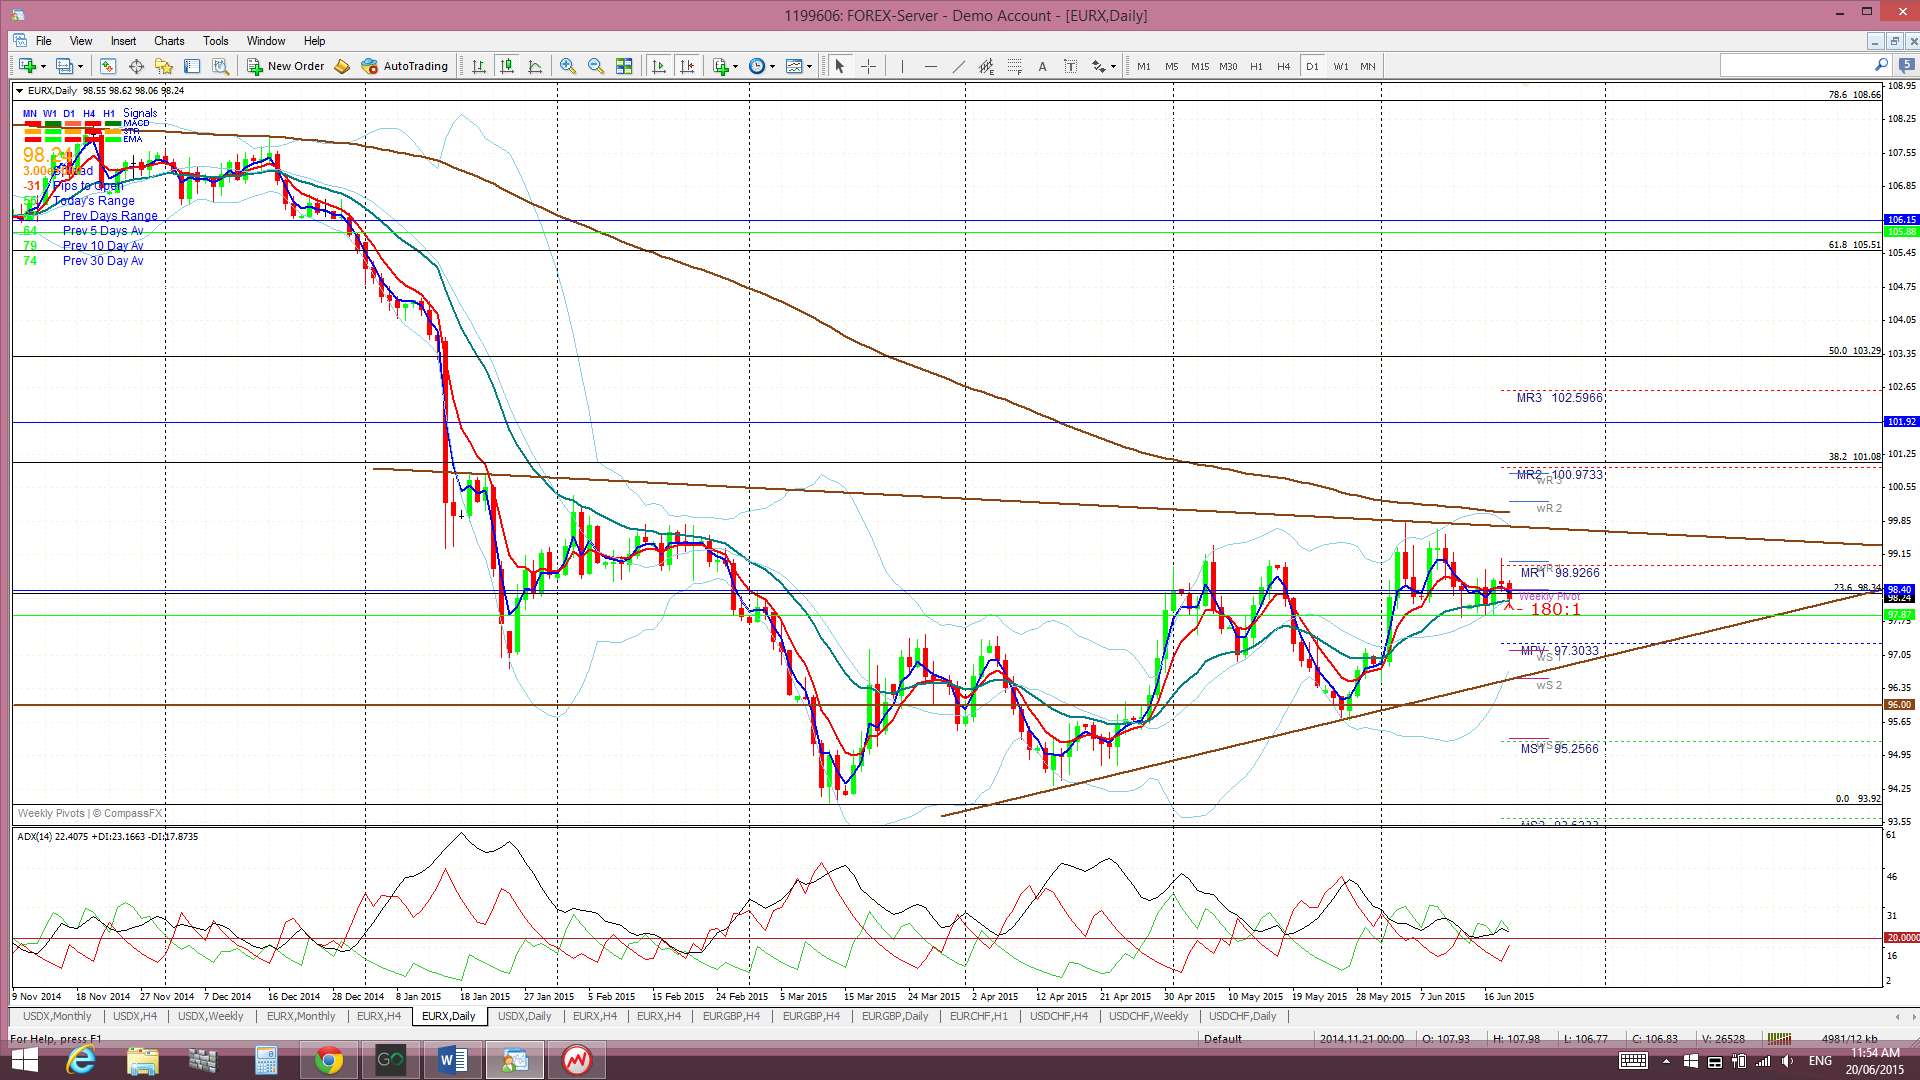
Daily: Price chopped a bit higher last week but with only two bullish days and three bearish ones. This time frame best shows how price has been essentially consolidating for the last six weeks within a developing triangle pattern.
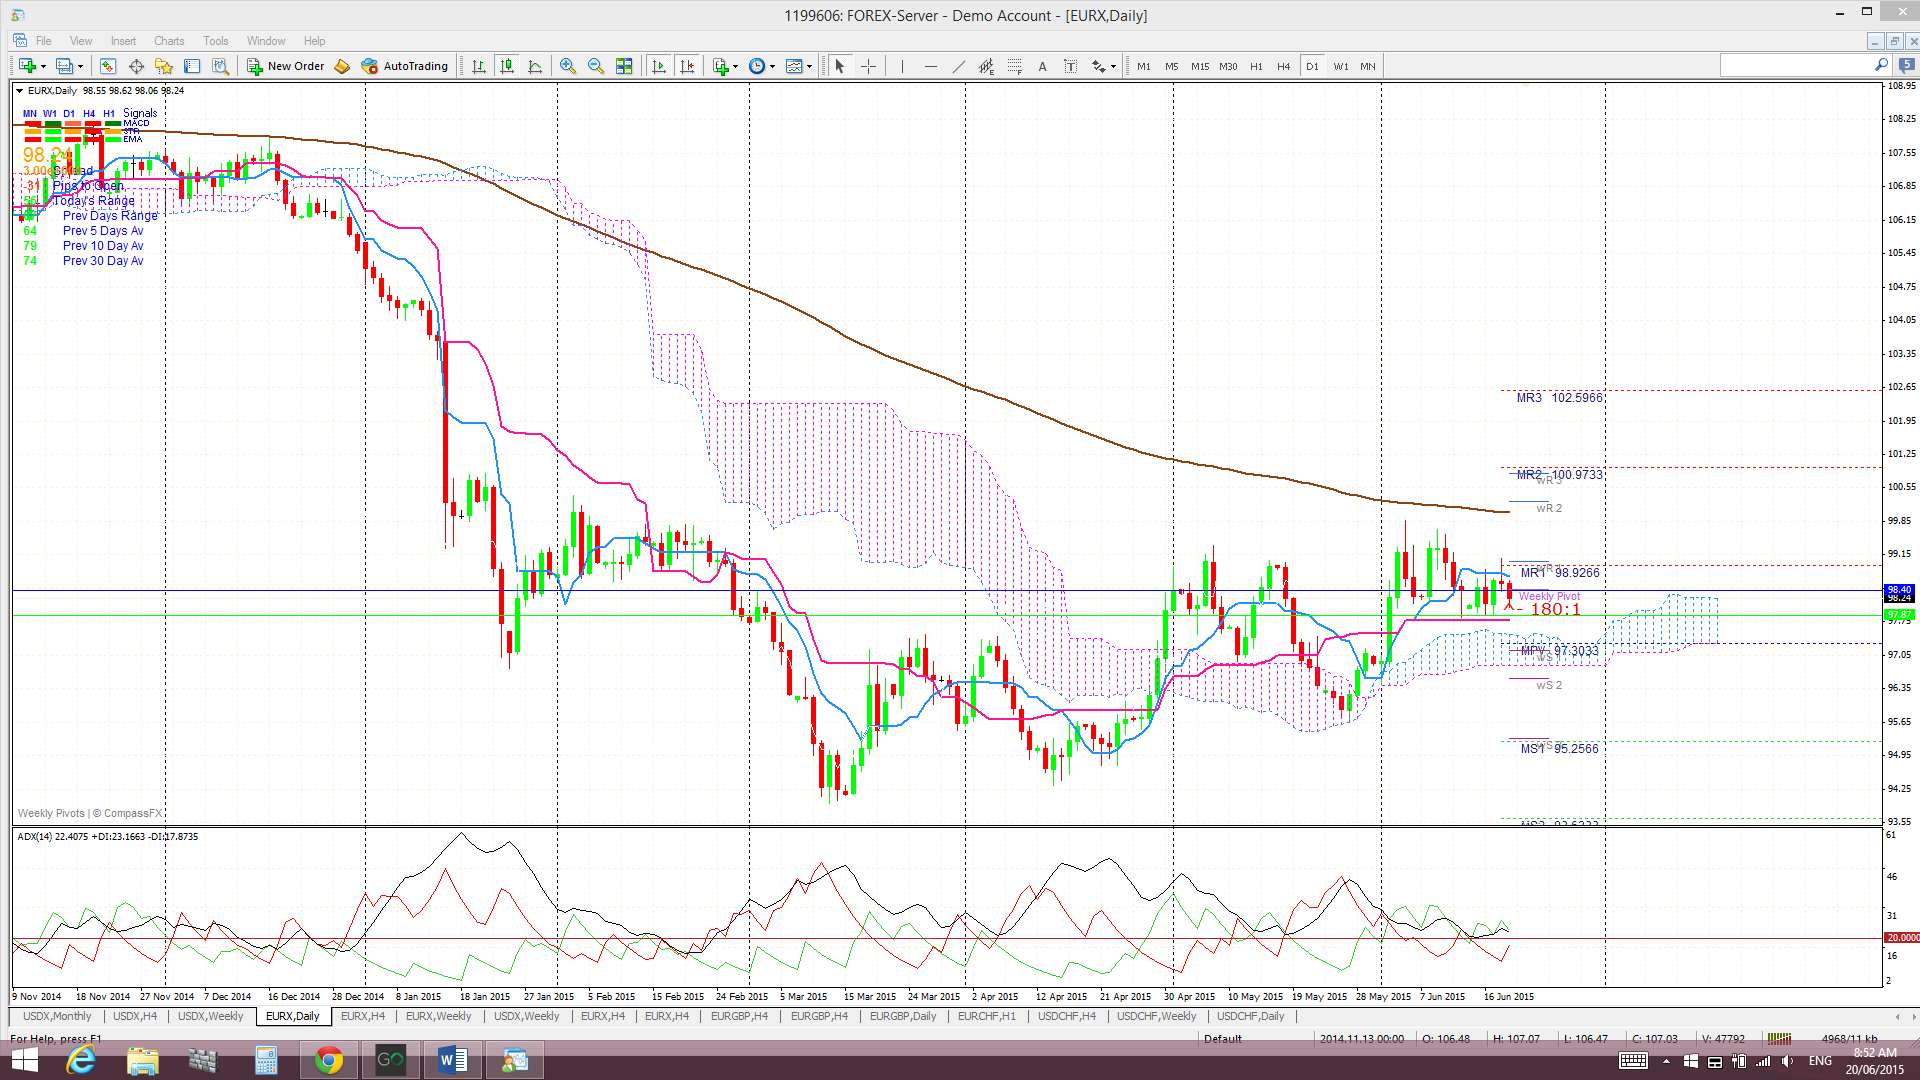
Daily Ichimoku Cloud chart: Price traded above the daily Cloud last week and there has been a recent bullish Tenkan/Kijun cross.
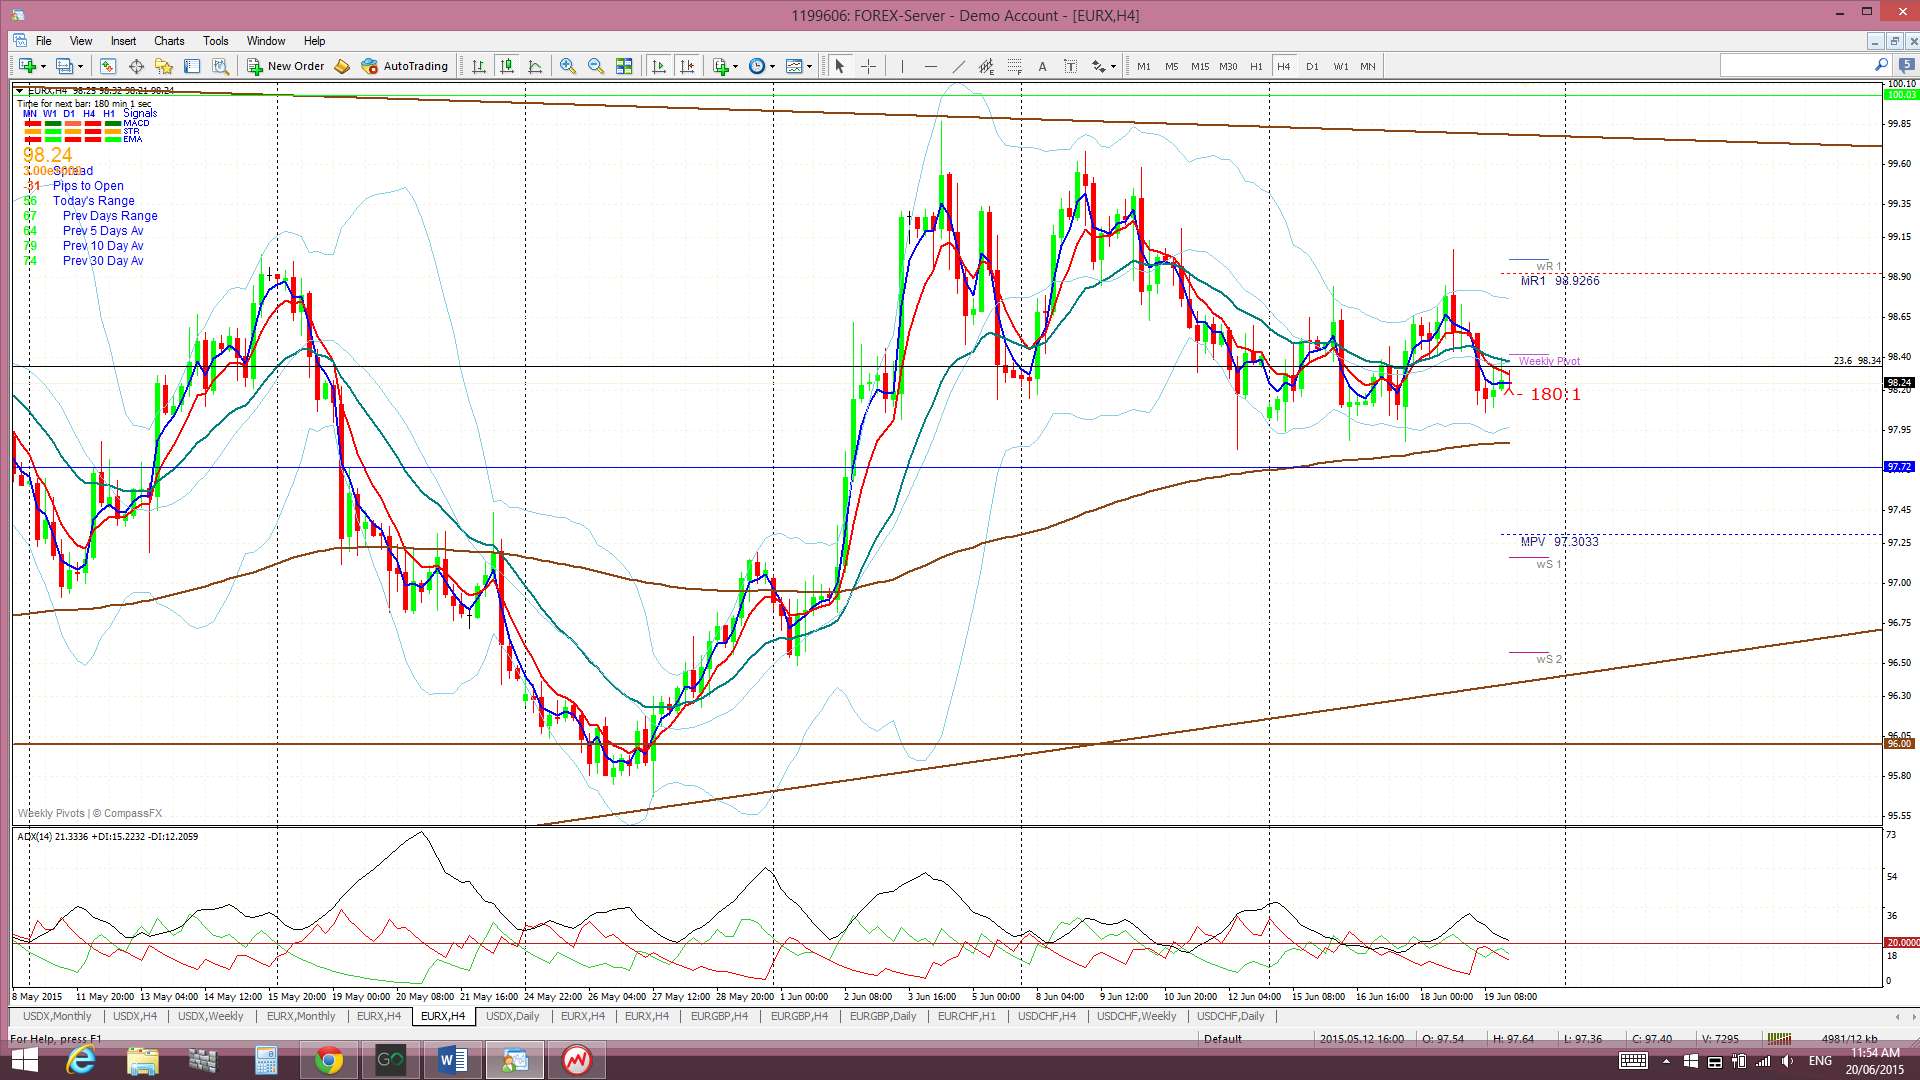
4 hr: Price chopped sideways to higher last week.
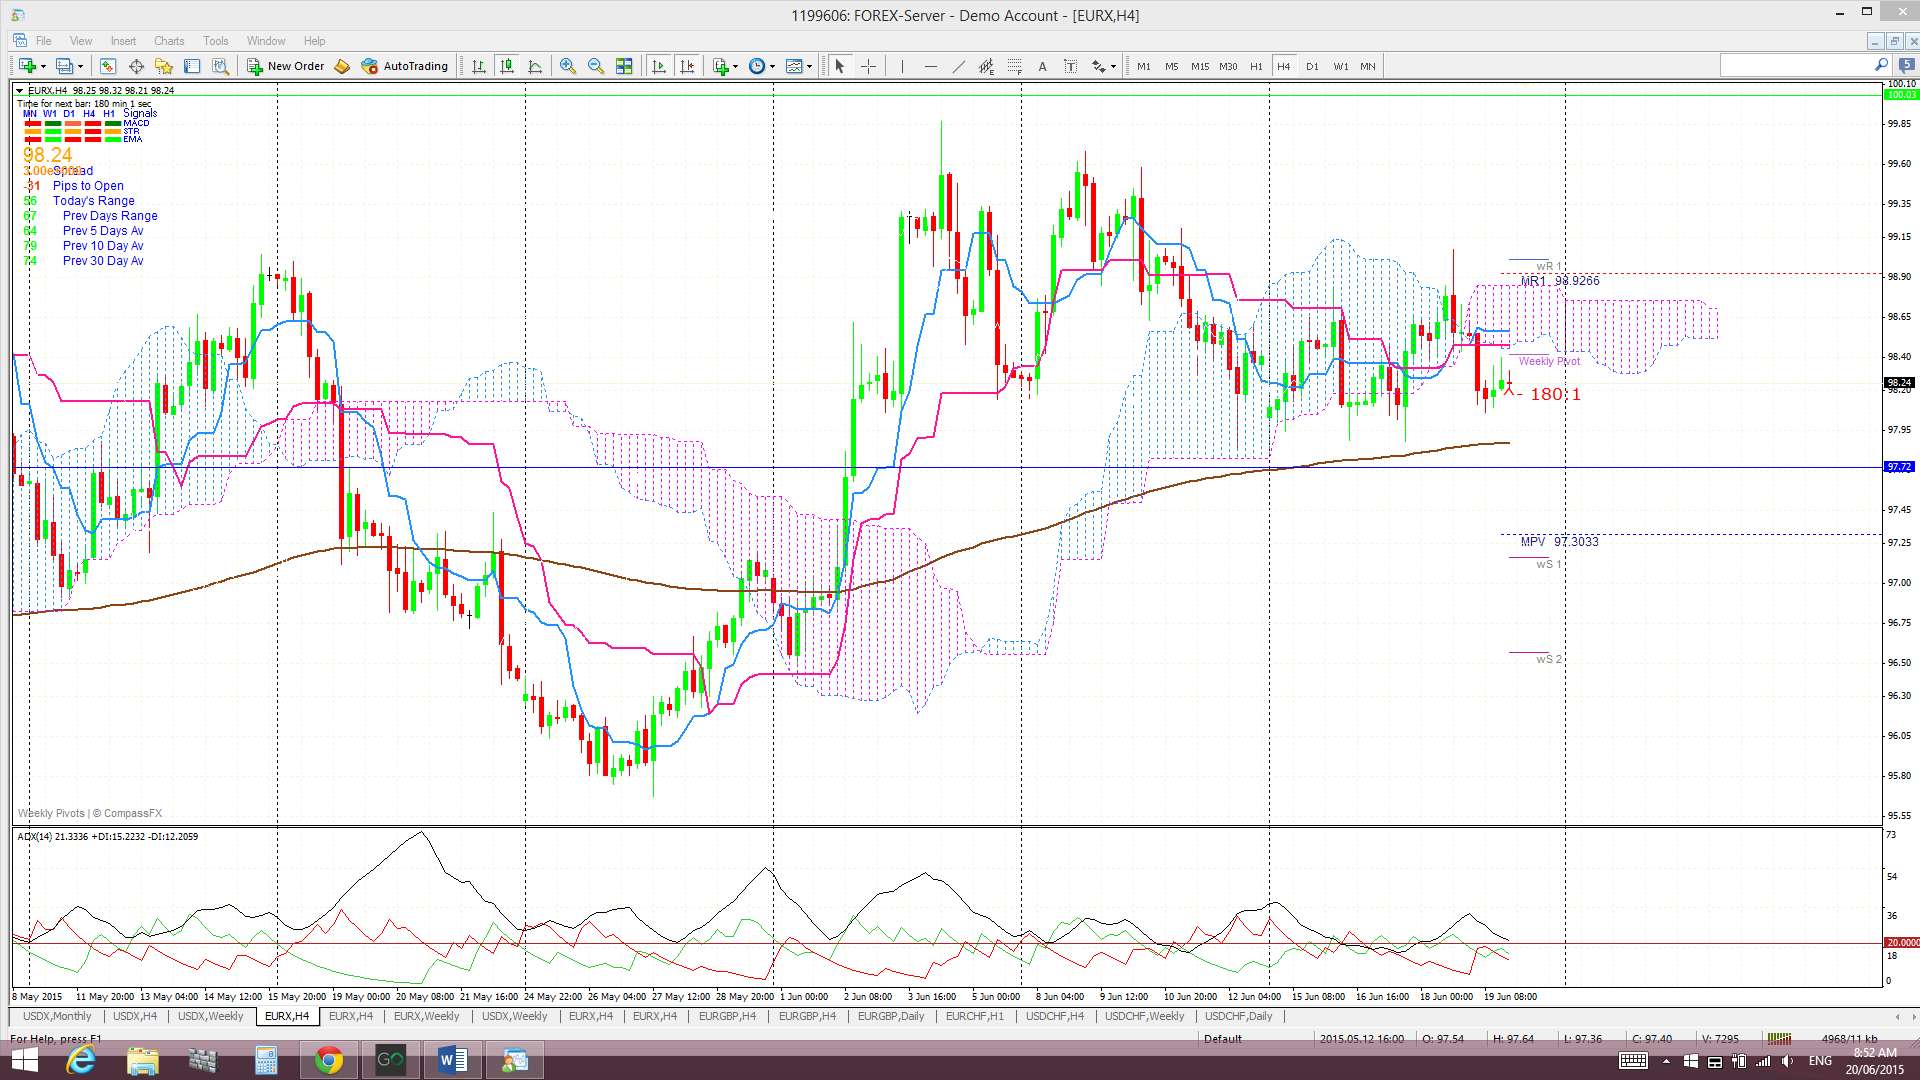
4 hr Ichimoku Cloud chart: The EURX traded within the 4hr Cloud for most of last week but ended up closing below the Cloud. This chart is divergent from the daily chart for the time being and suggests choppiness.
Comments:
This week: Sunday 21st June may be the longest day in the northern hemisphere due to the Summer Solstice but something tells me that Monday 22nd is going to be a long and much more pivotal day for not only those in the northern hemisphere but for those in the South as well. Monday has been scheduled for an emergency Eurogroup meeting to try and negotiate the current Greek-debt impasse but there is mention that leaders may meet over the w/e as well. June 30th remains the deadline for Greece to honour its IMF loan repayment but without any new bail-out package and debt solution Greece will default on this payment. A default and Grexit would have implications for markets throughout the world, not just Europe.
USDX: The US$ had a bearish week following a more dovish than expected FOMC and weak CPI and even upbeat US employment and manufacturing data did little to lift its spirits. Price action was unable to get back above the key 95.50 S/R level and also broke down below a recent support trend line and, at this rate, looks to be headed down towards 92.50 which is the bottom level of the recent 100 – 92.50 trading range. Any break and hold below this 92.50 level would suggest further bearish follow-through action.
For me, though, the US$ is still in no-man’s land whilst it trades above 92.50 and below 100. I am waiting for a decisive breakout from this region to signal the next major directional move on the index as this choppy and range-bound price action has gone on for over three months.
Thus, the levels to watch on the USDX are:
- The psychological 100 level above current price. This is the top of the recent trading range.
- The 92.50 level below current price. This is the bottom of the recent trading range.
EURX: The EURX closed a bit higher last week and continues to hold above key 96 support despite the ongoing Greek-debt crisis. This support level would need to be broken to be confident of failure with this EURX recovery attempt.
The hold above 96 is helping to shape a monthly-chart ‘Double Bottom’ pattern but there is also a conflicting weekly chart ‘Bear Flag’ pattern forming up and so trend line breaks will need to be monitored to help determine which, ultimately, is the correct pattern.
The main focus for the EZ at the moment continues to be the Greek-debt situation and negotiations between Greece and its creditors continue next Monday. The fact that the Eurozone is entering a monetary easing cycle and the US is emerging from one seems to have been quite forgotten for the time being with all the focus being on Greece! Monday’s Greek-debt related news events have the potential to trigger a breakout from the triangle pattern building on the weekly EURX chart so watch trend lines for any momentum based breakout move.
A Greek default would, no doubt, trigger wild market swings BUT there is as much trading commentary suggesting that this outcome would be longer-term bullish for global equity and currency markets as suggesting otherwise! On the other hand, any reasonable debt-crisis solution would most likely trigger a relief rally and so, quite perversely I might add, there seems more potential for market bias to the upside out of all this tragedy!
The levels to watch on the EURX remain as:
- The 105.5 level: The weekly chart reveals that a 61.8% fib retracement of the recent lengthy bear move is back up near the 105.50 level and weekly 200 EMA. Any hold back above 96 and continued recovery effort might see the index target this region.
- The 96 level: This is a major support level for the EURX and is helping to form up a possible bullish ‘Double Bottom’.
- The 94 level: Any break and hold back below 96 might suggest bearish continuation as it represents a break of the monthly charts ‘Double Bottom’. If so, the recent low printed near 94 will come back into focus.
Note: The analysis provided above is based purely on technical analysis of the current chart set ups. As always, Fundamental-style events, by way of any Ukraine, Ebola, Eurozone or Middle East events and/or news announcements, continue to be unpredictable triggers for price movement on the indices. These events always have the potential to undermine any technical analysis.
The post Two Solstice moments for the Eurozone this week? appeared first on www.forextell.com.