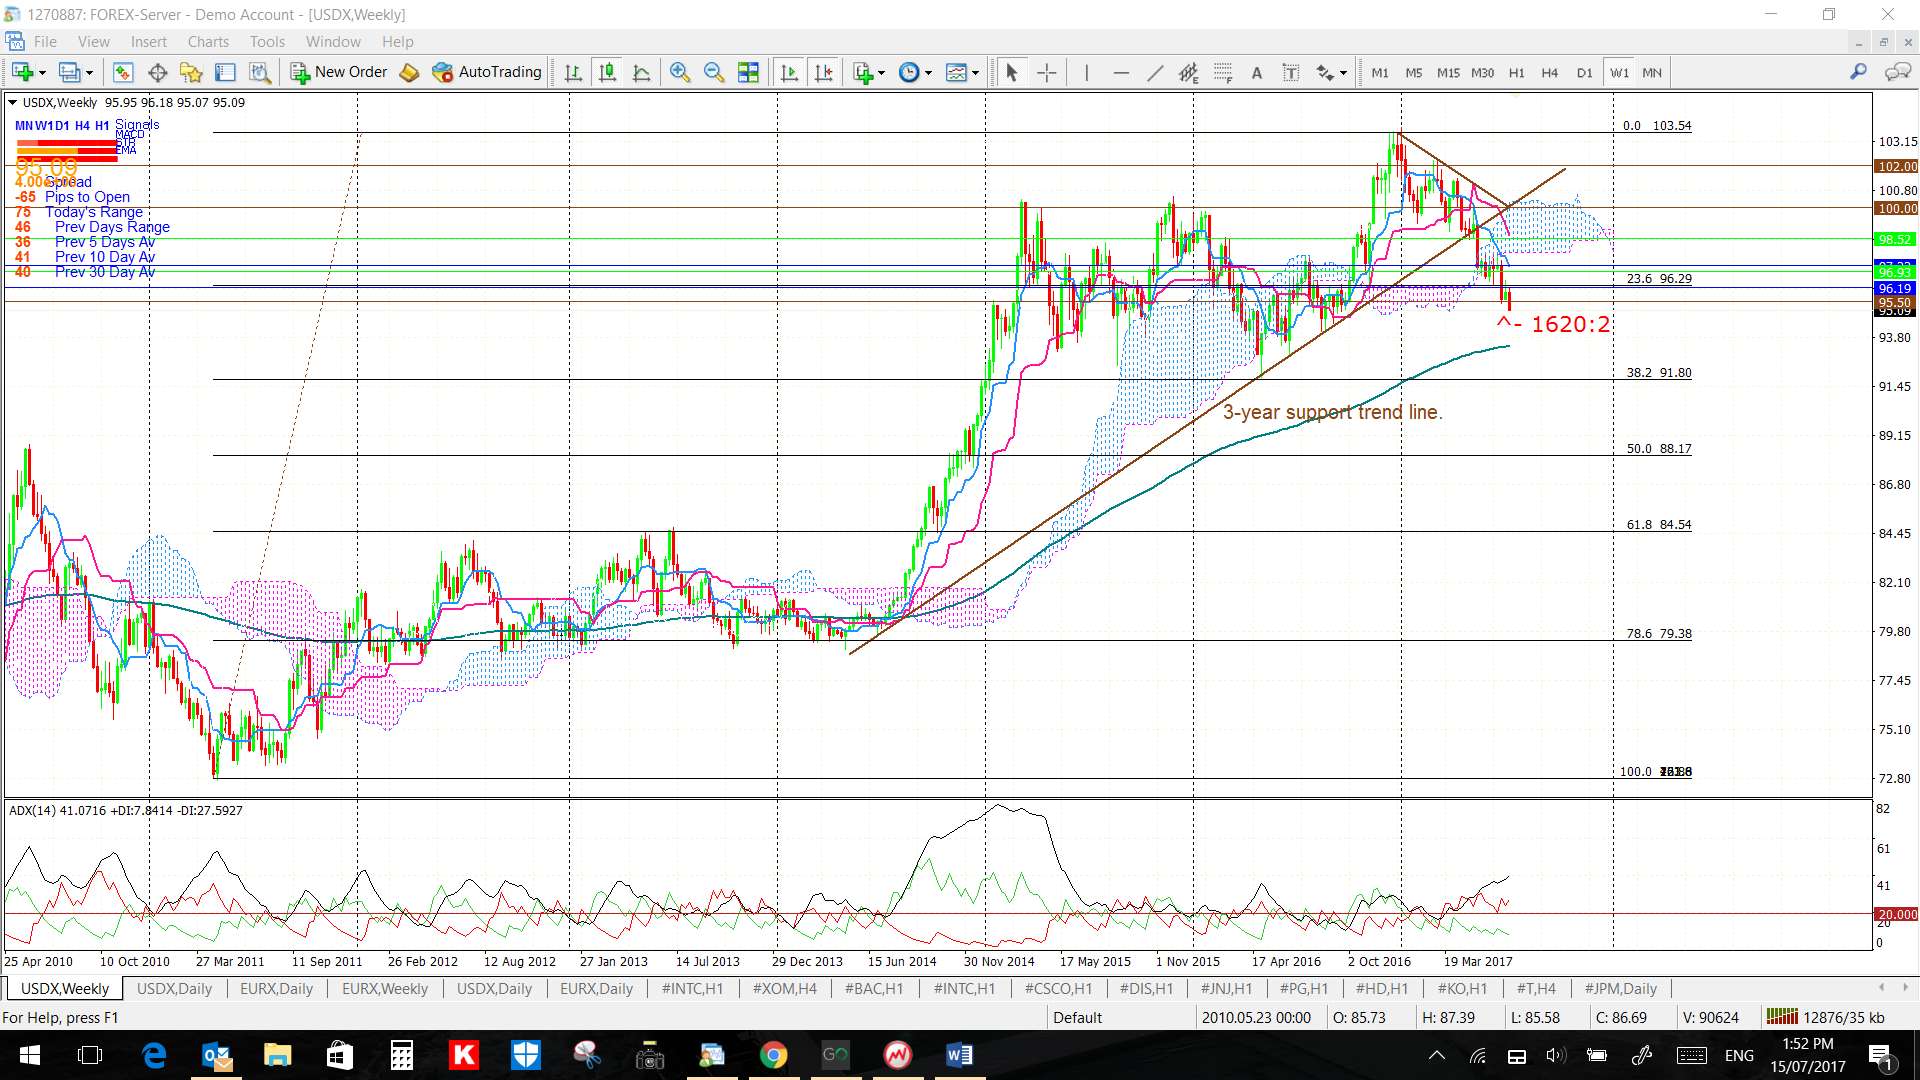
The US$ has finally broken down below the key S/R level of 95.50 and looks set to be headed for some mean reversion. US$ Bulls can relax for a bit longer though.
USDX weekly: The US$ index has held below the broken 3-year support trend line and weekly Ichimoku Cloud and has now broken down through the 95.50 S/R level. This weakness is contrary to the mantra being propagated by US$ Bulls but some mean-reversion would not be out of order here, even if there is going to be longer-term appreciation. In fact, technical theory would suggest that this US$ uptrend is intact until such time as it breaks and holds below the 61.8% fib of the most recent swing high and this level is down near 85. That means that US Bulls can keep singing from their current hymn sheet all the way down to 85!

Keep watch of the following levels in coming sessions:
- the 95.50: watch to see if this area, that until recently has been Support, becomes Resistance.
- the bottom trend line of the symmetrical wedge pattern.
- the 50% Fibonacci level; down near 88.
- the 61.8% Fibonacci level; down near 85.

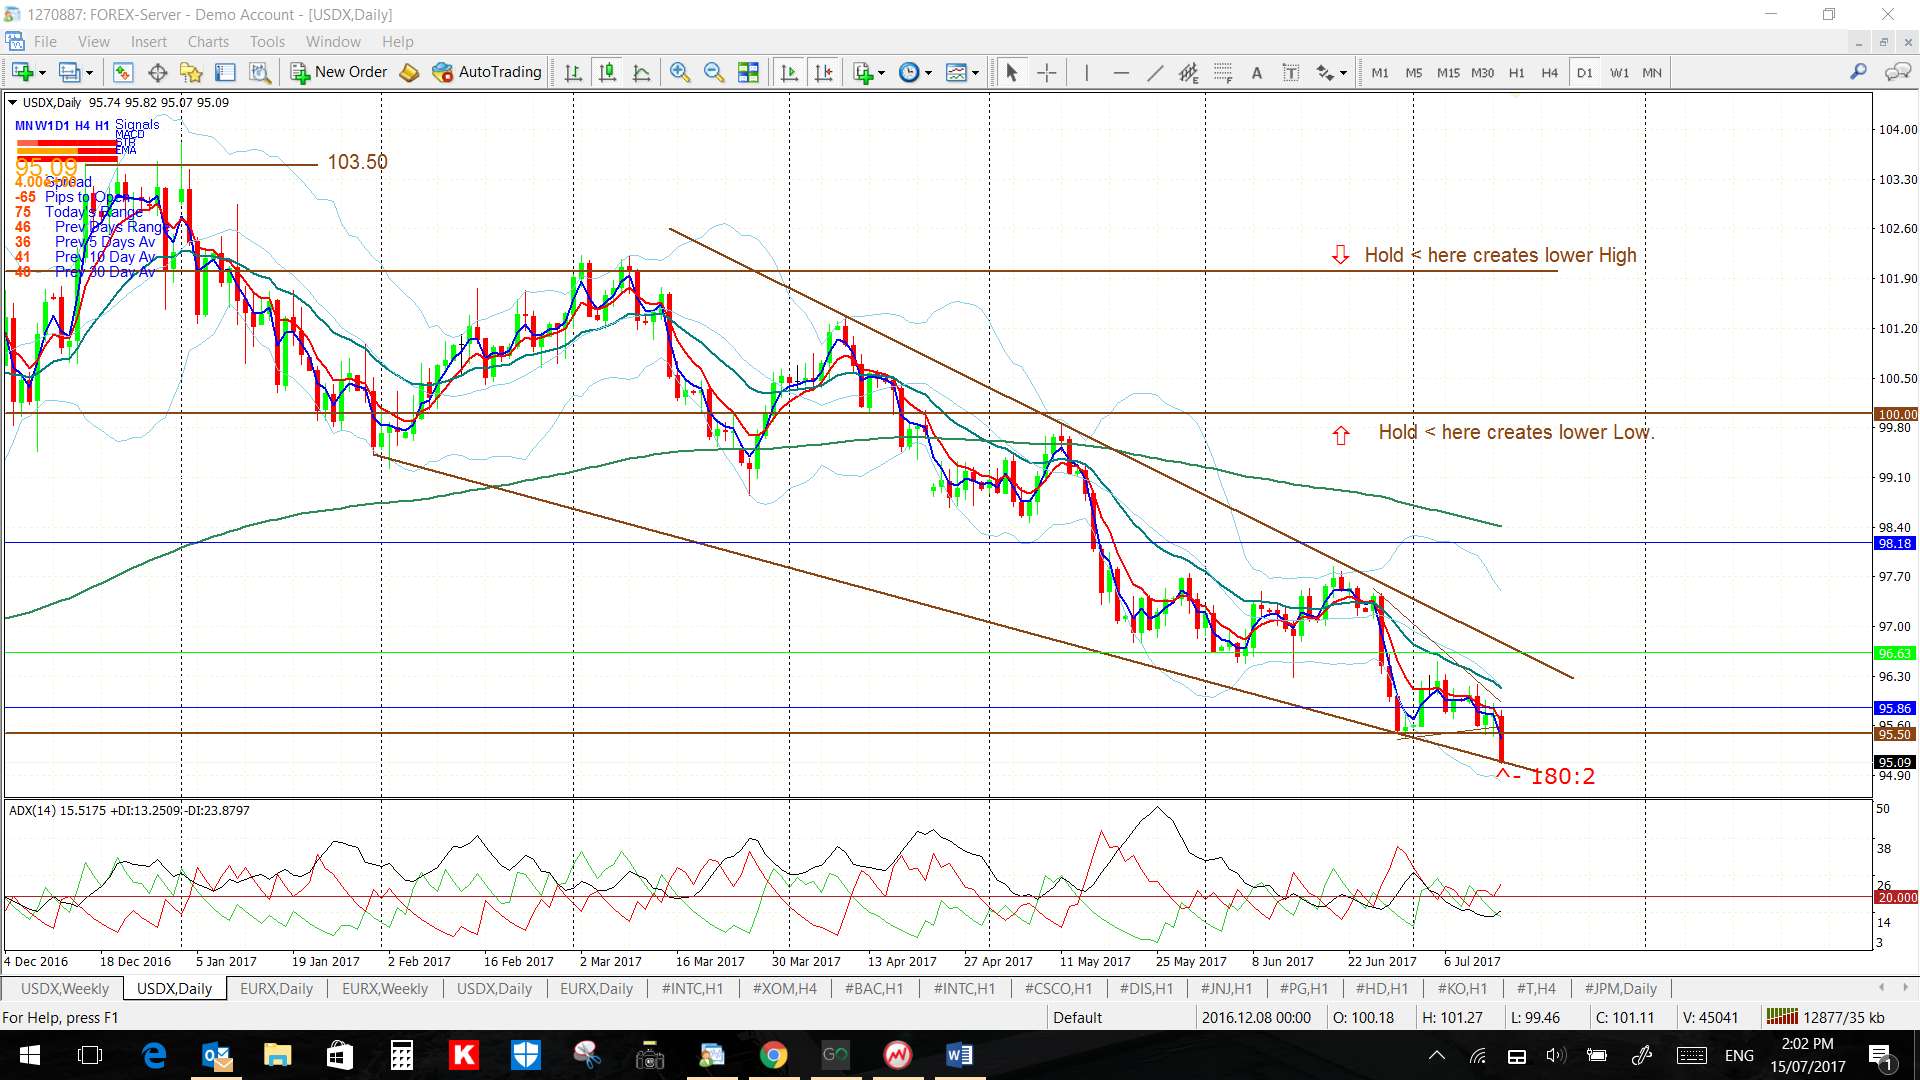
USDX daily: However, just watch to see if this recent support trend line acts as any support at all:
EURX weekly: the EUR$ index had a bearish week too, although not as bad as the US$:
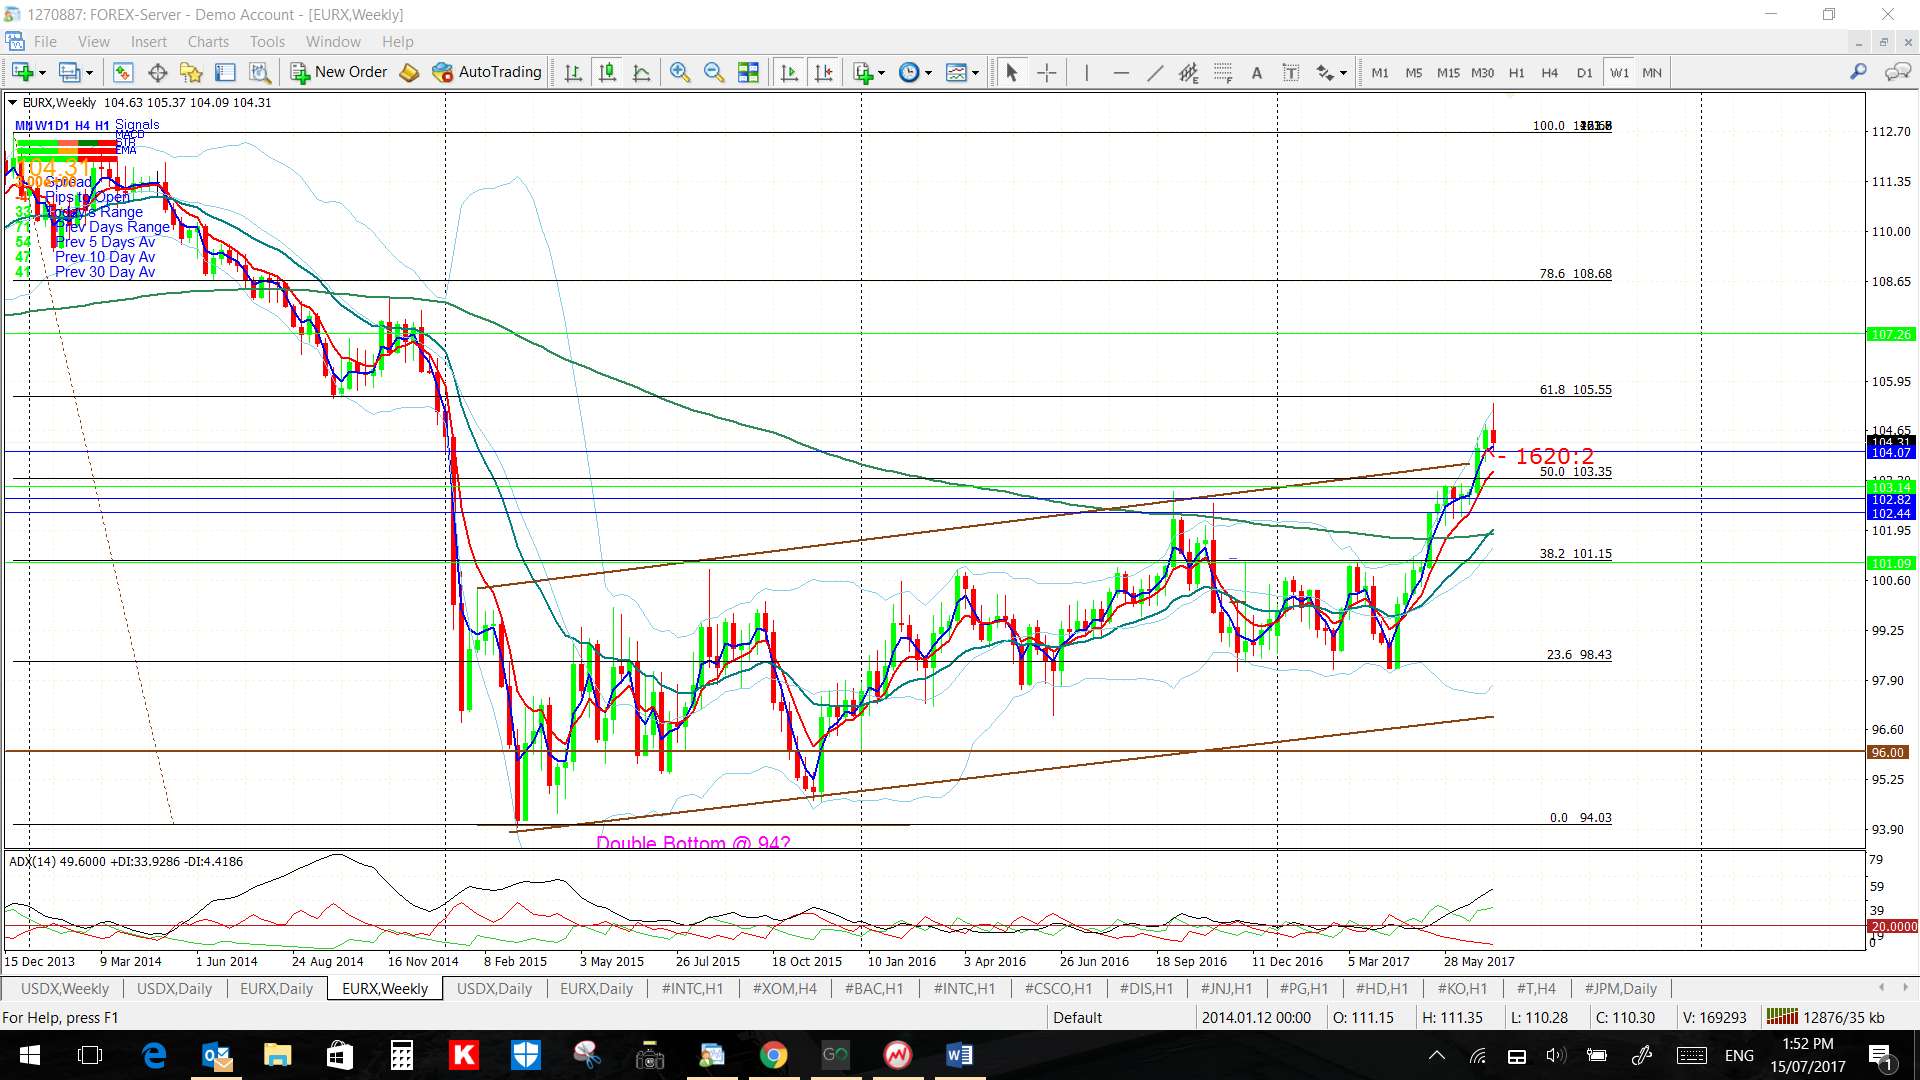
FX Index Alignment: The FX Indices are not aligned just at the moment but any renewed EUR$ strength would tip them back into alignment for ‘risk on’. I’ll keep an eye on this next week.
Calendar: the main item for next week is the ECB rate update:
