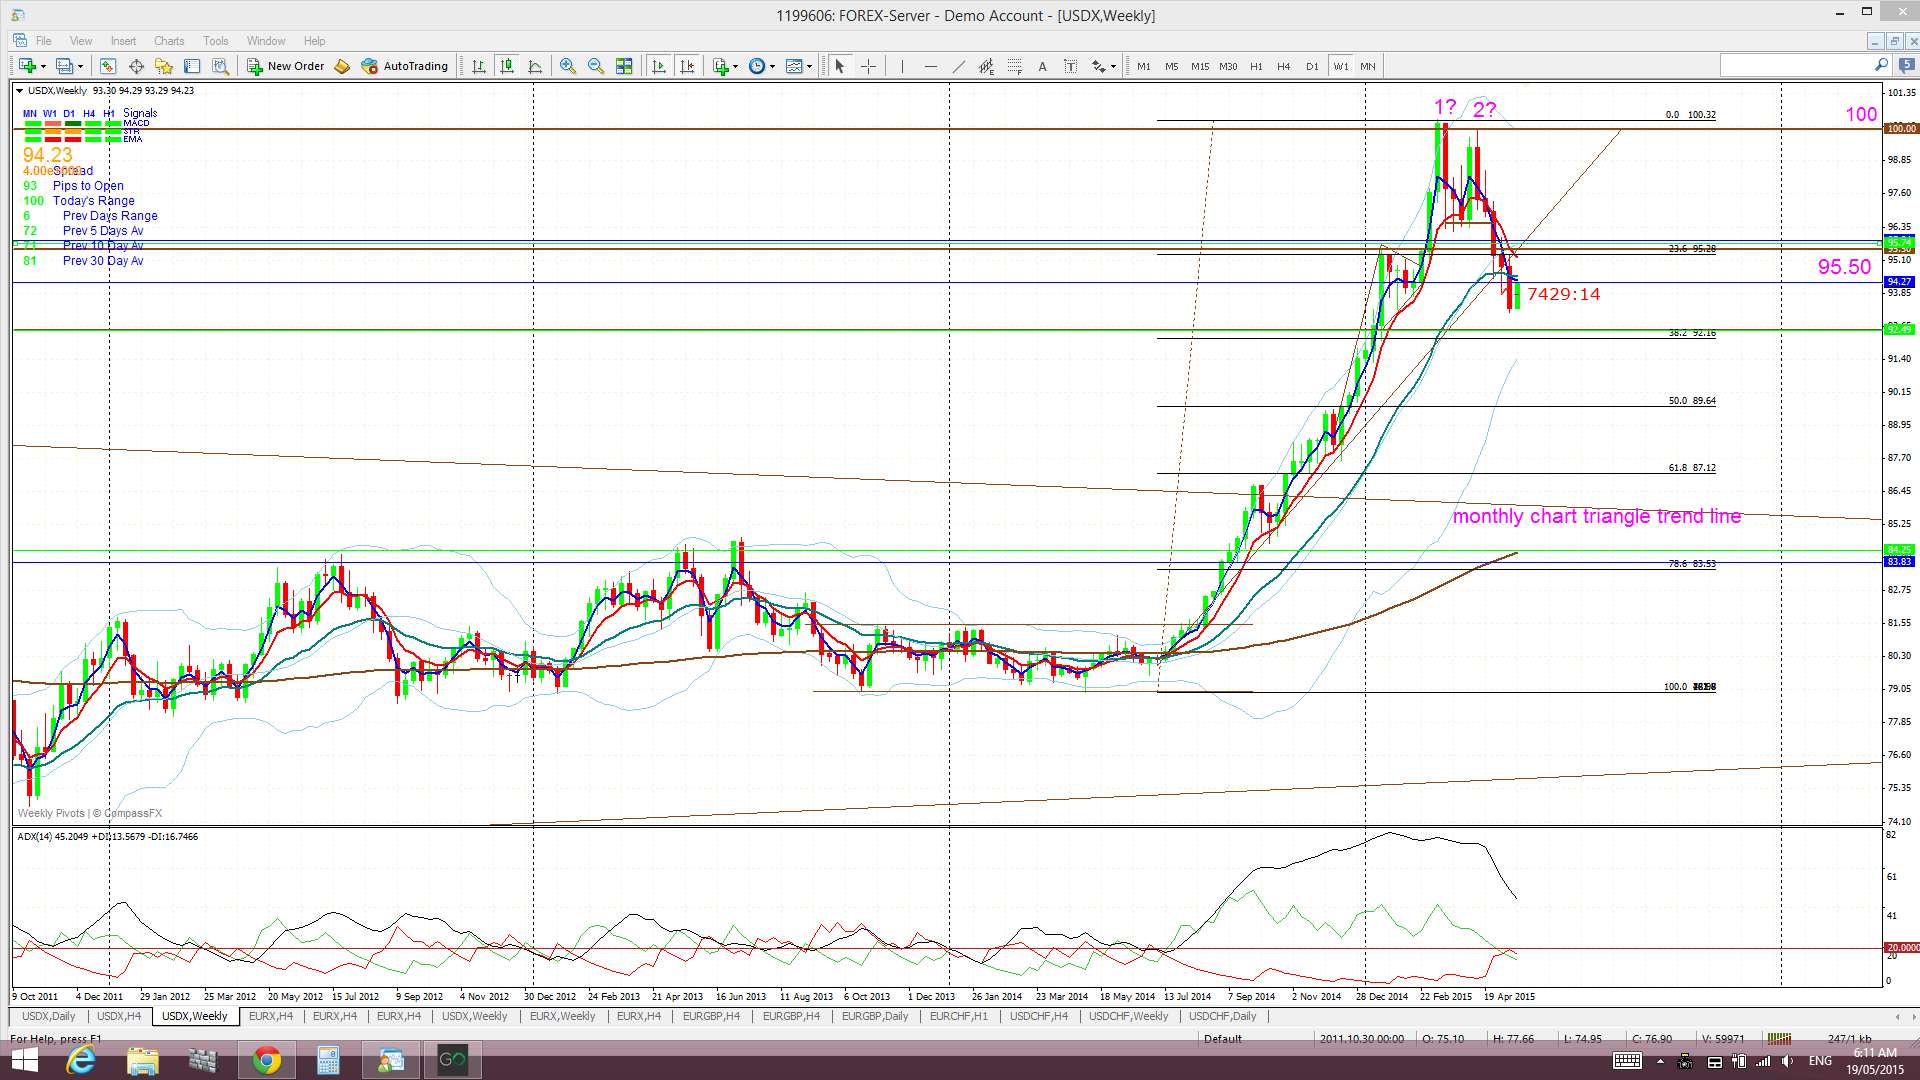
The US$ has recovered a bit to start the week but, in the absence of any high impact news and with a Fed speech arguing for the rate hike to start next year, I’m wondering if this is simply a technical move to test the strength of resistance from the recently broken trend line? It might take until Wednesday’s FOMC minutes to help clear up this indecision.
USDX weekly: broken trend lines are often tested before follow through moves and I’m wondering if this is what we’re seeing here. This trend line has been in force for almost 12 months so you would expect a bit of a test to occur but any failure to break back above the trend line would support bearish continuation. Is anyone else starting to see a bigger H&S possibly brewing here too? I wouldn’t be loading up on any long US$ positions unless the index can break and hold back above this trend line:
EURX weekly: the possible H&S on the USDX had me checking this chart. It does look like a bit of a basing pattern here now and a bit of an inverse H&S can be seen brewing here:

S&P500: this index has closed at a record high today. Some of the FOMO action I had warned of seems to be appearing…..Fear of Missing Out! Note how the Tenkan/Kijun lines are now fused so watch for any new bullish T/K cross:

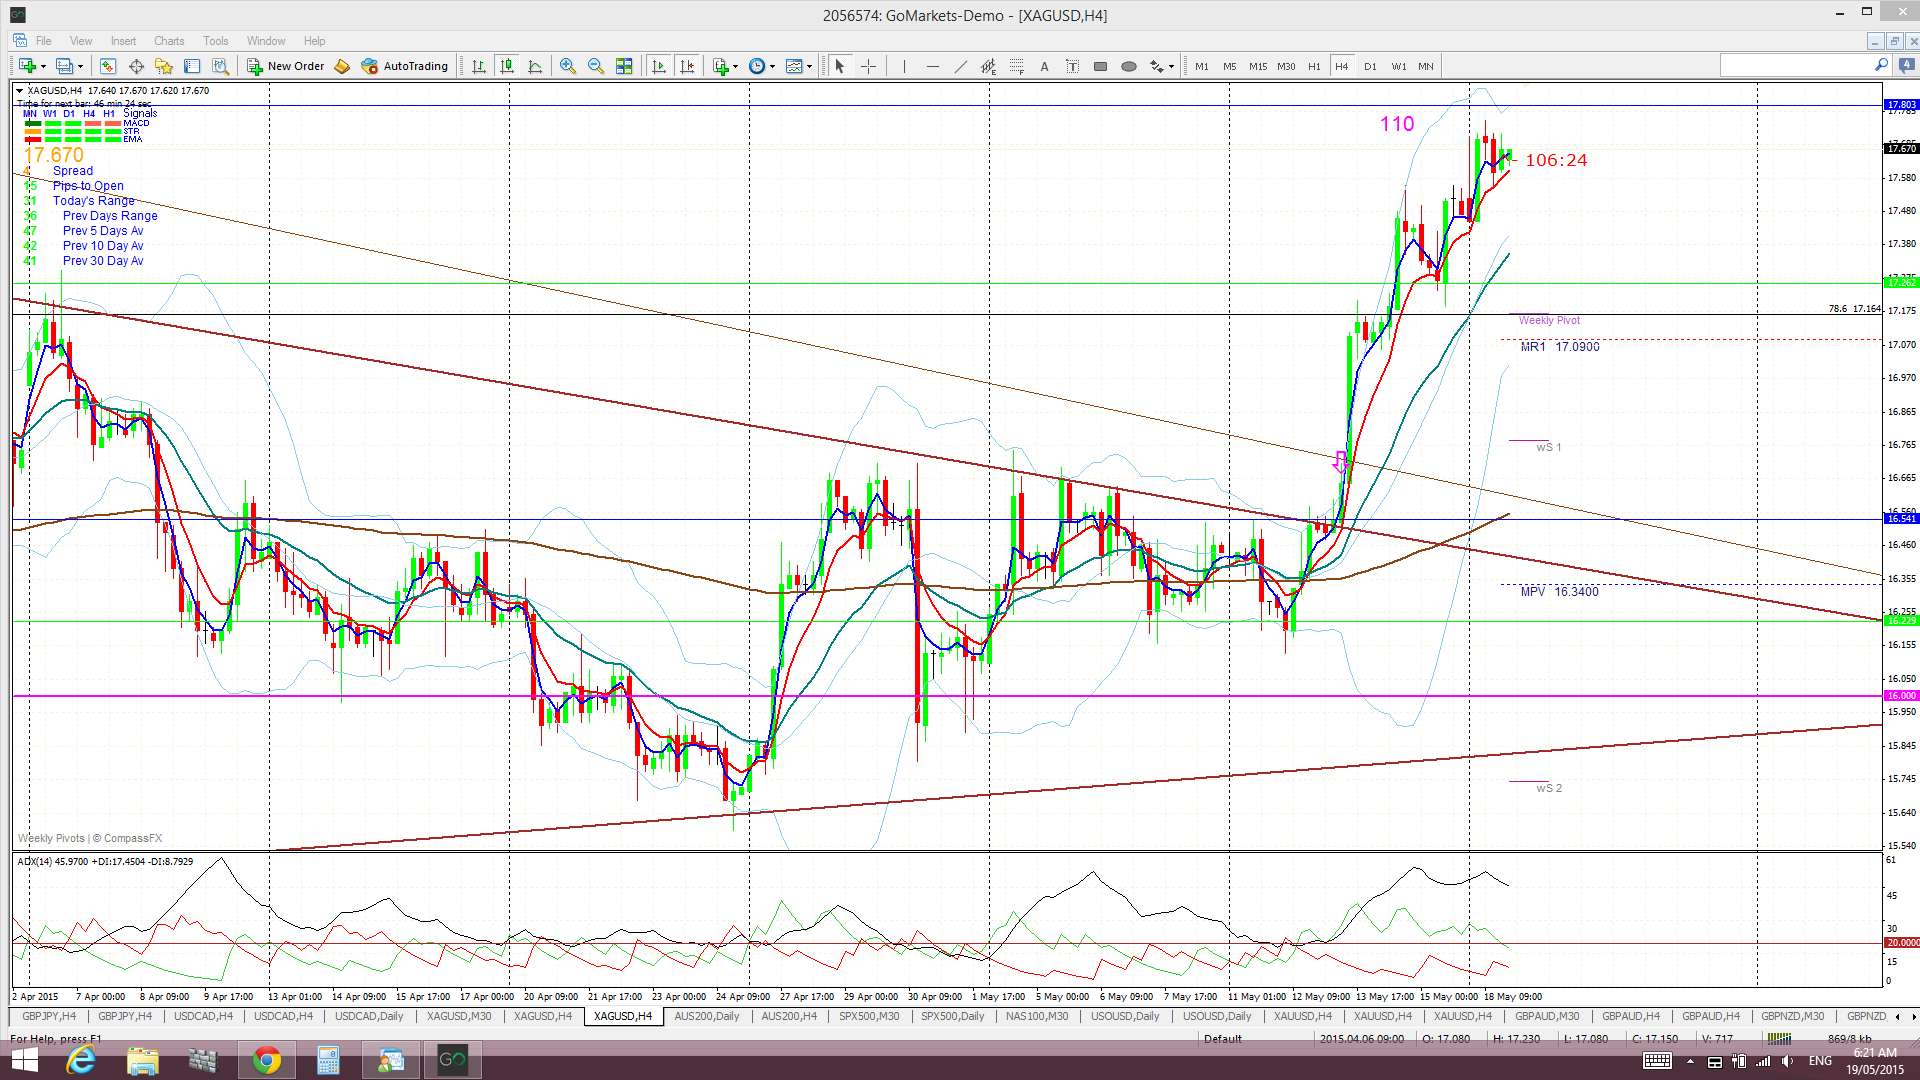
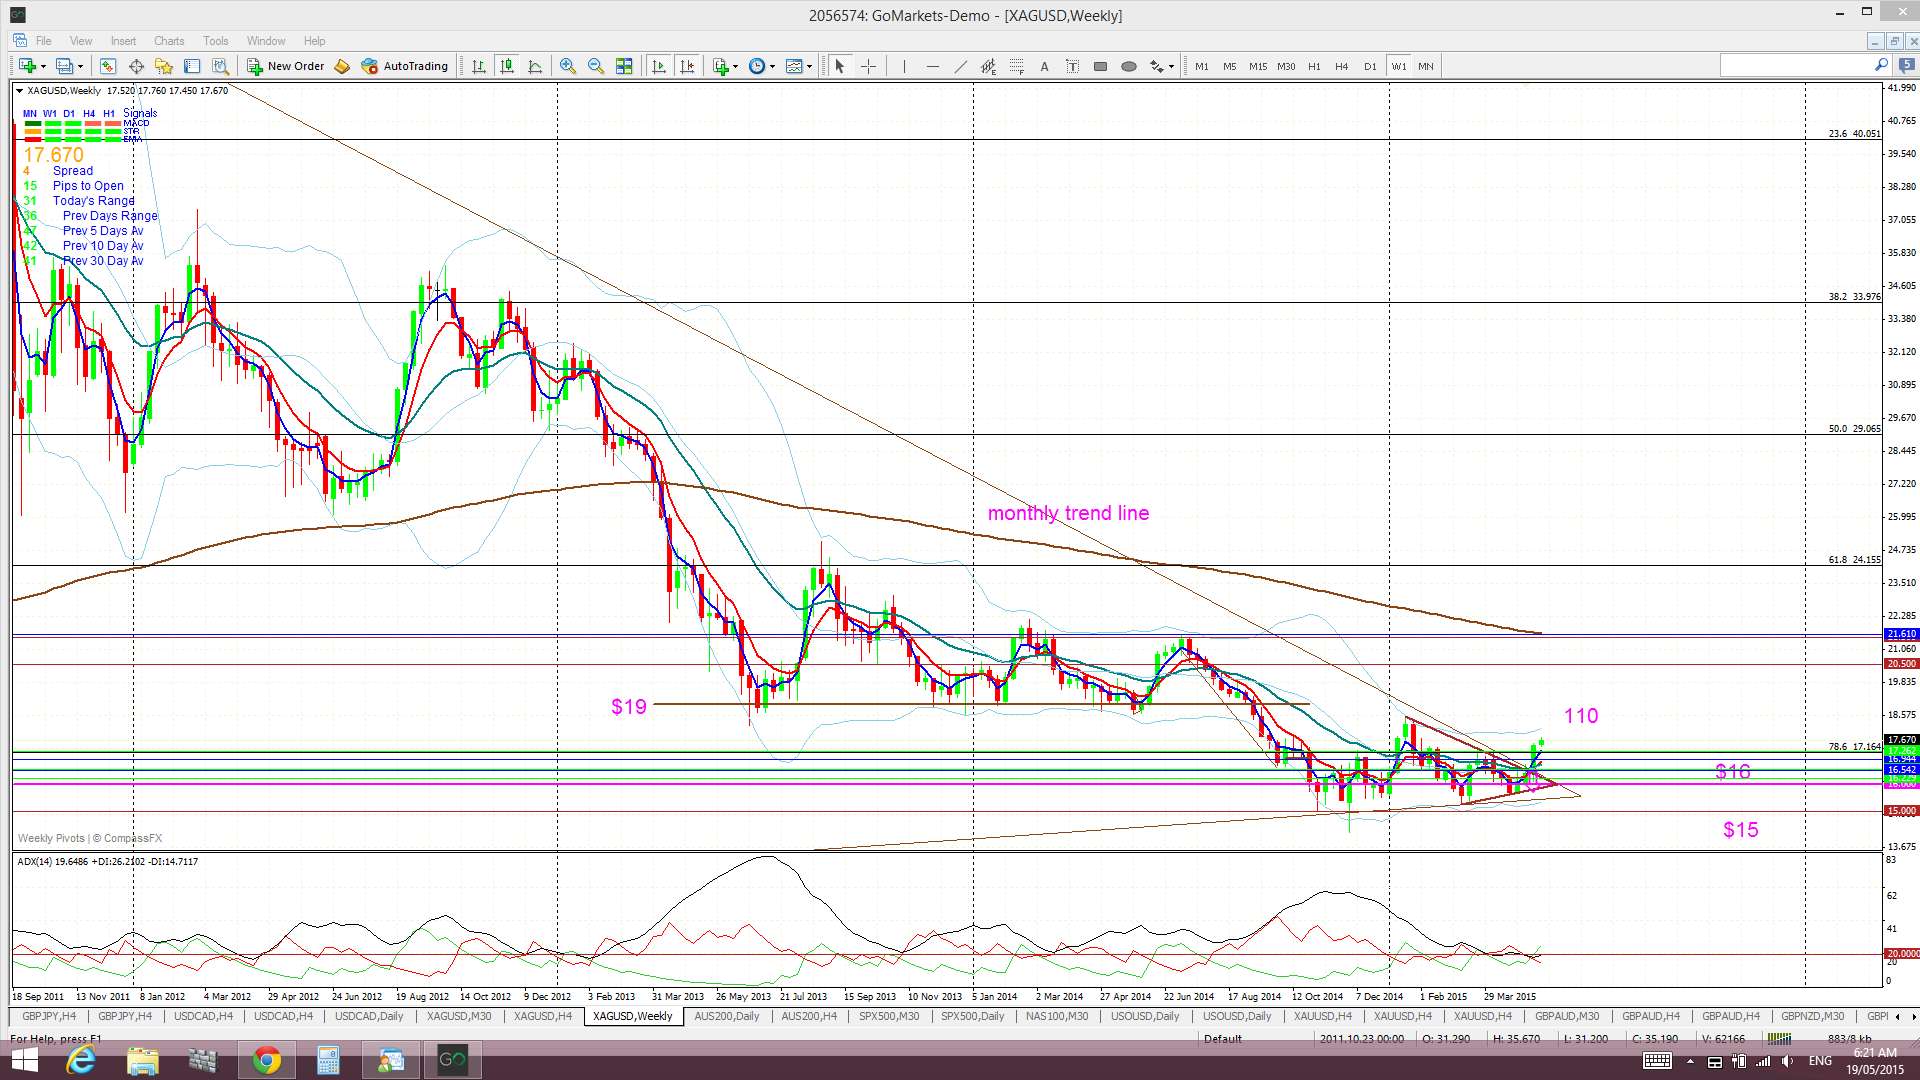
Silver: the TC signal is up over 100 pips here now. The weekly trend line remains broken supporting bullish continuation:
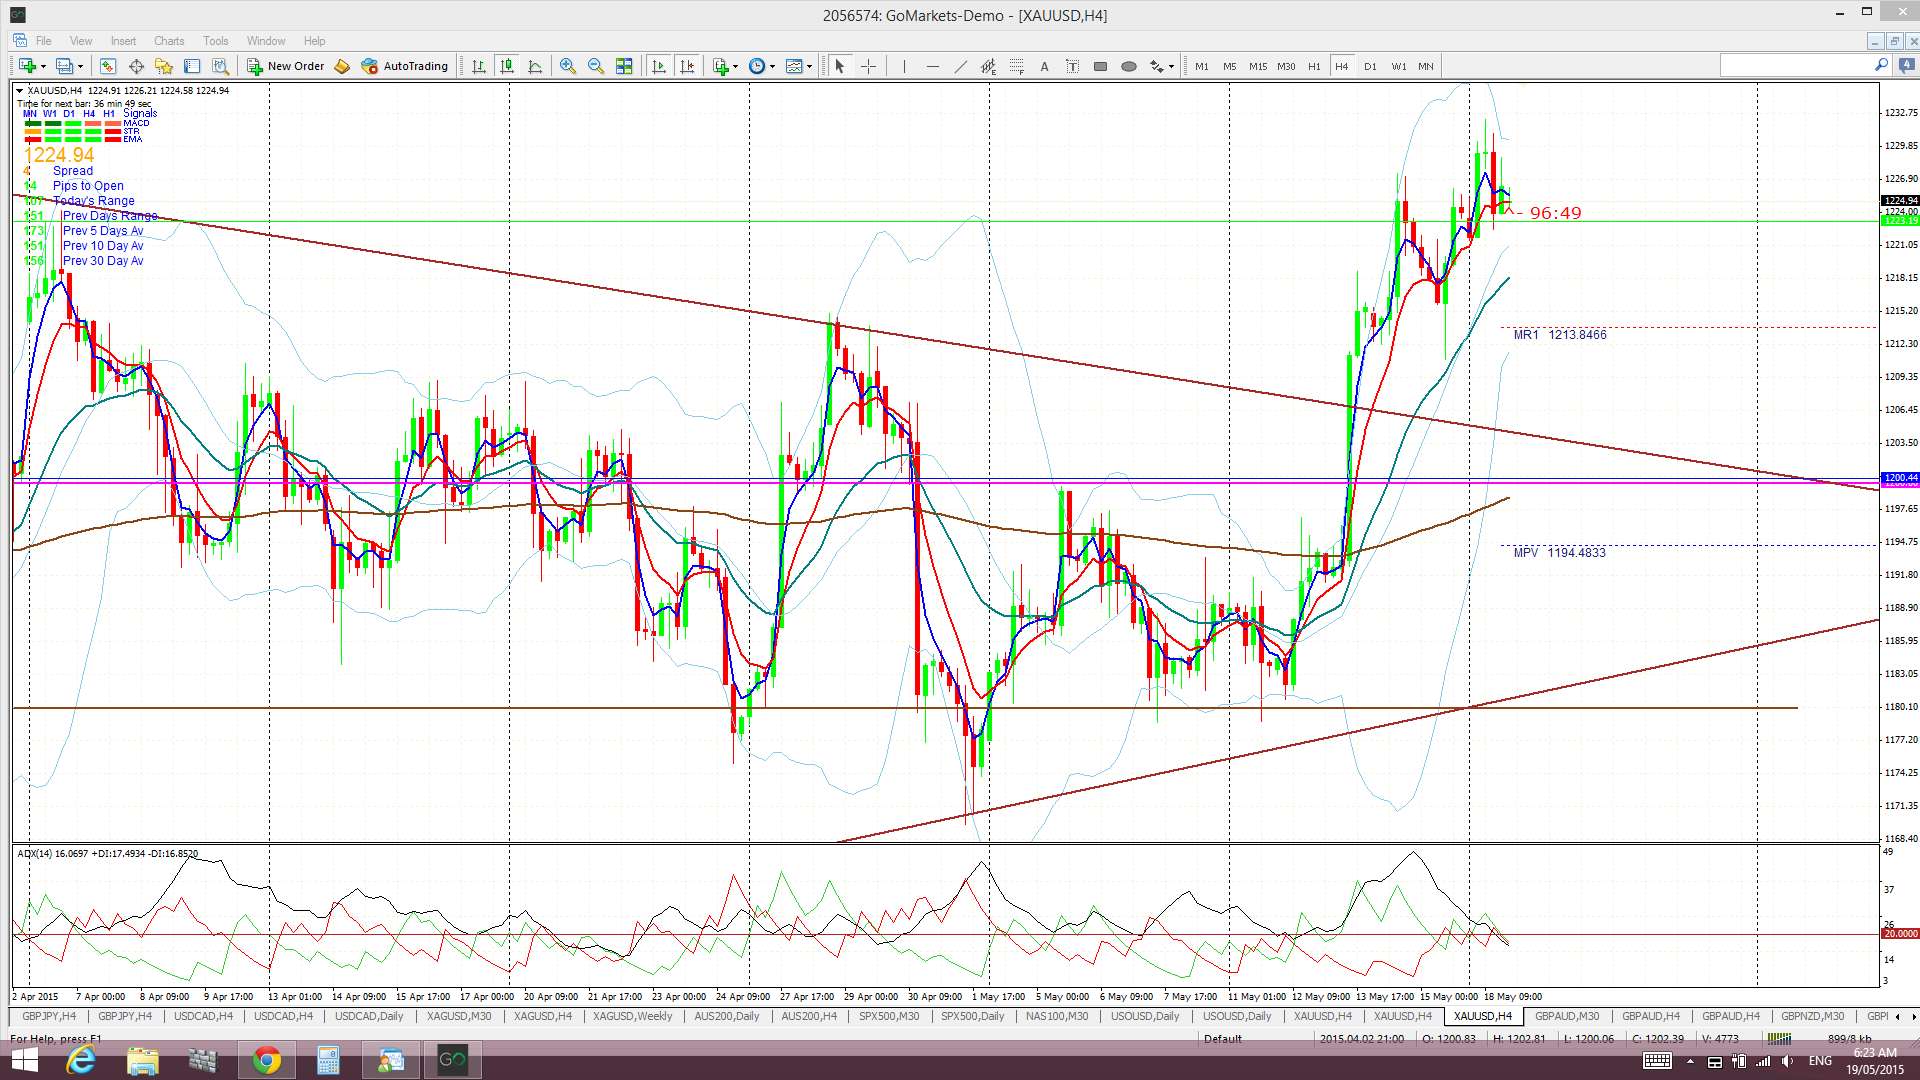
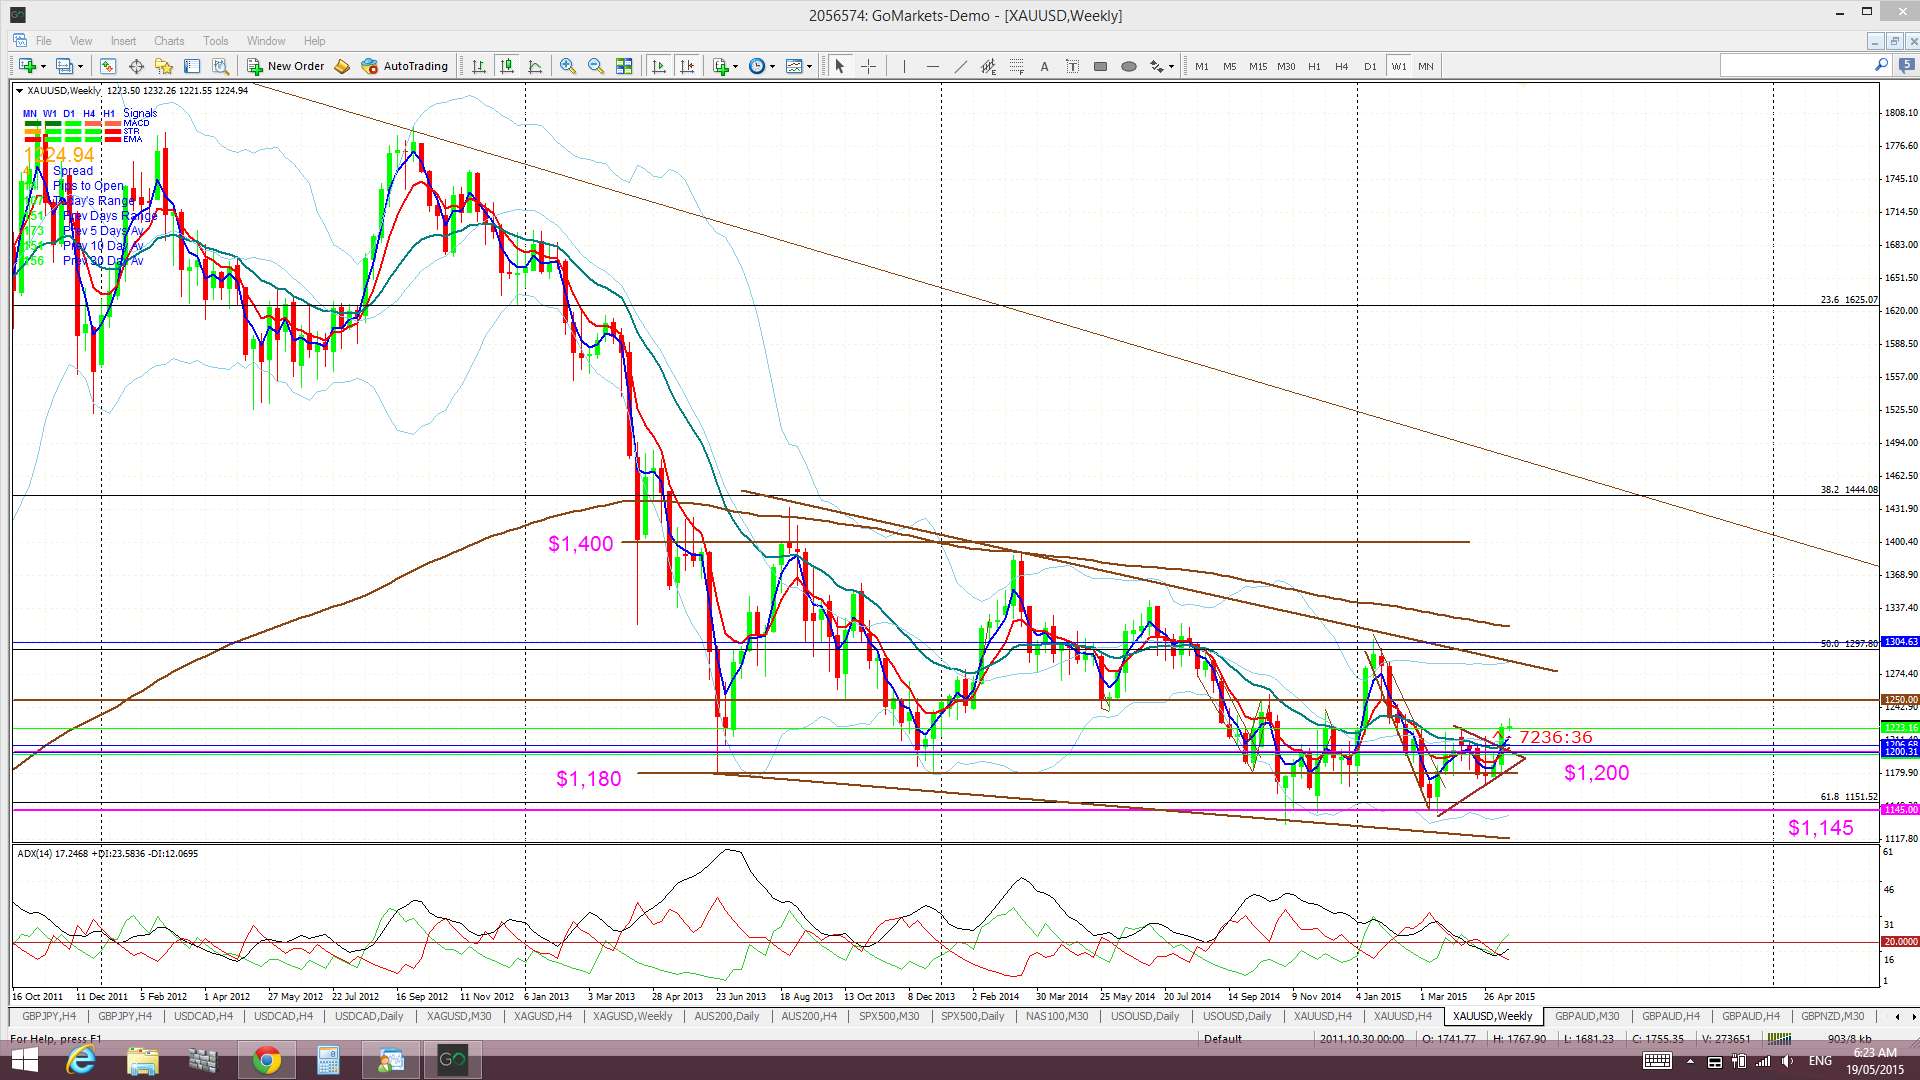
Gold: looks bullish too as it holds above $1,200. The weekly chart shows that the $1,250 level looks to be the next test:
TC Signals: the signals on the A/U and A/J closed off but the signal on Silver (as per above) is still open.
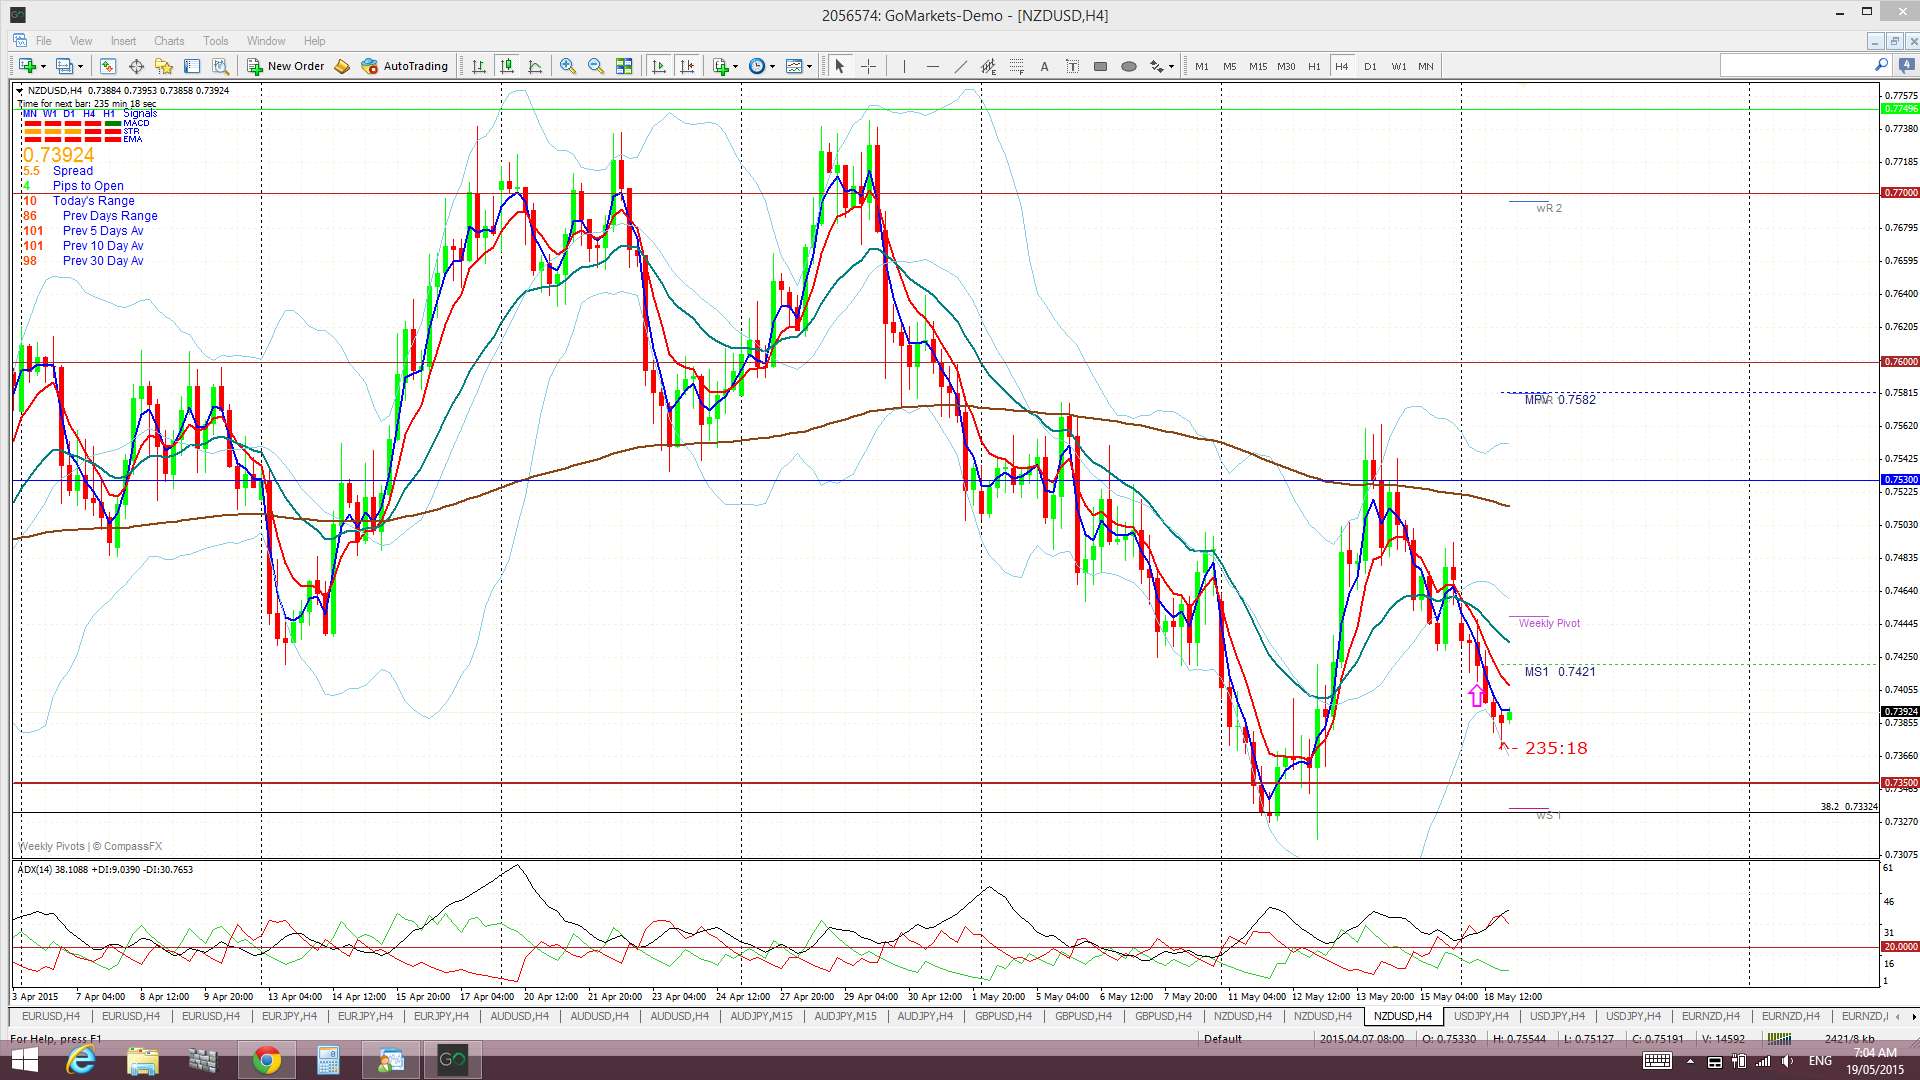
Kiwi 4hr: There was a new TC SHORT signal yesterday on the Kiwi BUT I’d rather see a break below 0.735 support before being confident of bearish momentum here. Also, there is high impact news later today for NZD Inflation Expectations:
Forex: IMHO: Traders of US$ based pairs really need to see whether the US$ can continue with its recovery before establishing new positions. There is US Building Permit data tonight to guide about any US housing recovery.
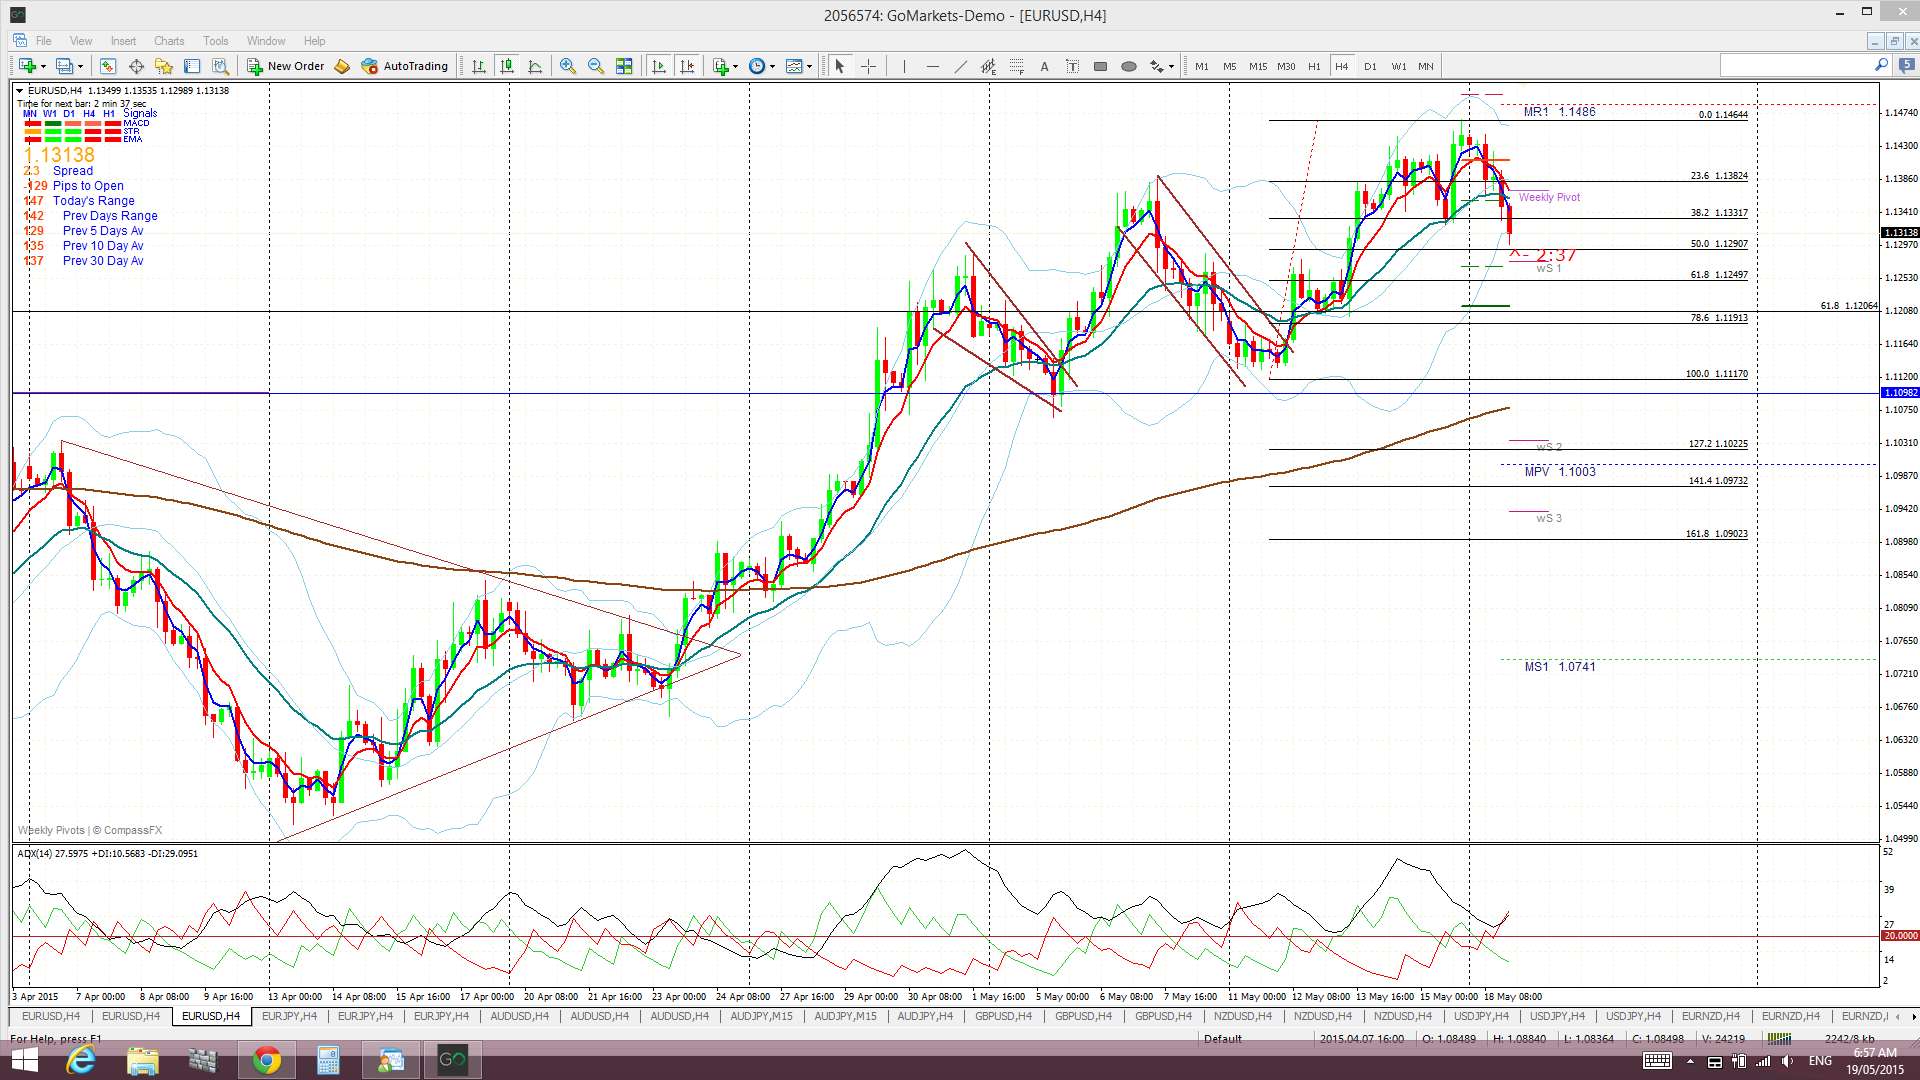
E/U: has tested the 50% fib of the recent swing high move. The US$ and the Greek debt situation weigh here. There is German ZEW Economic sentiment data later tonight as well as the US data to impact here:
E/J 4hr: this has pulled back to test the daily 200 EMA. A hold above this level would be bullish:
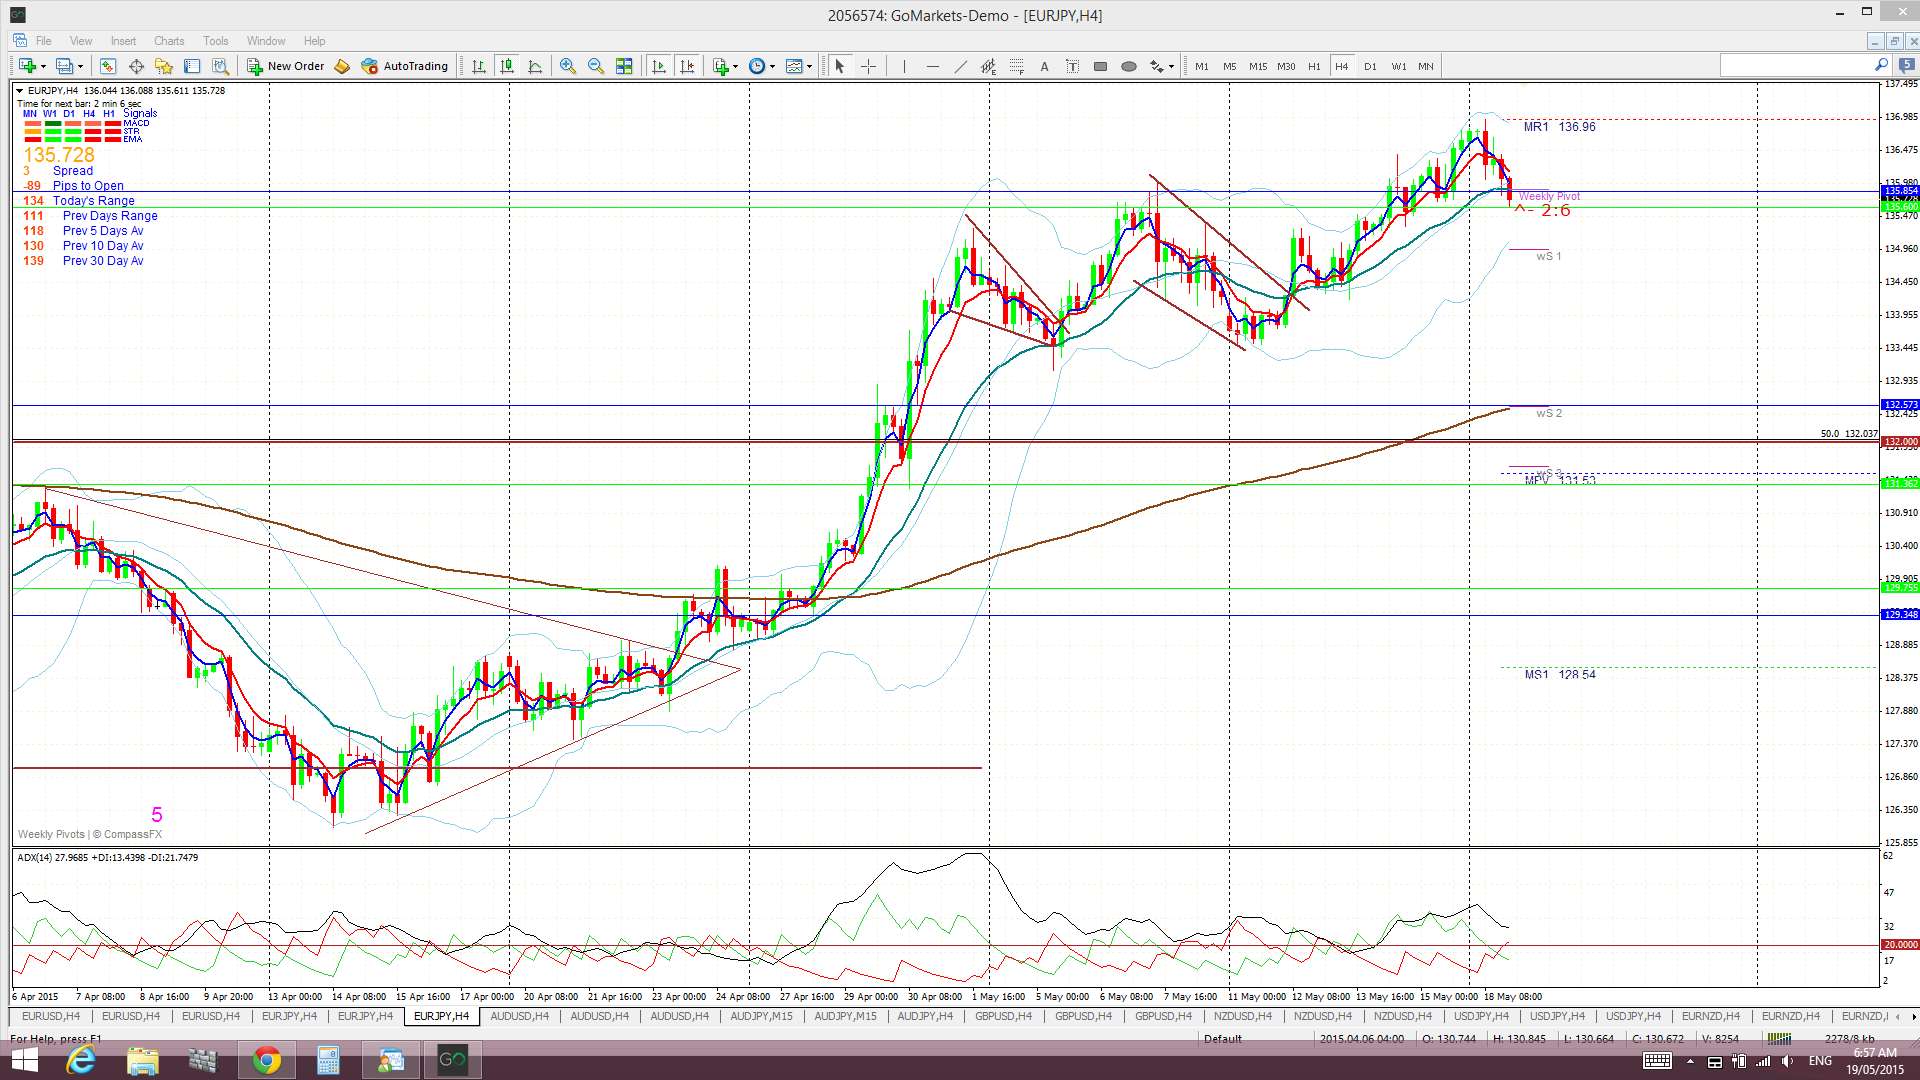
E/J daily: the daily 200 EMA is the level to watch here:

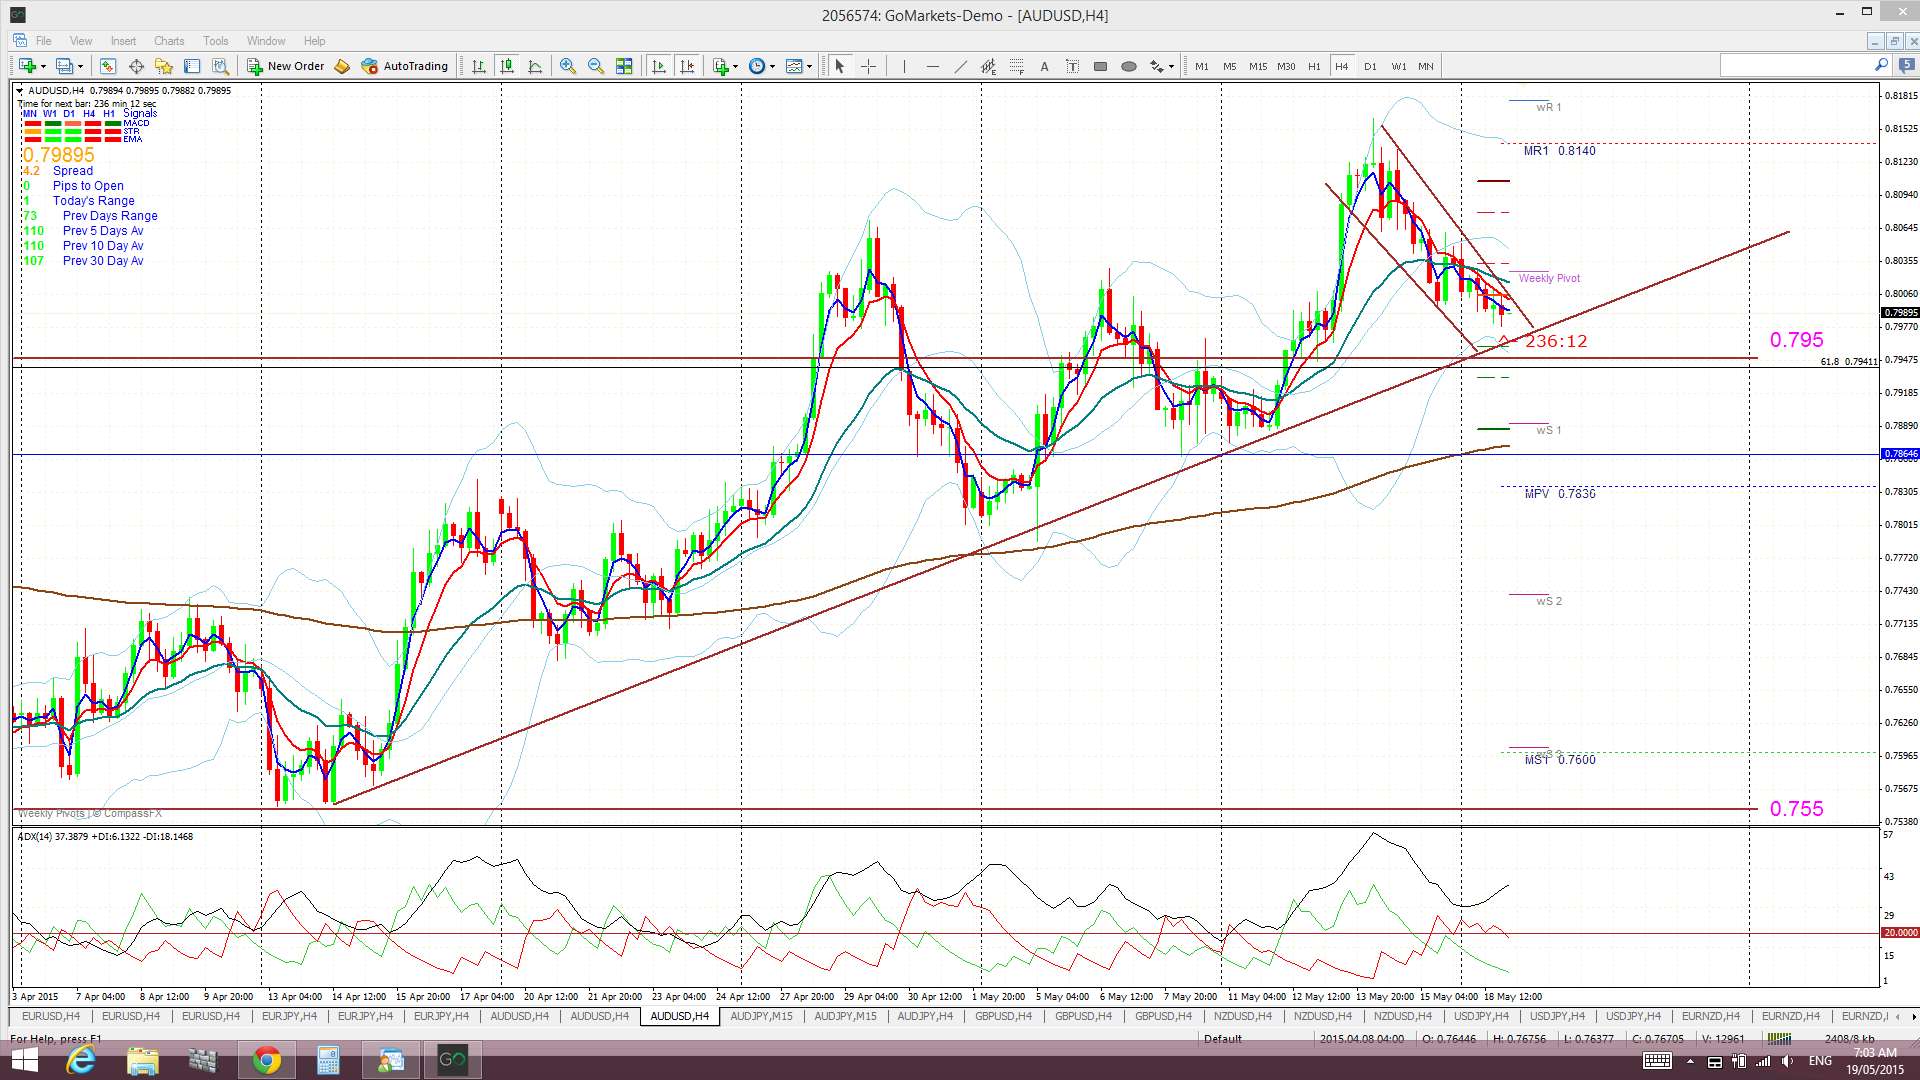
A/U: Today’s RBA Monetary Policy Minutes will impact here. There are trend lines to keep an eye on to help guide with breakout movement. Support may come from the tend line, the 0.795 level and, then, the 4hr 200 EMA.:
A/J 4hr: ditto here. Any break of the support trend line would bring the 0.94 and 0.93 levels into focus as possible support:

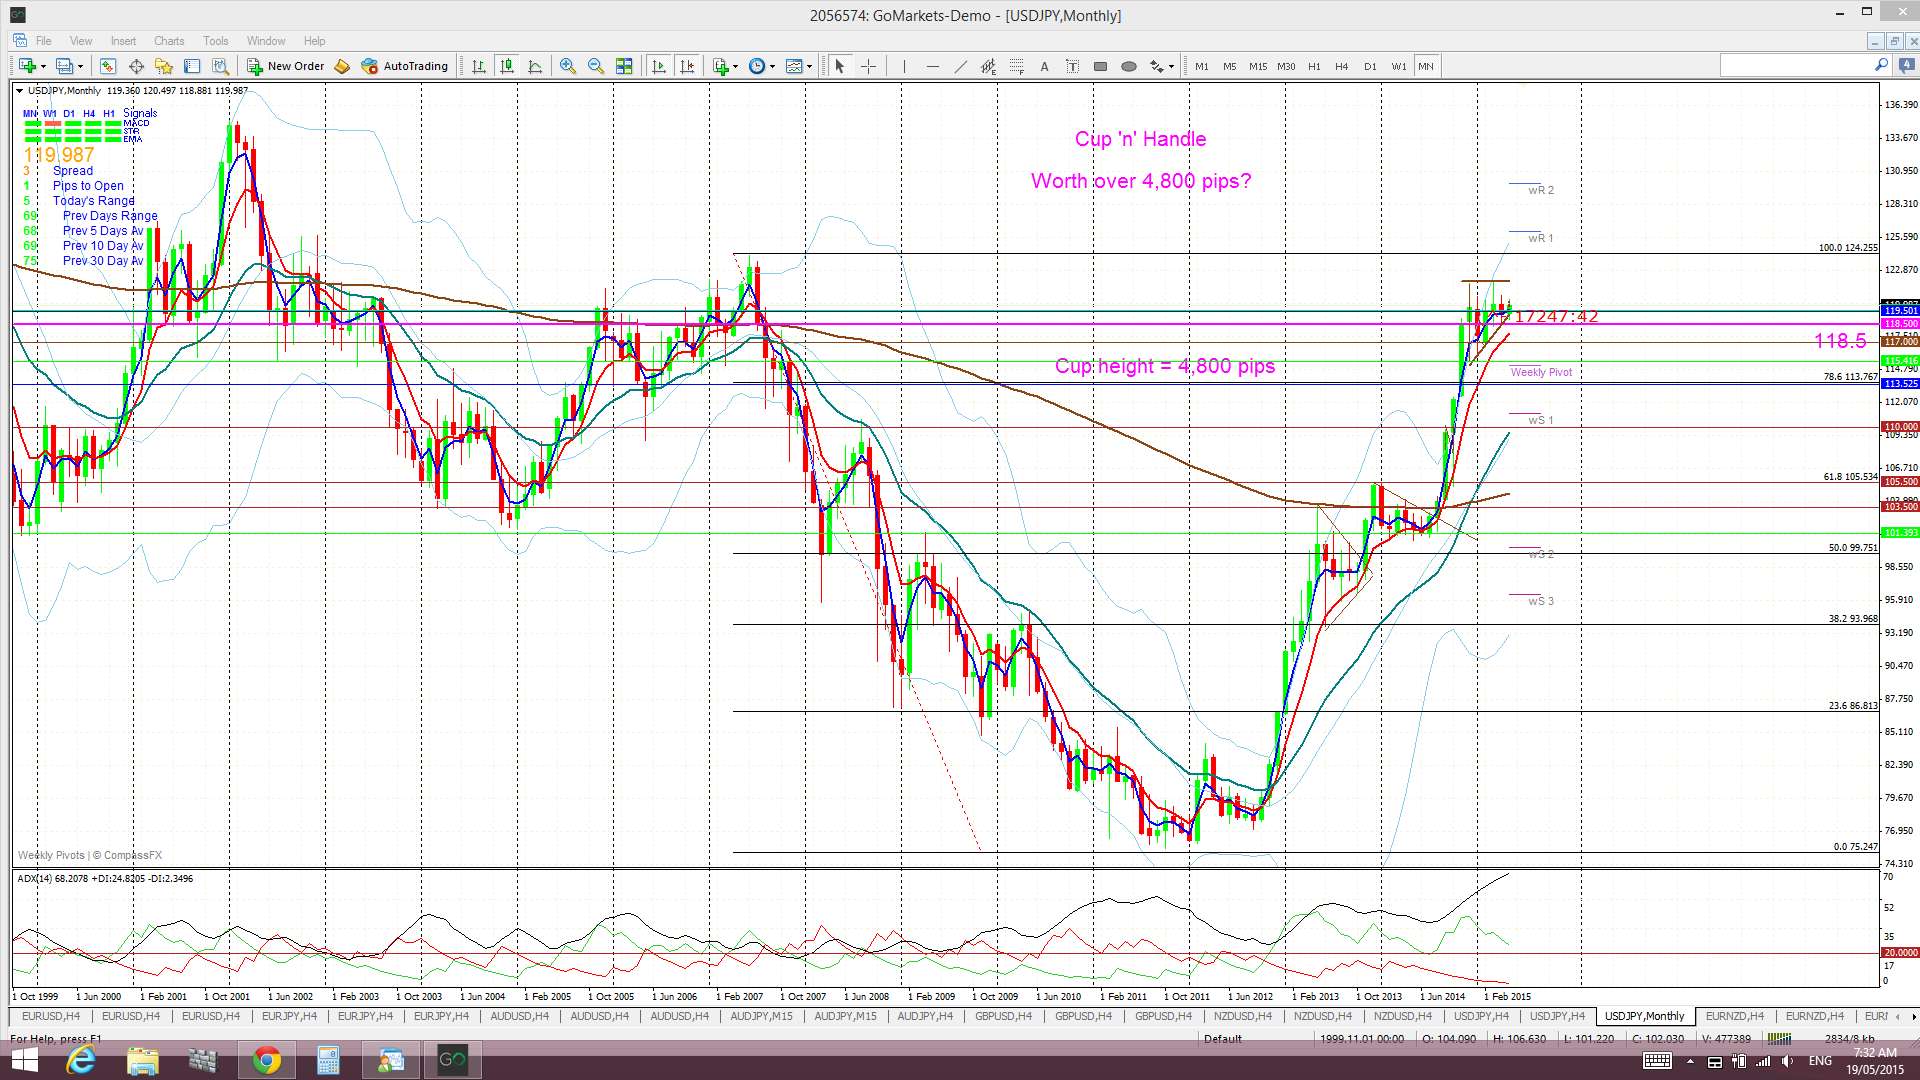
U/J daily: still ranging within a daily triangle:
U/J monthly: remember though that this choppy action is helping to build the ‘Handle’ of a possible monthly chart Cup ‘n’ Handle pattern:
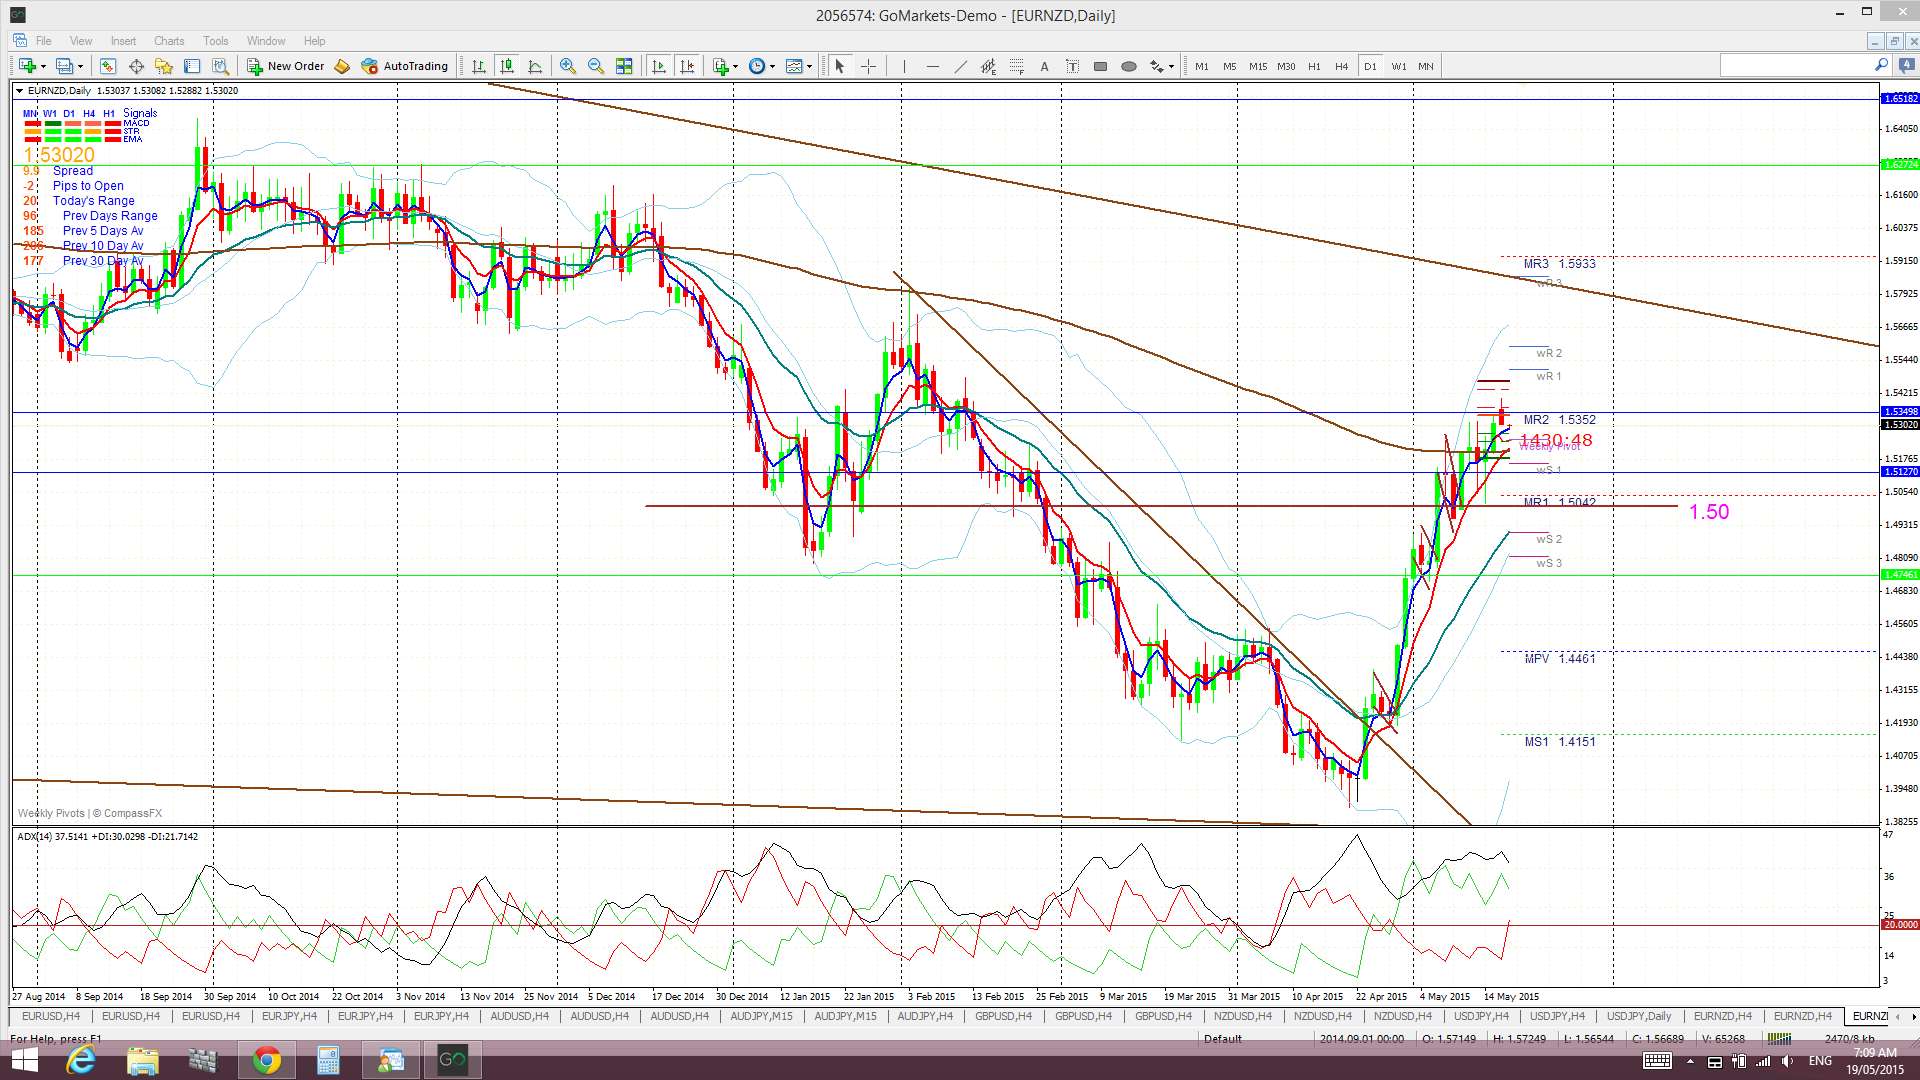
EUR/NZD daily: this is choppy, as expected, above the daily 200 EMA:
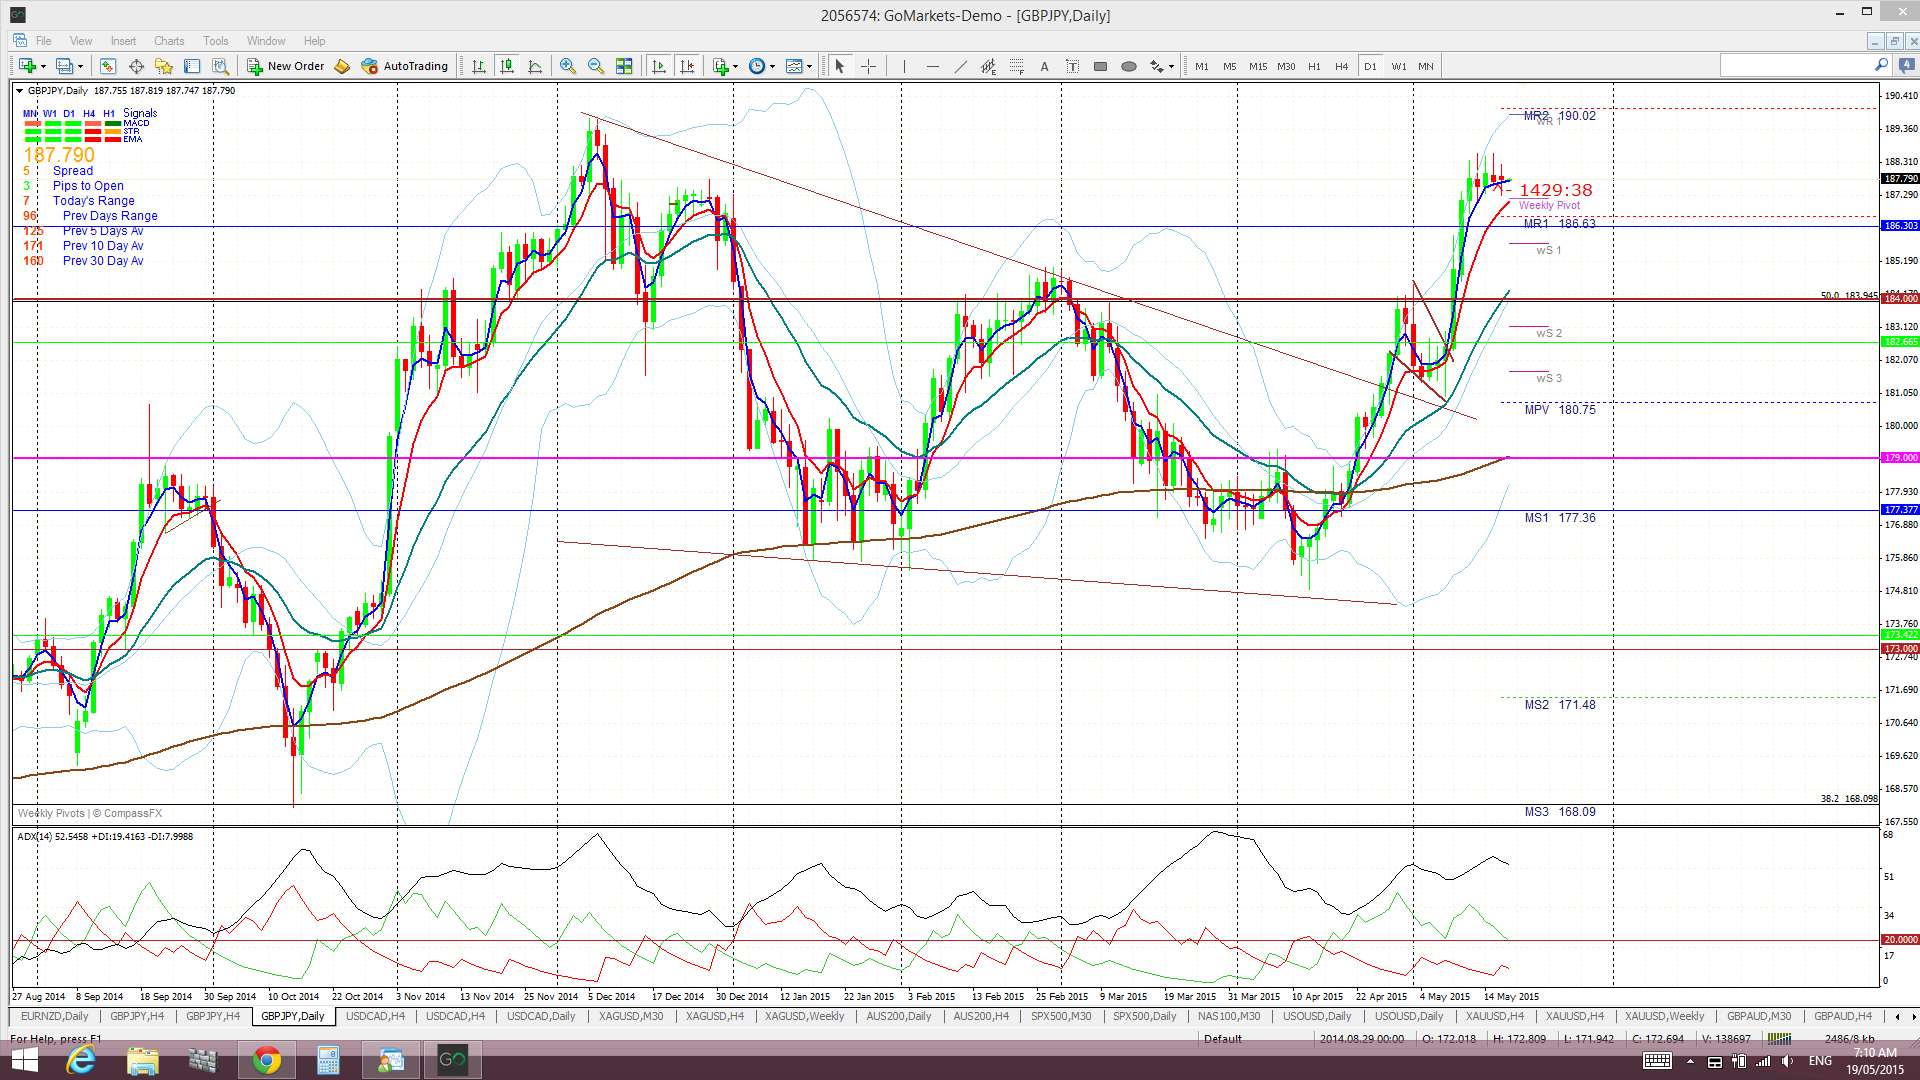
GBP/JPY daily: still above the key 184 but it might be having some ‘Double Top’ thoughts at the moment:
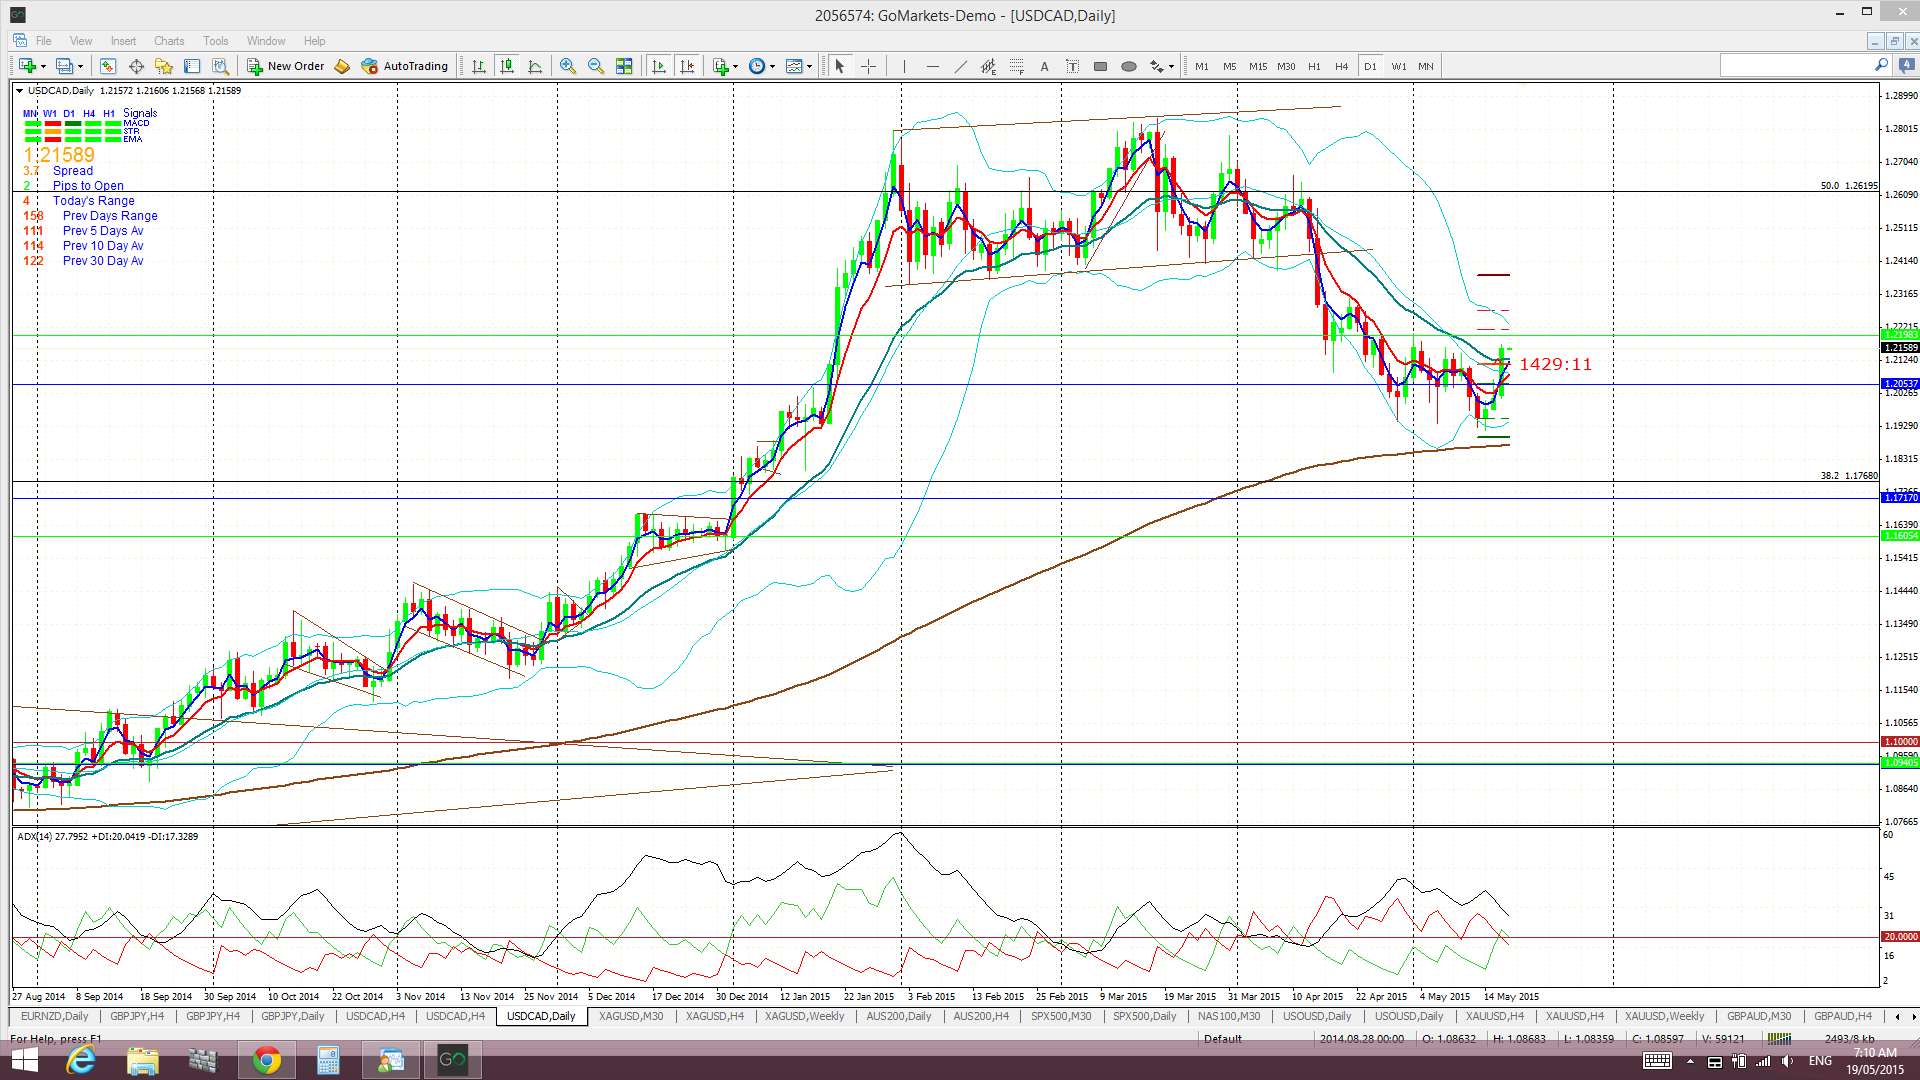
Loonie daily: has bounced up of the daily 200 EMA but any renewed US$ weakness would be a problem for this pair:
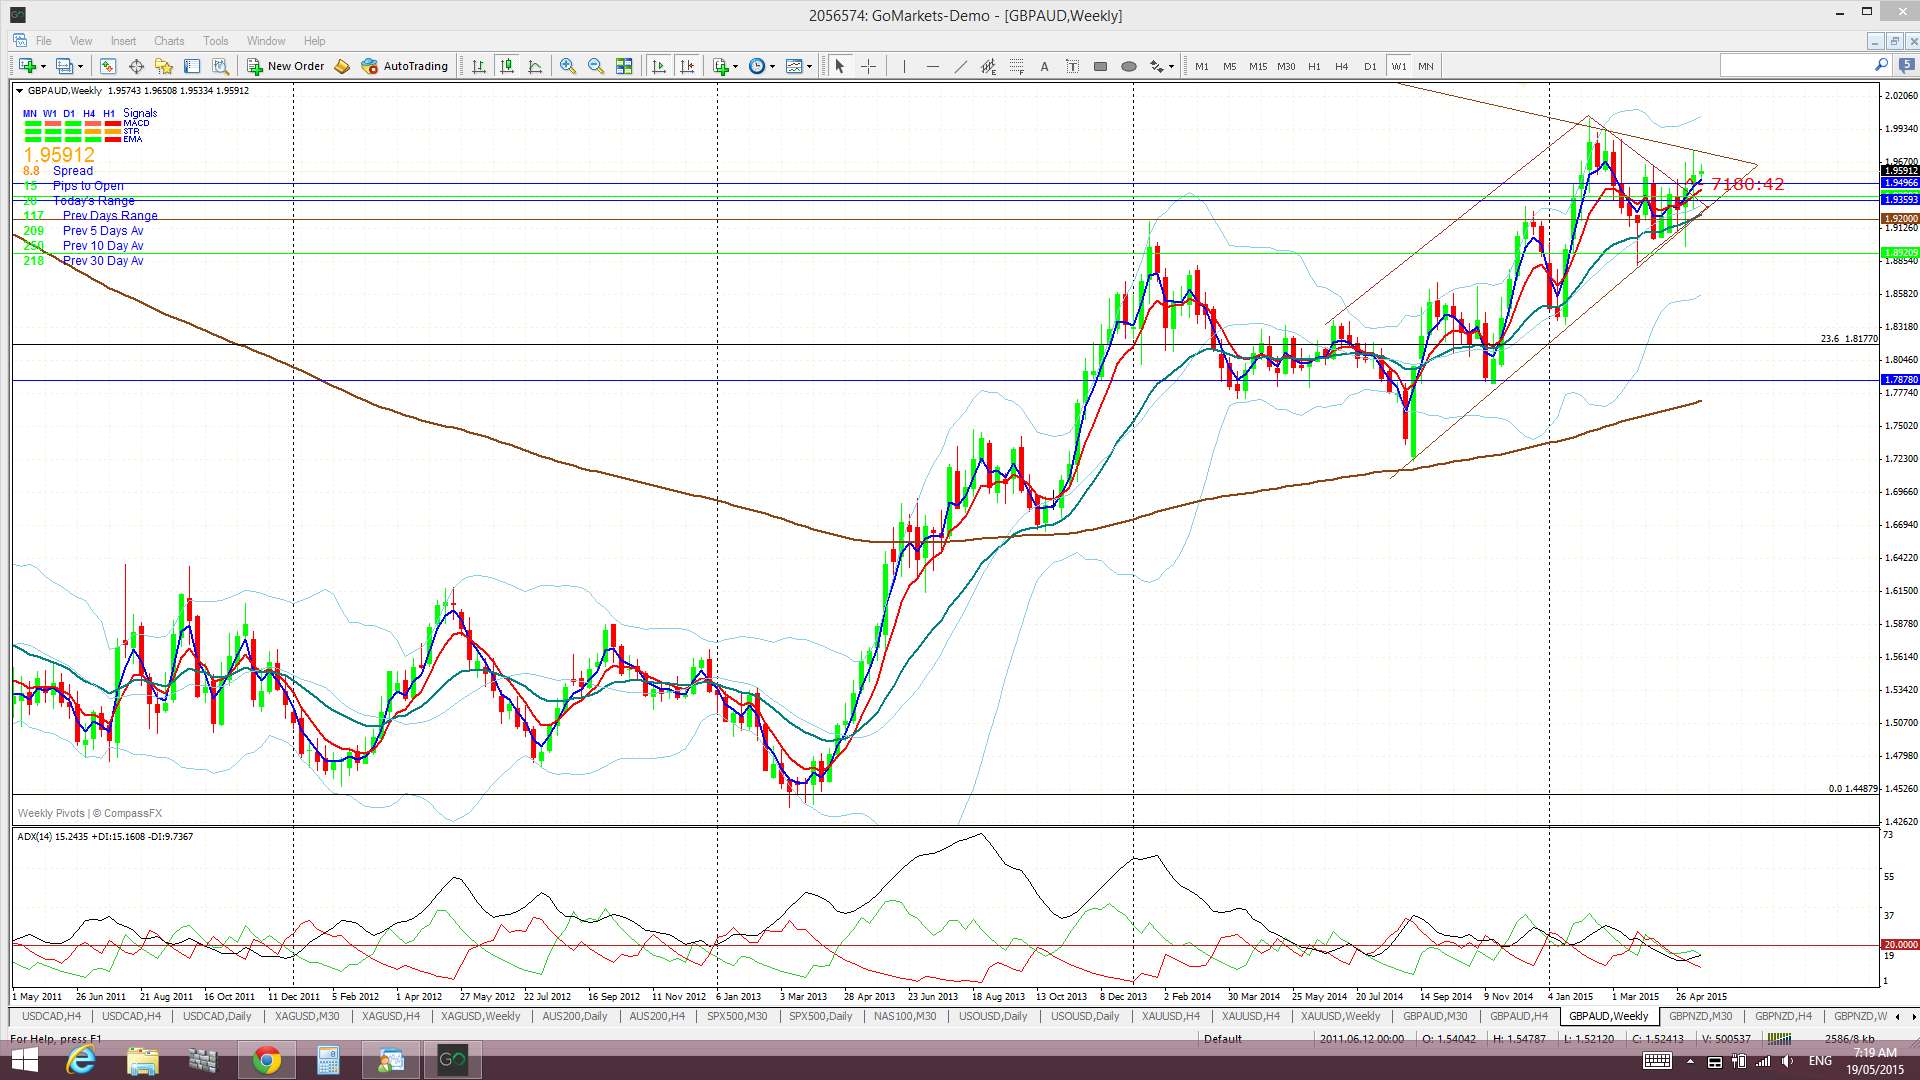
GBP/AUD weekly: the weekly chart shows how this pair is chopping around under major resistance:
GBP/NZD: the 2.10 level is the battle ground region for this pair and a breakout above this region is currently being attempted:

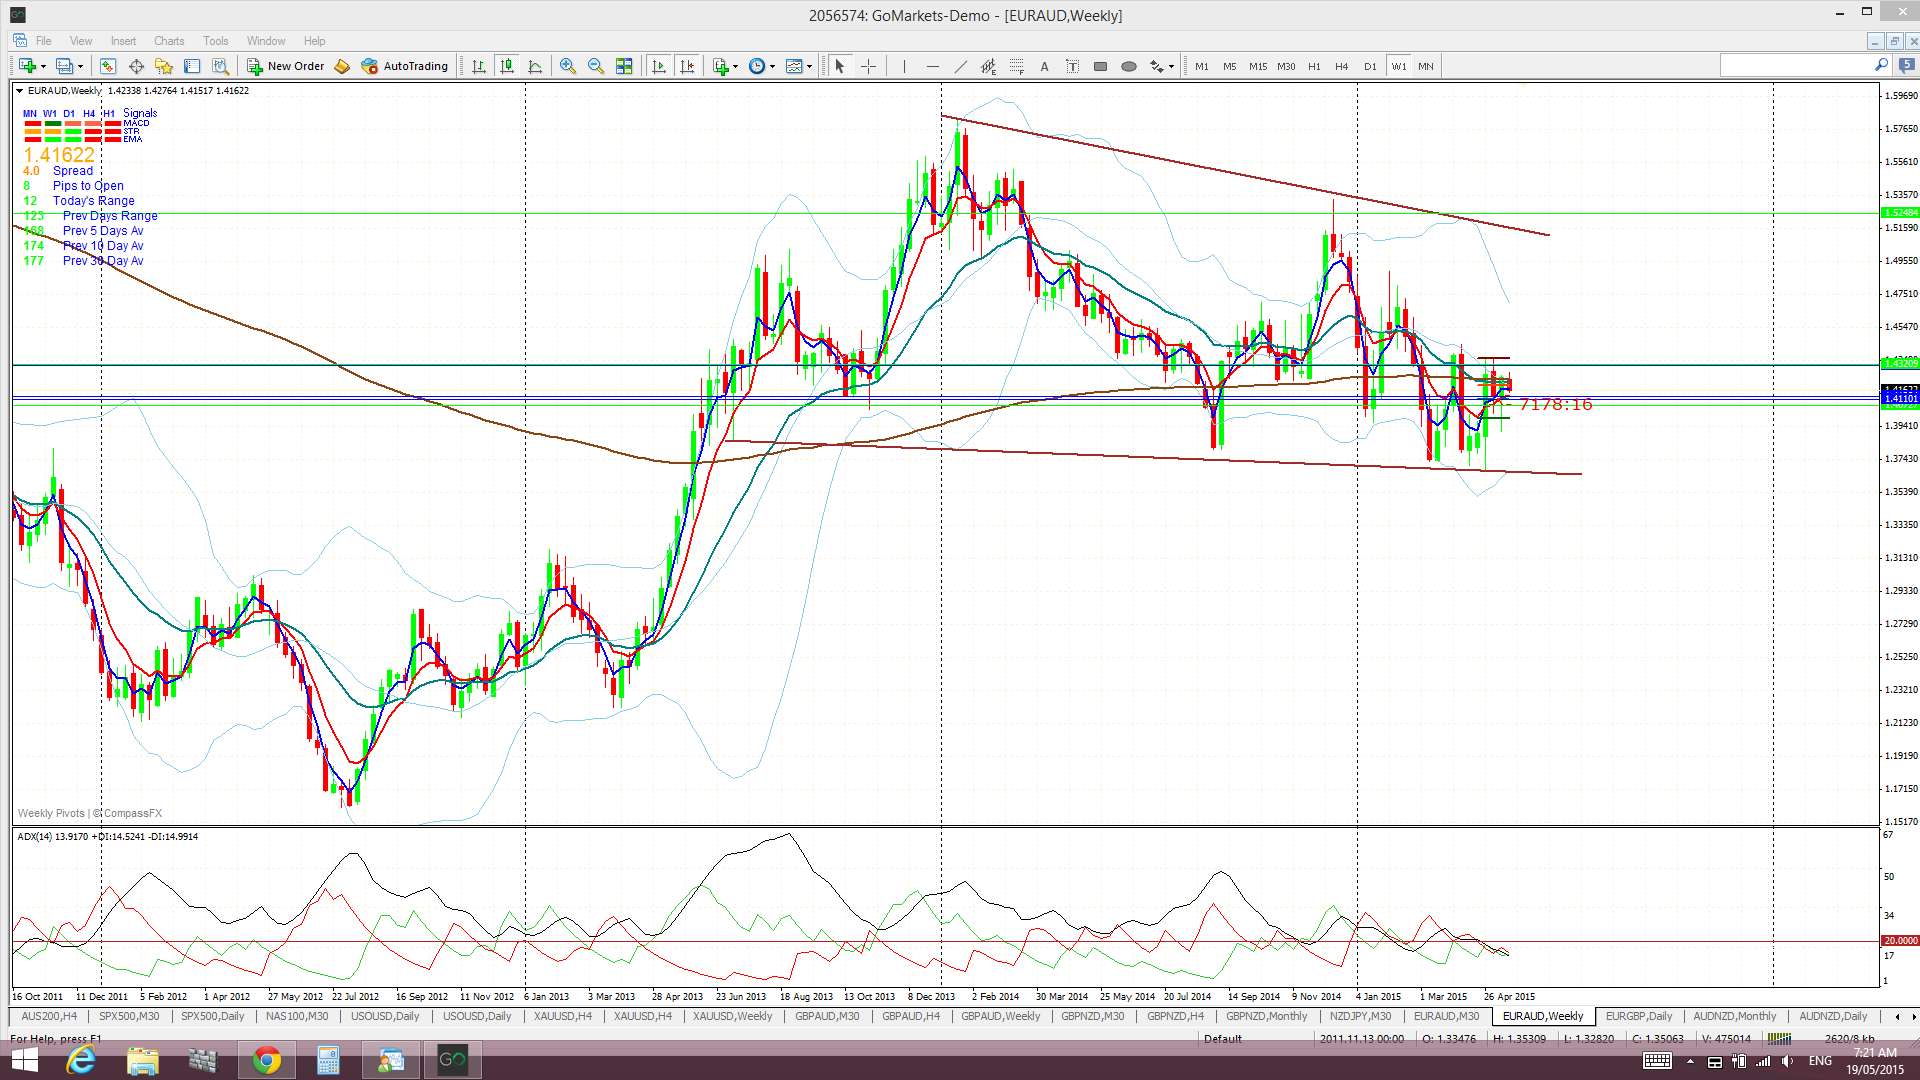
EUR/AUD weekly: this chart isn’t too inspiring at the moment:
The post US$: just testing broken trend line? appeared first on www.forextell.com.