USDX
Monthly: The August candle is currently printing a small bullish candle with a long upper shadow but is still under the key 100 level.
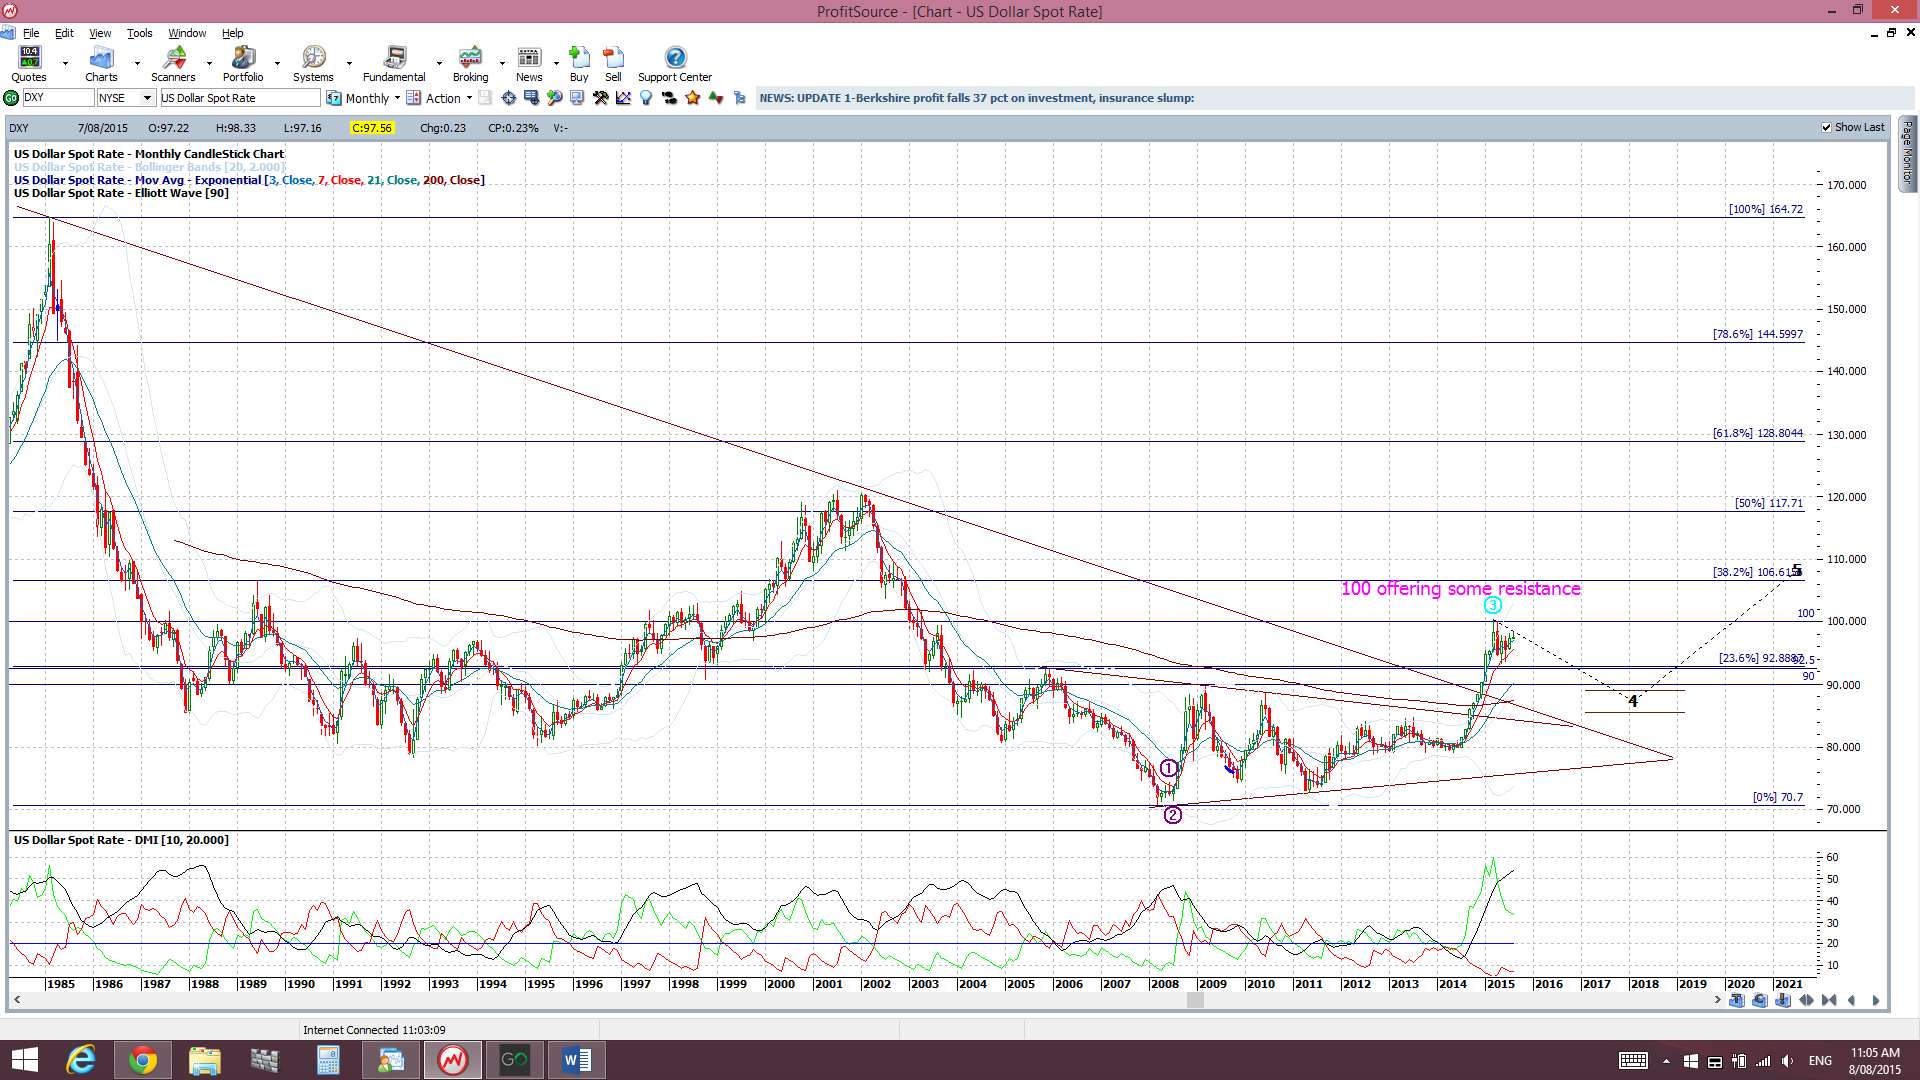

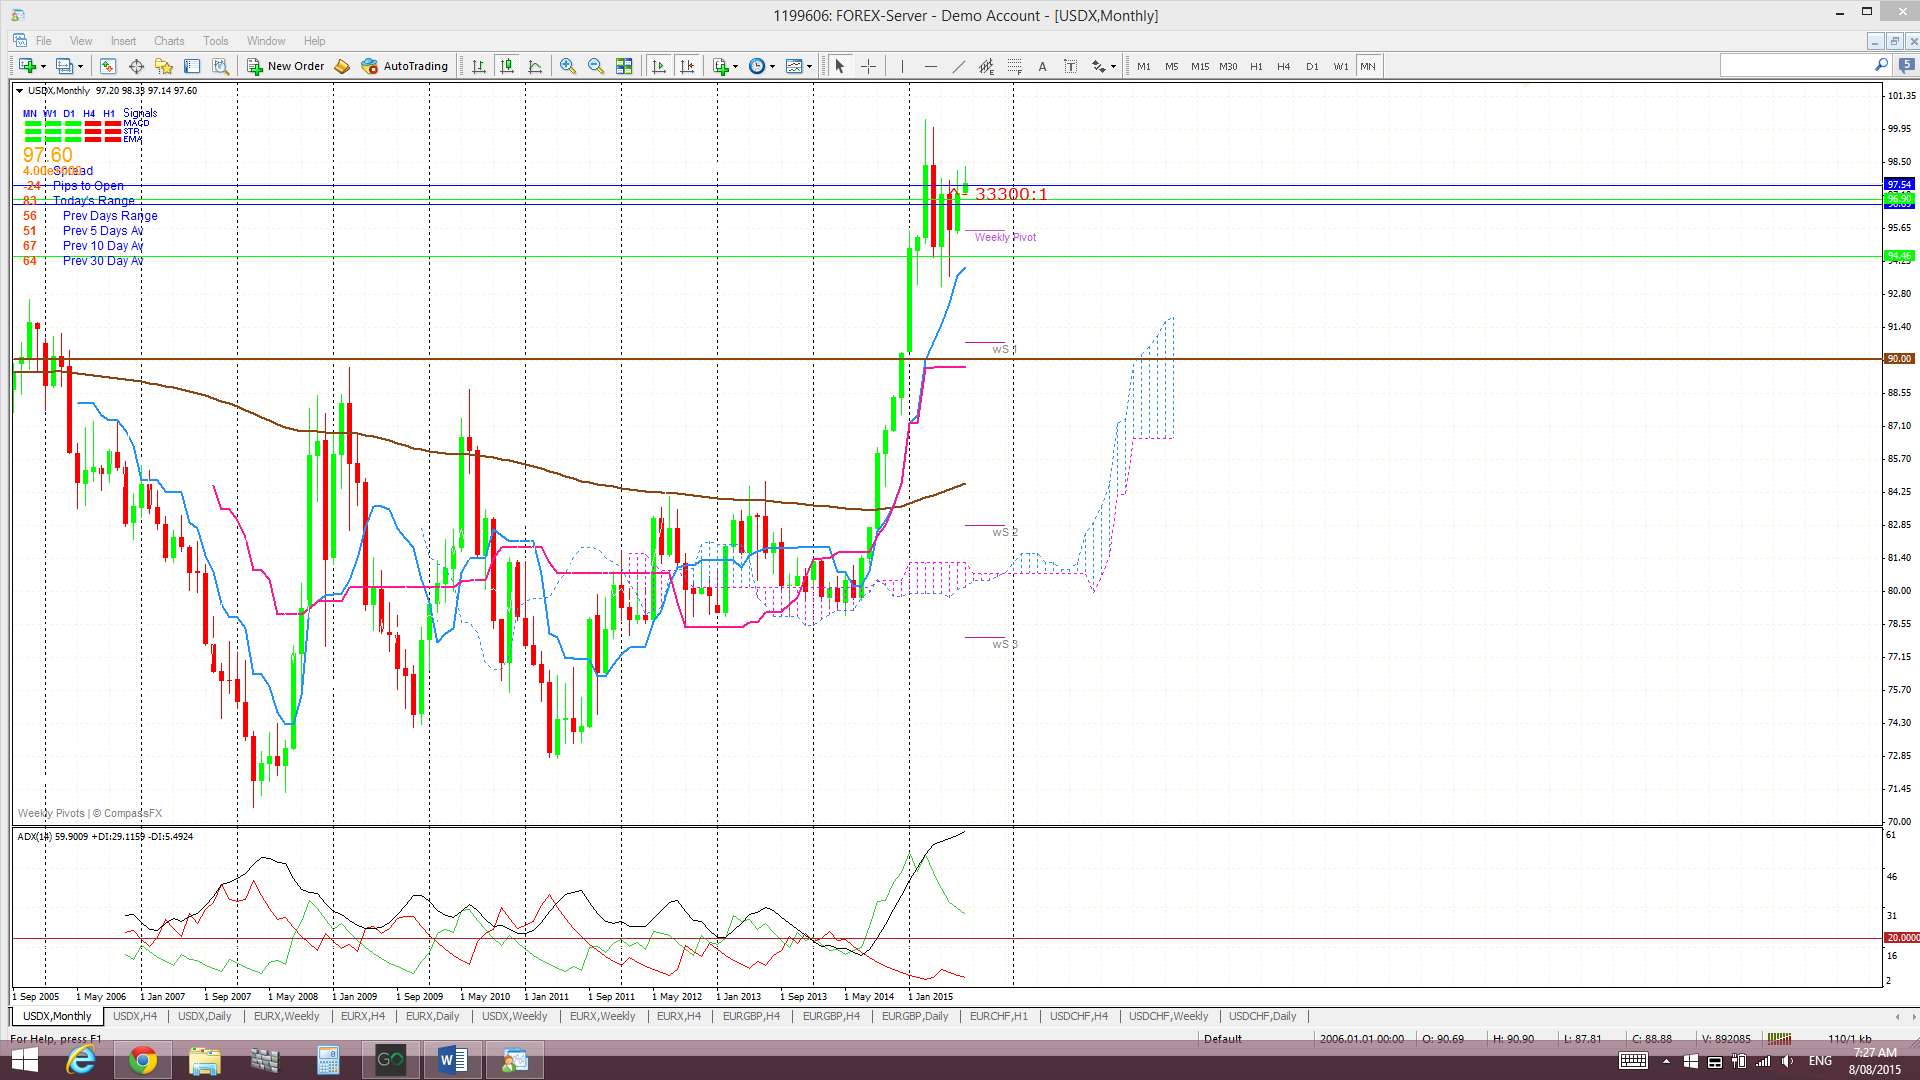
Monthly Ichimoku: The August candle is trading above the Cloud.
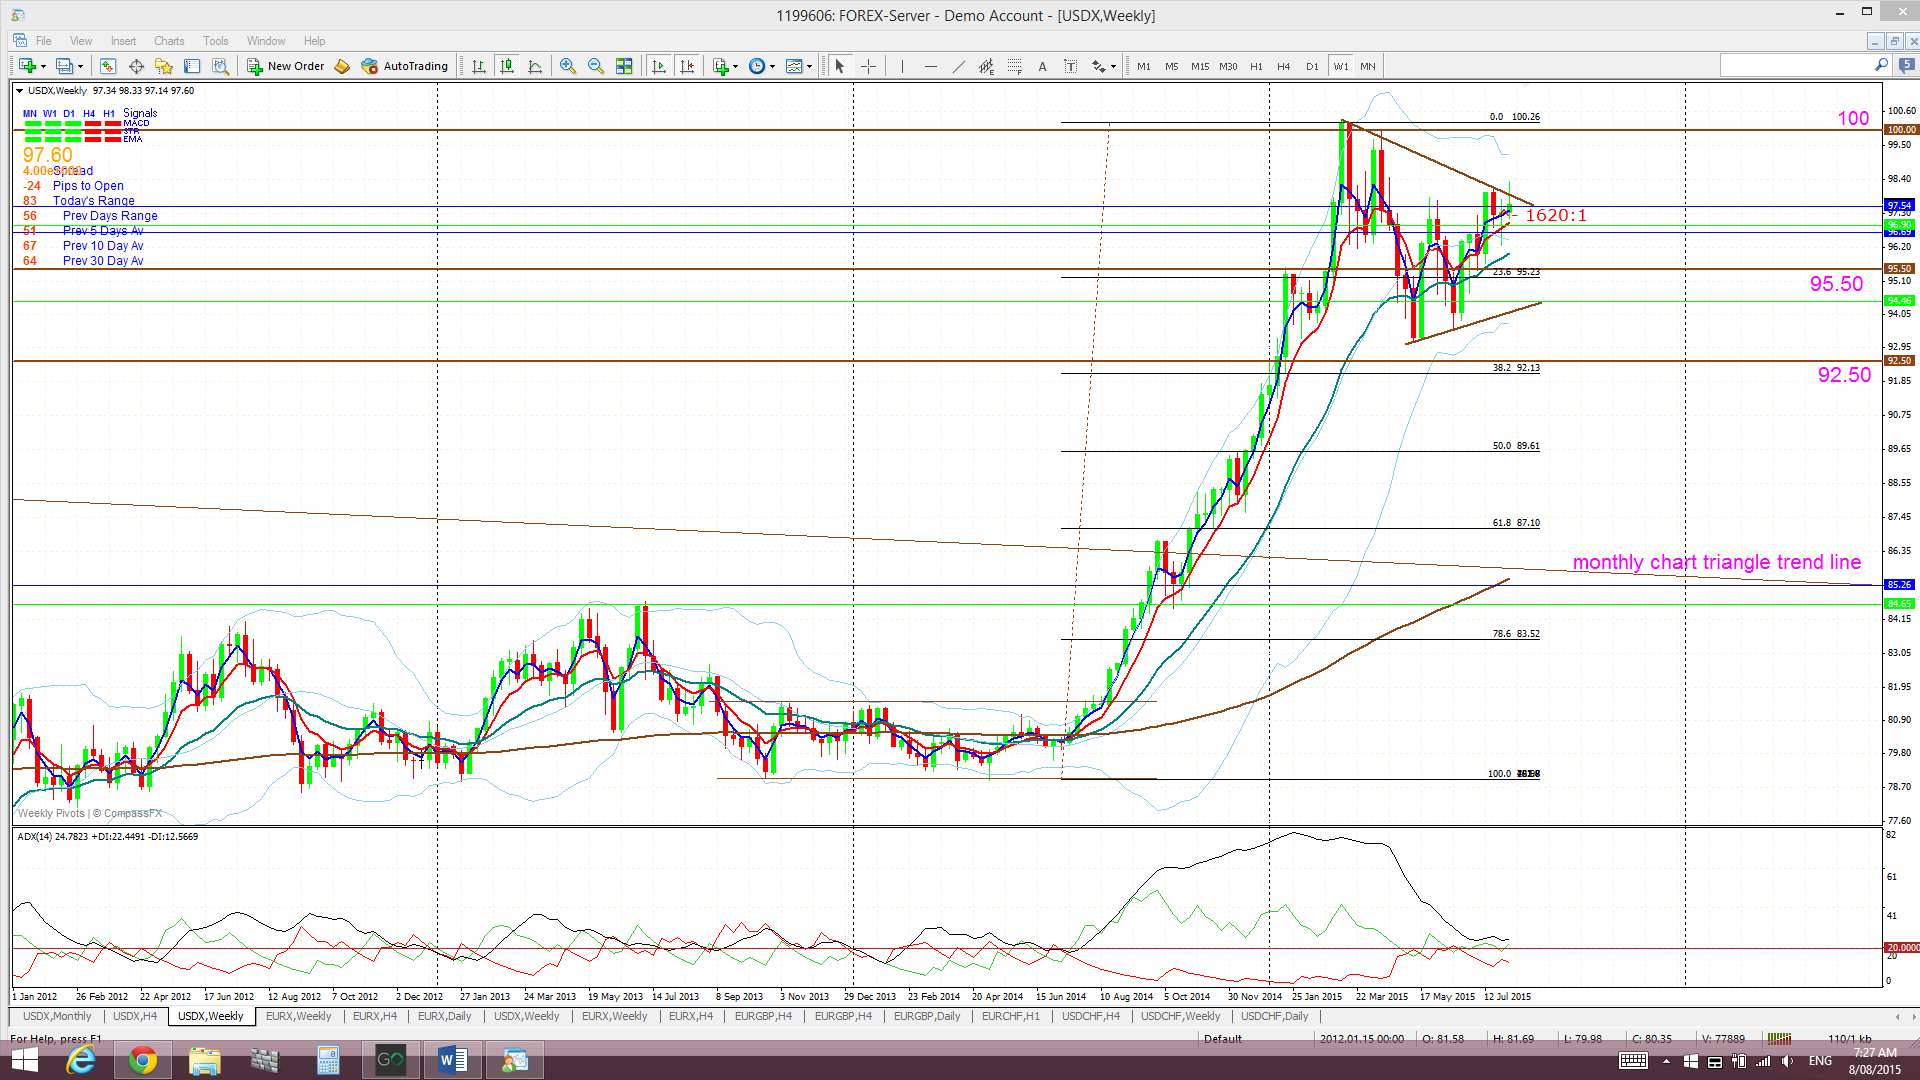
Weekly: Last week’s candle also closed as a small bullish candle with a long upper shadow BUT still within the weekly Flag pattern. Any bullish continuation from here though will bring the 100 level back into focus with some possible ‘Triple Top’ jitters. Any bearish breakdown though would have me looking for a test of the 61.8% fib which is down near the previously broken trend line:
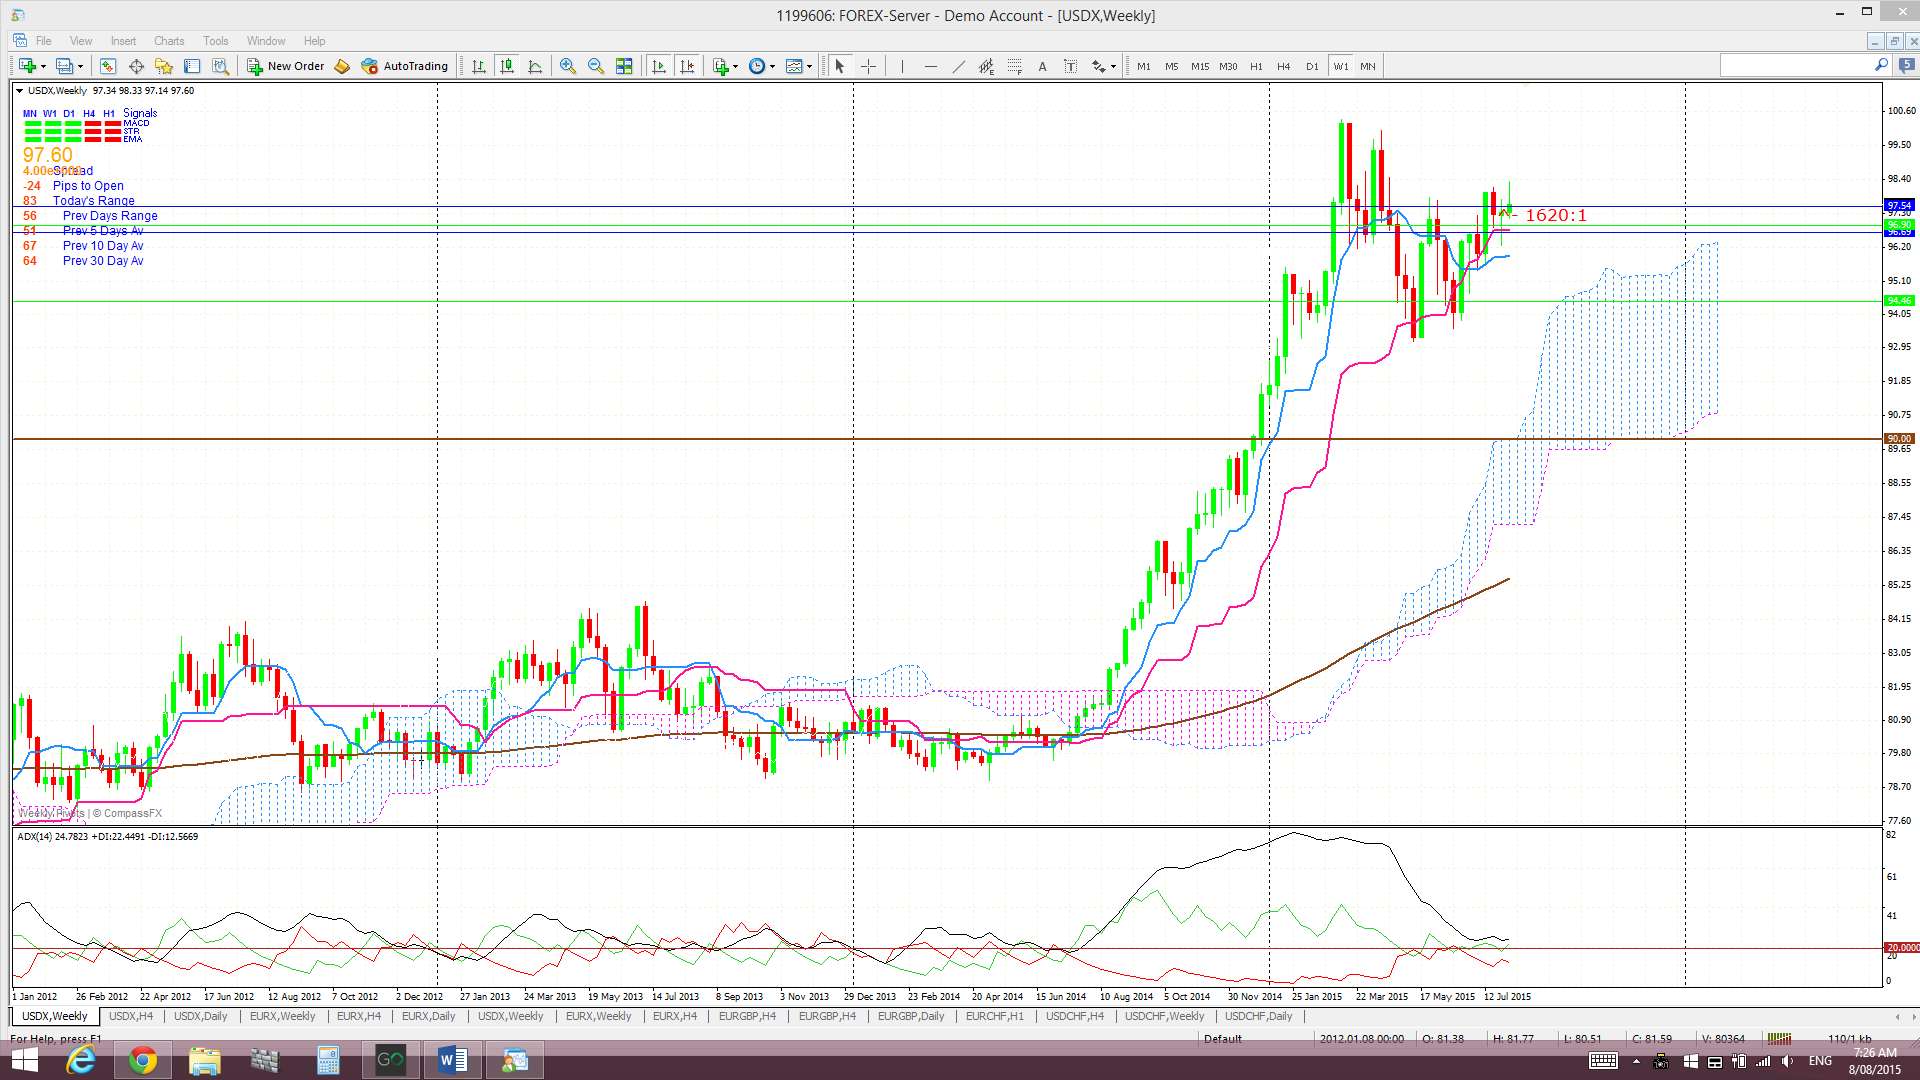
Weekly Ichimoku: The weekly candle closed ABOVE the weekly Cloud.
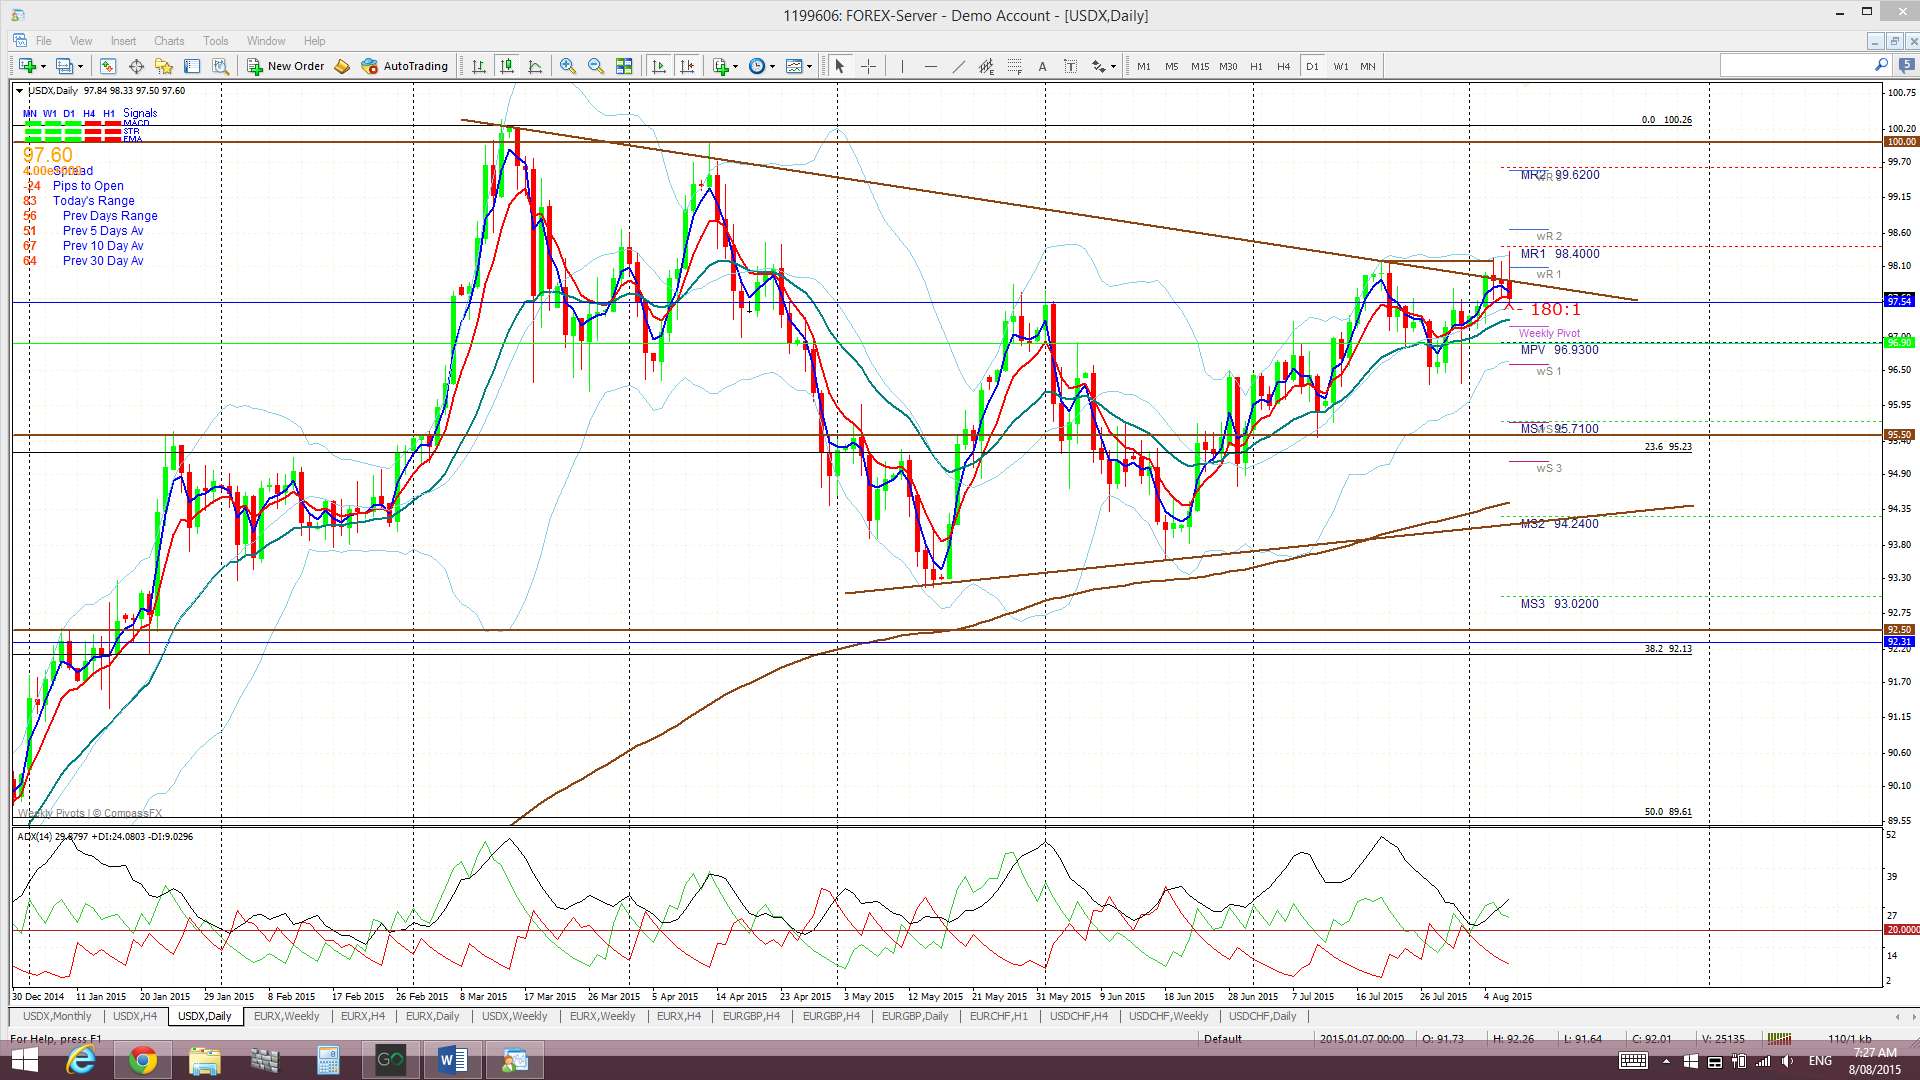
Daily: The week started with two bullish days but was followed by three bearish days. The 100 level remains as overall resistance above current price.
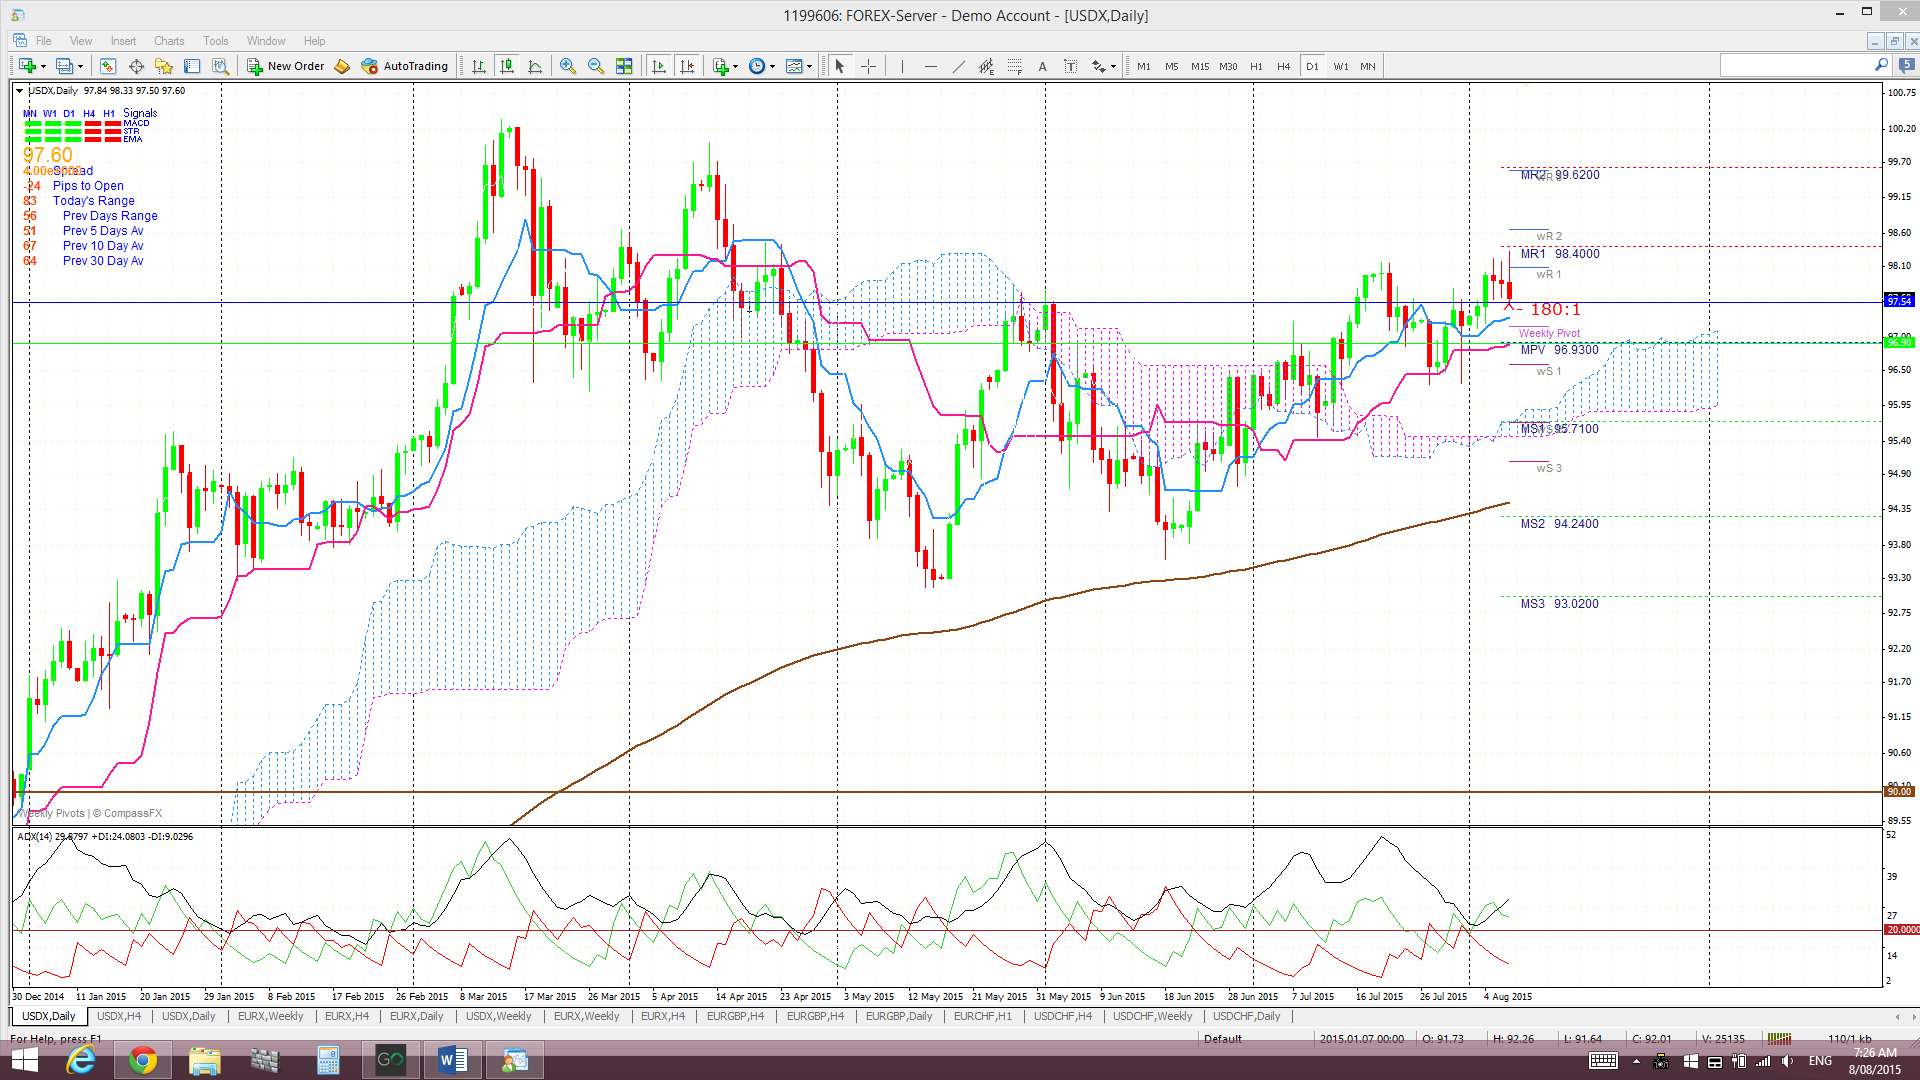
Daily Ichimoku Cloud chart: Price traded above the daily Cloud last week.
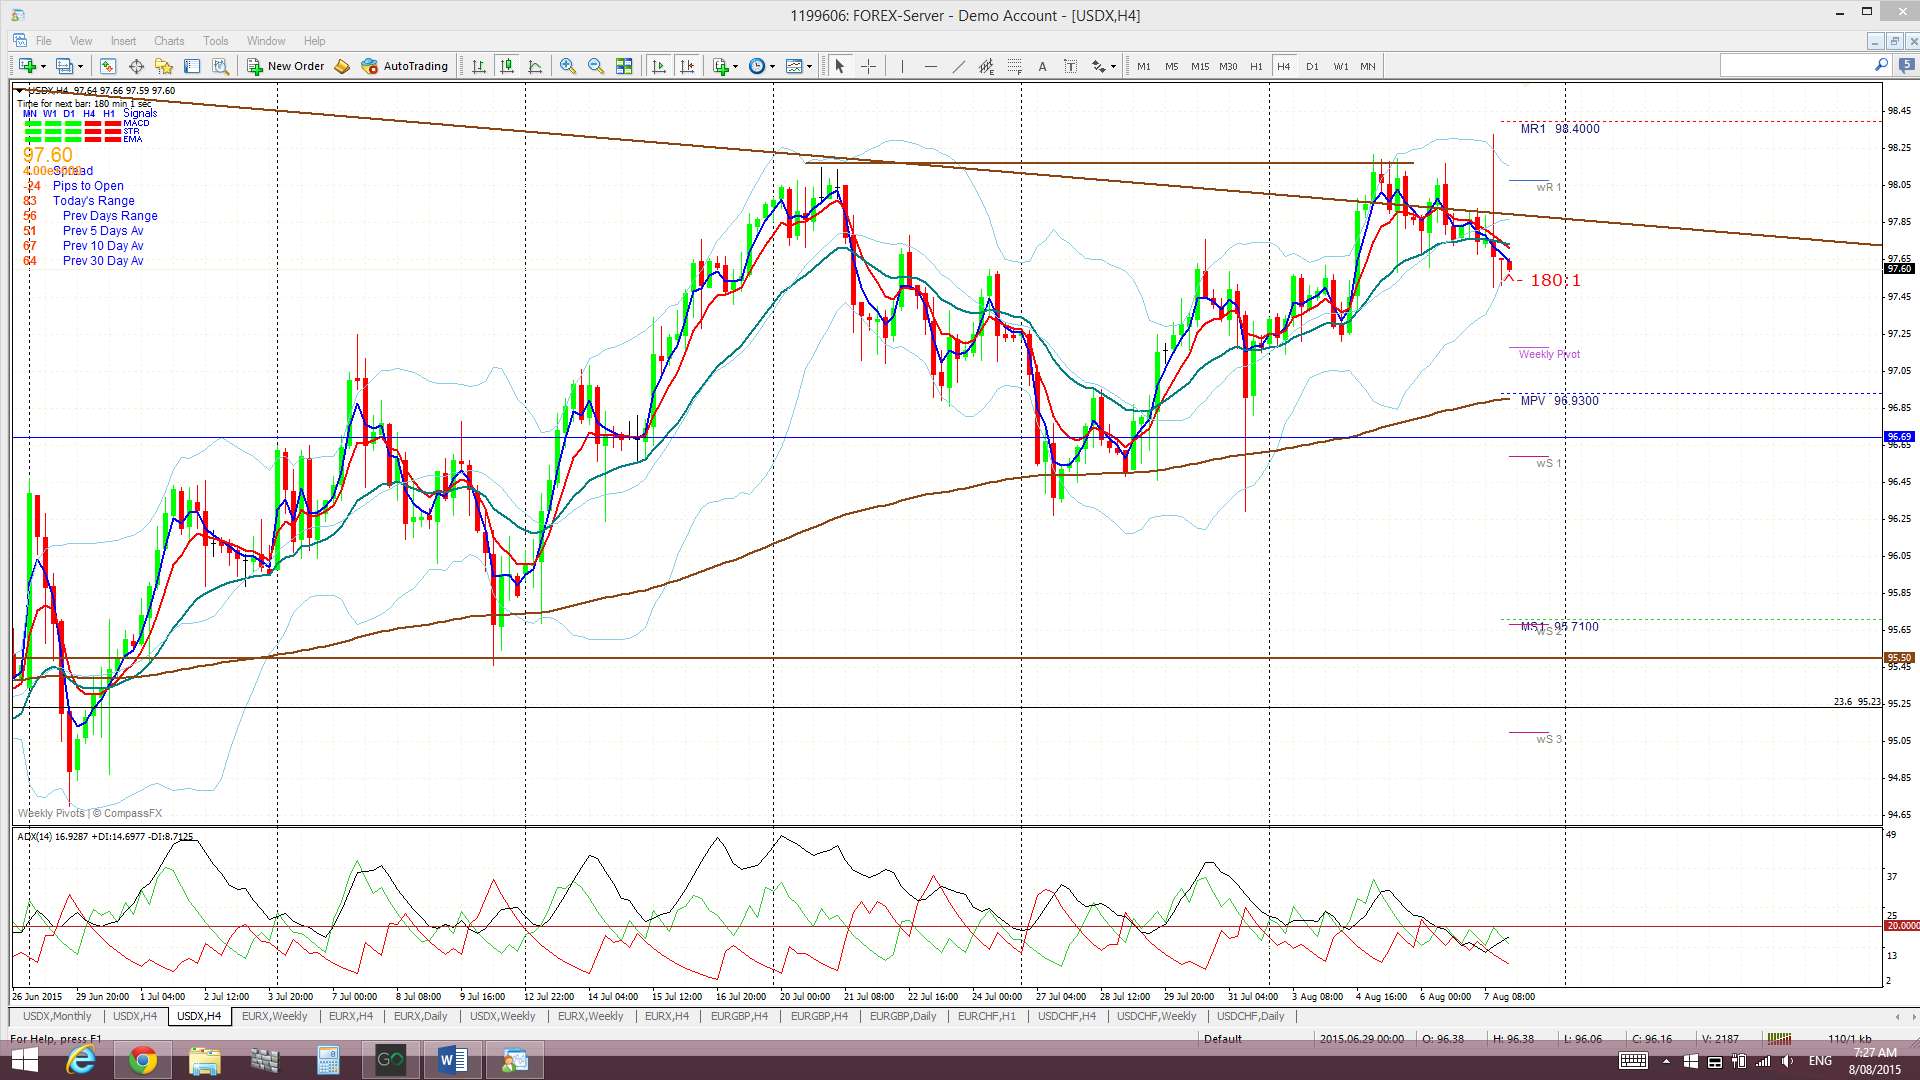
4hr: Price chopped up and then down last week.
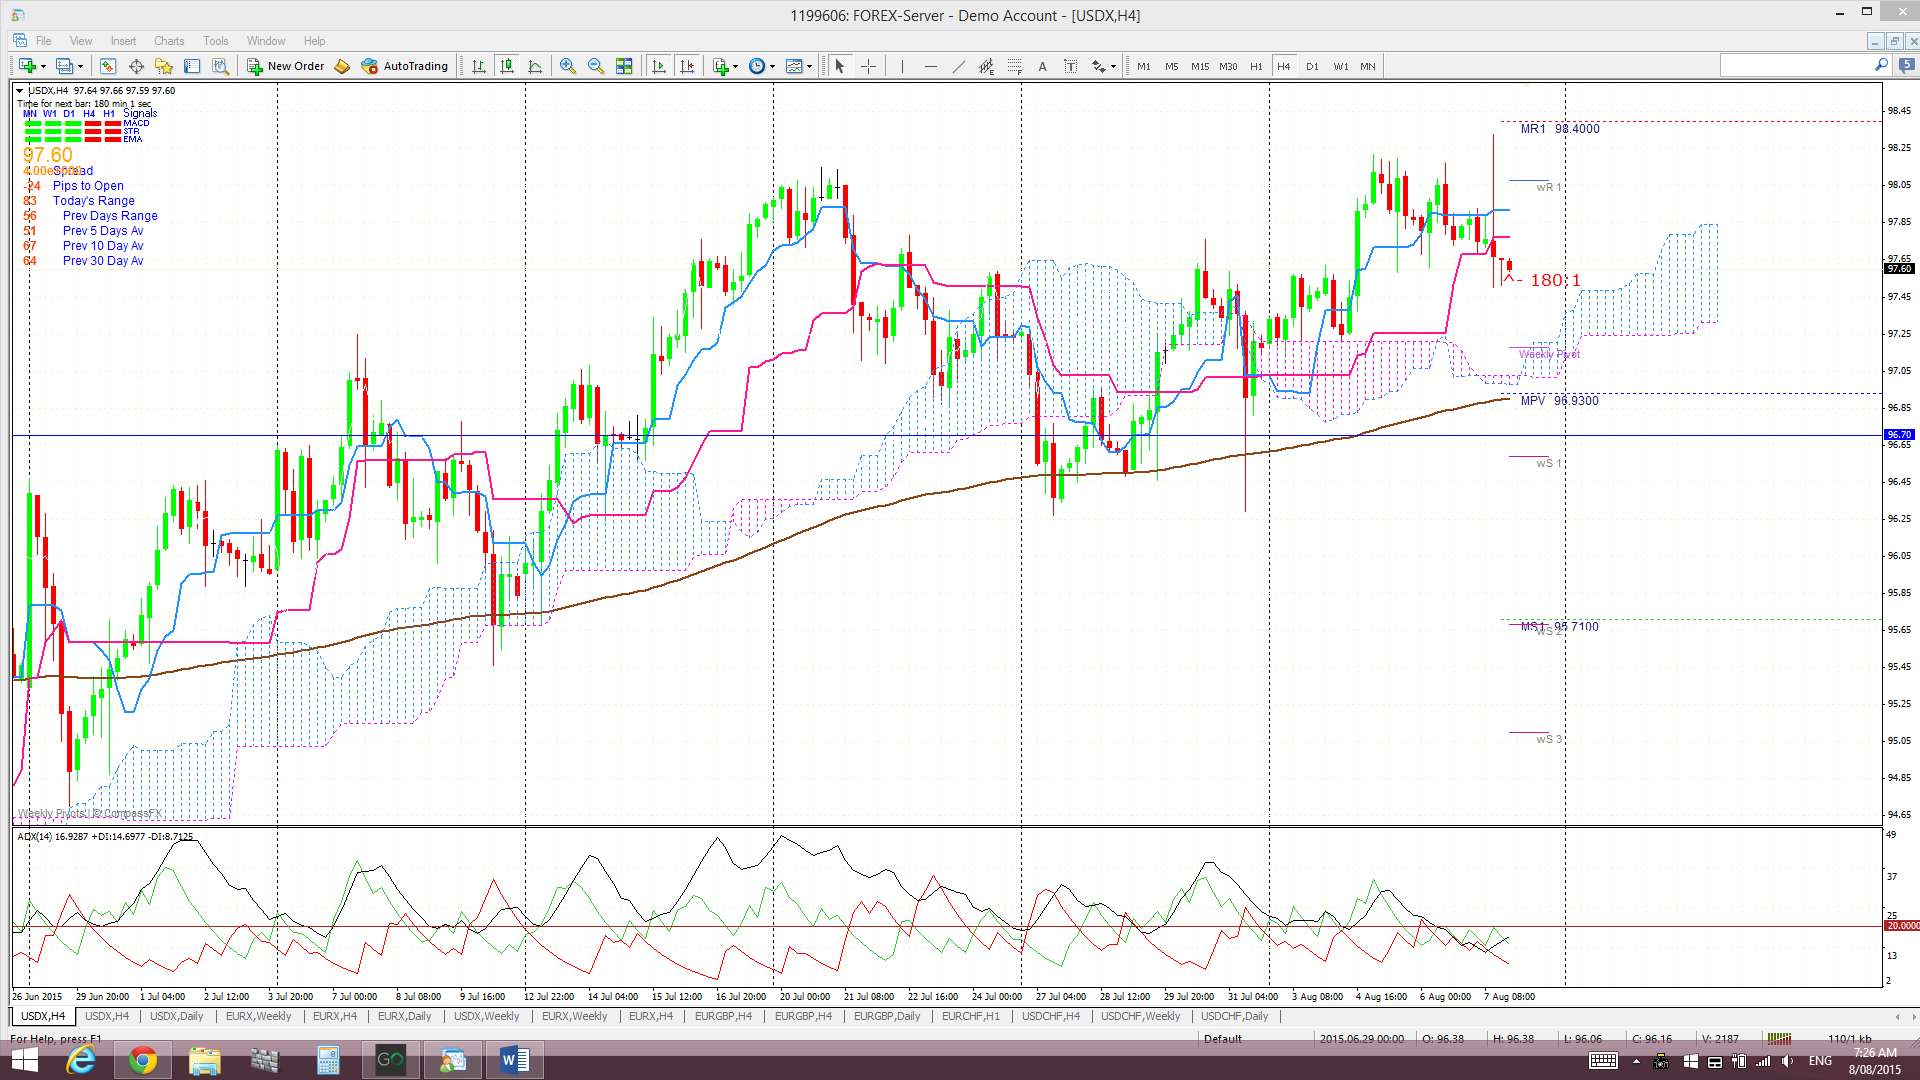
4hr Ichimoku Cloud chart: Price moved up and out of the 4hr Cloud to start the week and closed above the Cloud. This chart is aligned with the daily chart and suggests LONG US$.
EURX
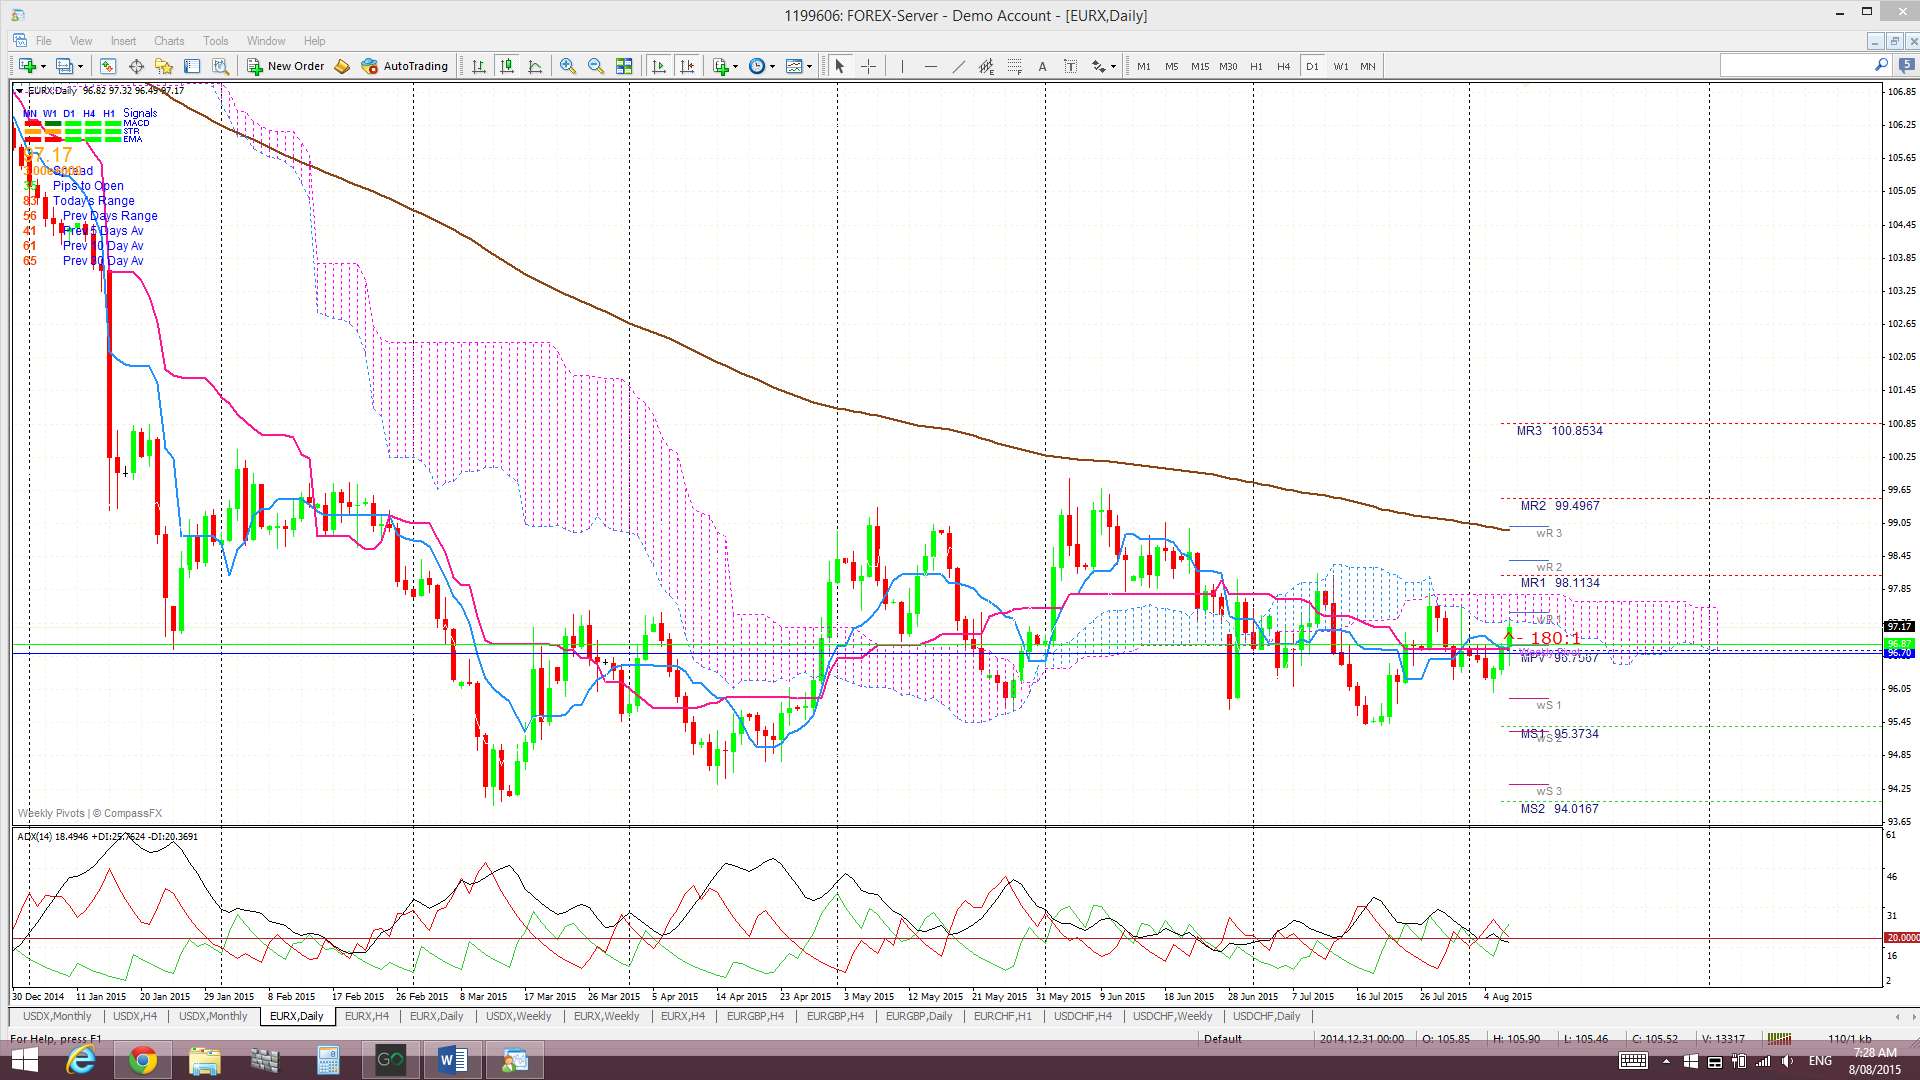
Monthly: The August candle is currently printing a small bullish candle and is still above the key 96 ‘Double Bottom’ level.
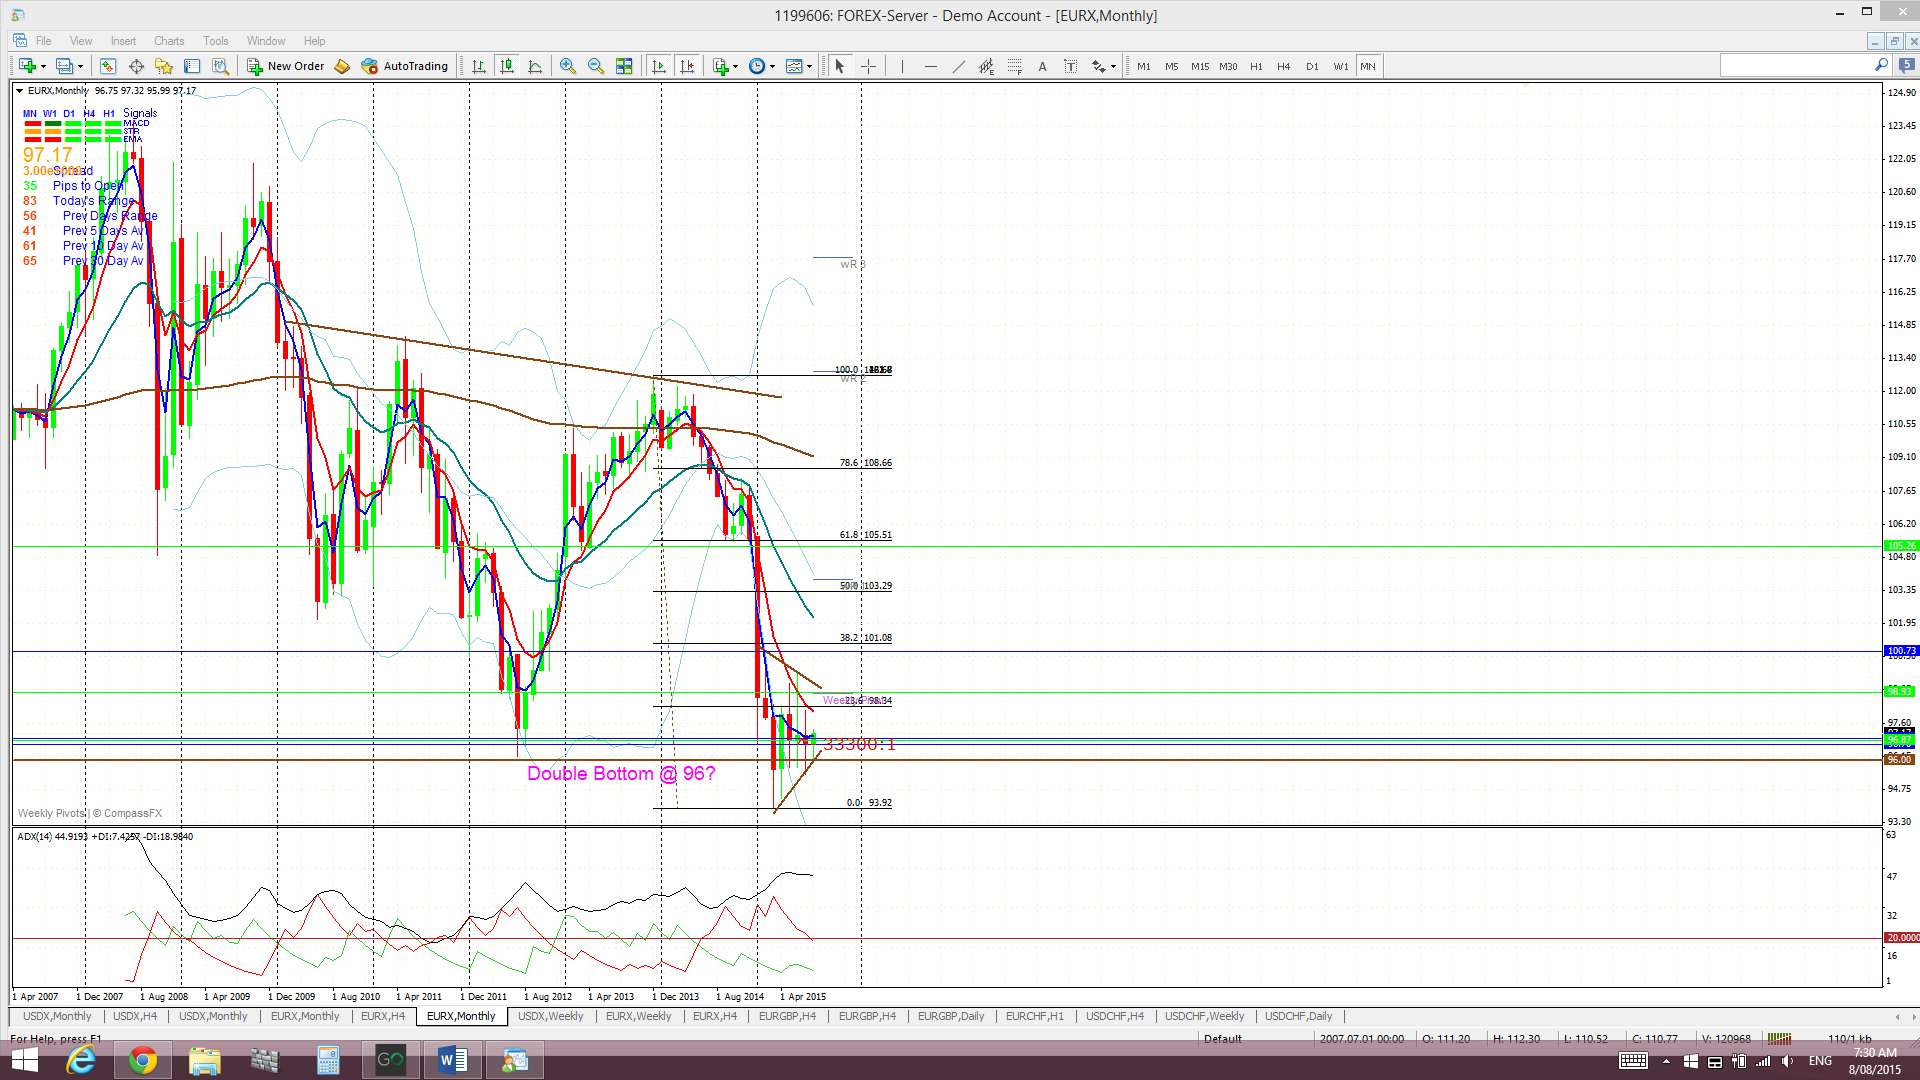
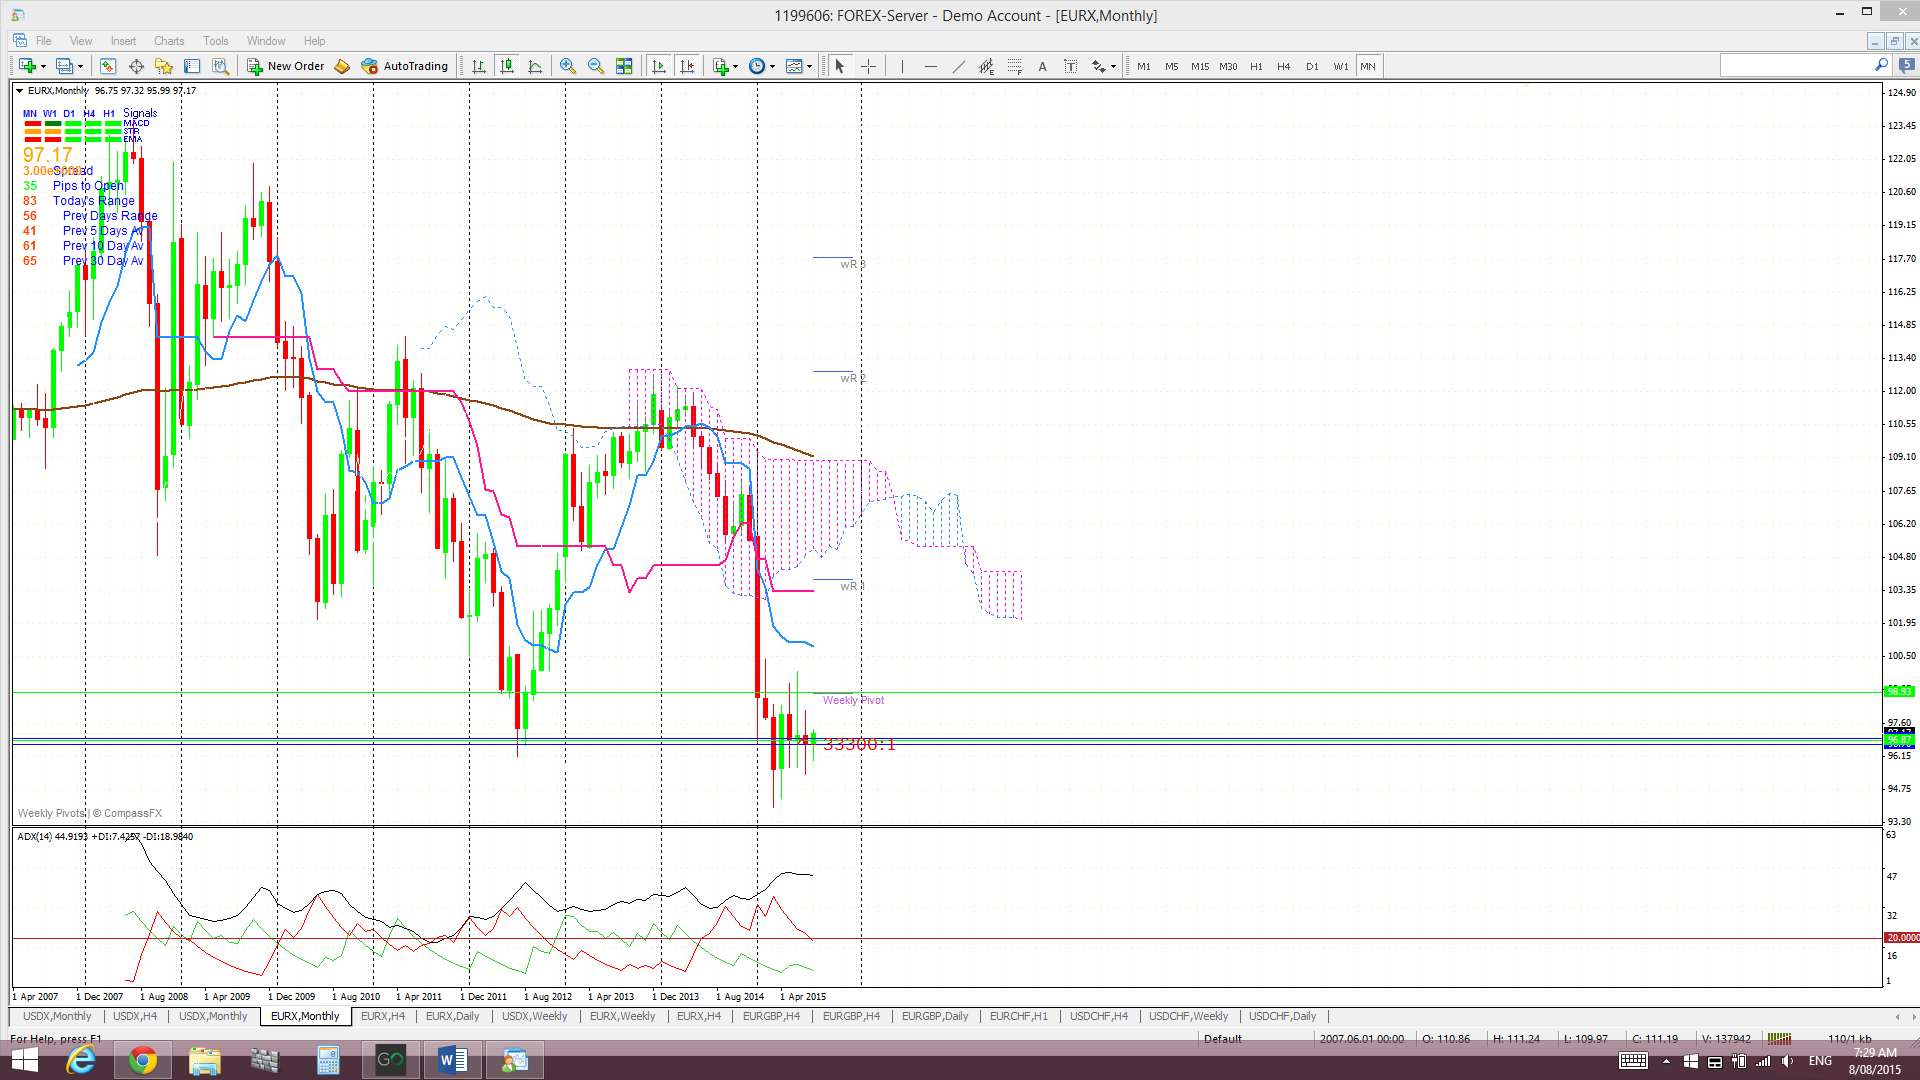
Monthly Ichimoku: The August candle is trading below the Cloud.
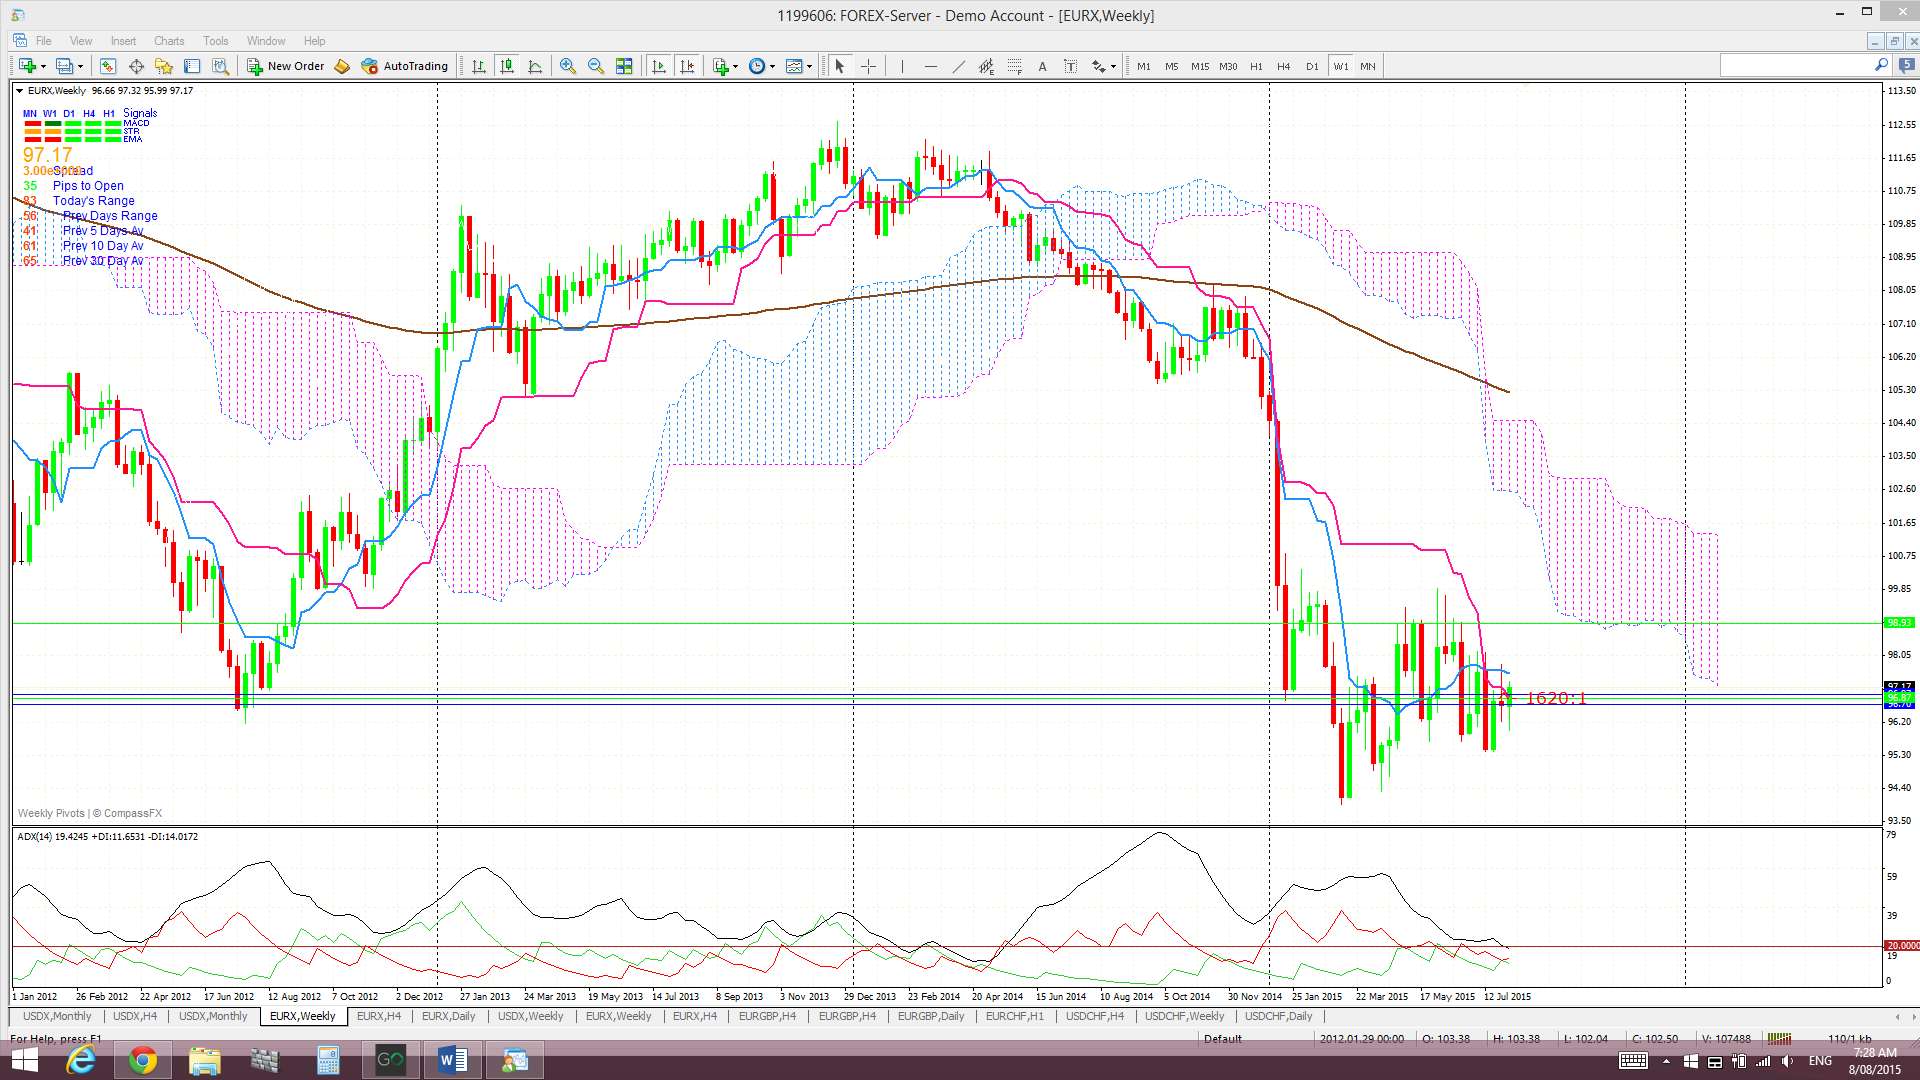
Weekly: The weekly candle closed as a bullish, almost ‘engulfing’ candle AND above the key 96 level. There have been two conflicting technical patterns competing over recent weeks, a basing-style bullish ‘Double Bottom’ and a ‘Bear Flag’, but neither pattern has clearly trumped yet.

Weekly Ichimoku: Price is still trading well below the weekly Cloud.
Daily: The week started with two bearish days but was followed by three bullish days.
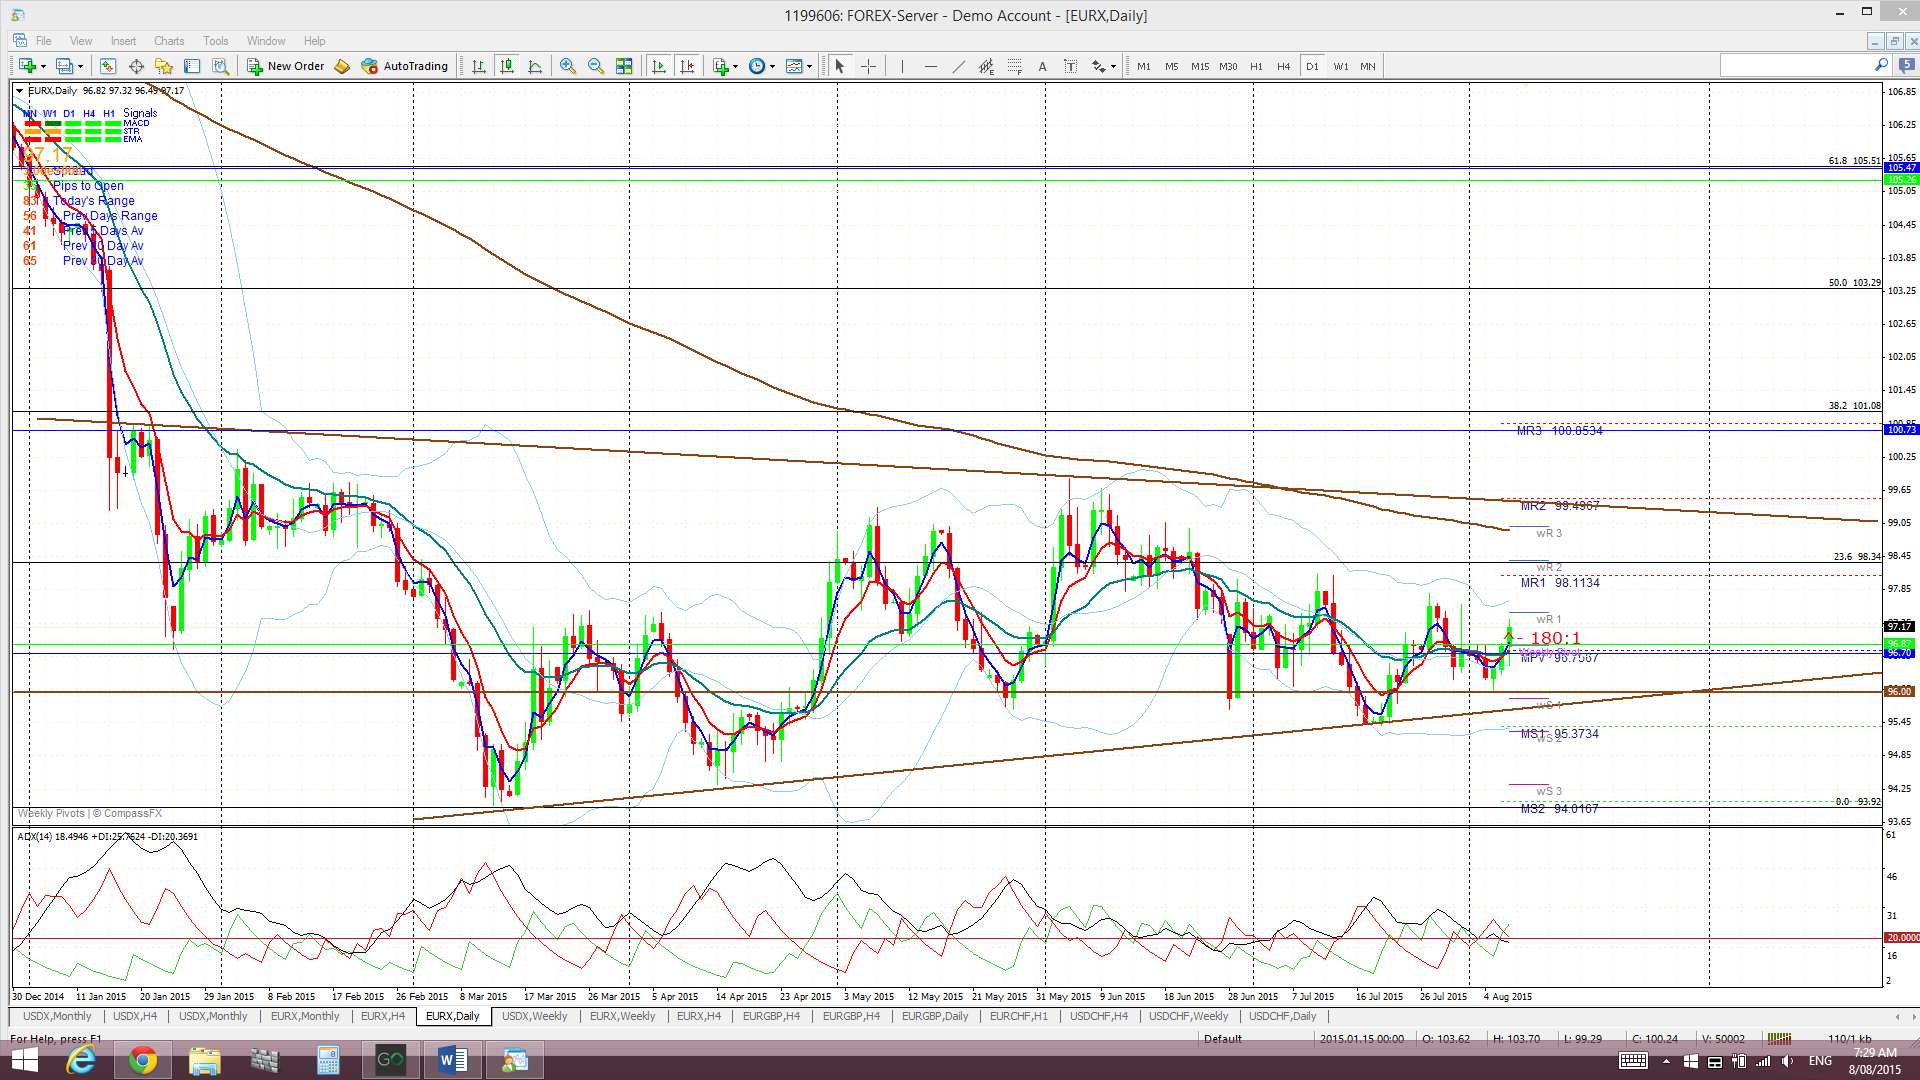
Daily Ichimoku Cloud chart: Price is still under the daily Cloud…just.
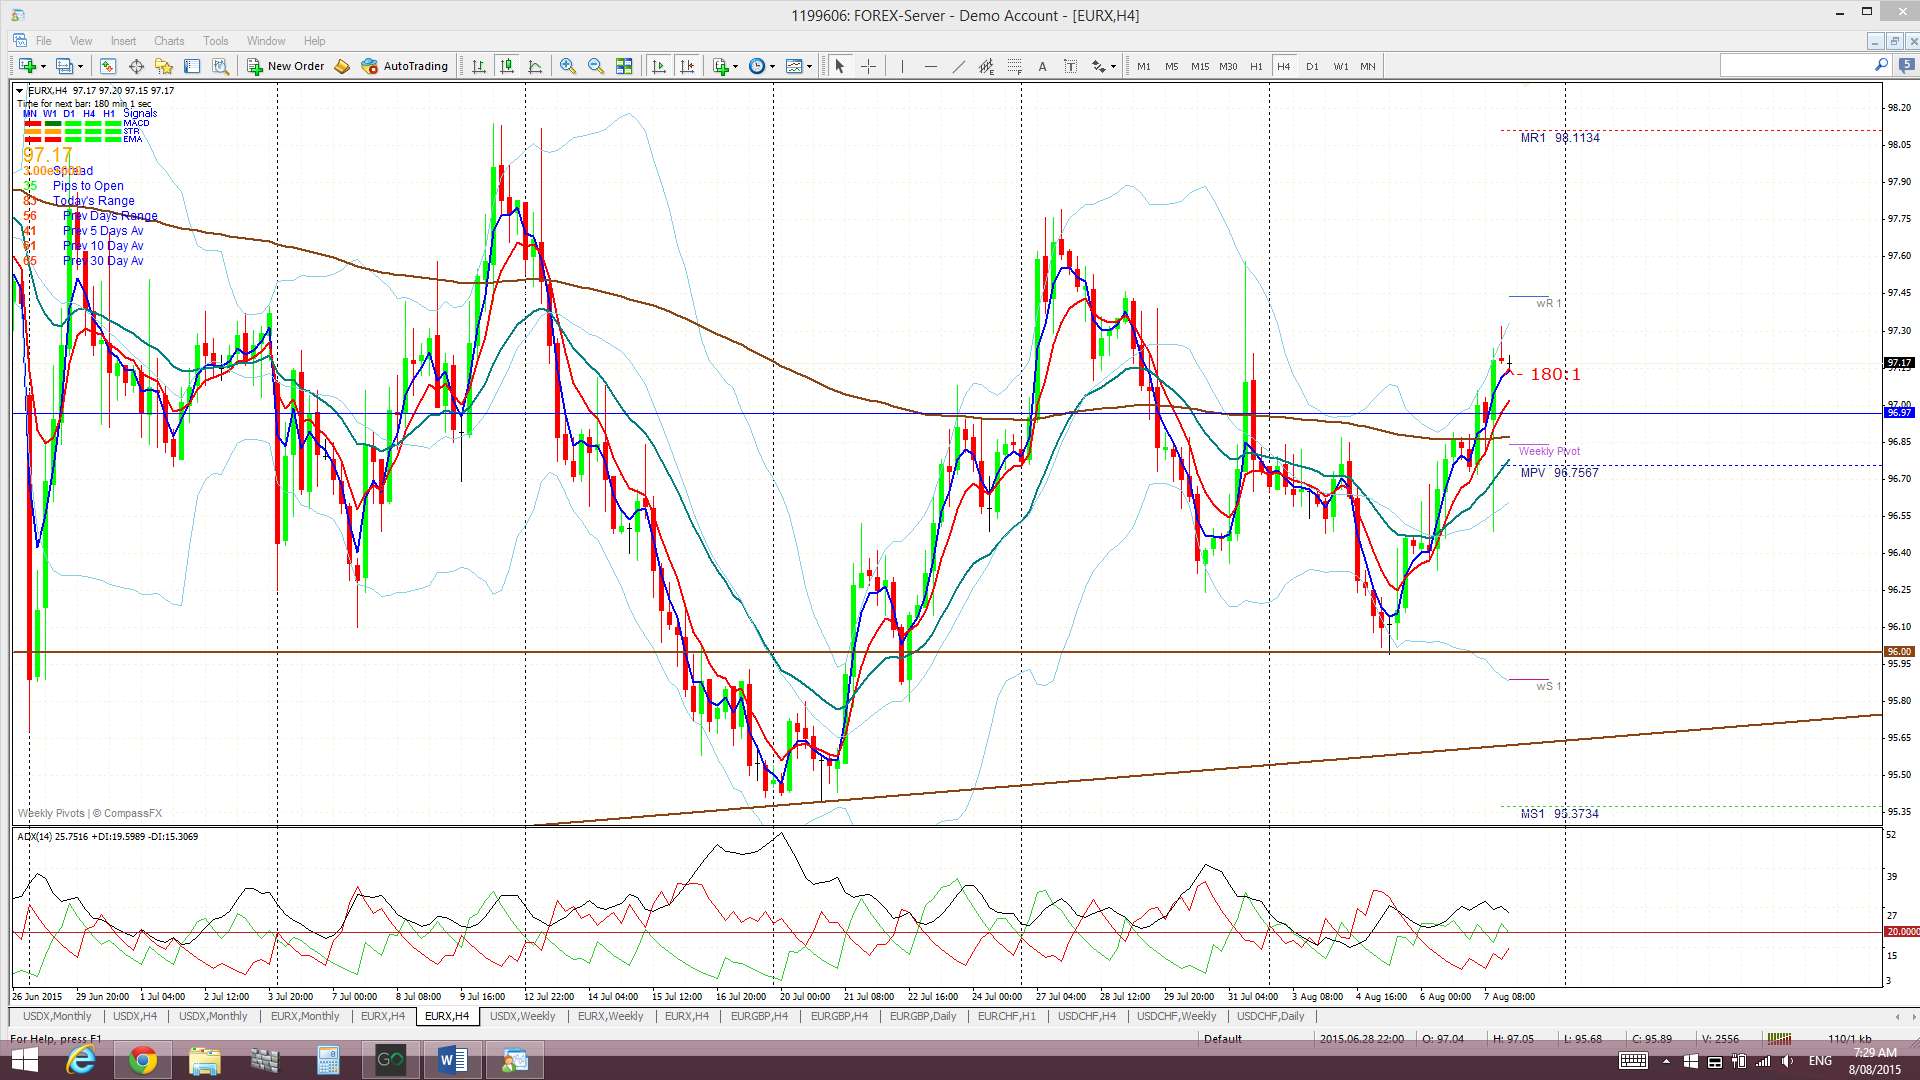
4 hr: Price chopped down and then up last week. Note how the 96 level was very effective support:
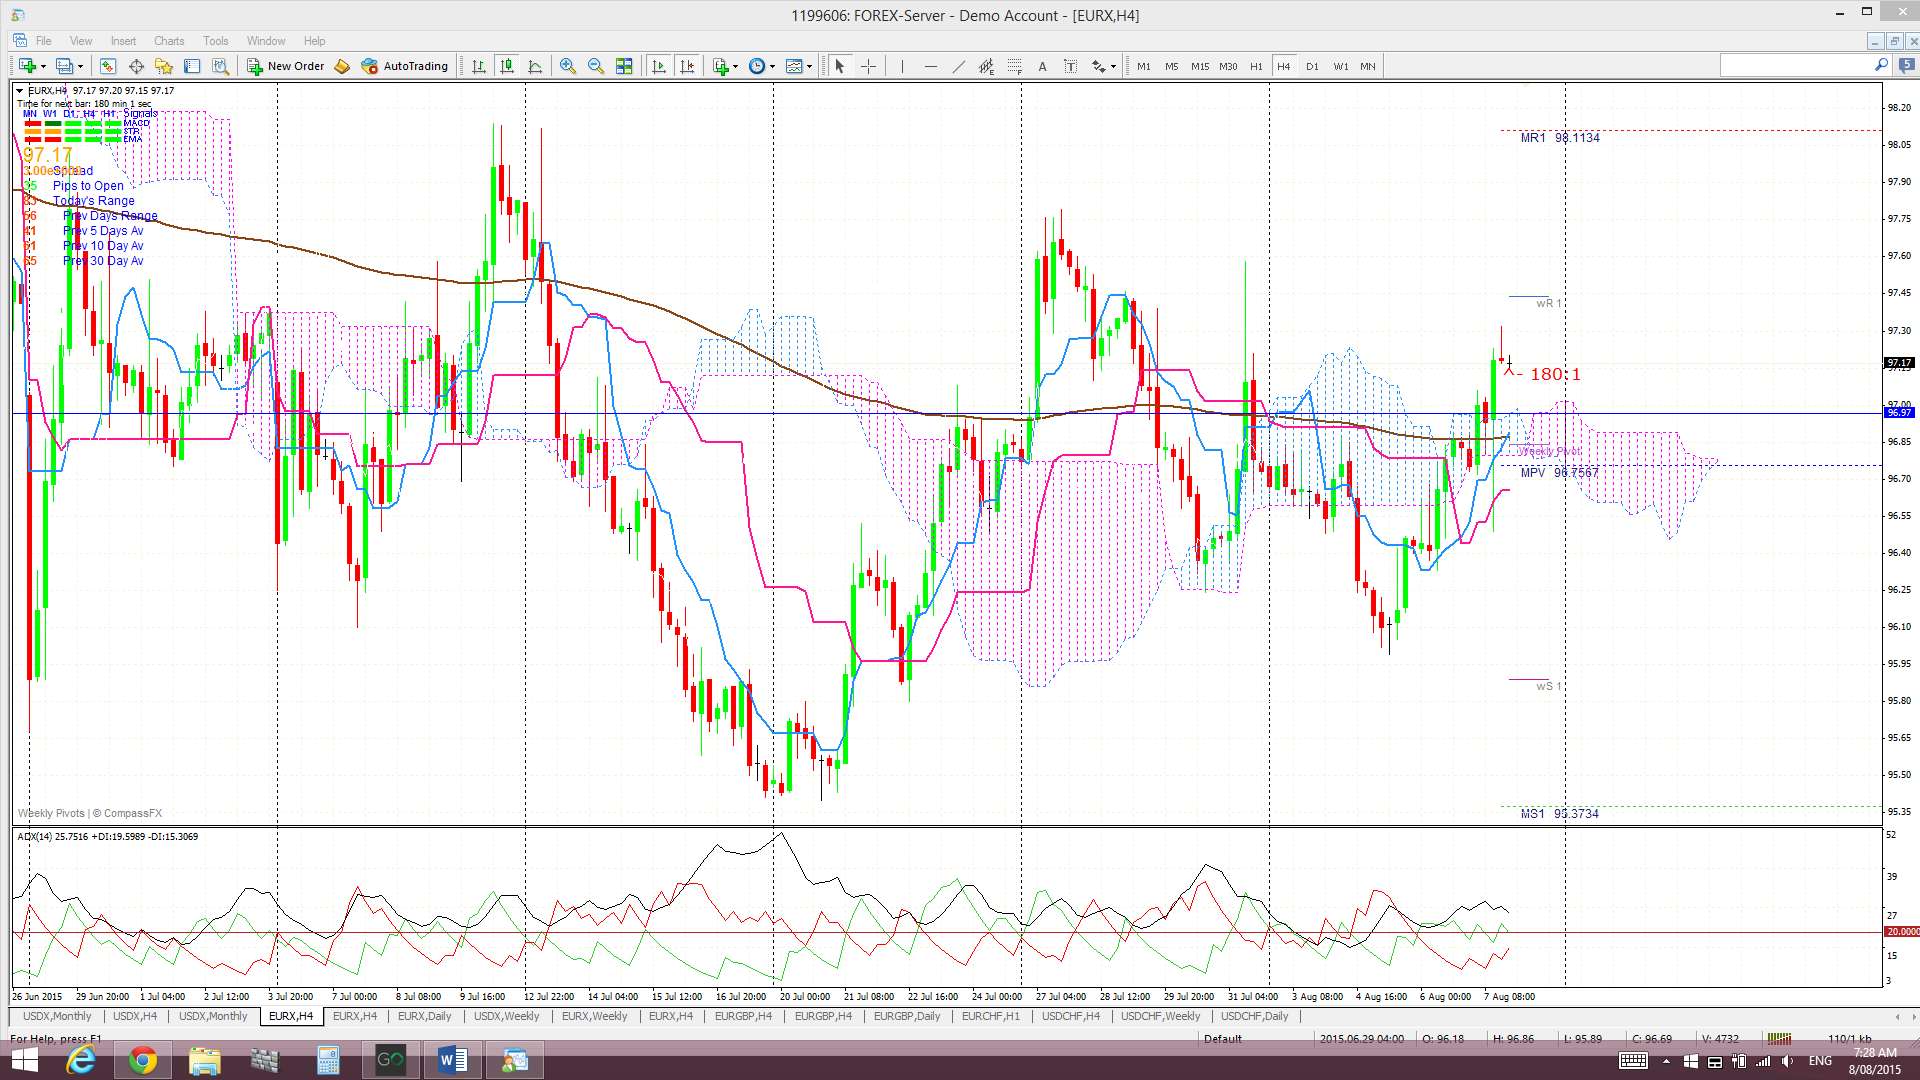
4 hr Ichimoku Cloud chart: The EURX traded in or just below the 4hr Cloud for most of last week but then rallied to finish above the Cloud. This chart is still divergent from the daily chart for now and suggests choppiness.
Comments:
General: As per last week:
- Both indices continue consolidating sideways in Flag patterns. These consolidation patterns have persisted for 5 months now!
- Both indices closed the week with small bullish candles.
- The EURX and USDX charts are not in alignment.
- Each week I keep anticipating which economic data-event might trigger a breakout from both of these index Flag patterns. I am beginning to think that there won’t be a decisive Flag breakout on either index until the Federal Reserve actually announce a specific date for a US interest rate hike.
USDX: The US$, although closing with a small bullish candle for the week, is still consolidating within a Flag pattern. The interesting point to note is that the US$ traded lower on Friday after NFP even though the jobs report wasn’t too disappointing. The wages and unemployment rate components came in on target but the slight miss with the number of jobs added must have been read by some as potentially giving the Fed a reason to delay any rate hike. Or perhaps there is another reason for the fall? Maybe the US$ fell with despair after seeing the polling results of the Republican debate? Regardless of the reason, with little US$ sensitive data on the calendar for next week, we may find these index Flag patters continue for a bit longer!
As mentioned over many recent weeks, I consider the US$ is still in no-man’s land whilst it trades above 92.50 and below 100. I am still waiting for a decisive breakout from this region to signal the next major directional move on the index as this choppy and range-bound price action has gone on for five months now.
Thus, the levels to keep watching on the USDX are:
- The Flag trend lines.
- The psychological 100 level above current price. This is the top of the recent trading range.
- The 92.50 level below current price. This is the bottom of the recent trading range.
EURX: The EURX closed higher for the week as well and is still holding above key support for the time being. The fact remains however that, even with the uncertainty of ongoing Greek-debt negotiations, the Eurozone is trading within a monetary easing cycle and the US is emerging from one.
The levels to watch on the EURX remain as:
- The Flag trend lines.
- The 105.5 level: The weekly chart reveals that a 61.8% fib retracement of the recent lengthy bear move is back up near the 105.50 level and weekly 200 EMA. Any hold back above 96 and continued recovery effort might see the index target this region.
- The 96 level:This is a major support level for the EURX and a possible bullish ‘Double Bottom’ region.
- The 94 level: Any break and hold back below 96 might suggest bearish continuation as it represents a break of the monthly charts ‘Double Bottom’. If so, the recent low printed near 94 will come back into focus.
Note: The analysis provided above is based purely on technical analysis of the current chart set ups. As always, Fundamental-style events, by way of any Ukraine, Eurozone or Middle East events and/or news announcements, continue to be unpredictable triggers for price movement on the indices. These events always have the potential to undermine any technical analysis.
The post US$: keeps us guessing. appeared first on www.forextell.com.