Last week: FX price action was a bit choppy last week given the huge amount of scheduled economic data. The GBP post-election relief rally on Friday triggered a new TC signal on the GBP/AUD but, as expected, it gave a wild ride throughout the day as the UK election result was gradually revealed. NFP failed to give the US$ a lift but US stocks took plenty from this data with most stock indices finishing with gains for the week.
This week:
The US$ continued to weaken last week but is still stuck below the key 95.50 level and above a support trend line. I’m watching for a clear breakout from this ‘no-man’s land’ region to try and gauge whether the next US$ move will be lower or higher. The failure of NFP to lift the US$ is quite telling and traders will be watching next week’s US Federal Budget Balance, Retail Sales & Consumer Sentiment data to see if any of these items can trigger a breakout move for the US$. An update on the FX Indices can be found through this link.
There was high impact Chinese CPI data released on Saturday that, whilst better than the last data release, was slightly weaker than expected so watch for any impact on FX pairs at market open.
E/U: This is sitting at a major cross-road level at 1.12 and forming up in a 4hr Flag pattern. Where to next for this pair?
Cable: This looks ready to try to take on the 1.55 level which, if successful, would void the bearish continuation pattern here. There is a lot of Cable data again next week to possibly trigger some reaction here.
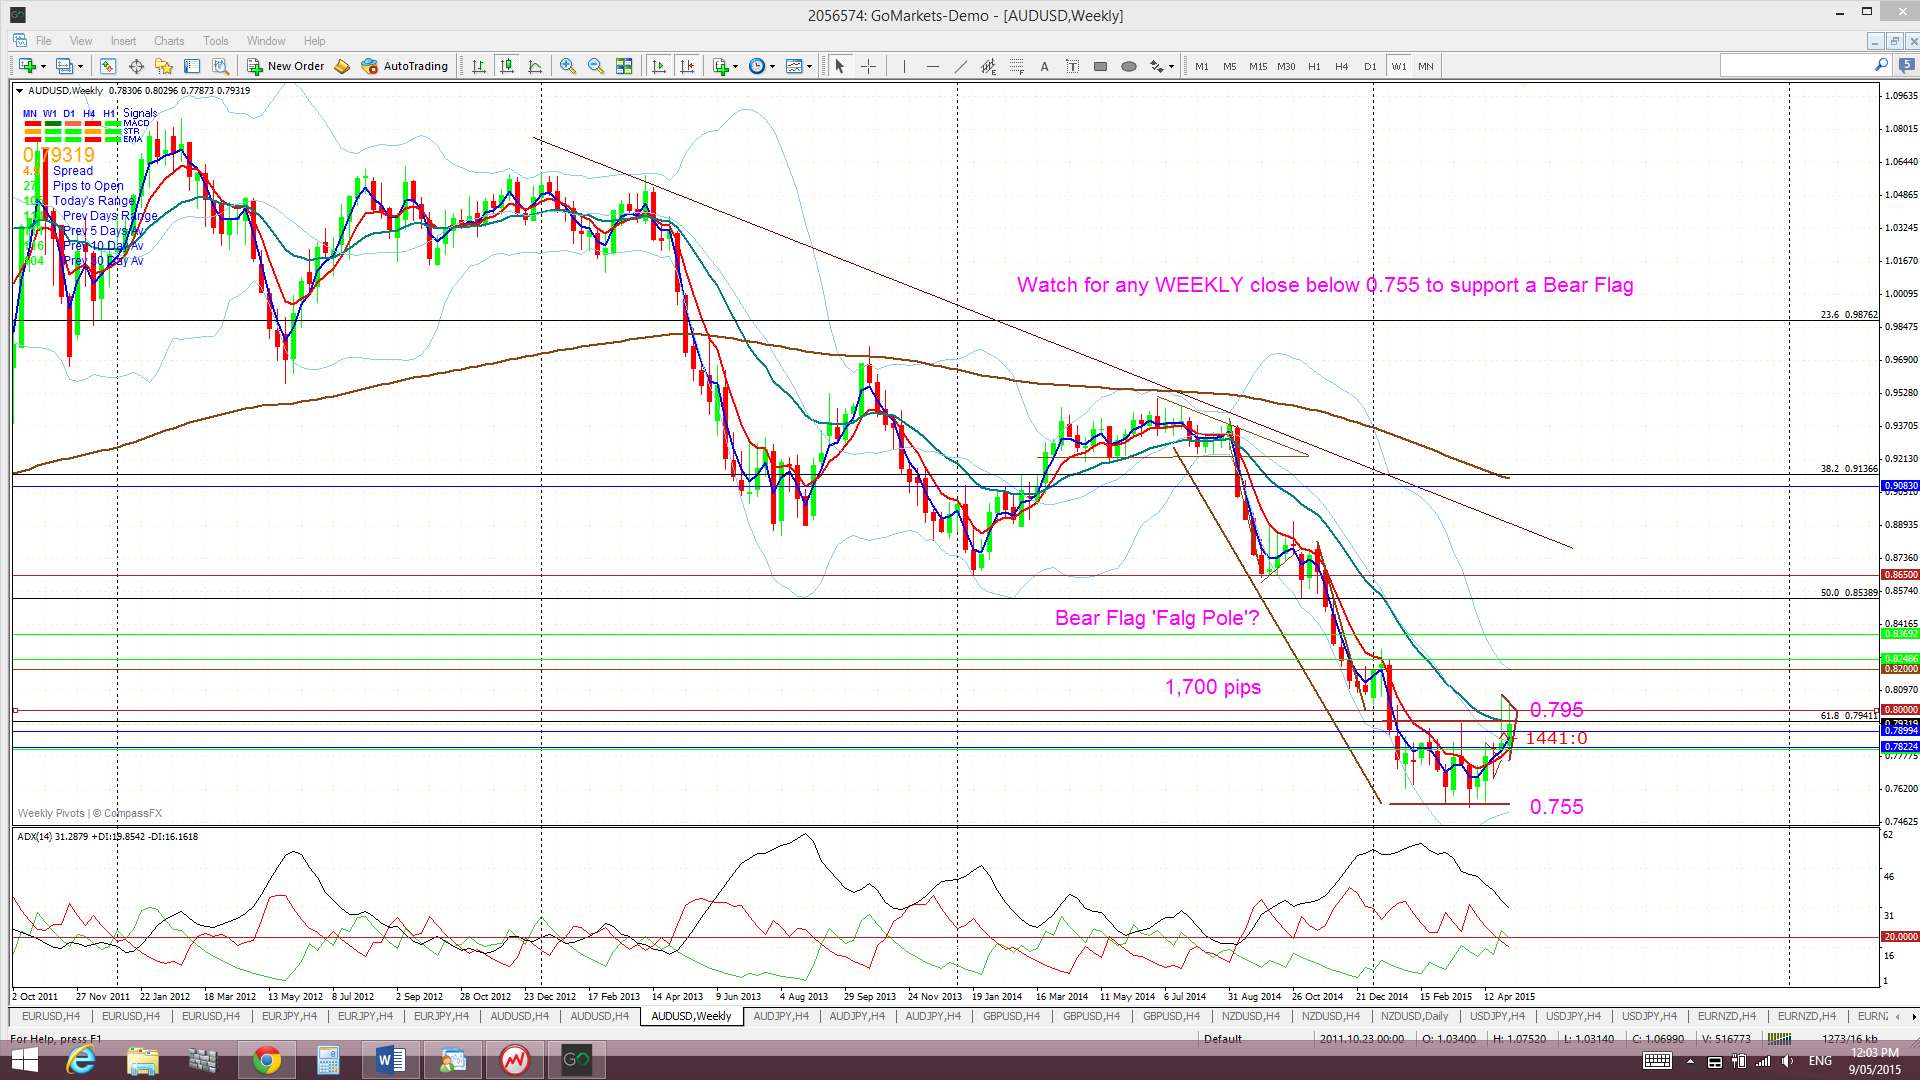
A/U: Is it a Bear Flag forming here or, rather, a basing pattern before future lift off? Also, why is the current 0.795 level so important for the A/U?
Kiwi: The NZD/USD is hovering above major support ahead of some key NZD data this week.
Silver & Gold: Both continue to consolidate whilst the US$ makes up its mind about which way to head next.
NB: I am away at the ATAA Conference from next Friday to Sunday and so there may not be any w/e updates next week.
Events in the Ukraine and the Middle East, as well as with Greek Debt talks, continue to have the potential to undermine any developing ‘risk’ appetite and need to be monitored.
Stocks and broader market sentiment:
Most US stock indices ended up notching a bullish week except for the NASDAQ. Despite a choppy week I note, again, that the S&P500 closed above 2,100, the DJIA above 18,000 and the NASDAQ above 5,000. Friday’s NFP helped to lift trading sentiment as the steady employment levels but weaker wages data was interpreted as meaning that US rates will be kept on hold for the time being.
I think a few extra charts might be worth noting here this week whilst all the Bears are out in force (click on the images to make larger):
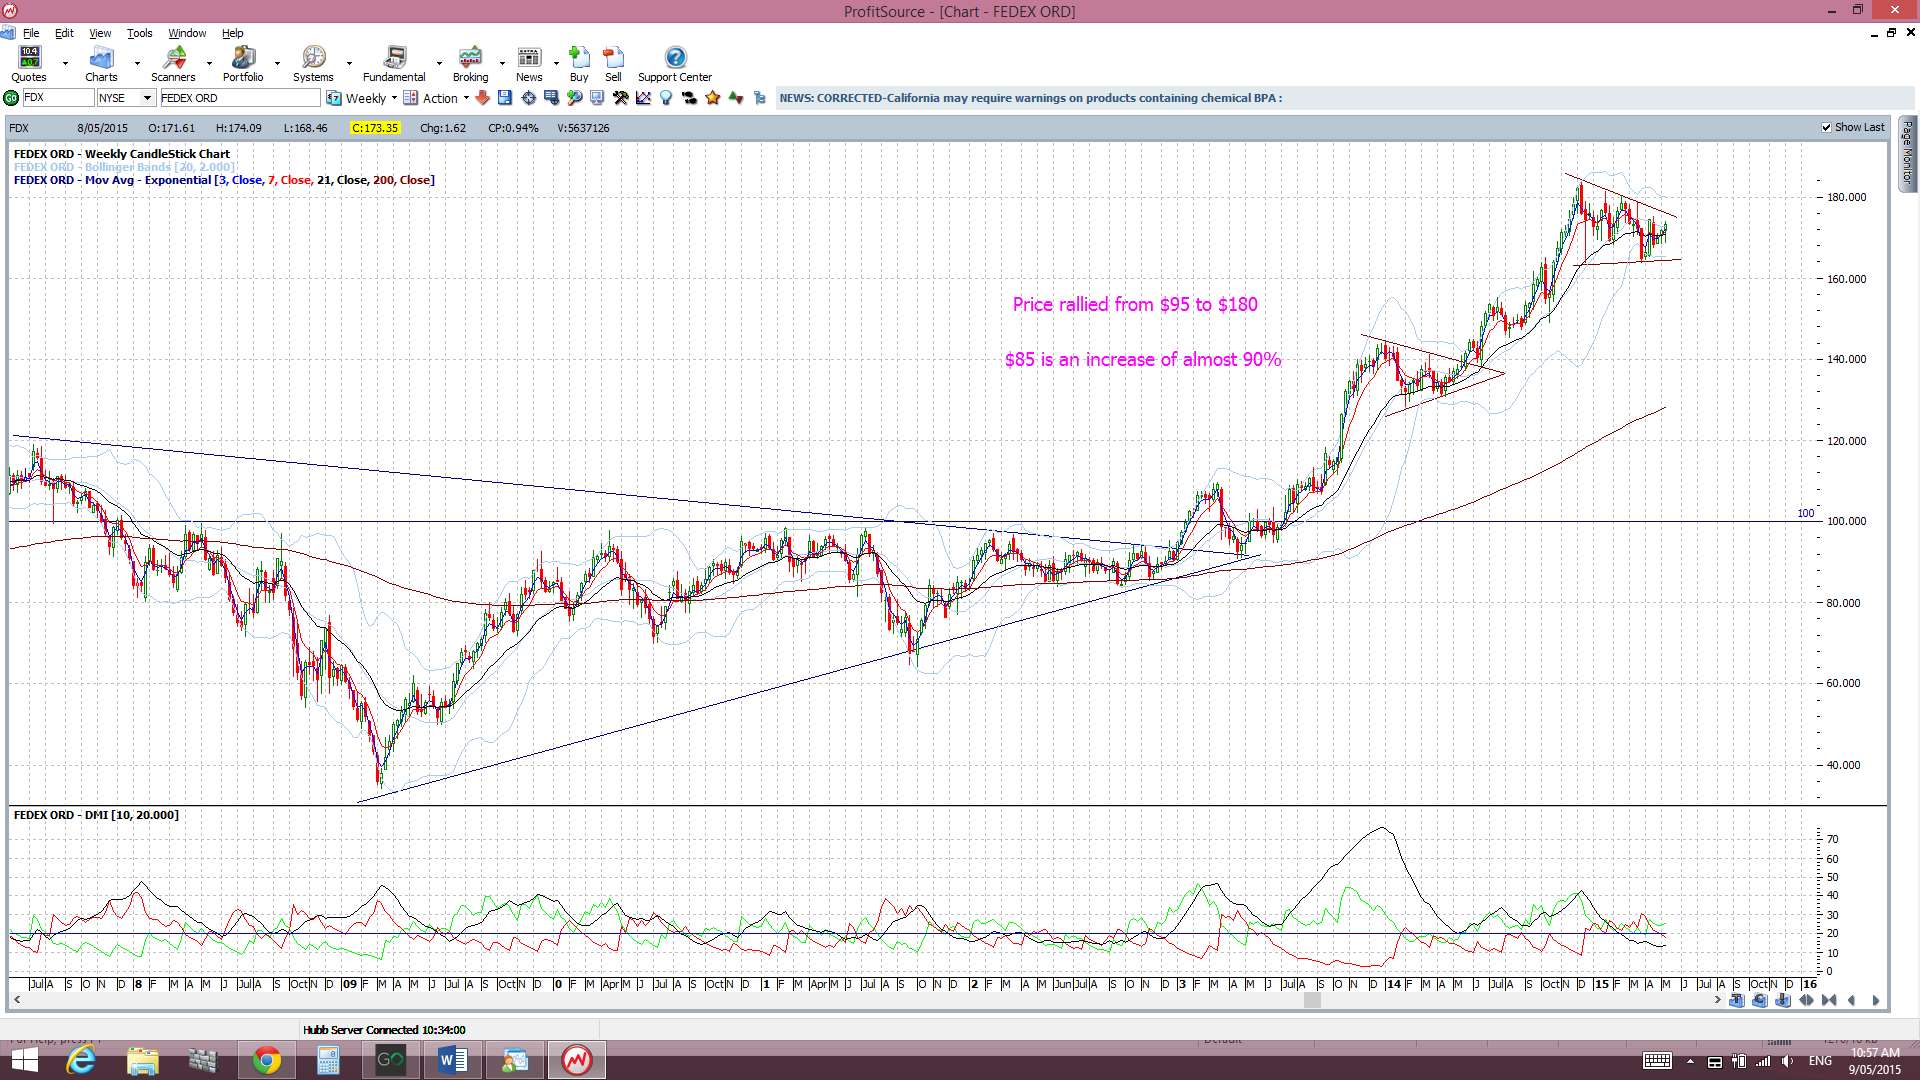
FEDEX weekly: this is another ‘bellwether’ stock that remains above support and, if anything, in a possible Bull Flag:
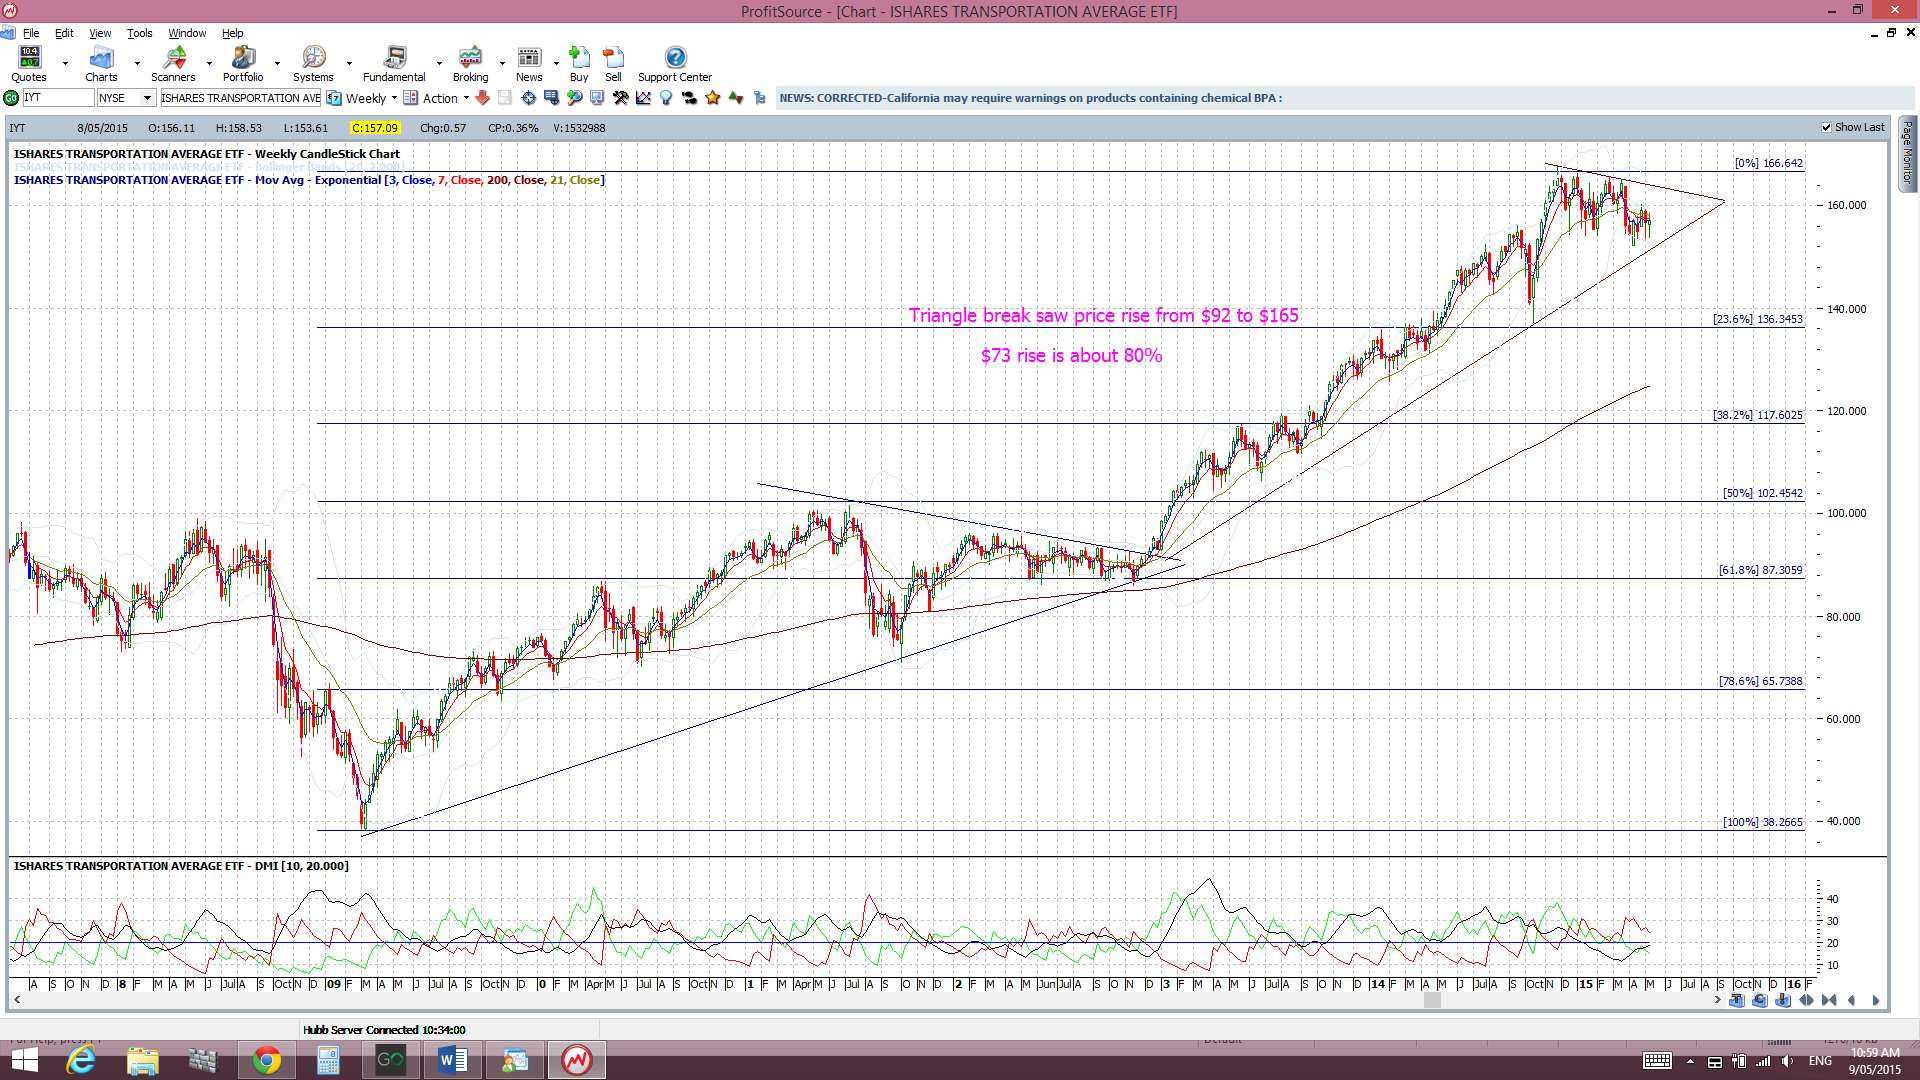
IYT Transport ETF: this ETF is another ‘bellwether’ and holding up for now too:
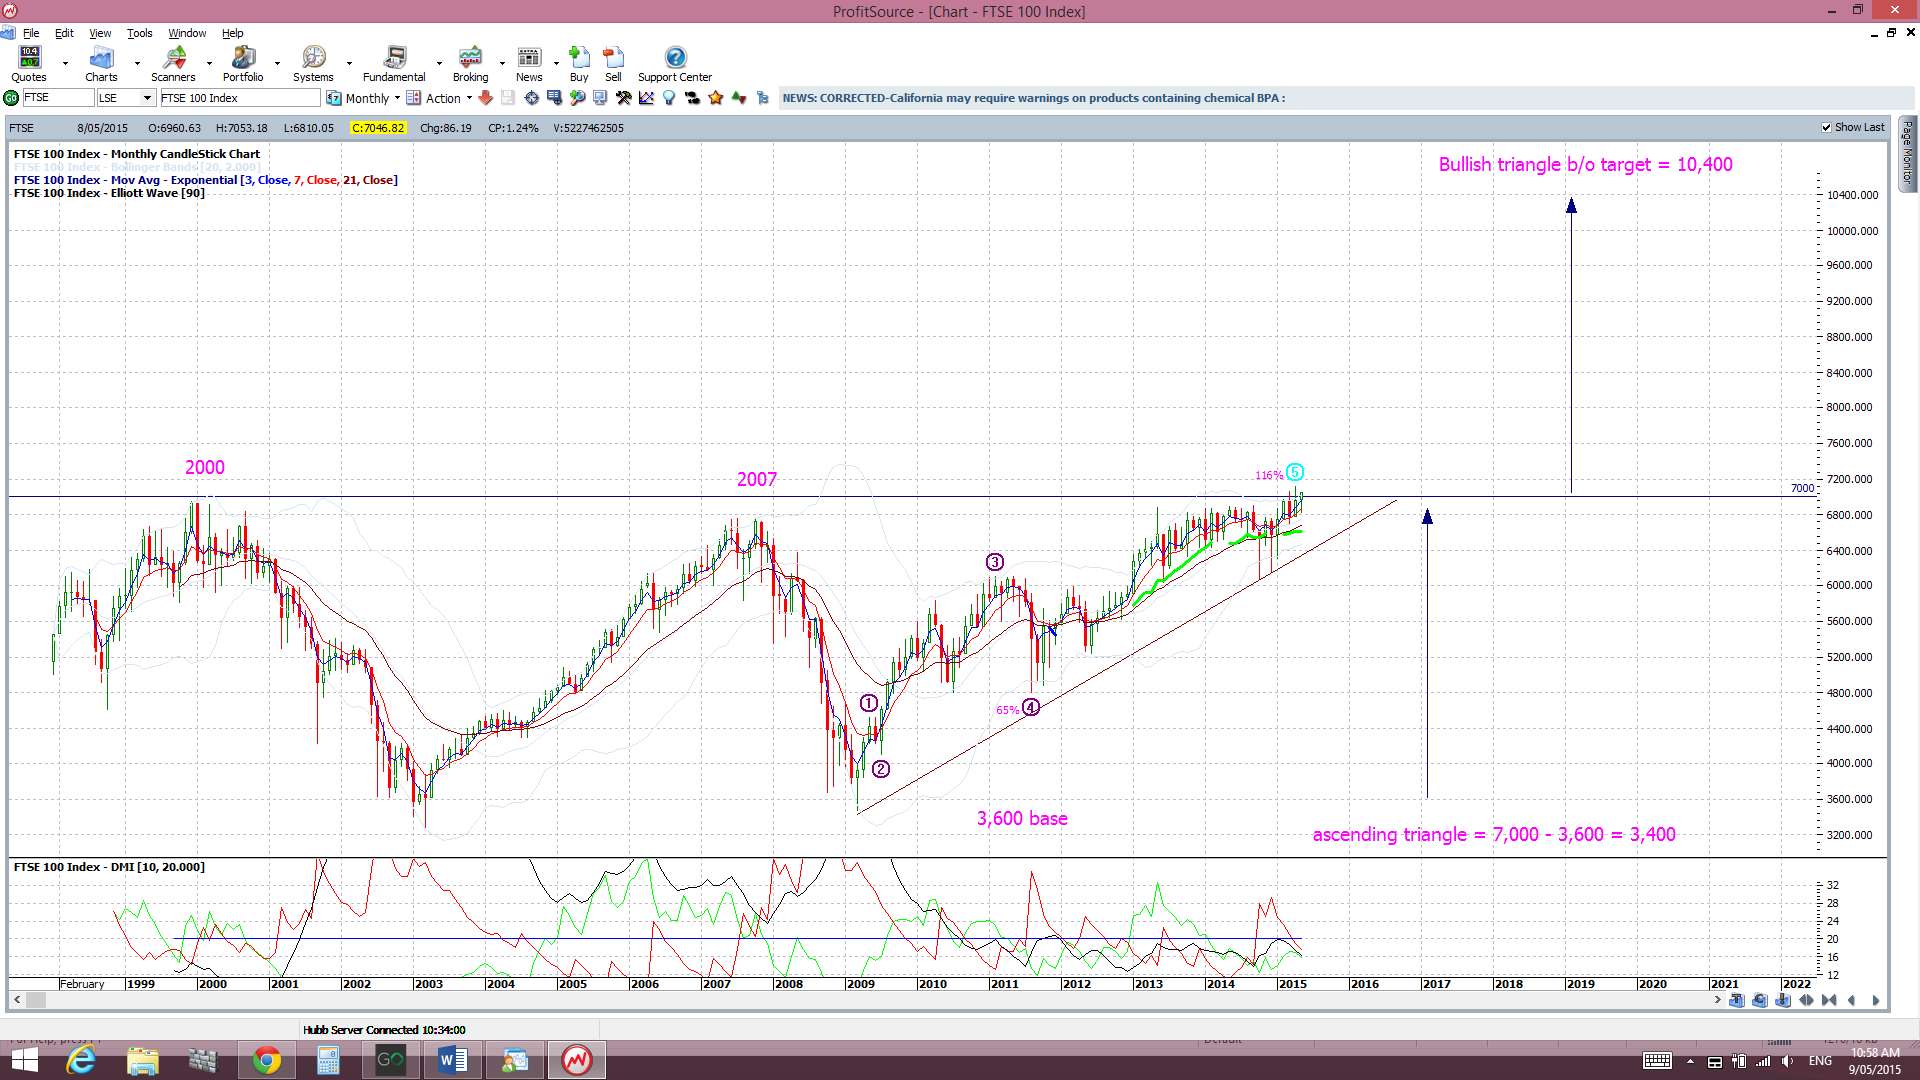
FTSE monthly: the FTSE is taking on the 7,000 again:
<
p style=”text-align: justify”>
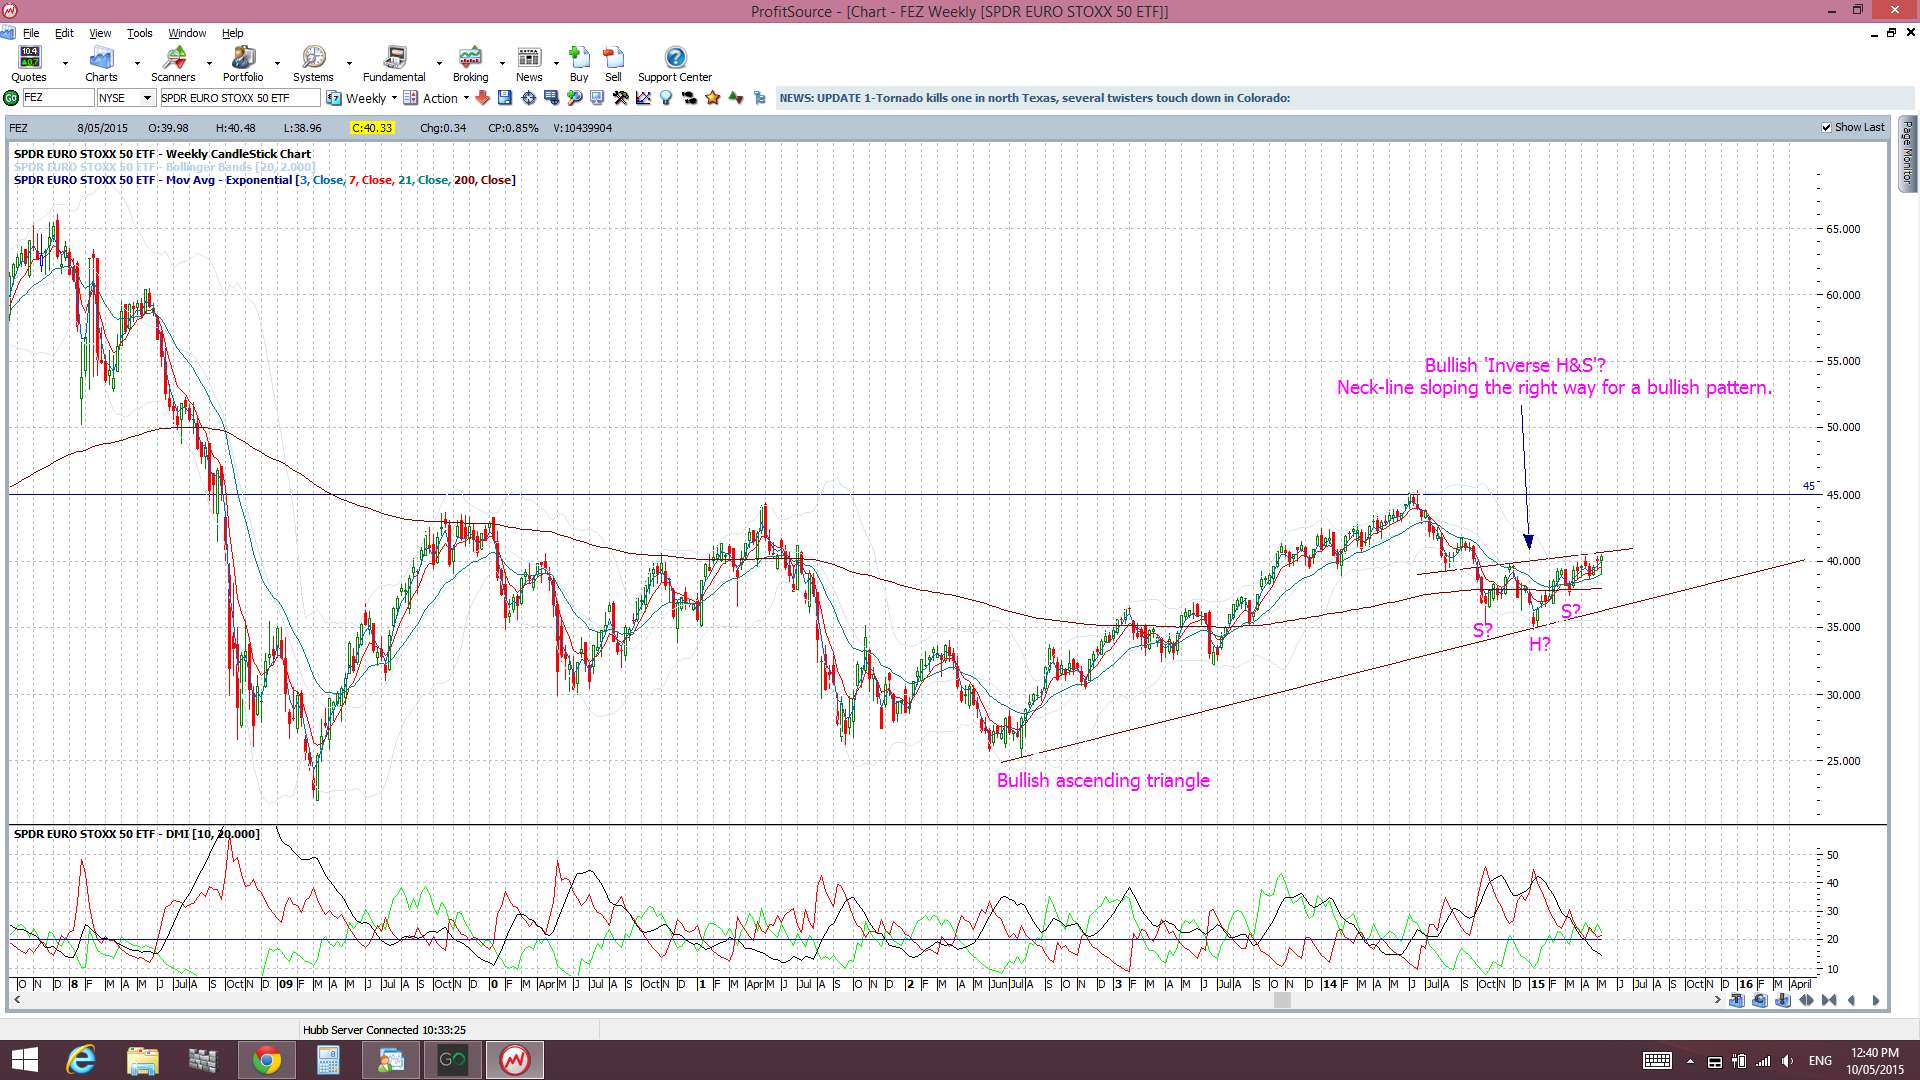
FEZ weekly: Euro STOXX 50 ETF: watching for any bullish breakout here too:
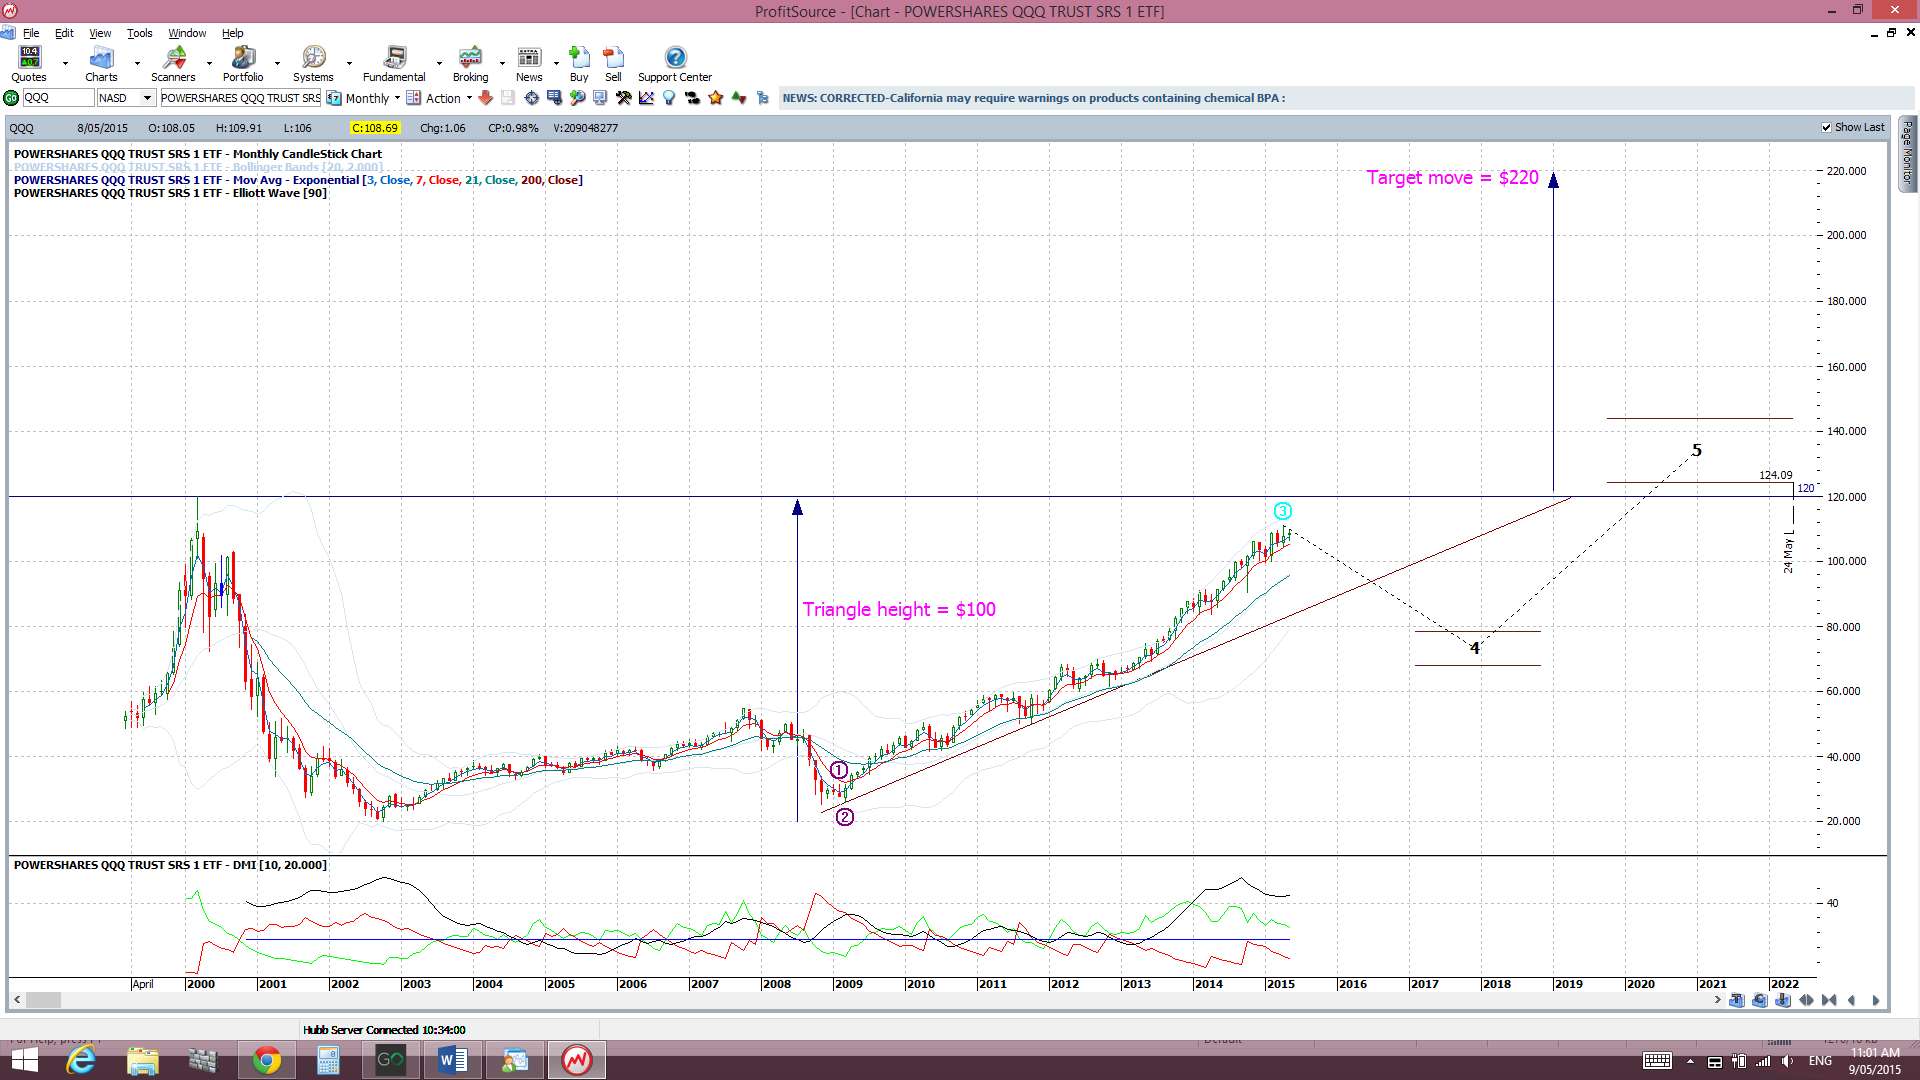
QQQ The NASDAQ-100 ETF: $120 seems like a target here:
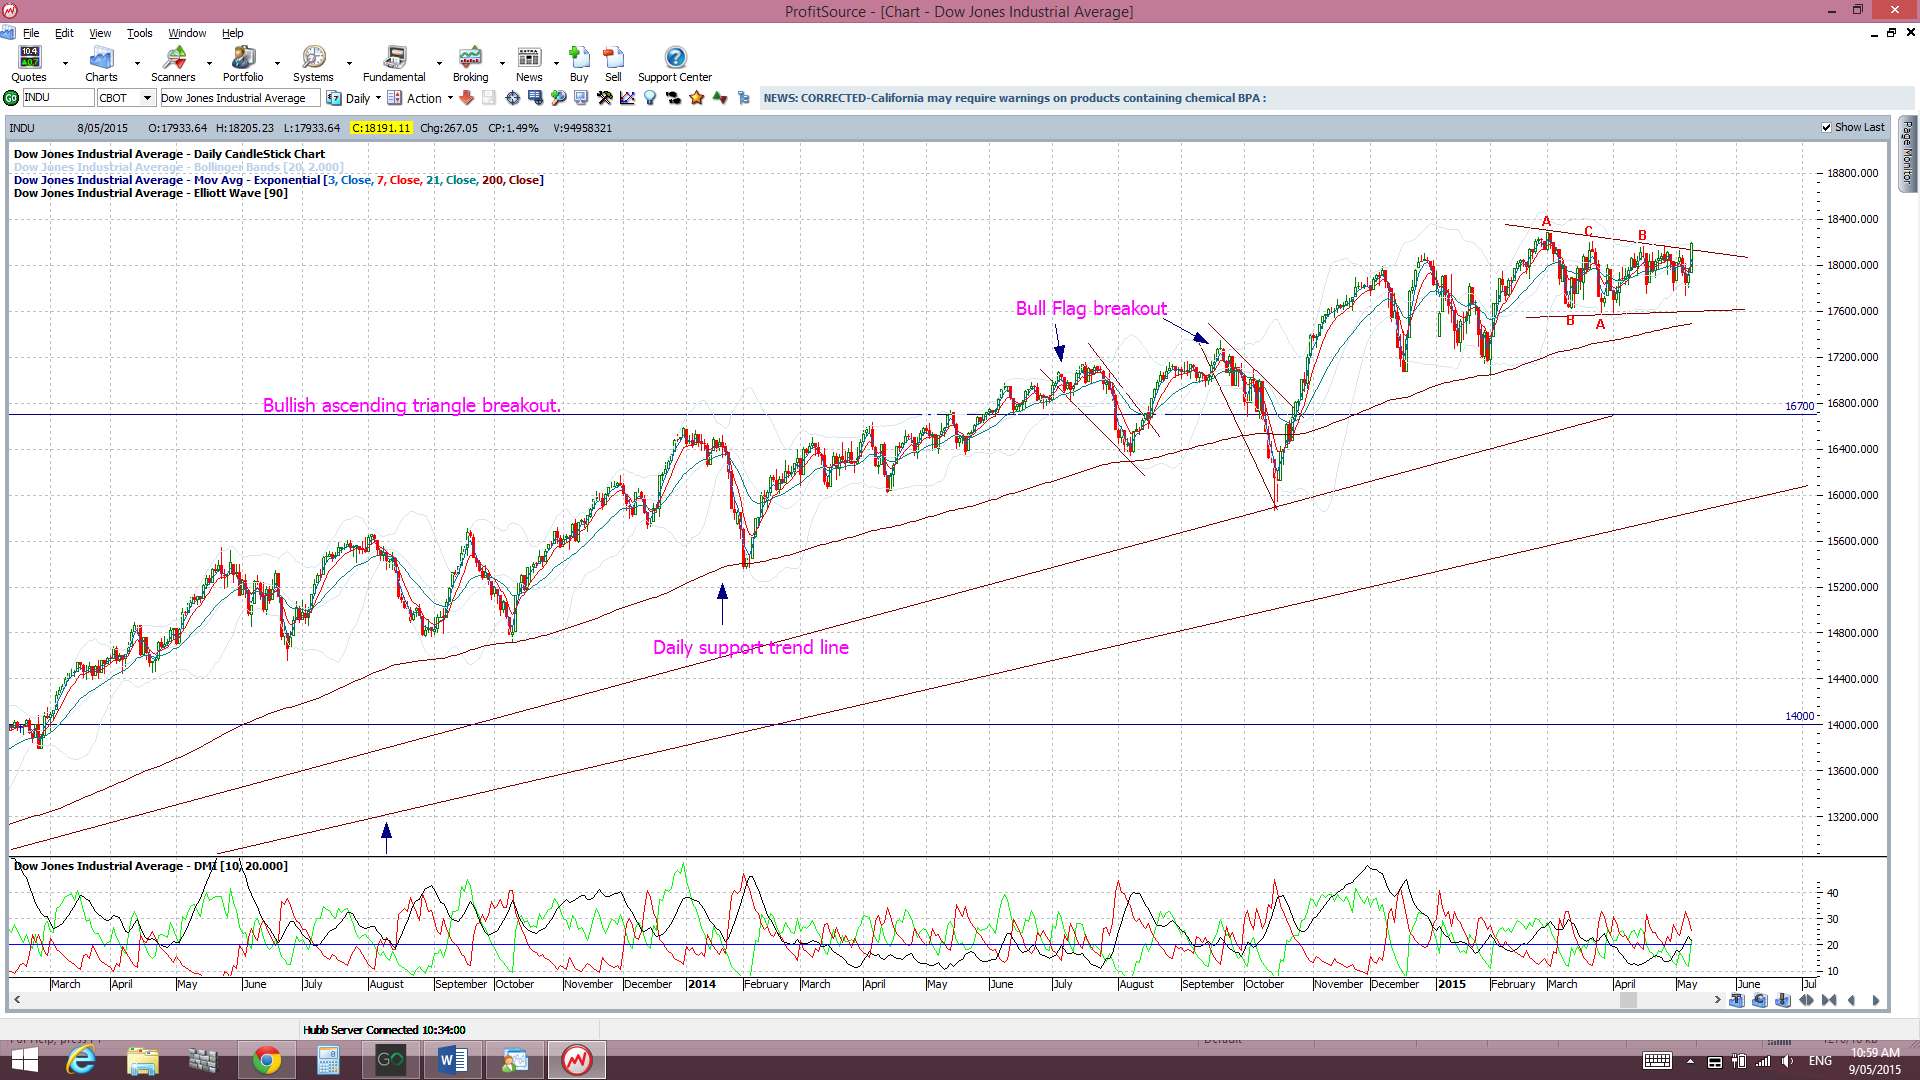
DJIA daily: this looks to have made a bullish Flag breakout:
Thus, I continue to watch out for further clues as to any new momentum move, long or short though! In particular I’m looking out for:
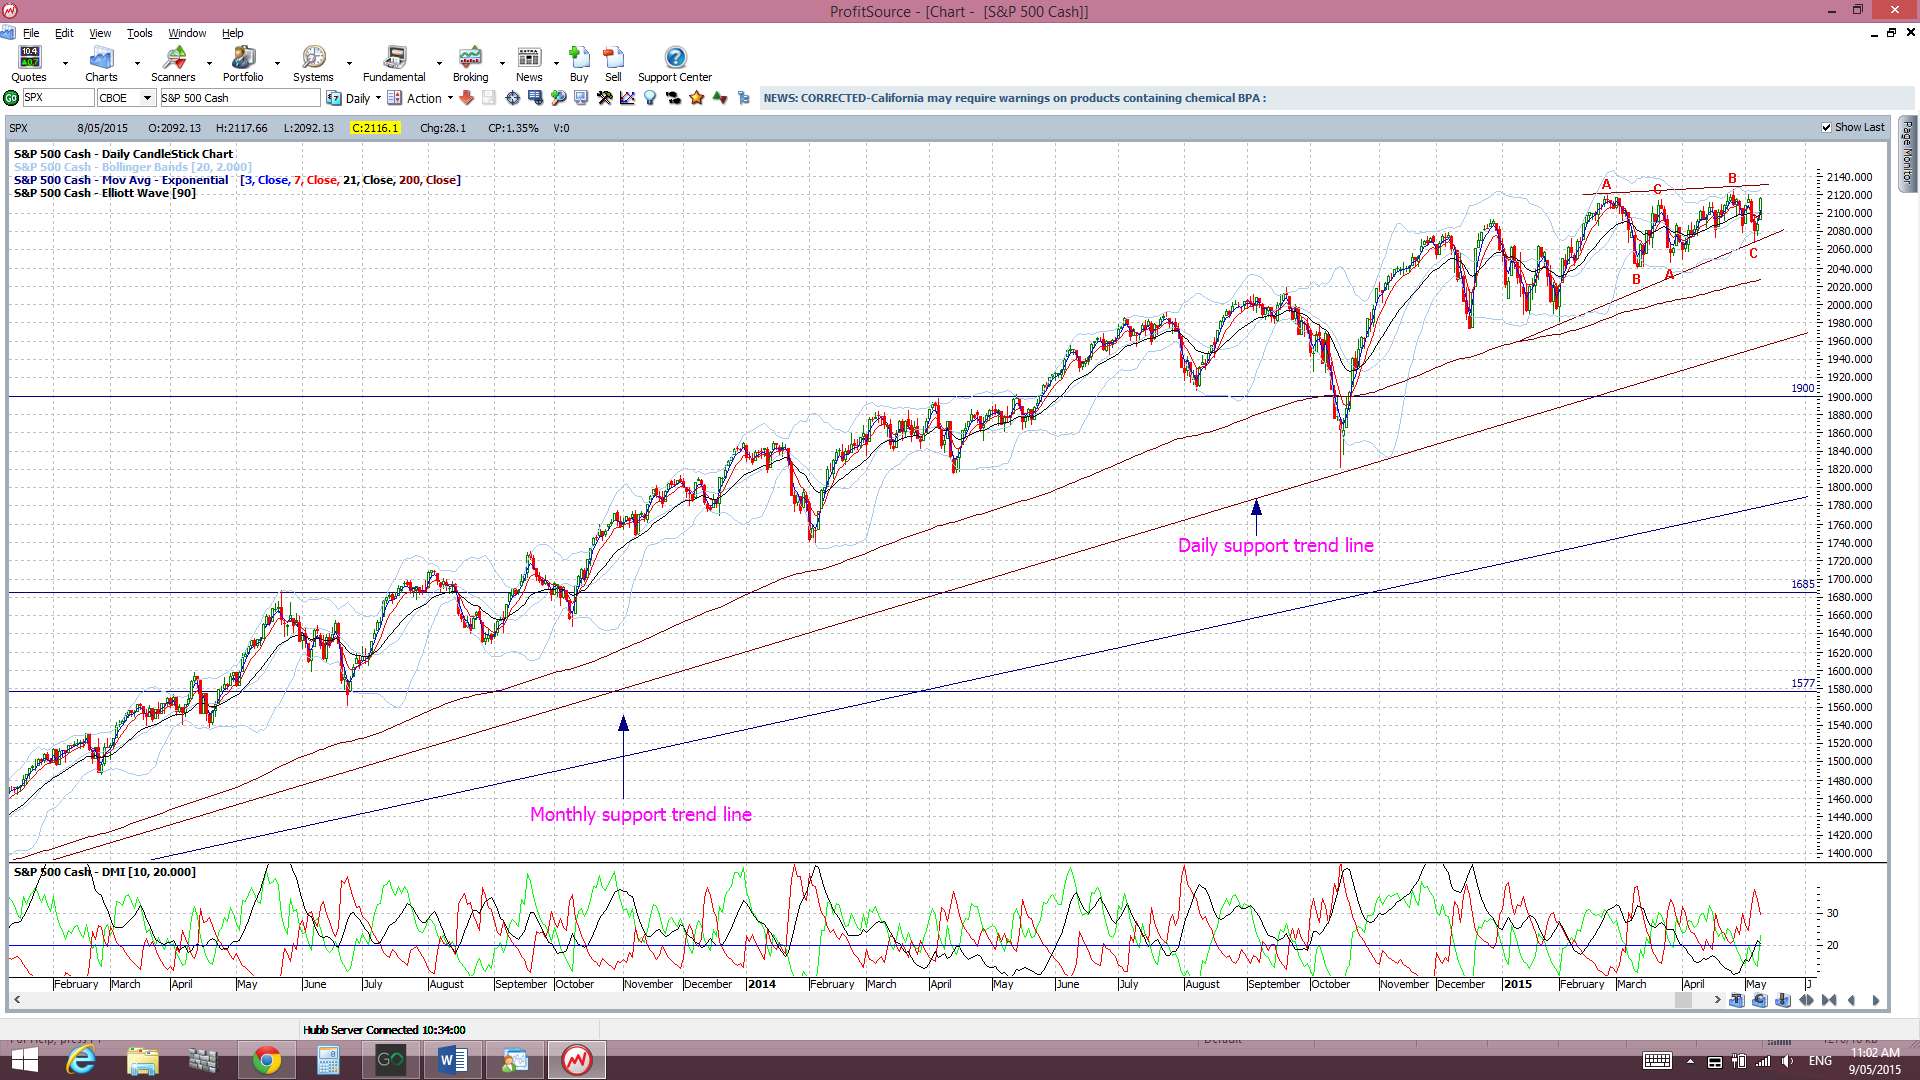
S&P500 daily chart: The index is still trading above the psychological 2,100 level and above daily trend line support. The possible bearish ascending wedge is still in play here and so I’ll keep watching these trend lines:
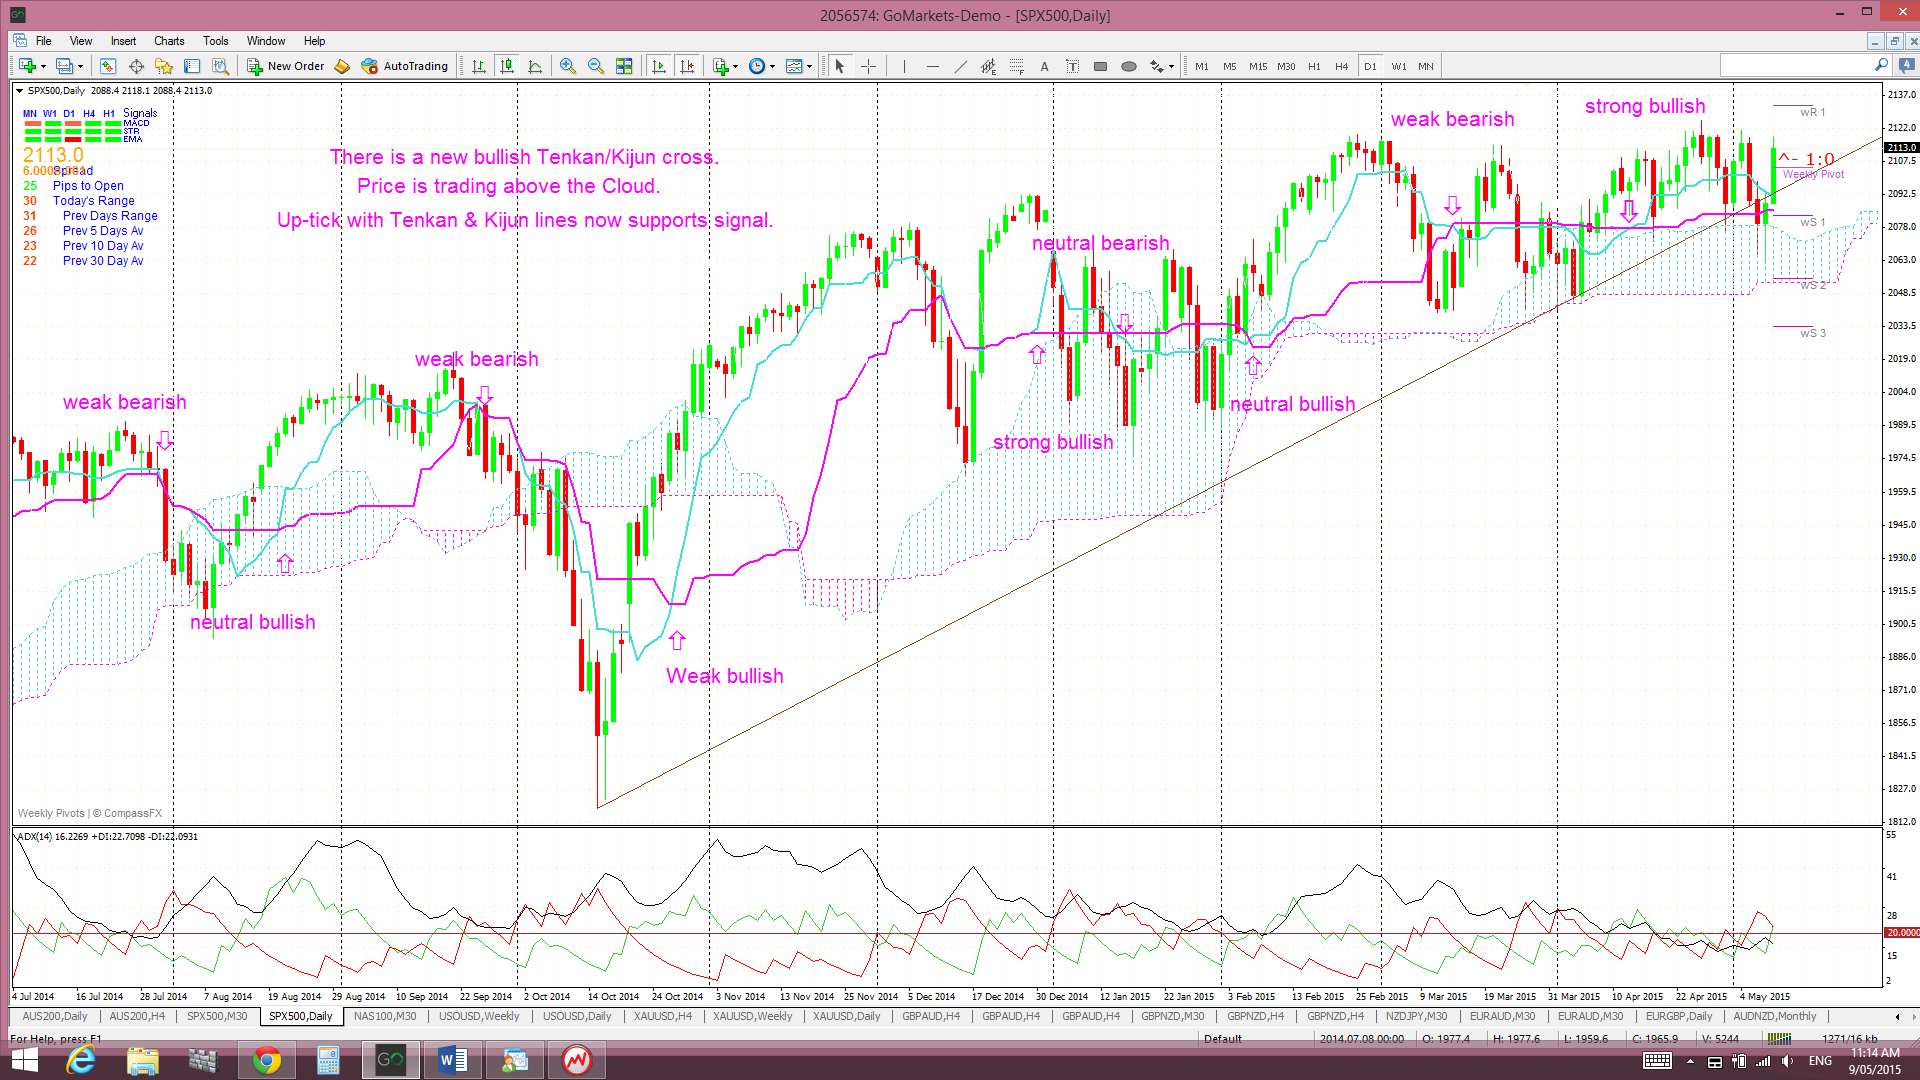
Ichimoku S&P500 chart: a clear cross of the blue Tenkan-sen line below the pink Kijun-sen line. There has been a recent bullish Tenkan/Kijun cross here and this evolved above the Cloud and so is deemed a ‘STRONG’ signal. Price pulled back to test the Cloud but this has acted as effective support for the time being:
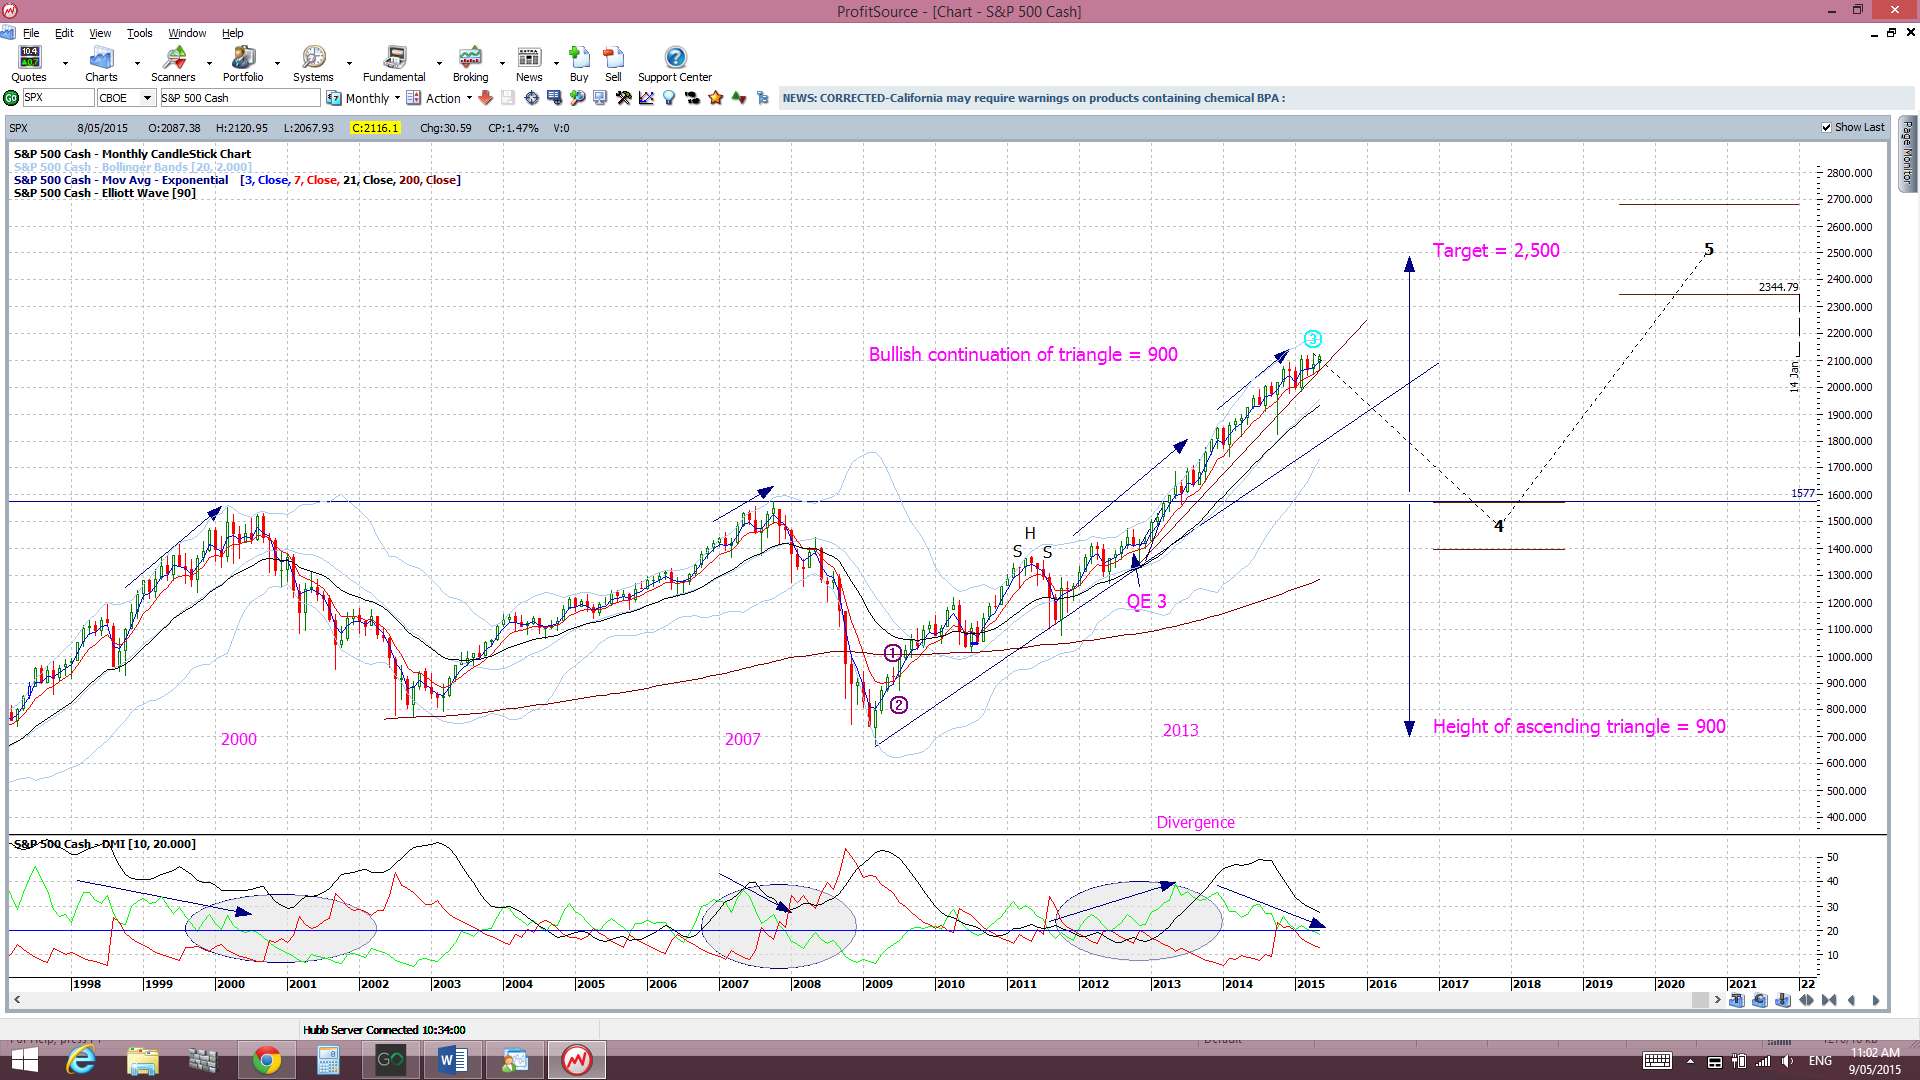
S&P500 monthly chart: a break of the monthly support trend line. The monthly trend line remains intact. A break of this support level would suggest to me of a more severe pull back or correction.
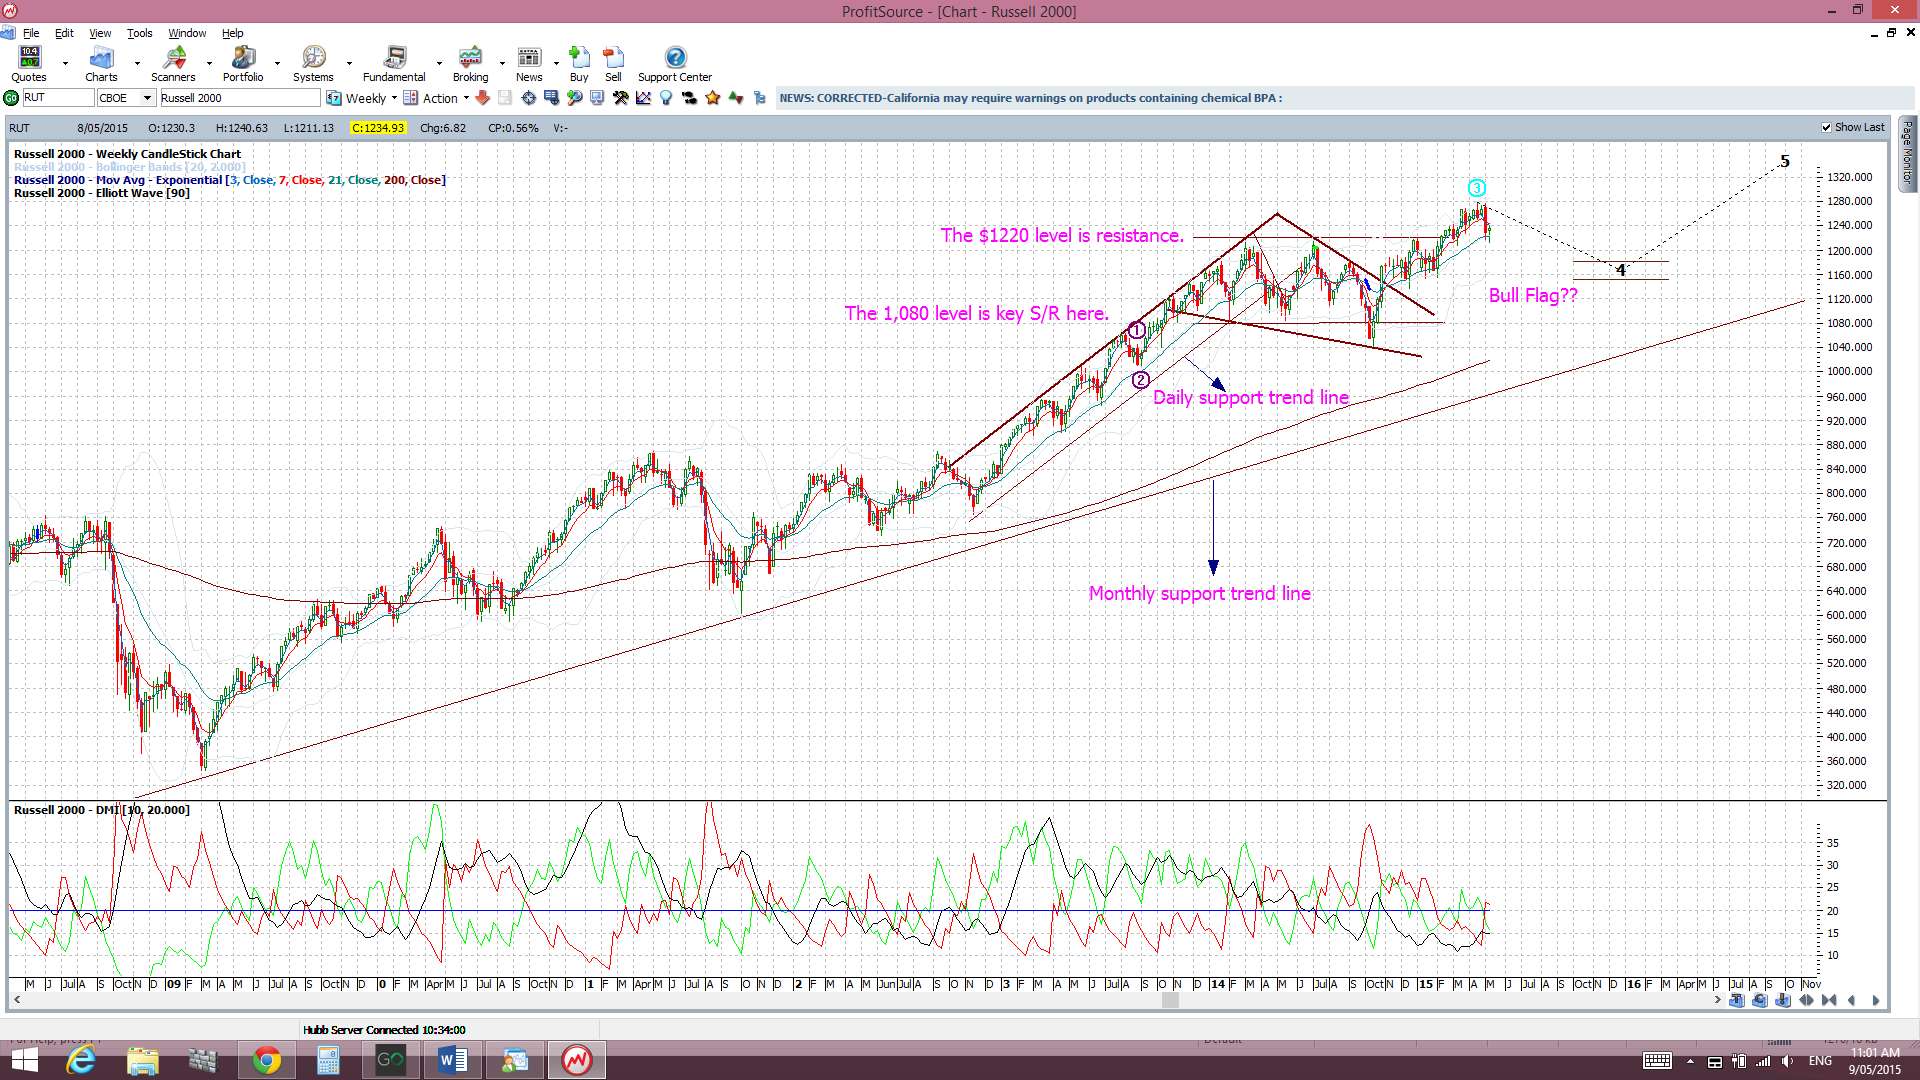
Russell 2000 Index: this small caps index is considered a US market ‘bellwether’. This is still trading above the key 1,220 level and printed a bullish coloured weekly candle.
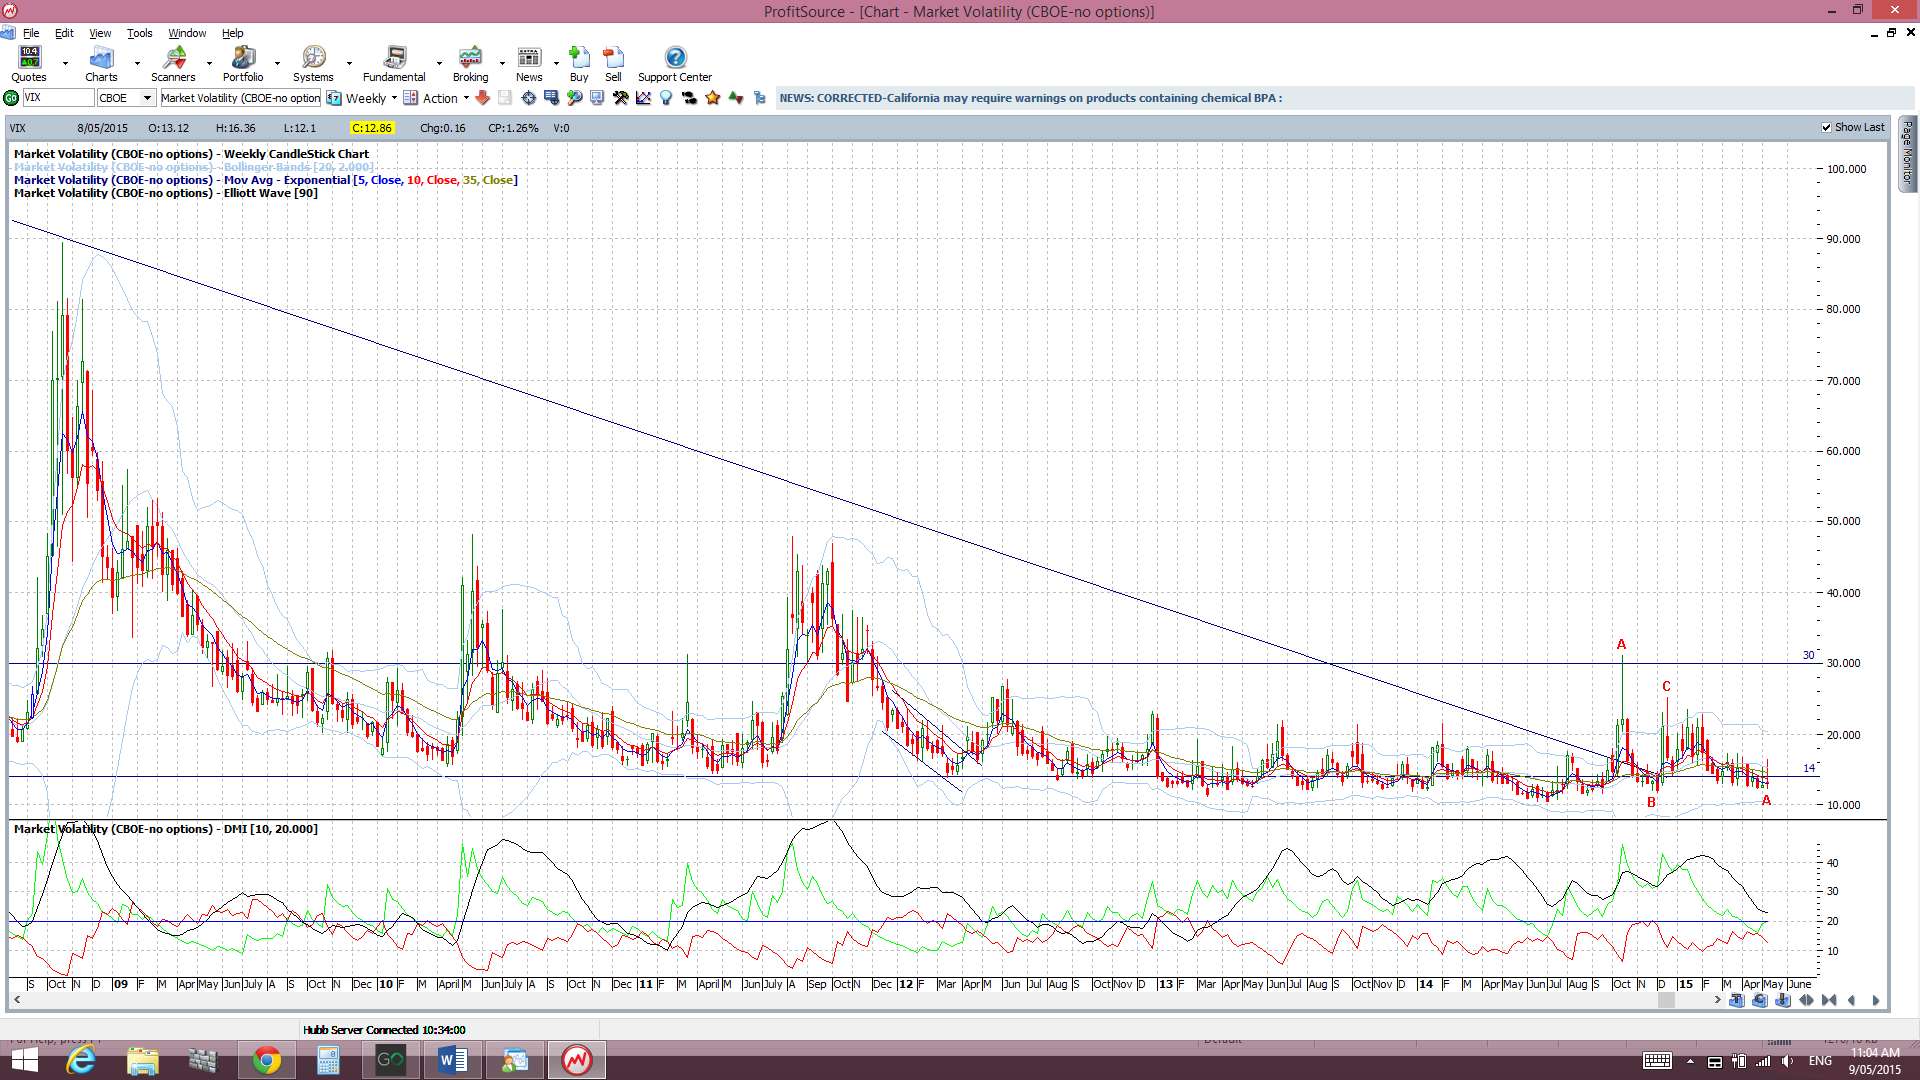
VIX Index: The ‘Fear’ index is still below the 14 level and printed a bearish weekly candle.
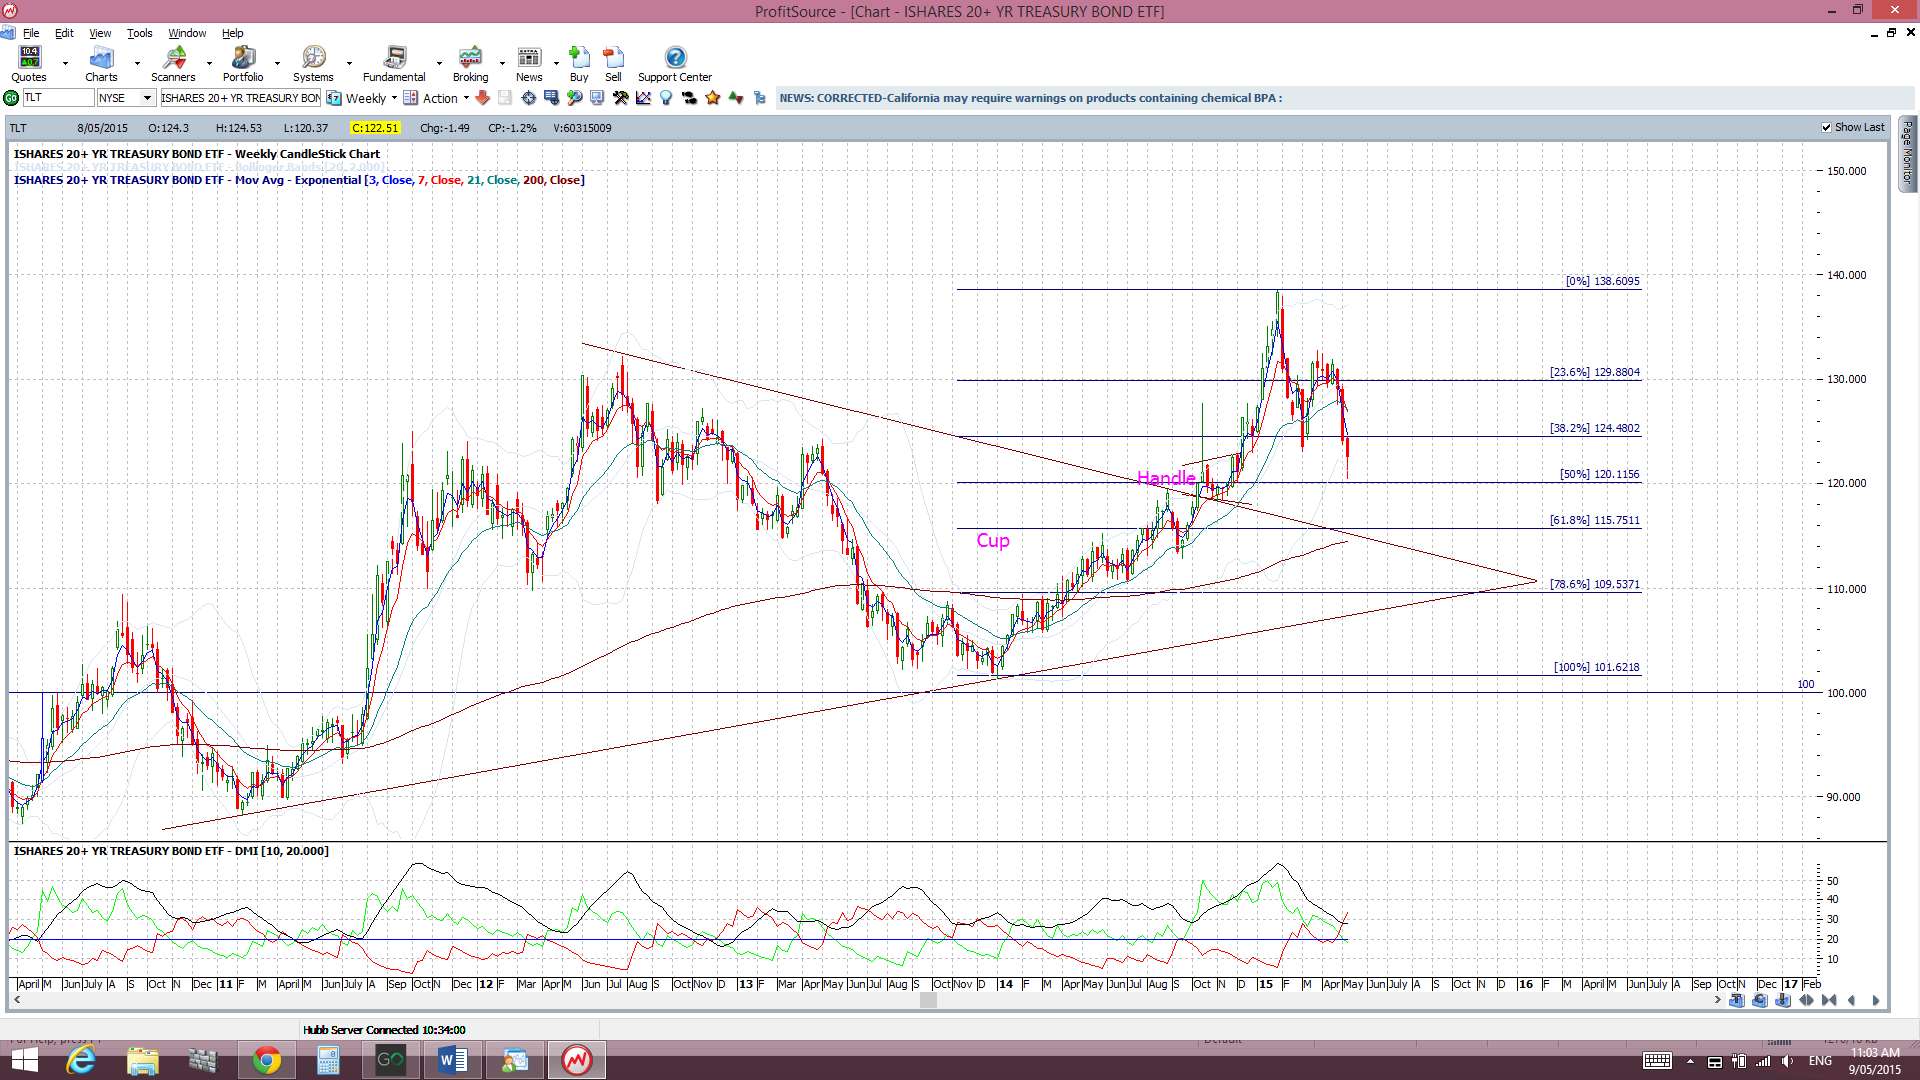
Bonds: The bond ETF has had a bearish week again despite the weaker US$. The comments about, so-called, high stock valuations from Fed Chair Yellen didn’t help bonds:
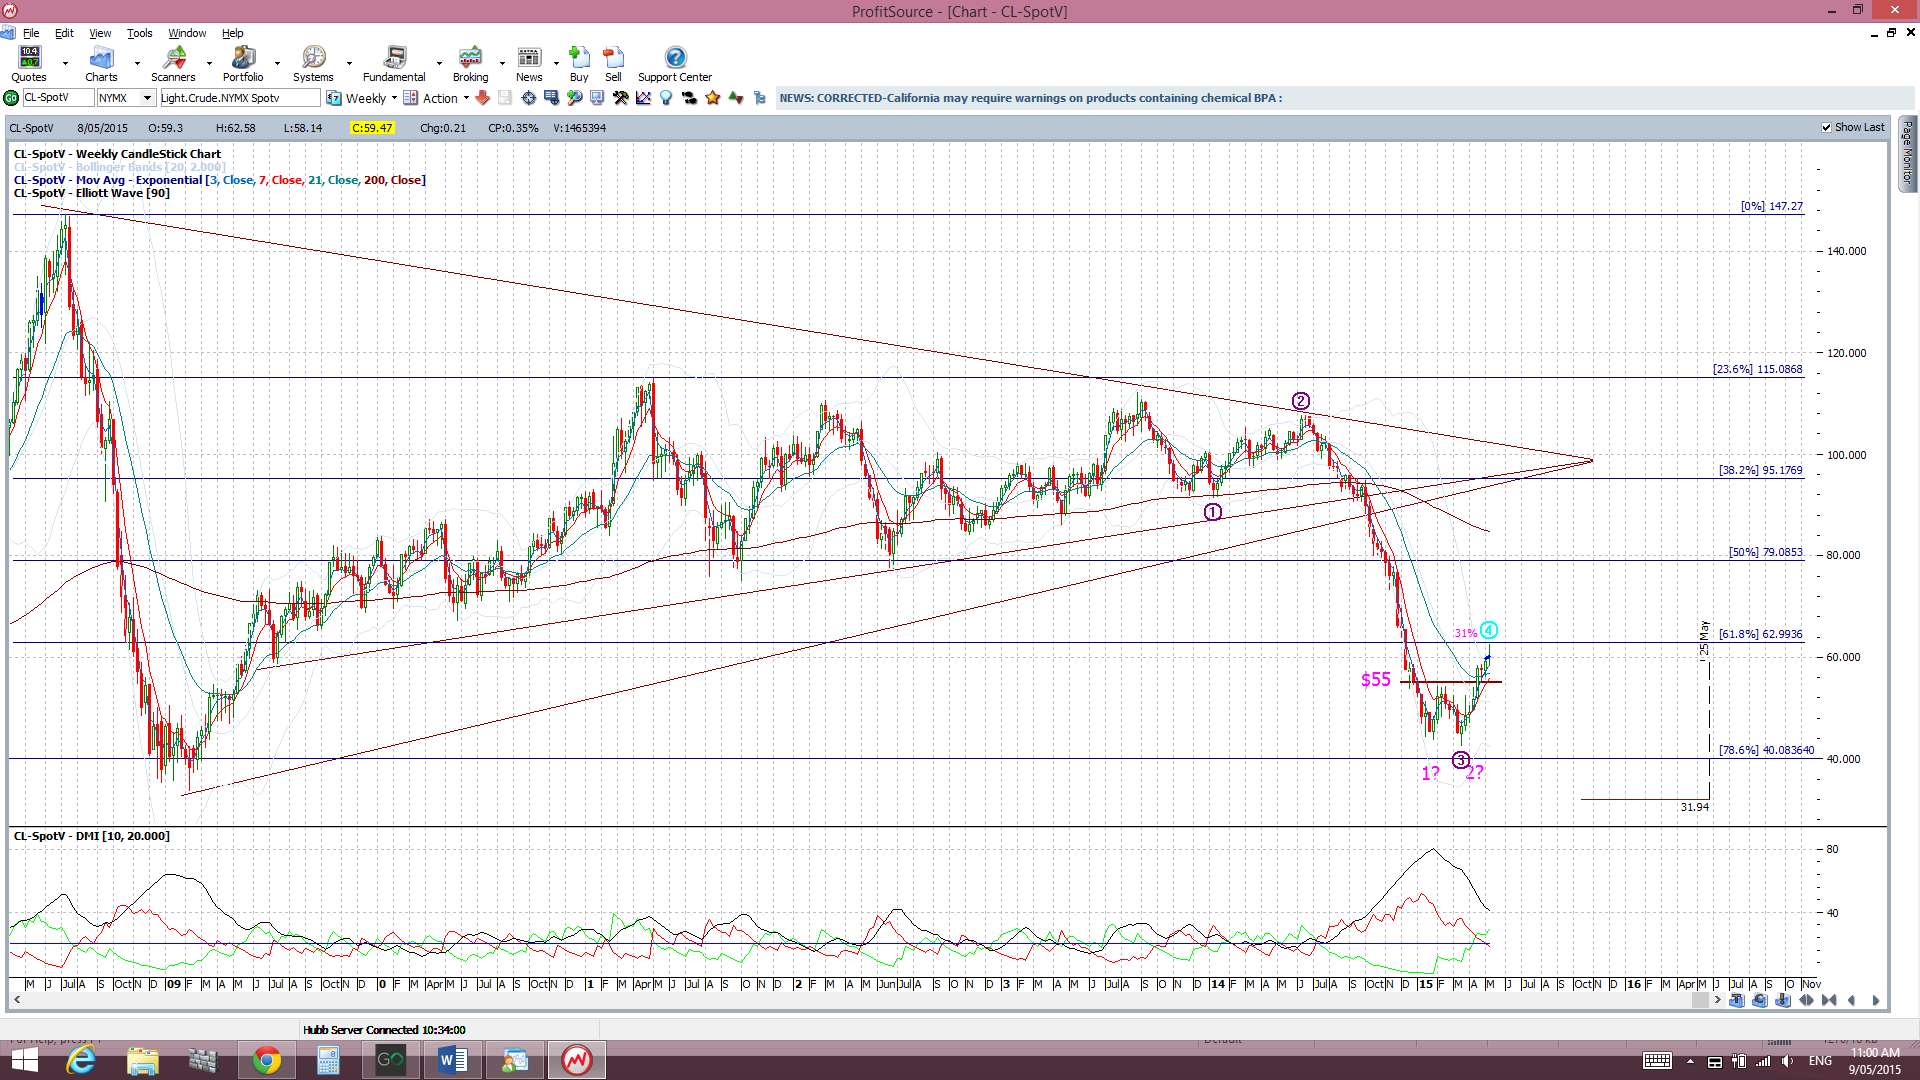
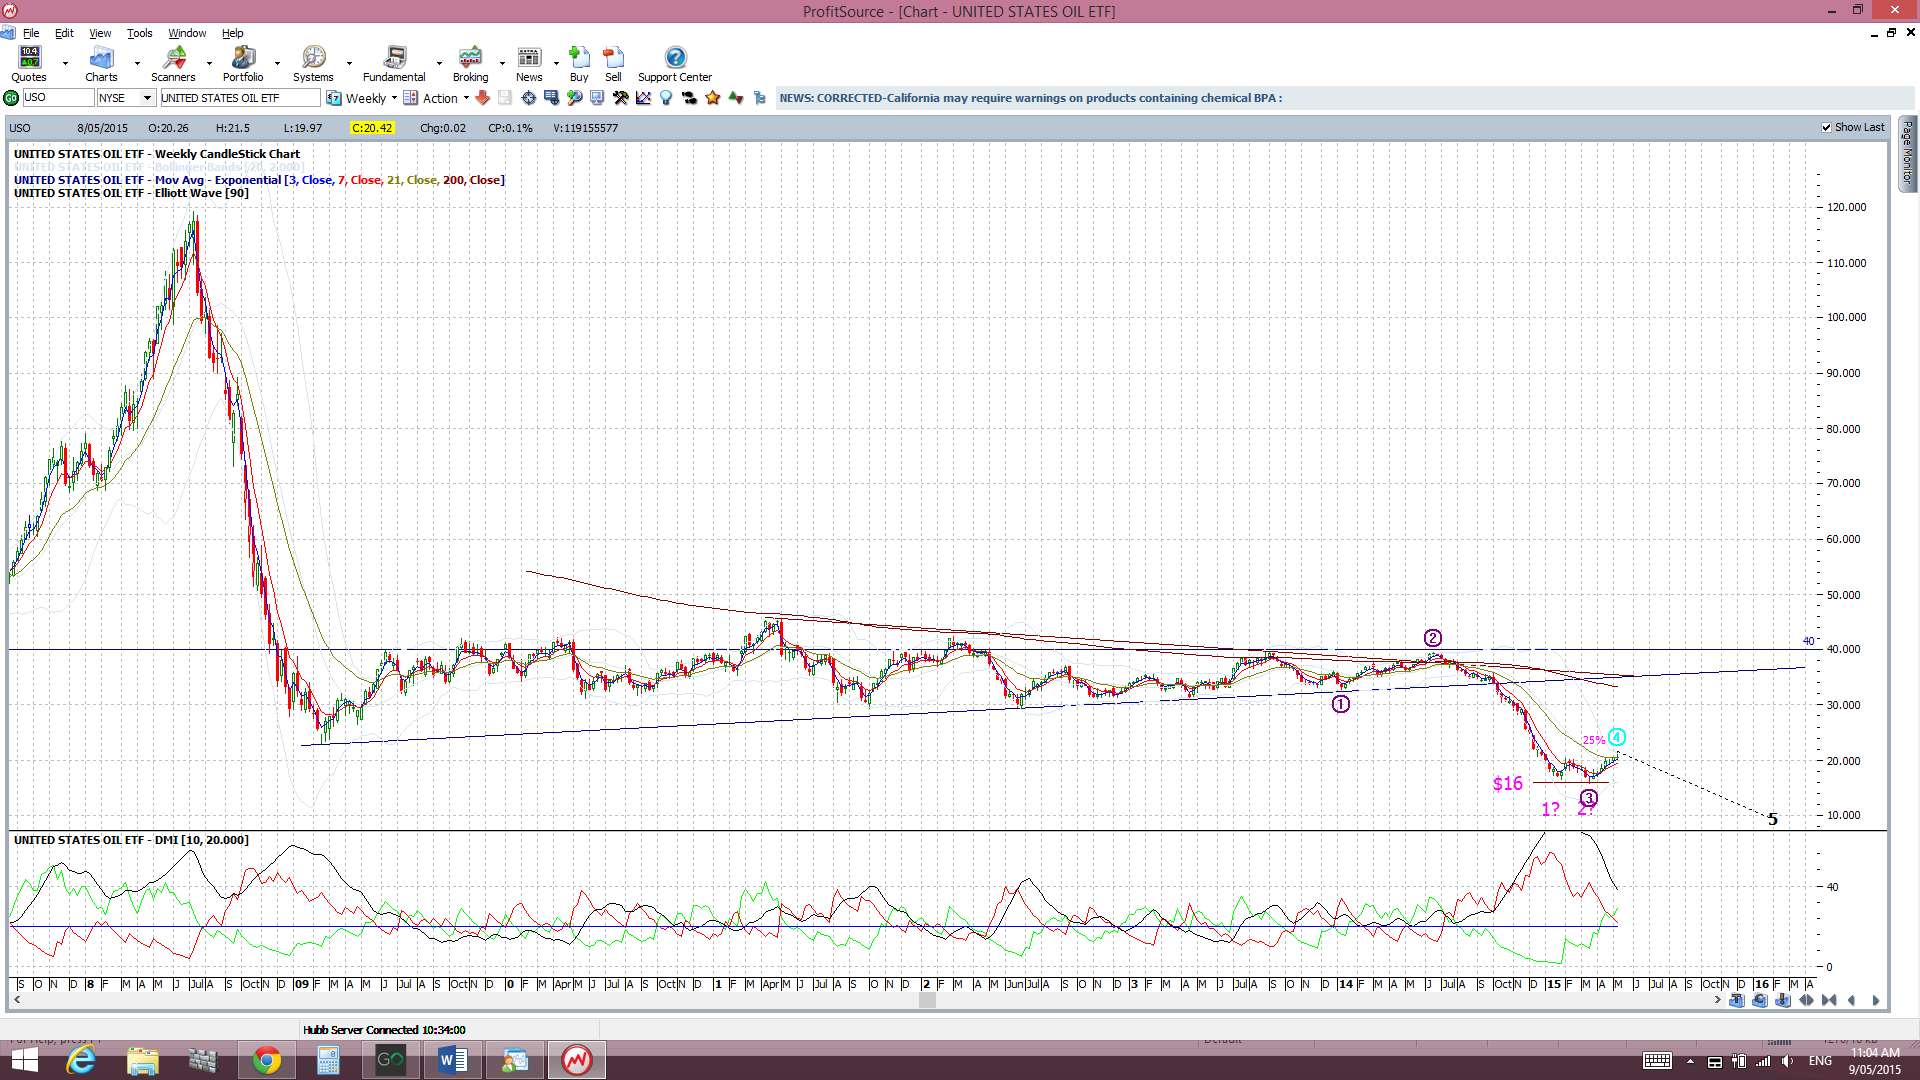
Oil: Oil had a slightly bullish week after a recent bullish breakout from a ‘Double Bottom’. I’m still on the lookout for a test of the $55 ‘neck line’ breakout level before possible continuation but it continues consolidating under the $60 level at the moment. USO is holding above the $20 ‘neck line’ level after a bullish ‘Double Bottom’ breakout.
Trading Calendar Items to watch out for:
- Mon 11th: AUD ANZ Business Confidence. EUR Eurogroup meetings. GBP Interest Rates and BoE statement.
- Tue 12th: GBP Manufacturing Production. AUD Annual Budget. ECOFIN meetings. US Federal Budget and FOMC Williams speaks.
- Wed 13th: NZD RBNZ Financial Stability Report and RBNZ Gov Wheeler speech. CNY Industrial Production. EUR German Prelim GDP. GBP Employment data, BoE Inflation Report and Gov Carney speech. USD Retail Sales.
- Thurs 14th: NZD Retail Sales. CHF/EUR Bank Holiday. USD PPI & Unemployment claims.
- Fri 15th: CAD Manufacturing Sales. USD Prelim UoM Consumer Sentiment.
Forex:
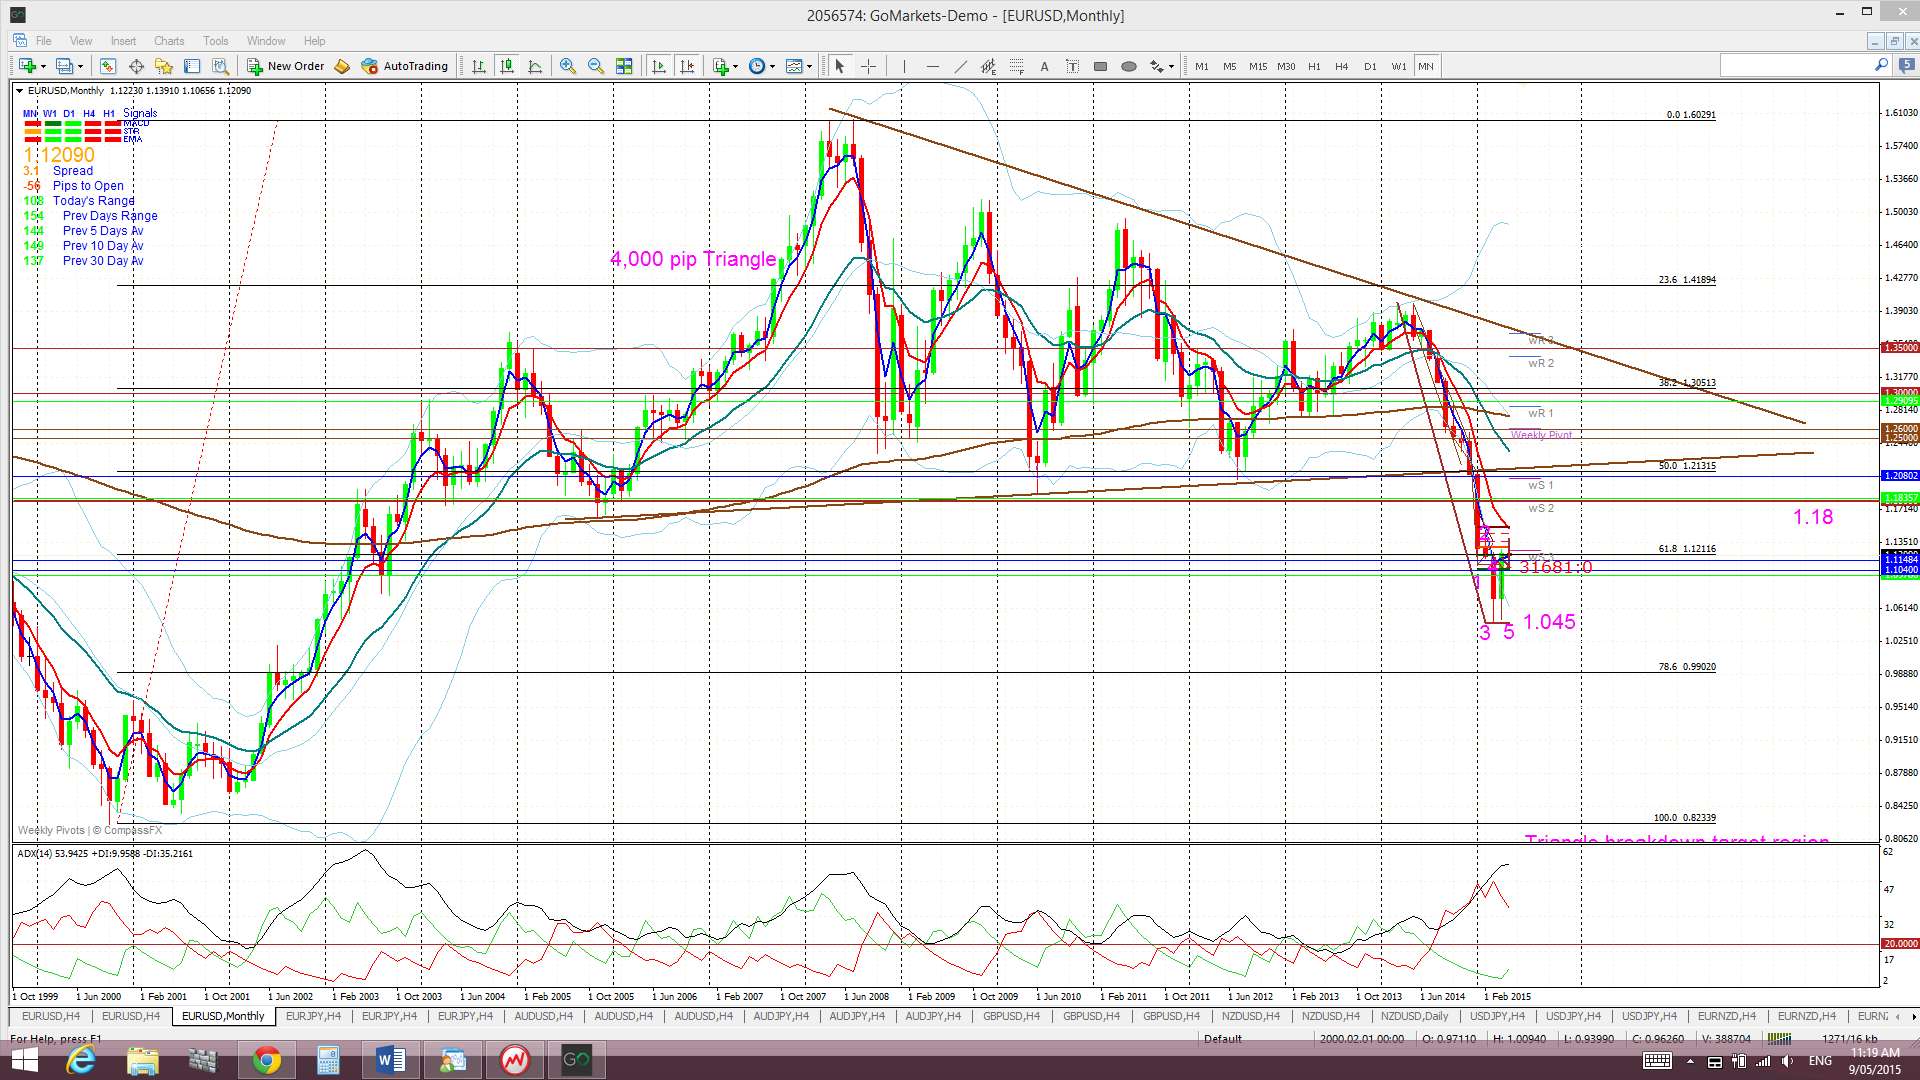
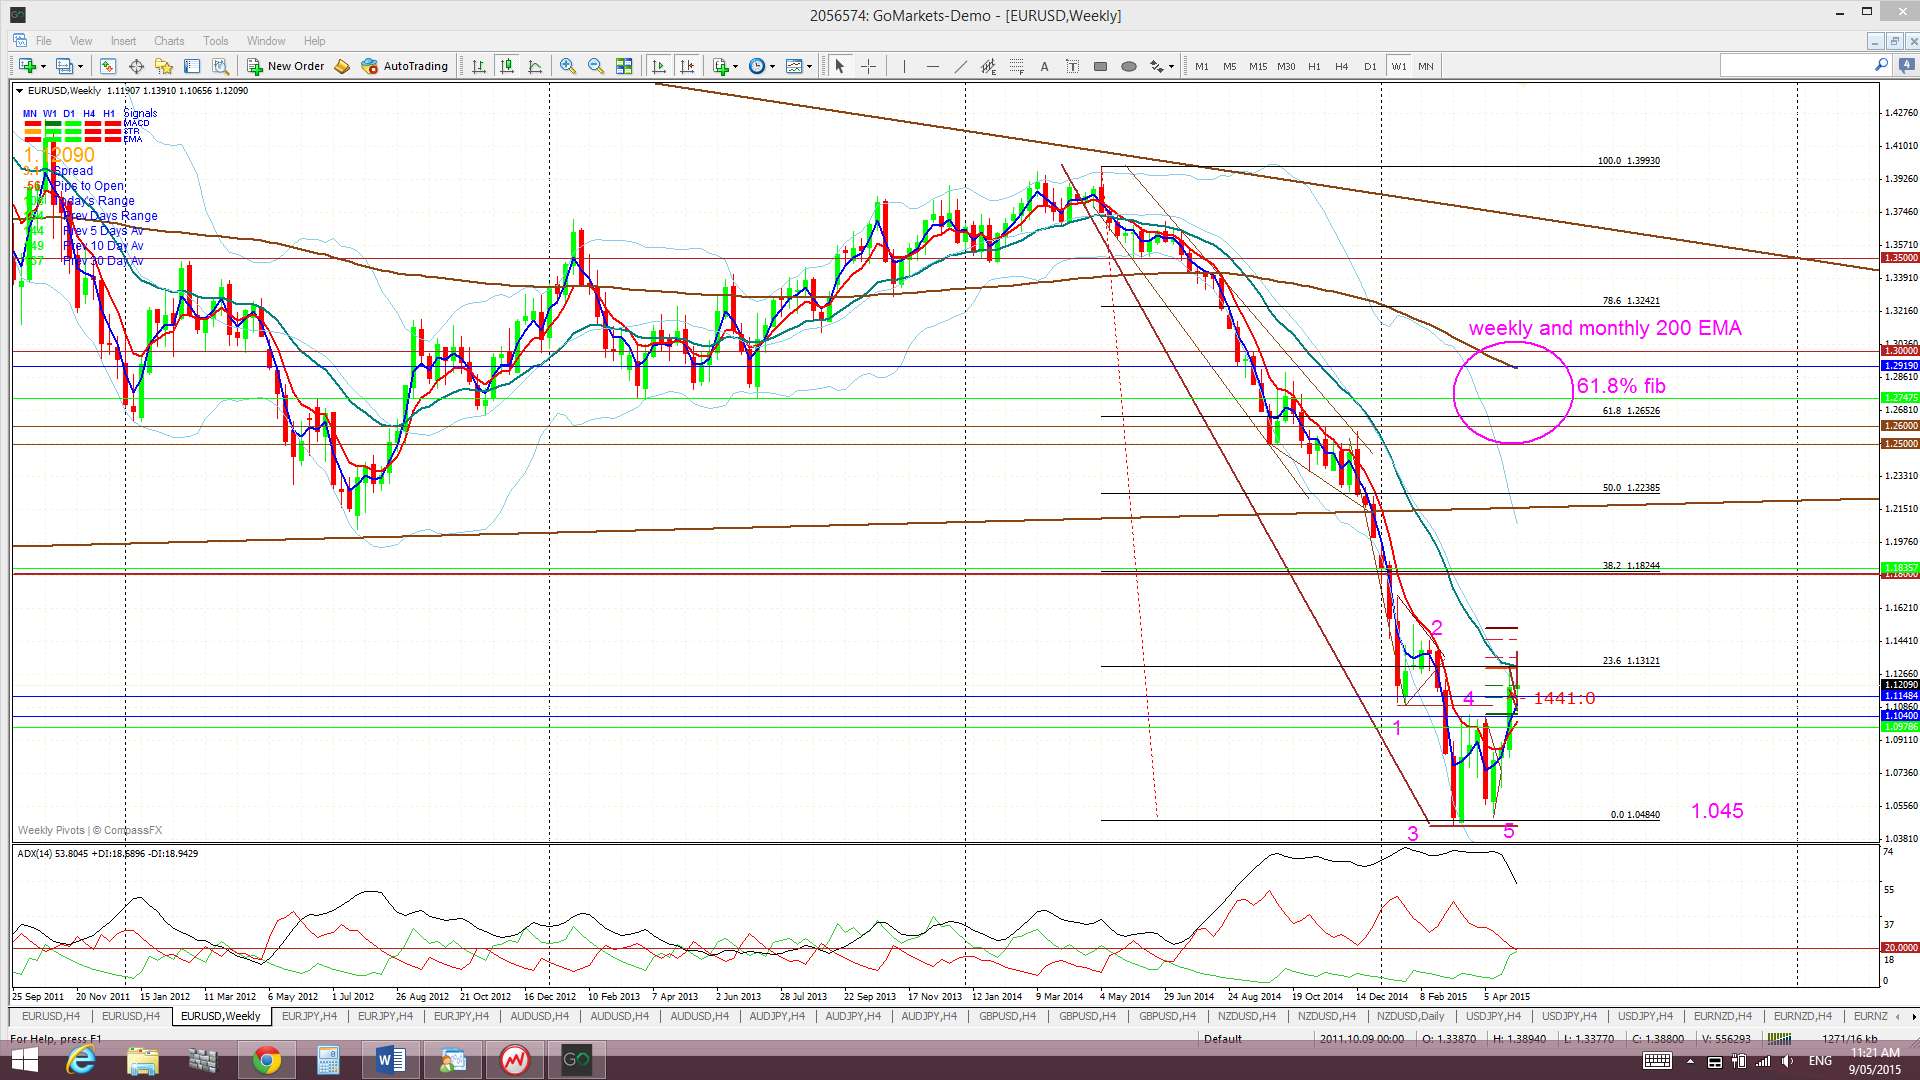
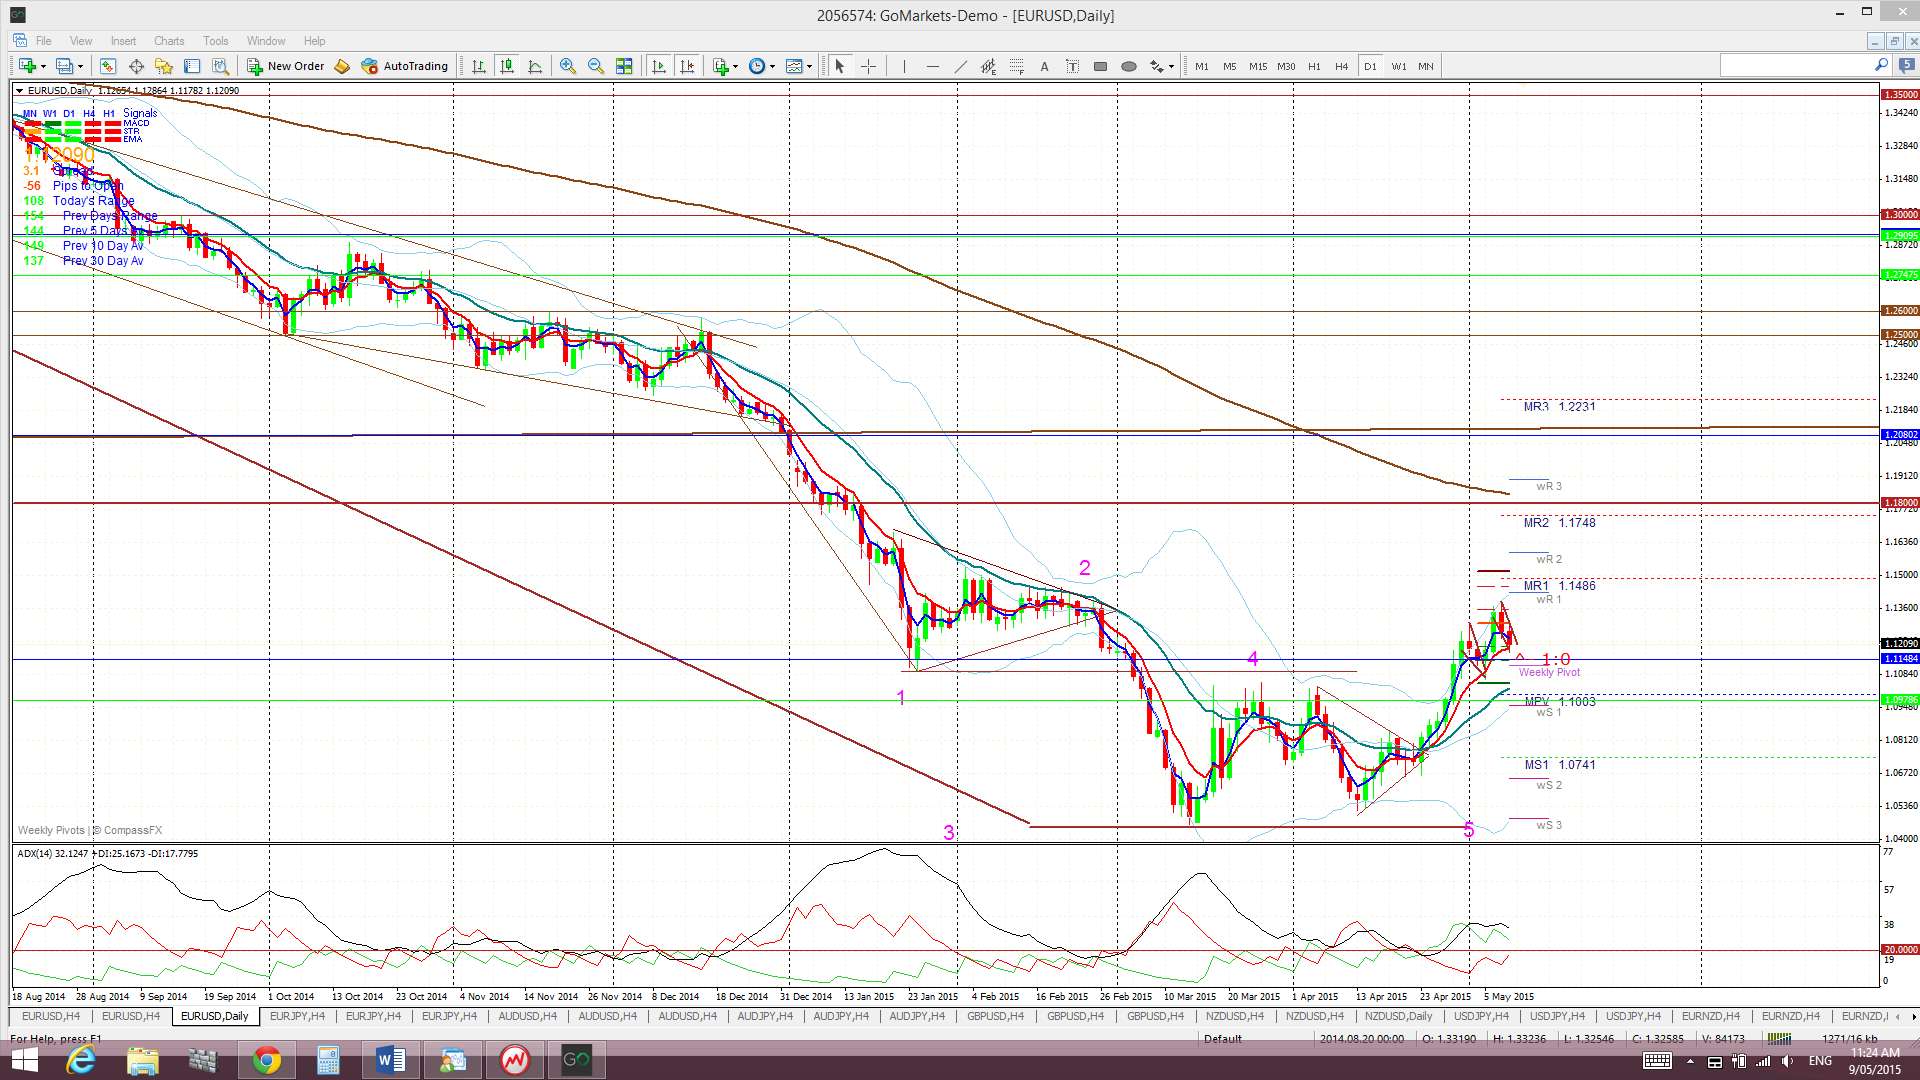
E/U: The E/U chopped around either side of the key 1.12 level and this is significant as it is the 61.8% fib of the 2000-2008 swing high move. In chopping around it formed two Flag patterns: the first played out as bullish but the second has yet to trigger a breakout and price closed for the week right on the 1.12 level!
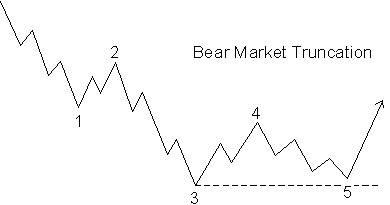
The E/U is still conforming to the Elliott Wave Bear Market Truncation pattern so keep watching for any continued move higher. A hold above 1.12 would suggest continuation and the 1.18 S/R level would be an obvious target. However, a failure to hold above 1.12 could help to form a weekly-chart Bear Flag pattern with a base near 1.045.
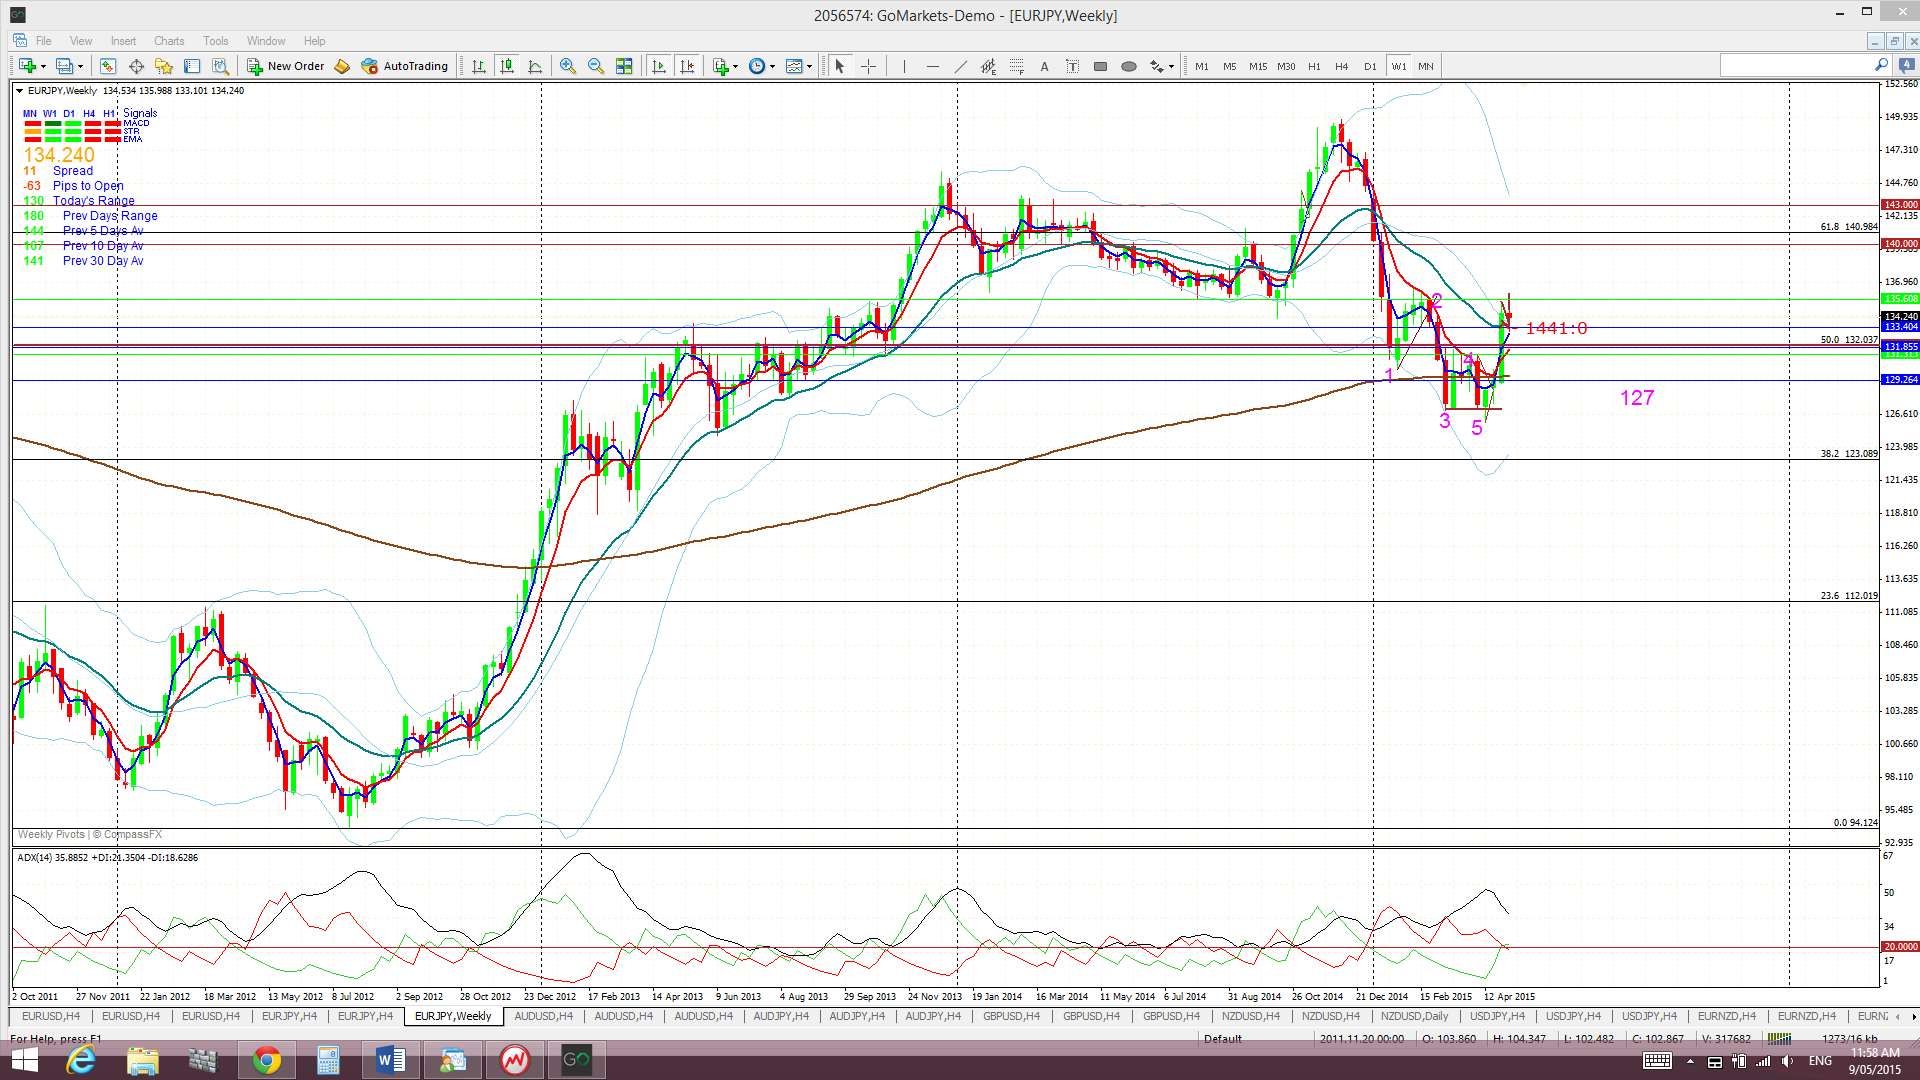
The weekly chart shows a congested region up between 1.25 and 1.30. There is the 61.8% Fib of this recent swing low move located there as well as the weekly and monthly 200 EMAs. This could be a target region if bullish sentiment continues.
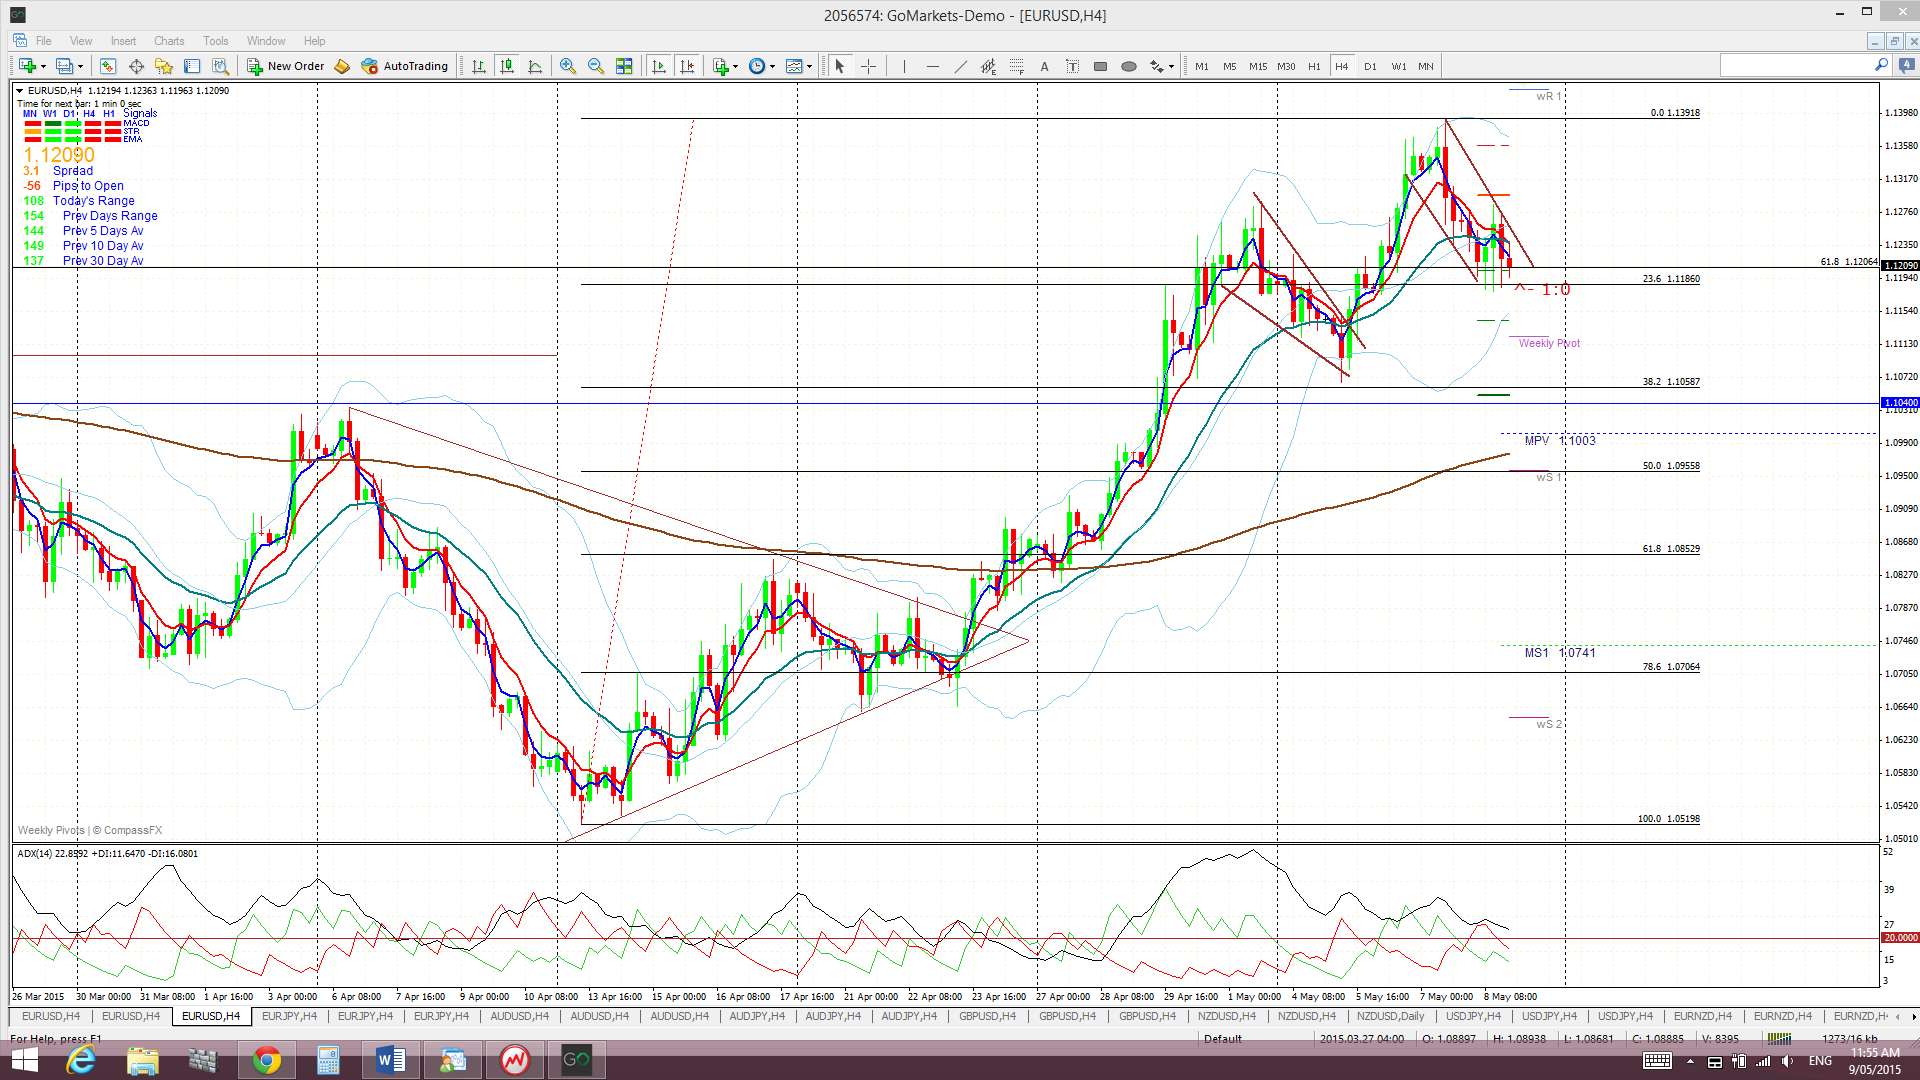
The 4hr chart shows a Bull Flag in the making BUT a pullback down to the 50% fib near the monthly pivot and 4hr 200 EMA would not surprise either.
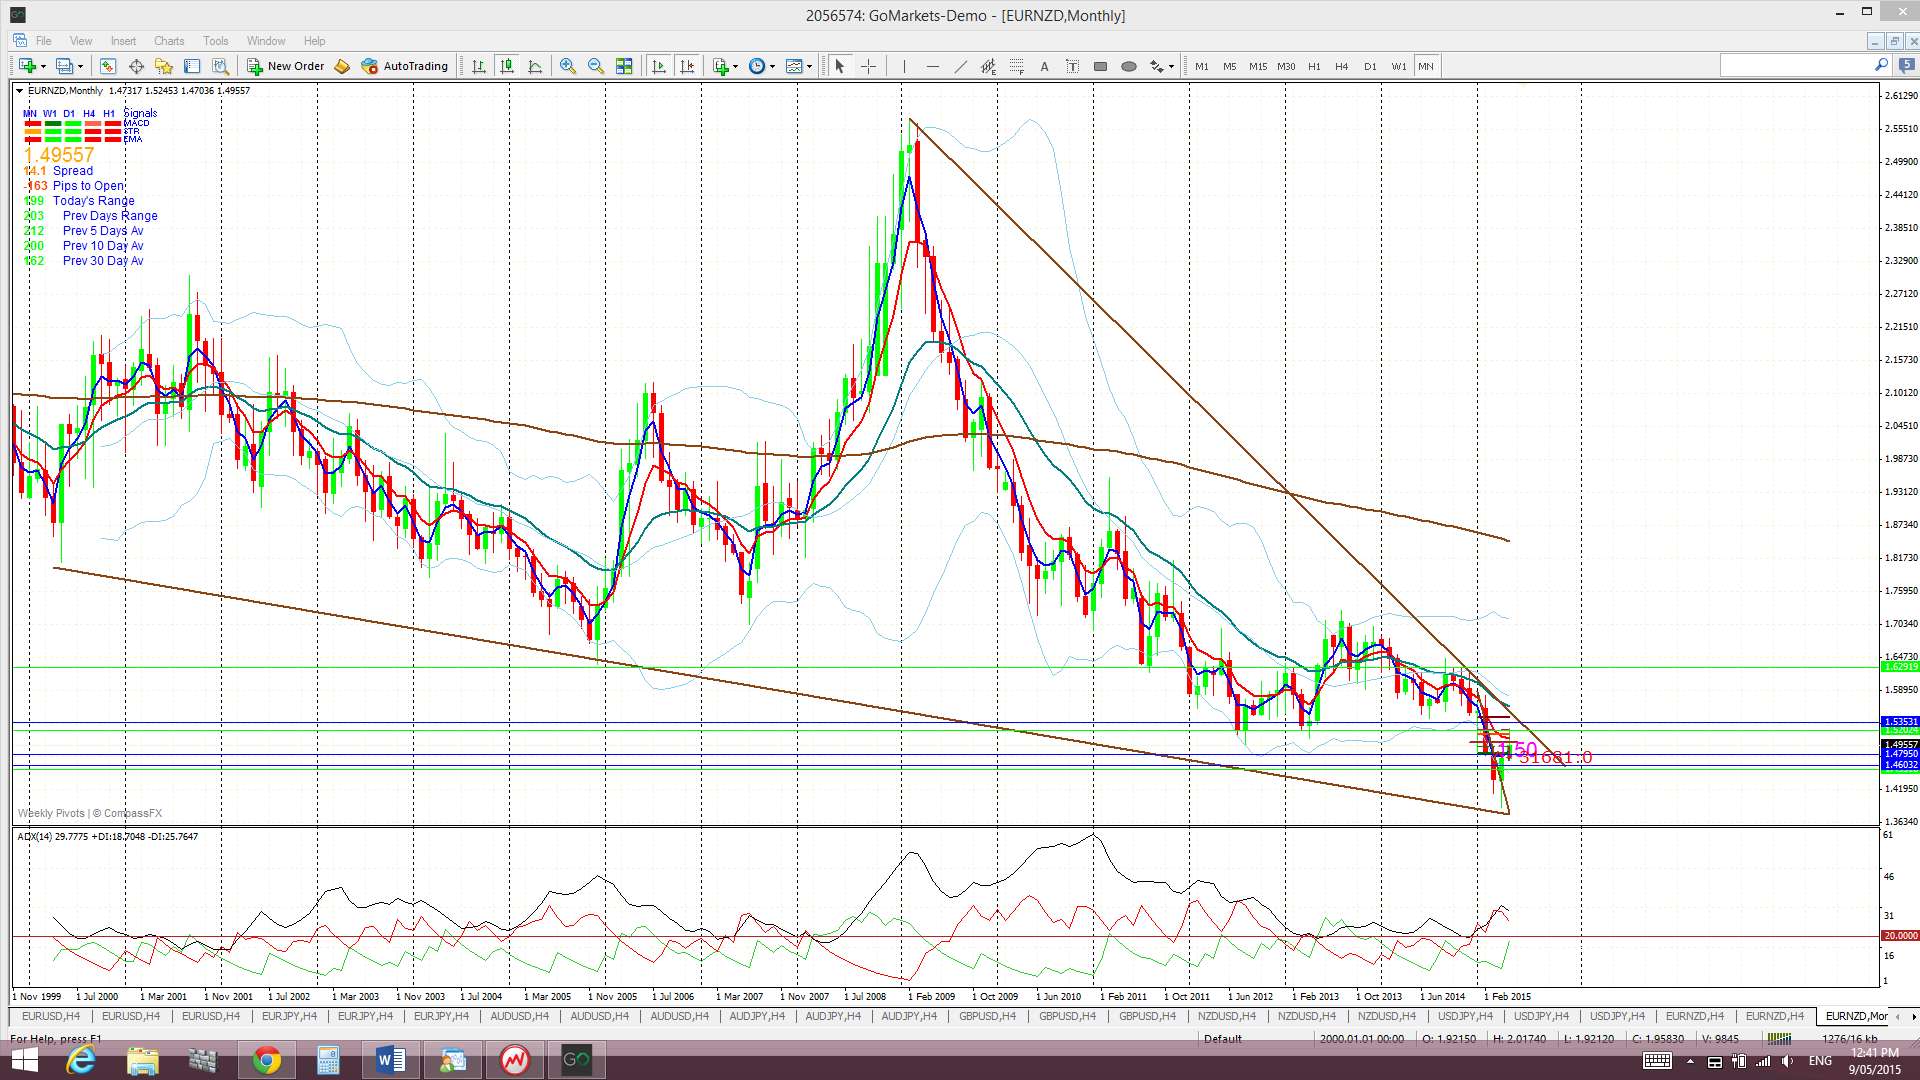
Descending triangle on the monthly chart: Despite this recent bullish activity there is still an overall bearish pattern in play on the E/U monthly chart: a 4,000 pip bearish descending triangle breakdown on the monthly chart. The descending triangle pattern is a bearish continuation pattern and has a base at around the 1.18 level. The height of this triangle is about 4,000 pips. Technical theory would suggest that any bearish breakdown of this triangle below 1.18 might see a similar move. It is worth noting that this would bring the E/U down near 0.80 and to levels not seen since 2000/2001! The monthly chart shows how critical this 1.18 level is for the E/U.
Price is still trading above the Ichimoku Cloud on the 4hr and daily charts but below the Cloud on the weekly and monthly charts.
There are Euro-group (Monday) and ECOFIN (Tuesday) meetings to impact the E/U at the start of next week and, no doubt, the Greek-debt situation will be a focal point of these talks. However, the fate of this pair might rest as much with the fortunes of the US$ and, thus, US data remains significant here as well: any bearish breakdown for the US$ would keep supporting the E/U but, obviously, any US$ recovery would be bearish here.
The weekly candle closed as a bullish coloured Doji candle reflecting some indecision here.
- I’m watching for any new TC signal on this pair, the 4hr Flag trend lines and the 1.12 level.
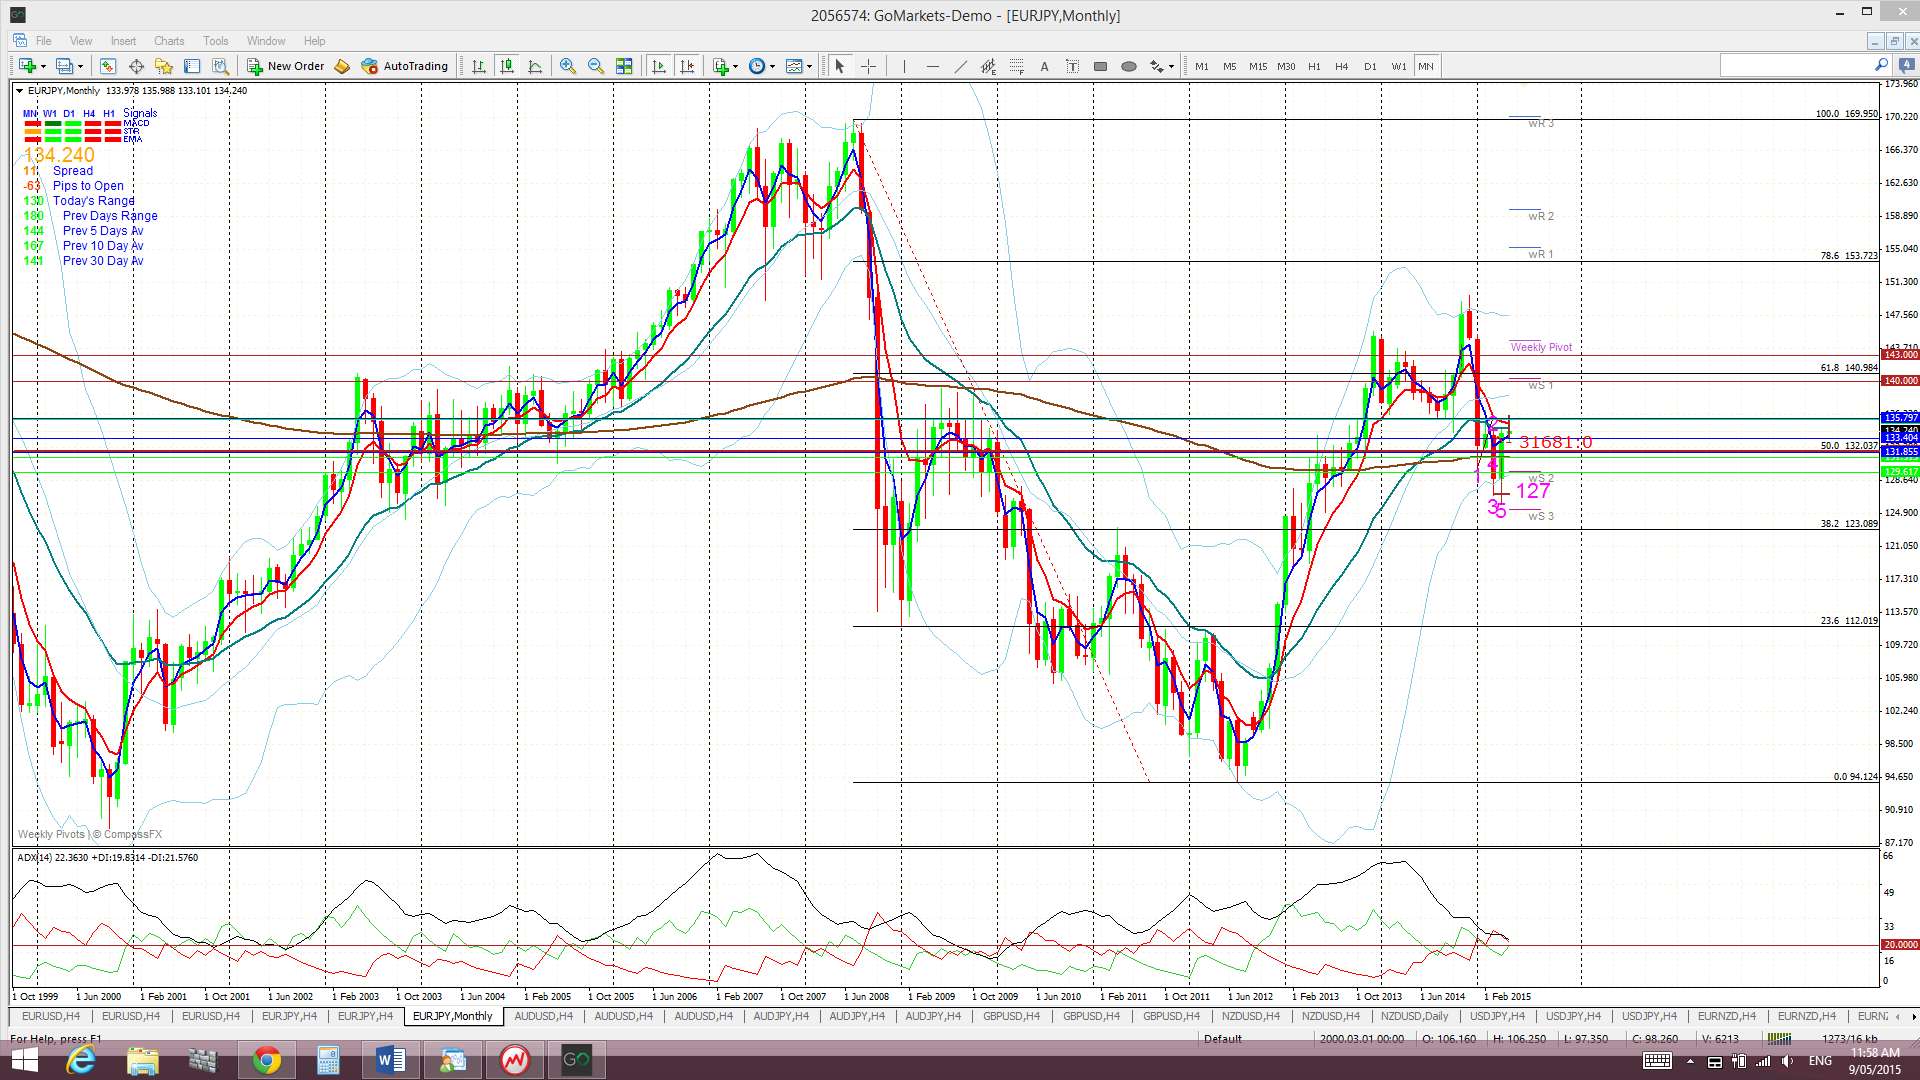
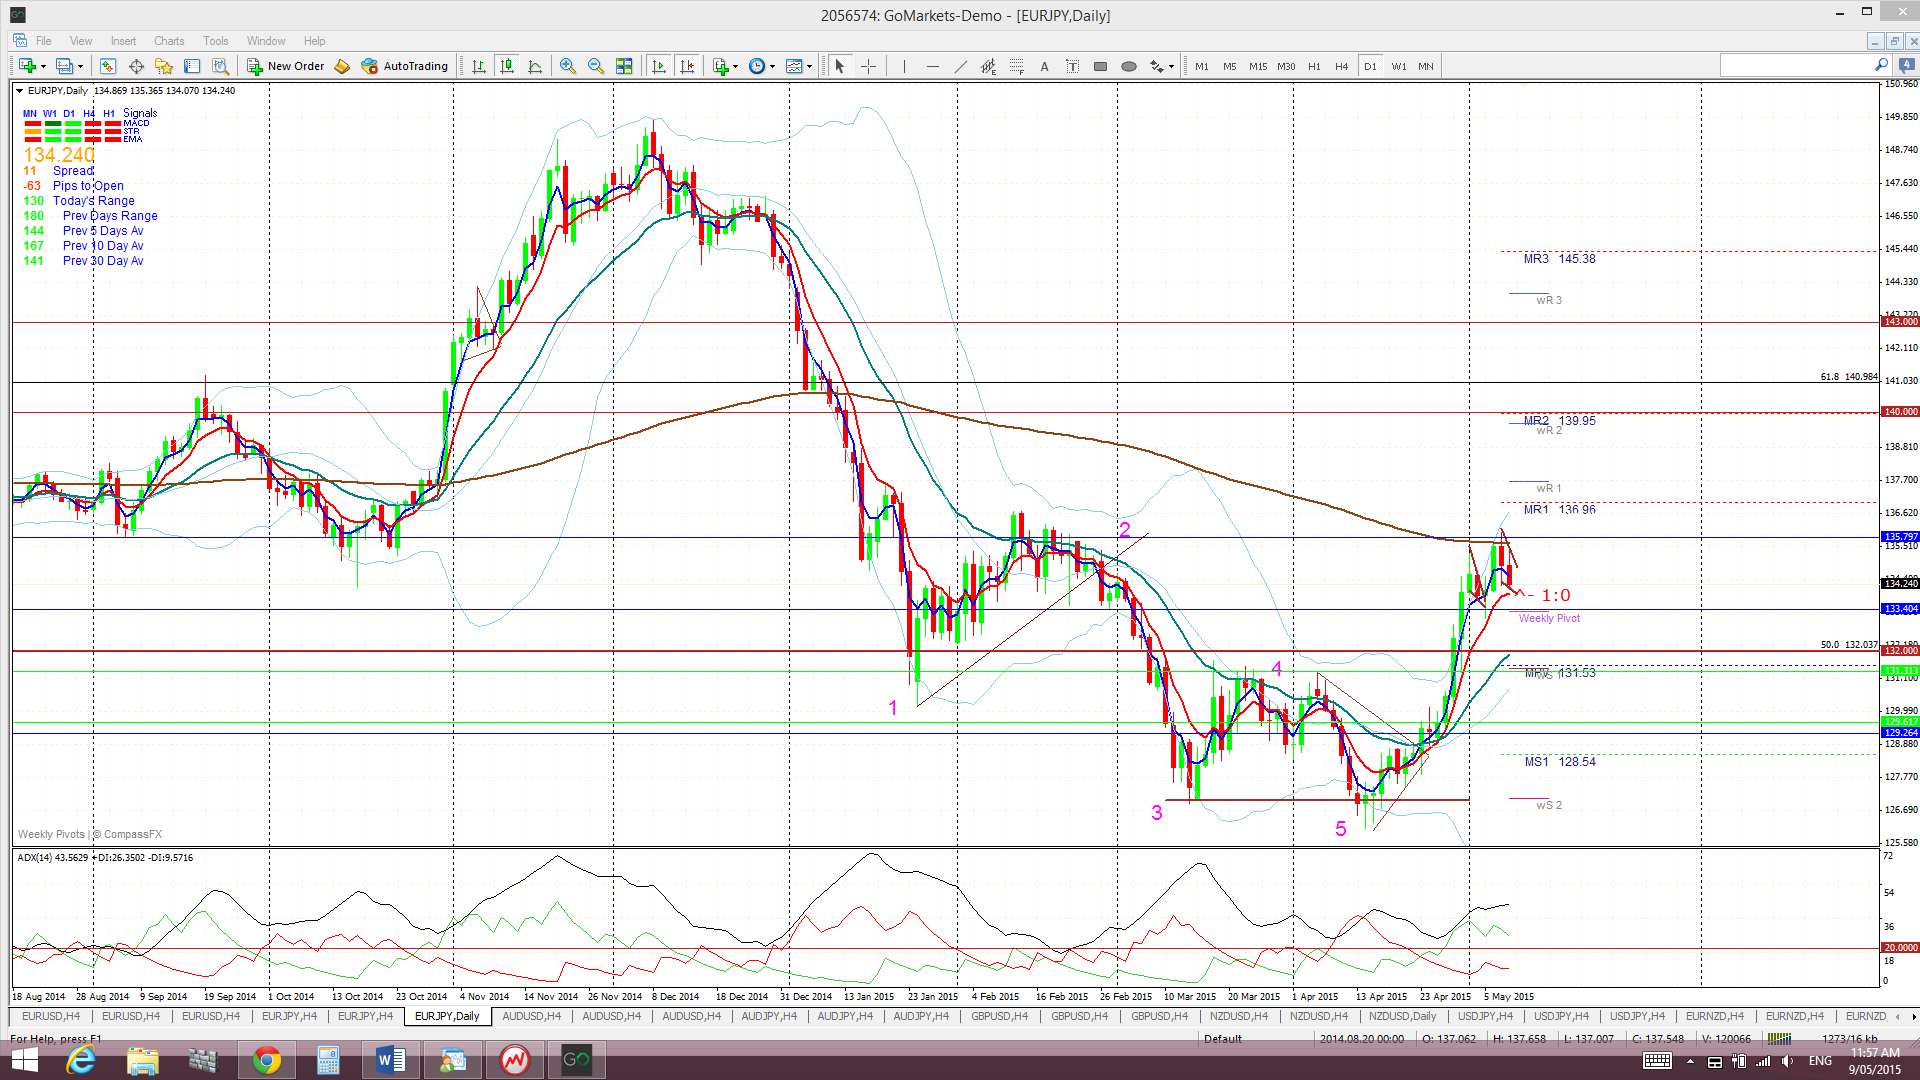
E/J: Like the E/U, the E/J also chopped around forming two Flag patterns but here they formed under the daily 200 EMA. The first Flag resulted in a bullish breakout and the second has also yet to breakout.
The E/J is also still conforming to the Elliott Wave Bear Market Truncation pattern so keep watching for any continued bounce.
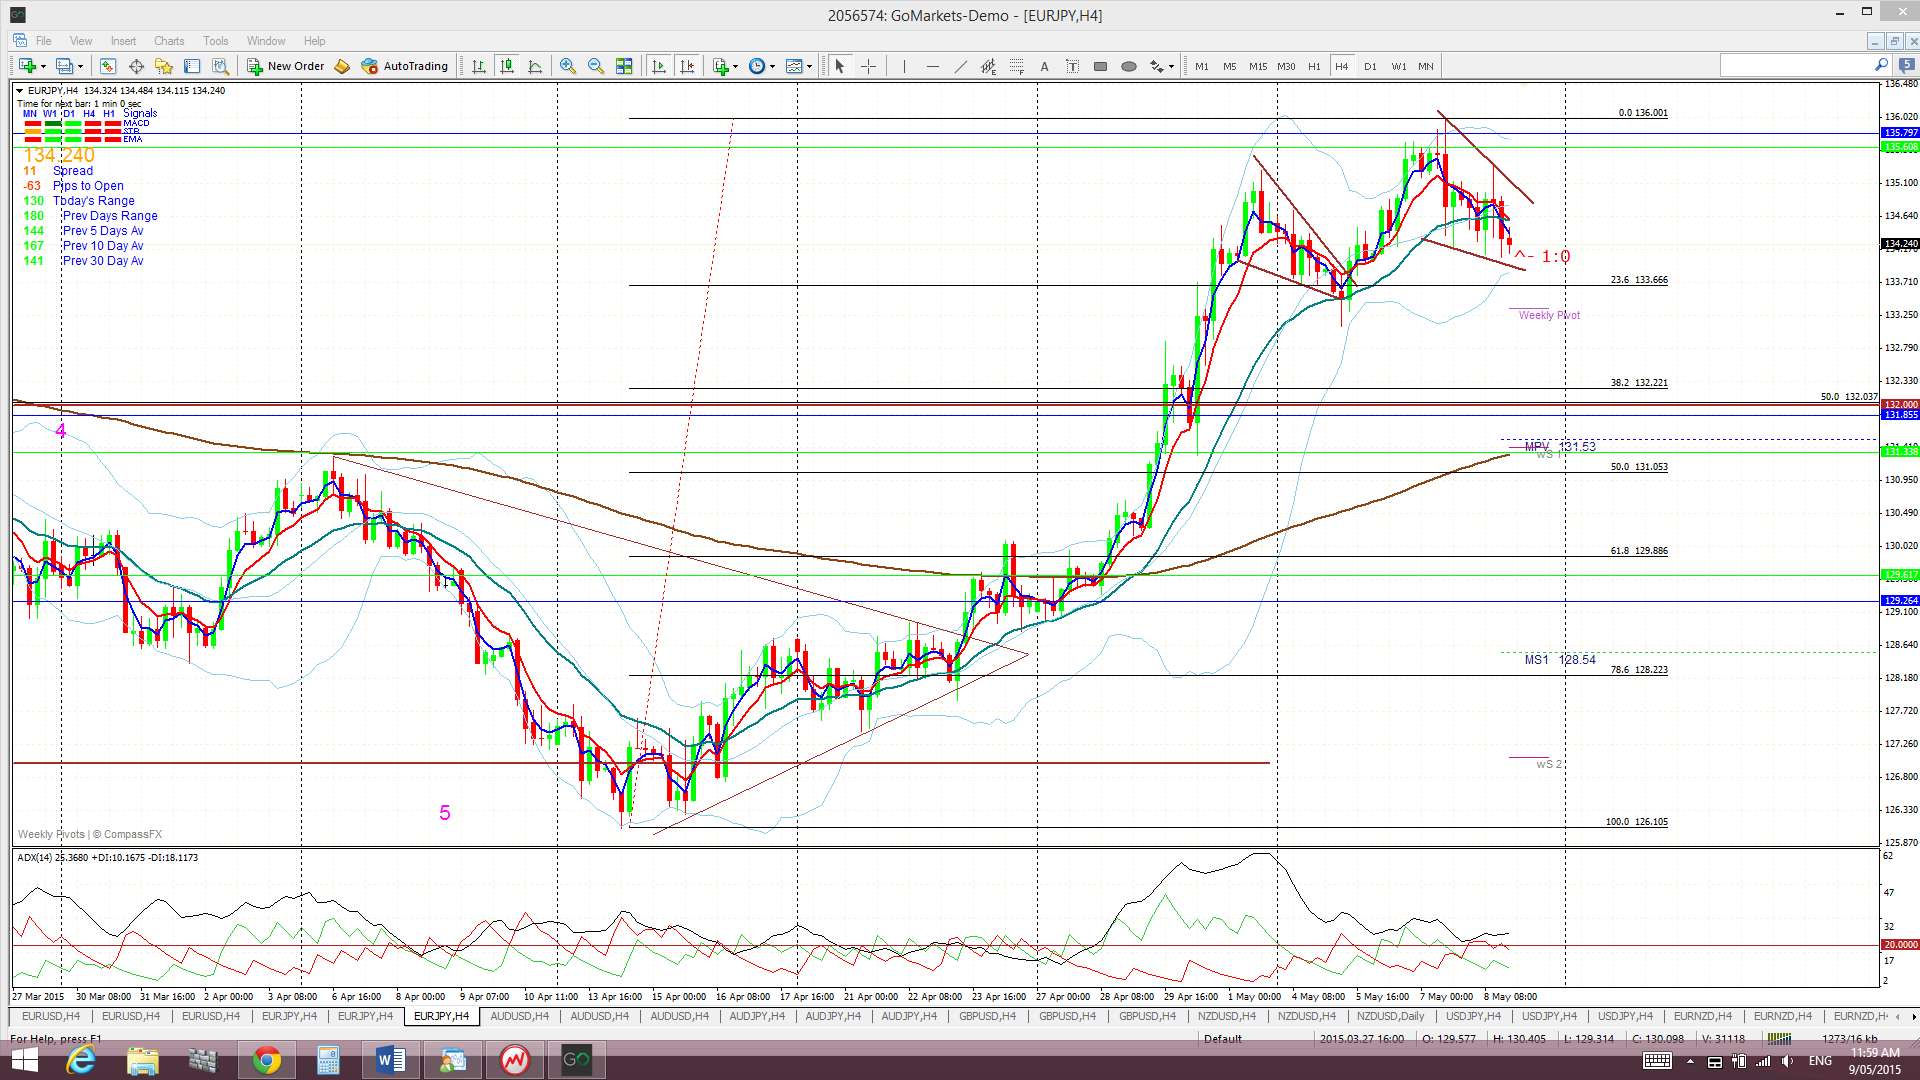
Also similar to the E/U, the 4hr chart shows a Bull Flag in the making BUT a pullback down to the 50% fib near the monthly pivot and 4hr 200 EMA would not surprise here either.
Price is still trading above the Cloud on the 4hr, daily and monthly charts but below the Cloud on the weekly chart.
The weekly candle closed as a bearish coloured ‘Spinning Top’ candle reflecting some indecision.
Events that impact the E/J will be much the same as for the E/U.
- I’m watching for any new TC signal on this pair, the 4hr Flag pattern and the daily 200 EMA.
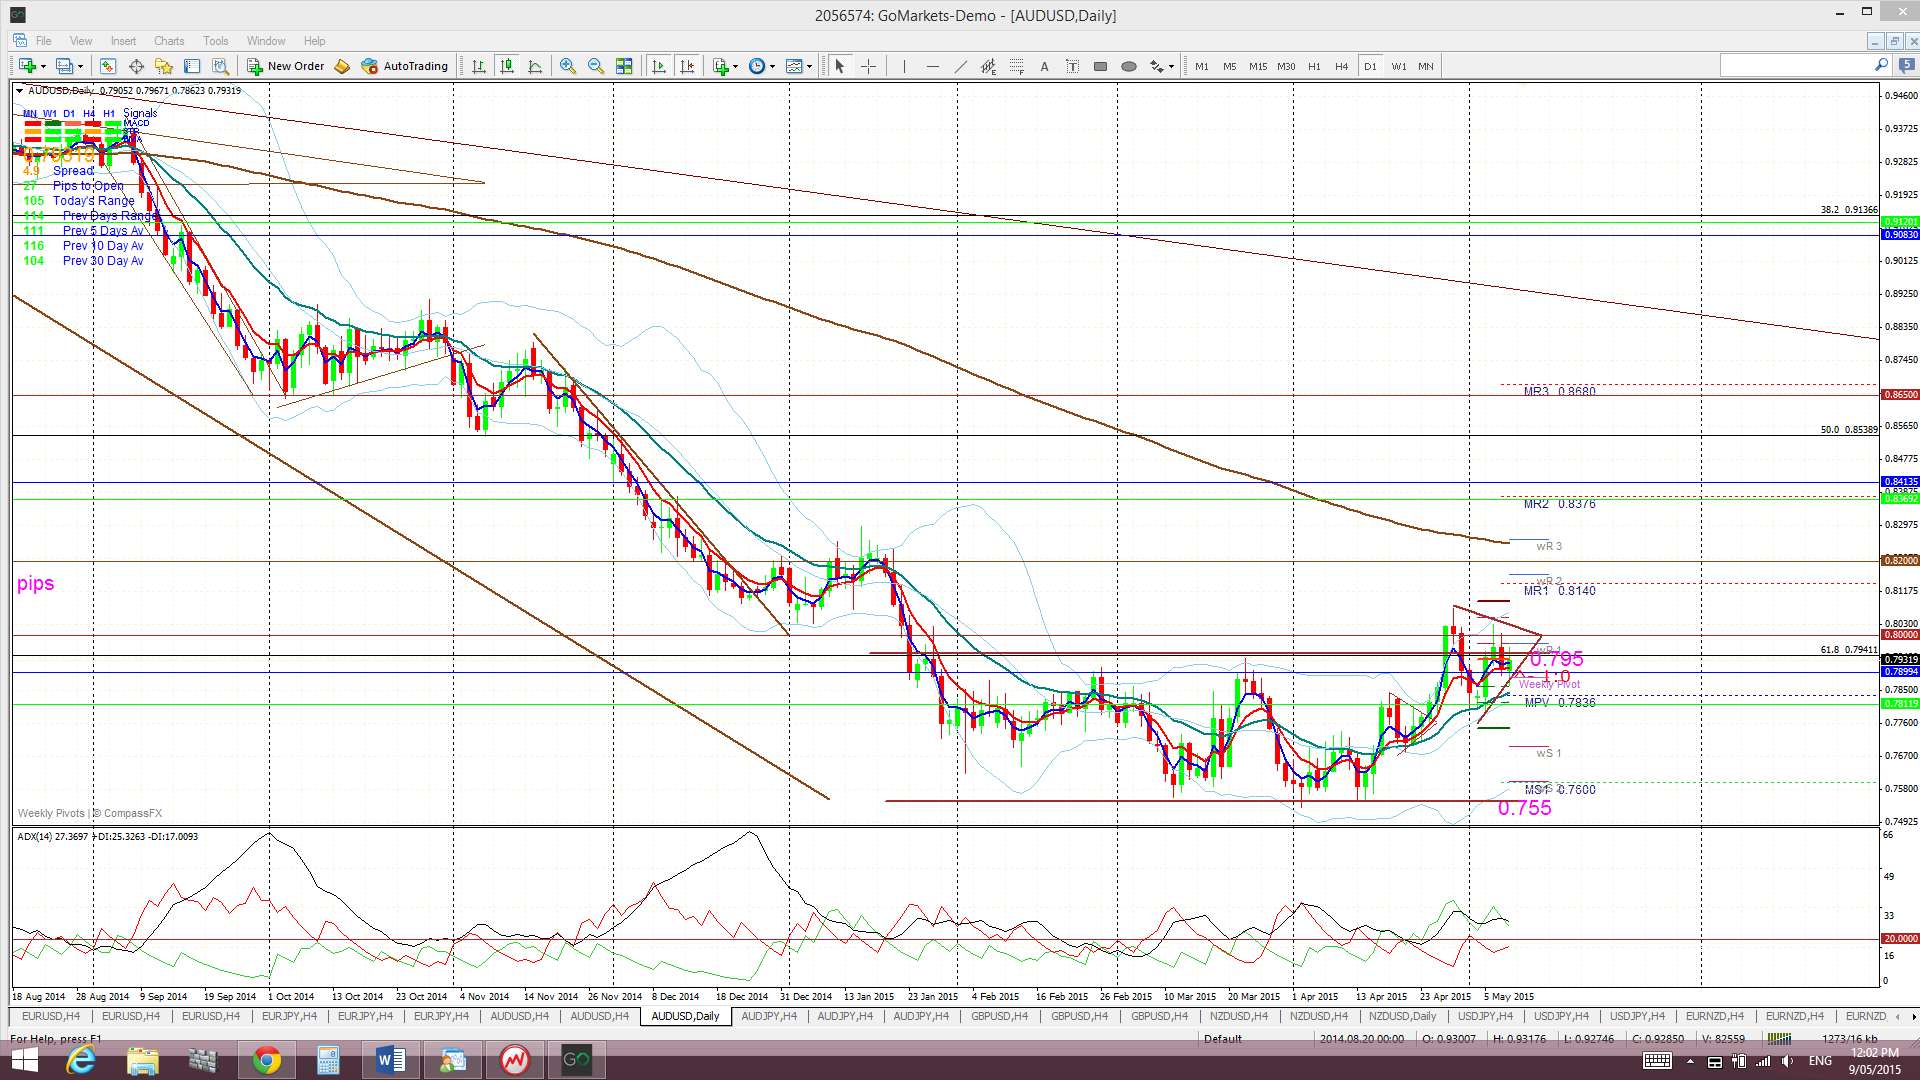
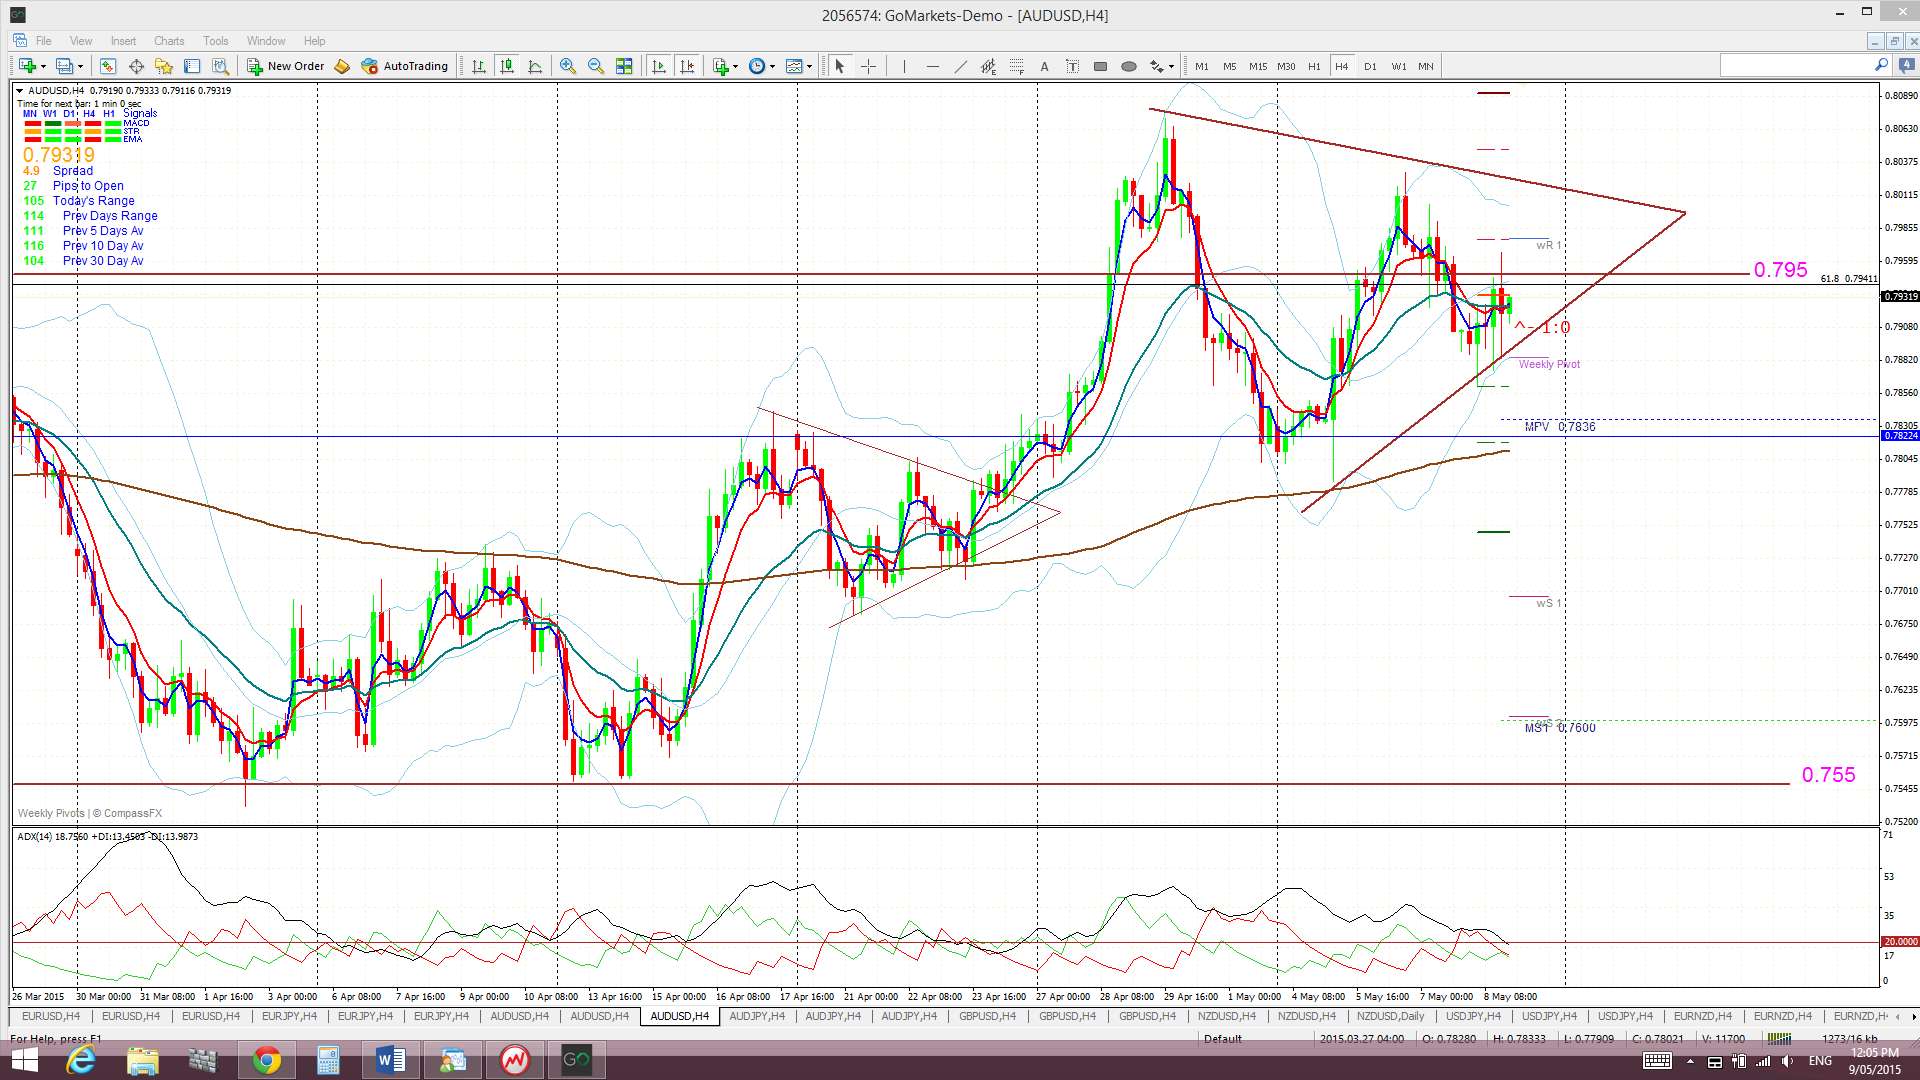
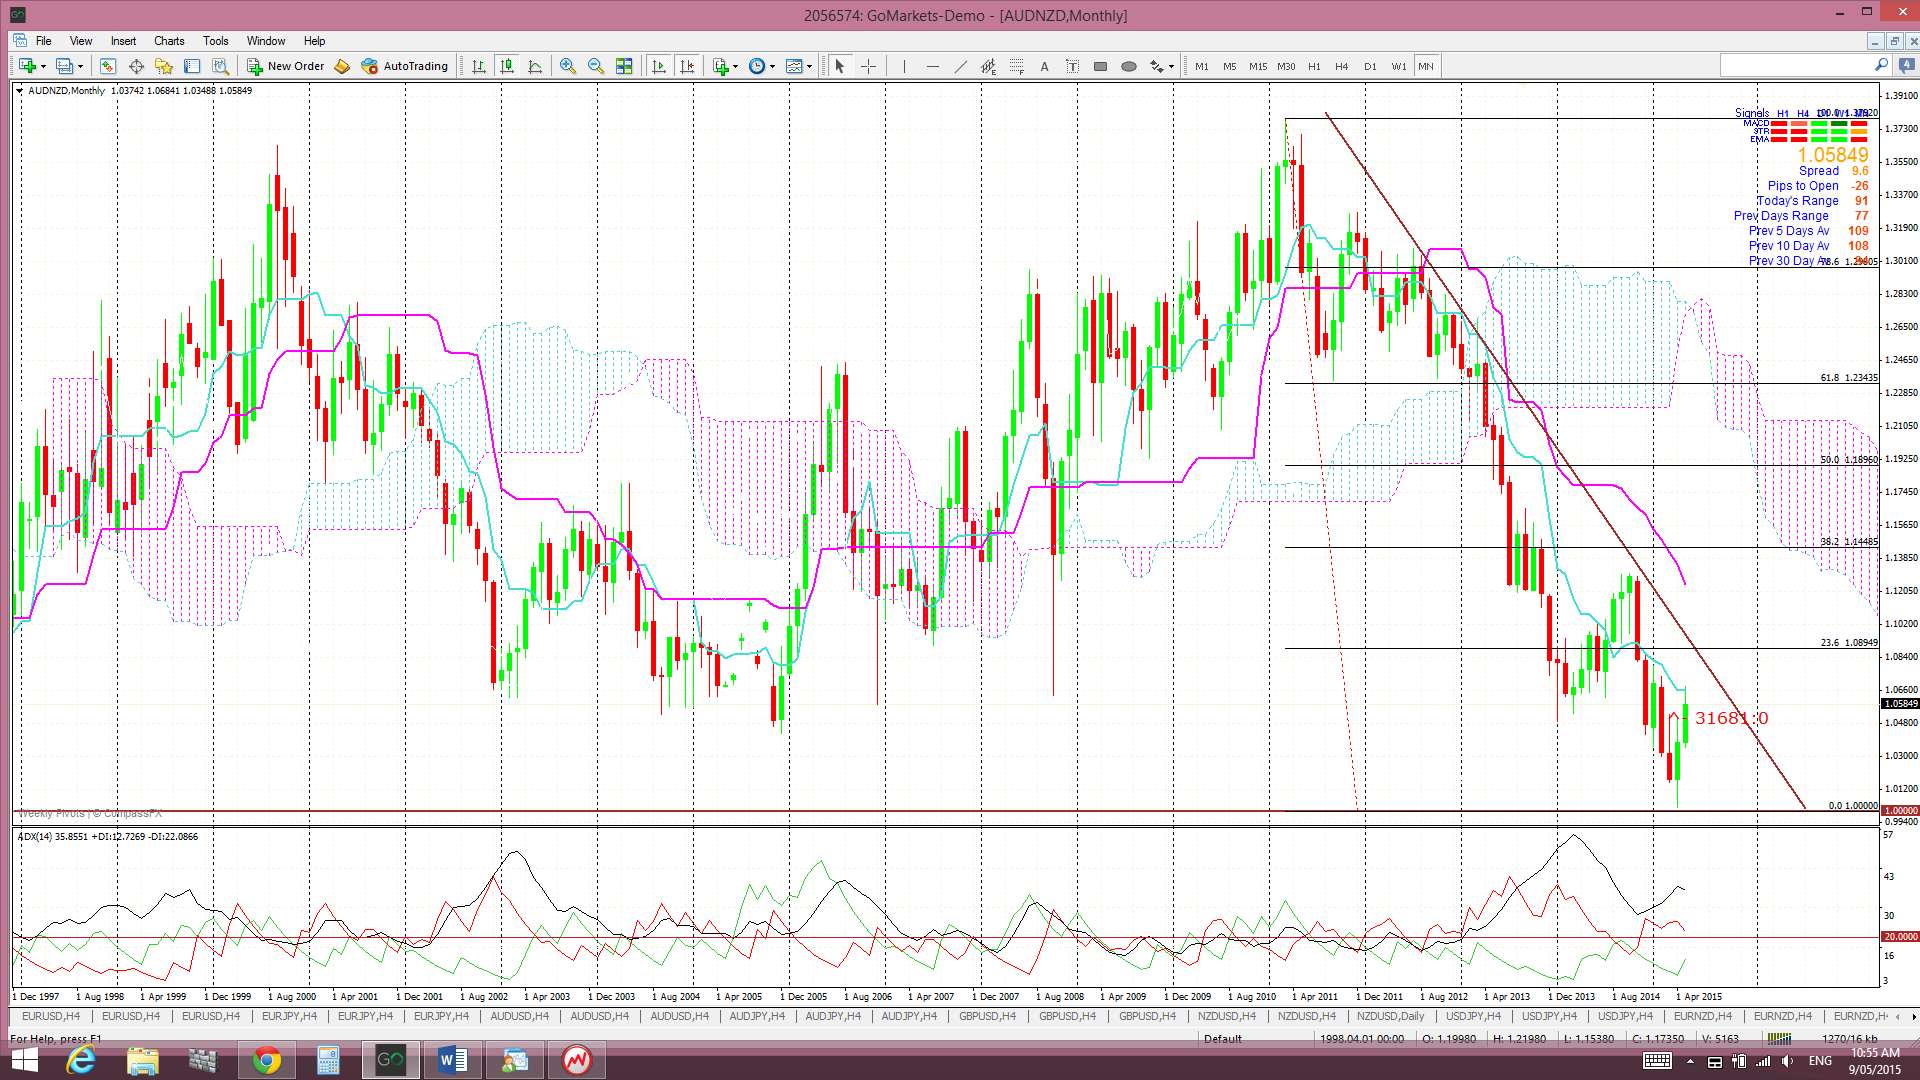
A/U: The A/U chopped around either side of the 0.795 level last week and, despite trading within a smaller triangle pattern, remains channel bound between 0.755 and 0.795. However, it is trading right up at the upper edge of this channel but the apex of this triangle is closer to the 0.80 level.
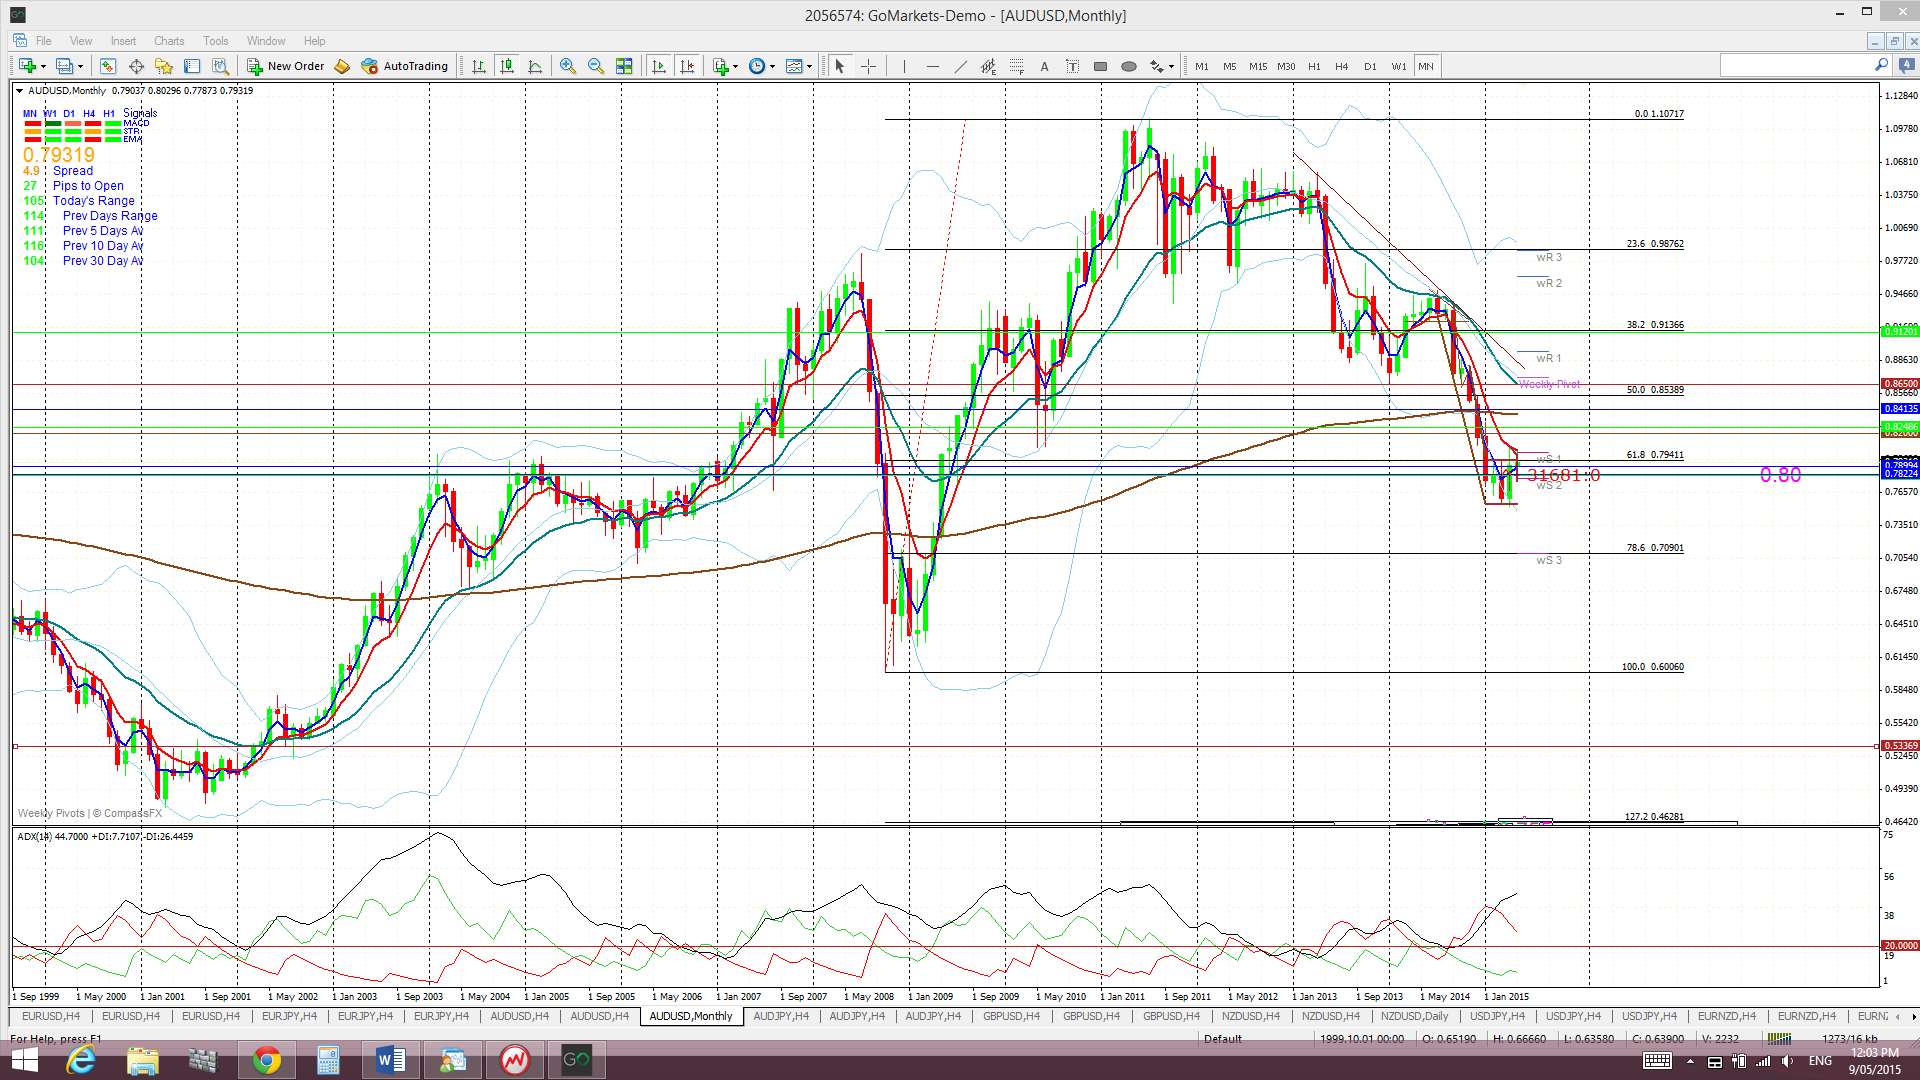
The 0.795 level is an important level apart from being the top of the recent trading channel. It is the region of the 61.8% fib retracement of the major 2008-2011 swing high move AS WELL as the 50% fib retracement level of the 2001-2011 swing high move as the following monthly chart shows:
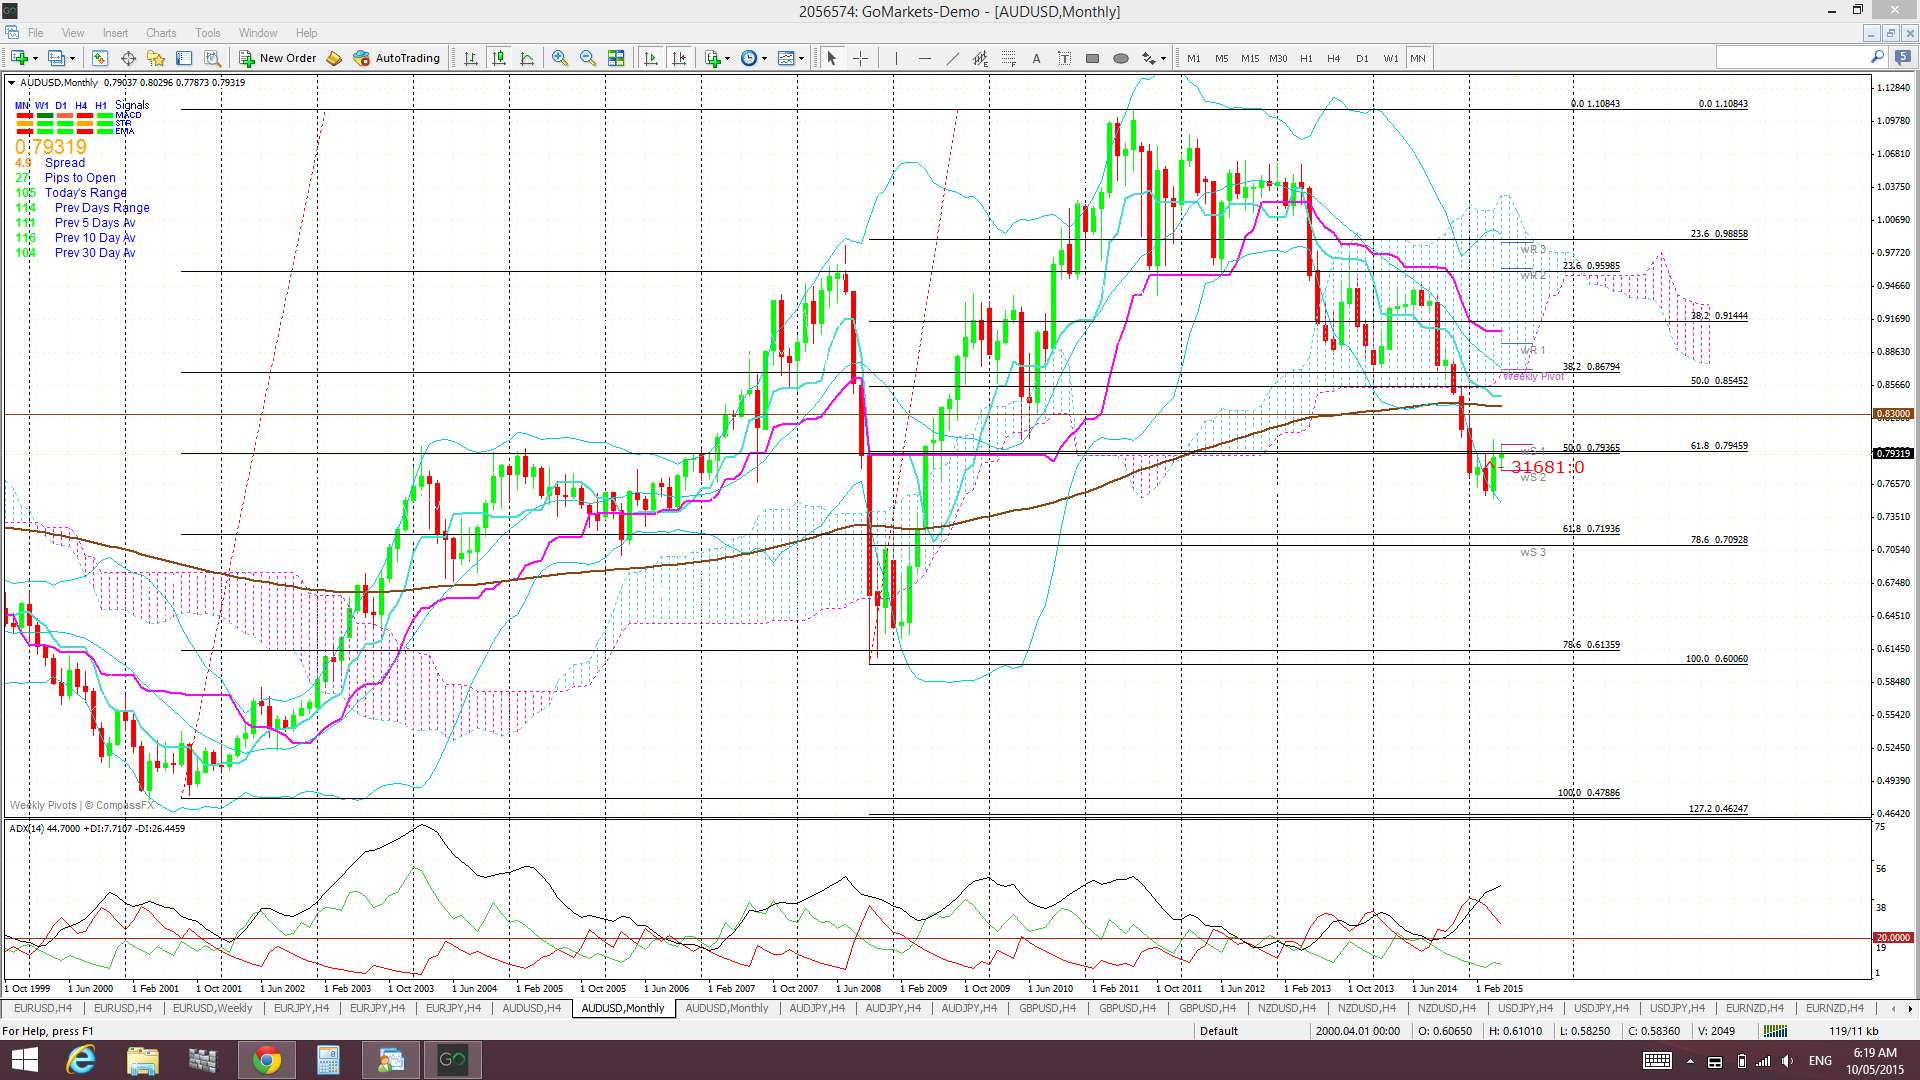
Thus, this 0.795 level is a MAJOR demarcation level for this pair which probably explains why it has formed up as the top of the trading channel! I suspect that the A/U Bull vs Bear battle will be decided at this level: a close and hold back above this 61.8% fib would be longer-term bullish but a sustained hold below would be longer-term bearish.
So whilst the weekly chart continues to show a potential Bear Flag forming the Aussie is starting to look bullish and I am thinking that this might be more of a basing pattern in the making. Should the US$ continue to weaken AND commodities start to level out or rise then the AUD looks headed higher to me.
Price is trading above the Cloud on the 4hr and daily charts but below the Cloud on the weekly and monthly charts. The hold above the daily Cloud is adding to the bullish sentiment here though for now:

The weekly candle closed as a bullish candle and this follows on from the April bullish engulfing monthly candle.
There is a lot of data to impact the A/U next week including AUD Business Confidence, the Annual Budget, Chinese Industrial Production data as well as all of the US$-sensitive data.
- I’m watching for any new TC signal on this pair, the triangle trend lines and the 0.795 & 0.80 levels.
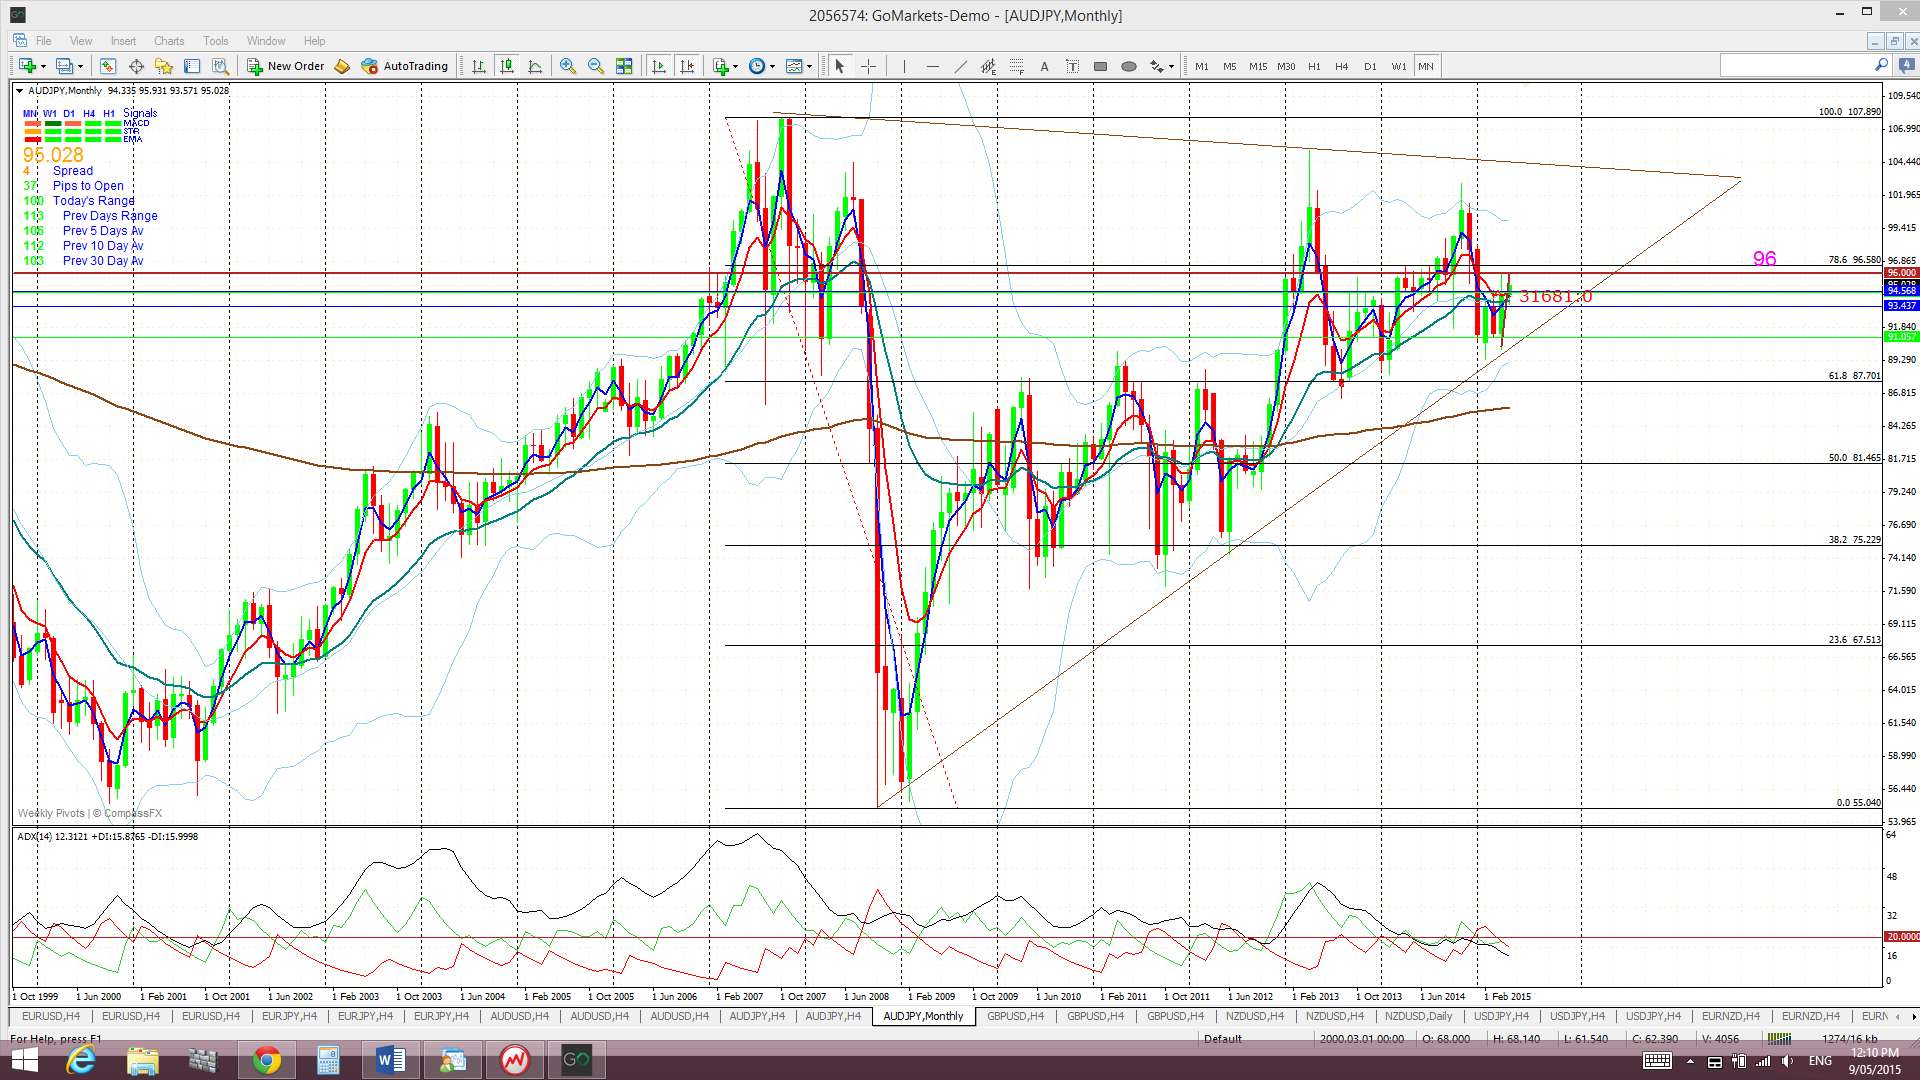
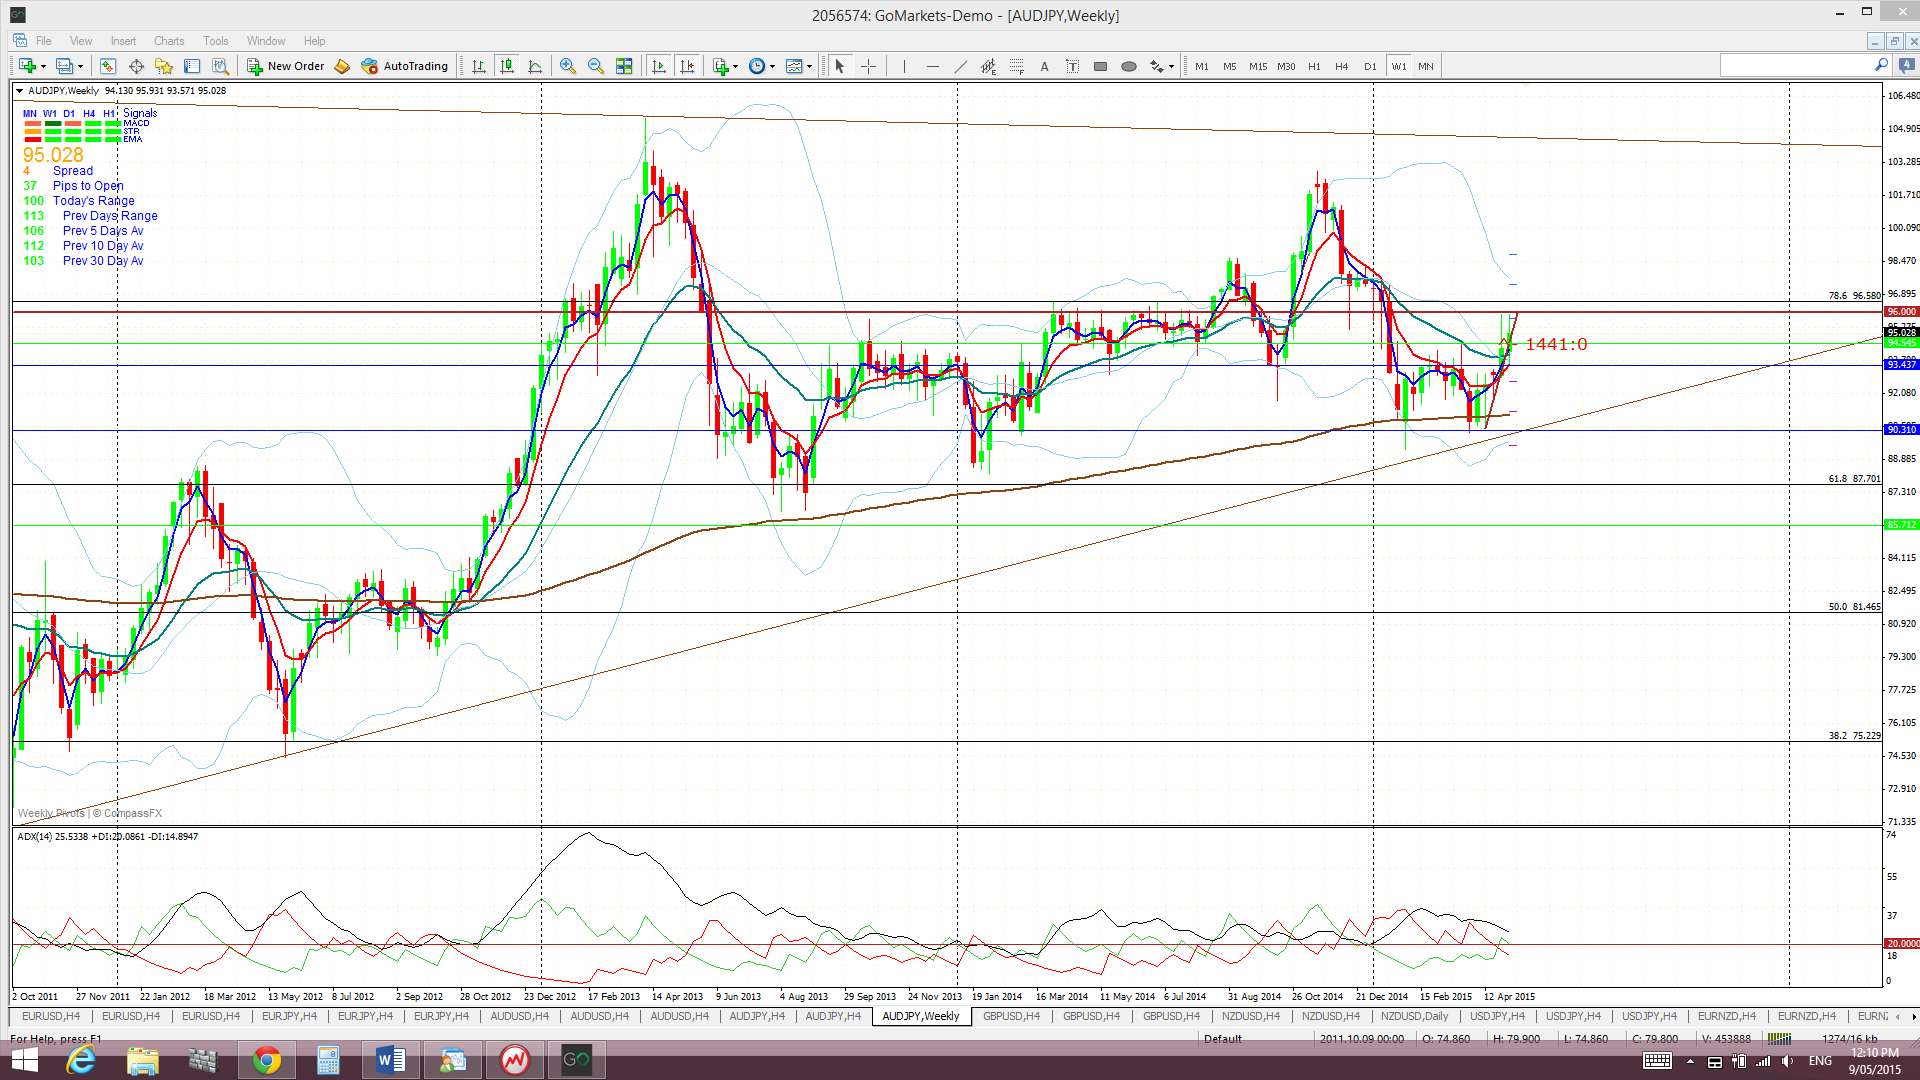
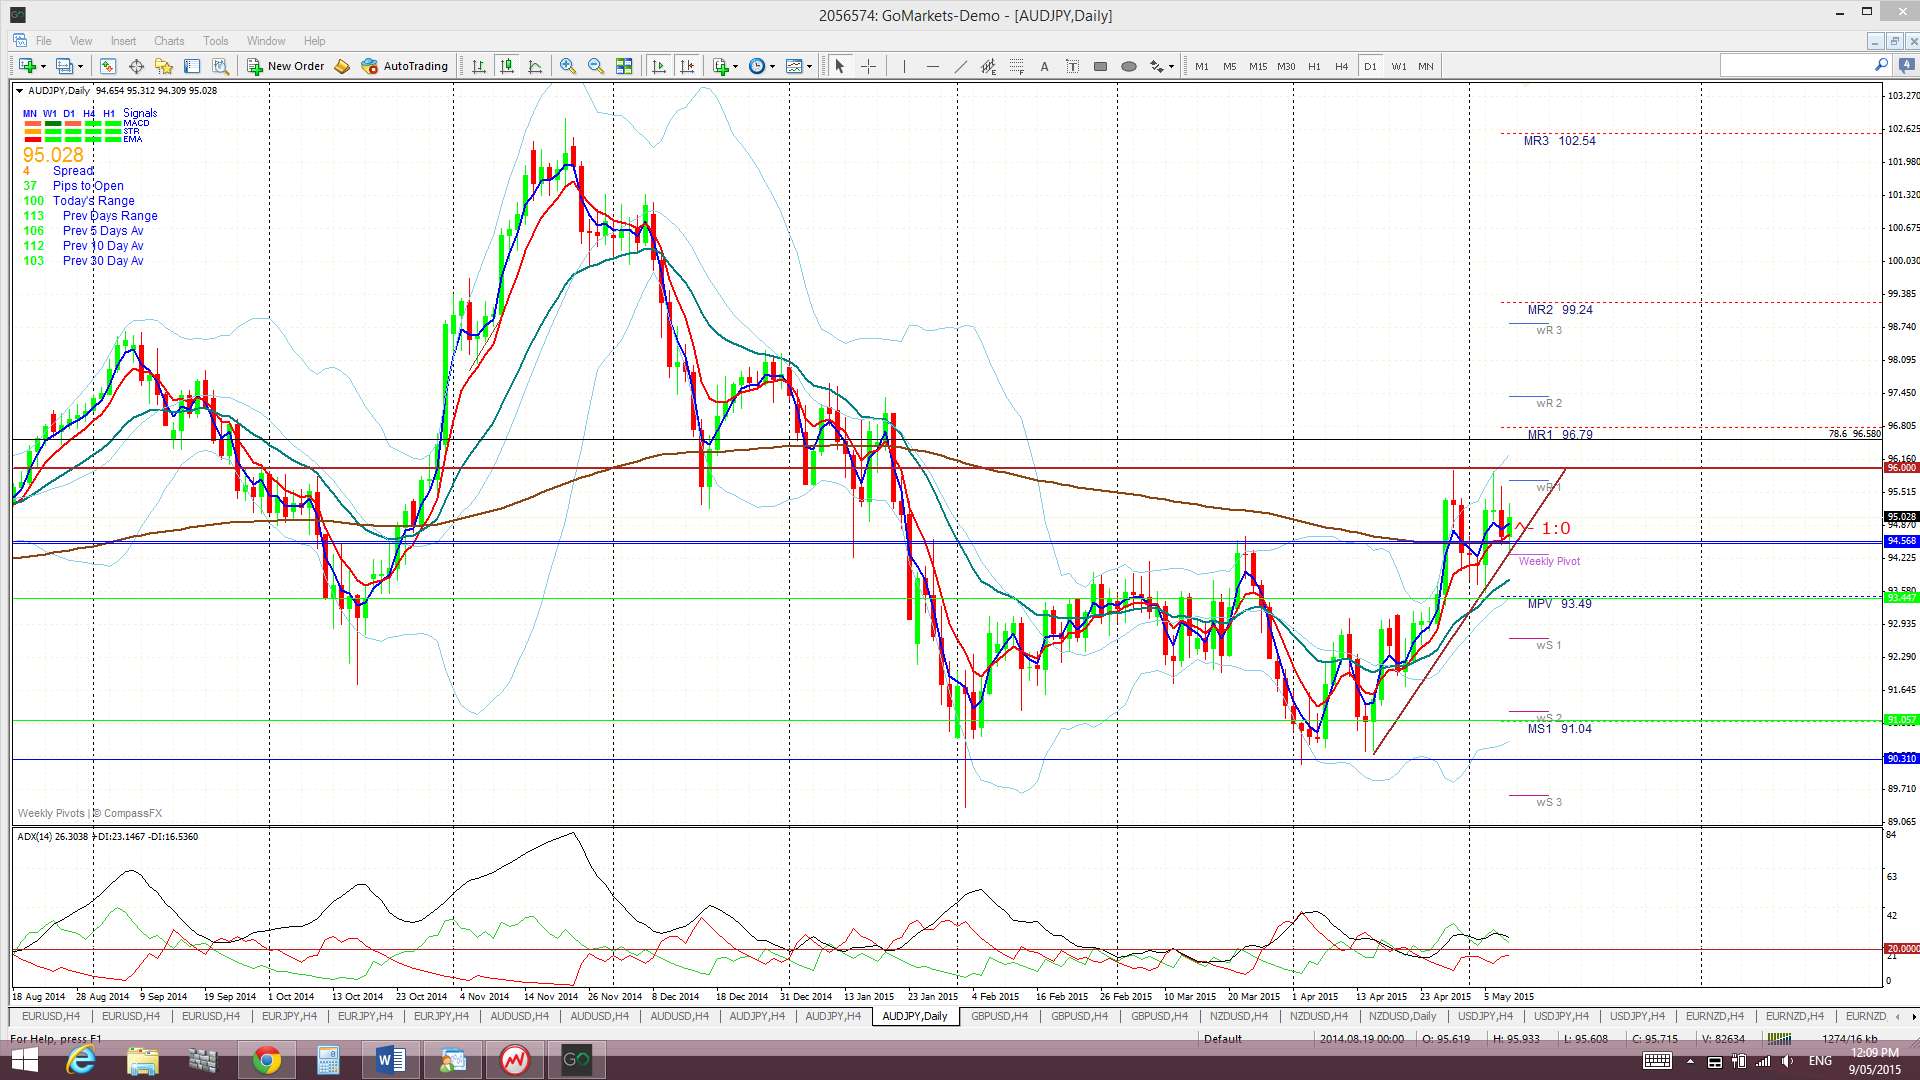
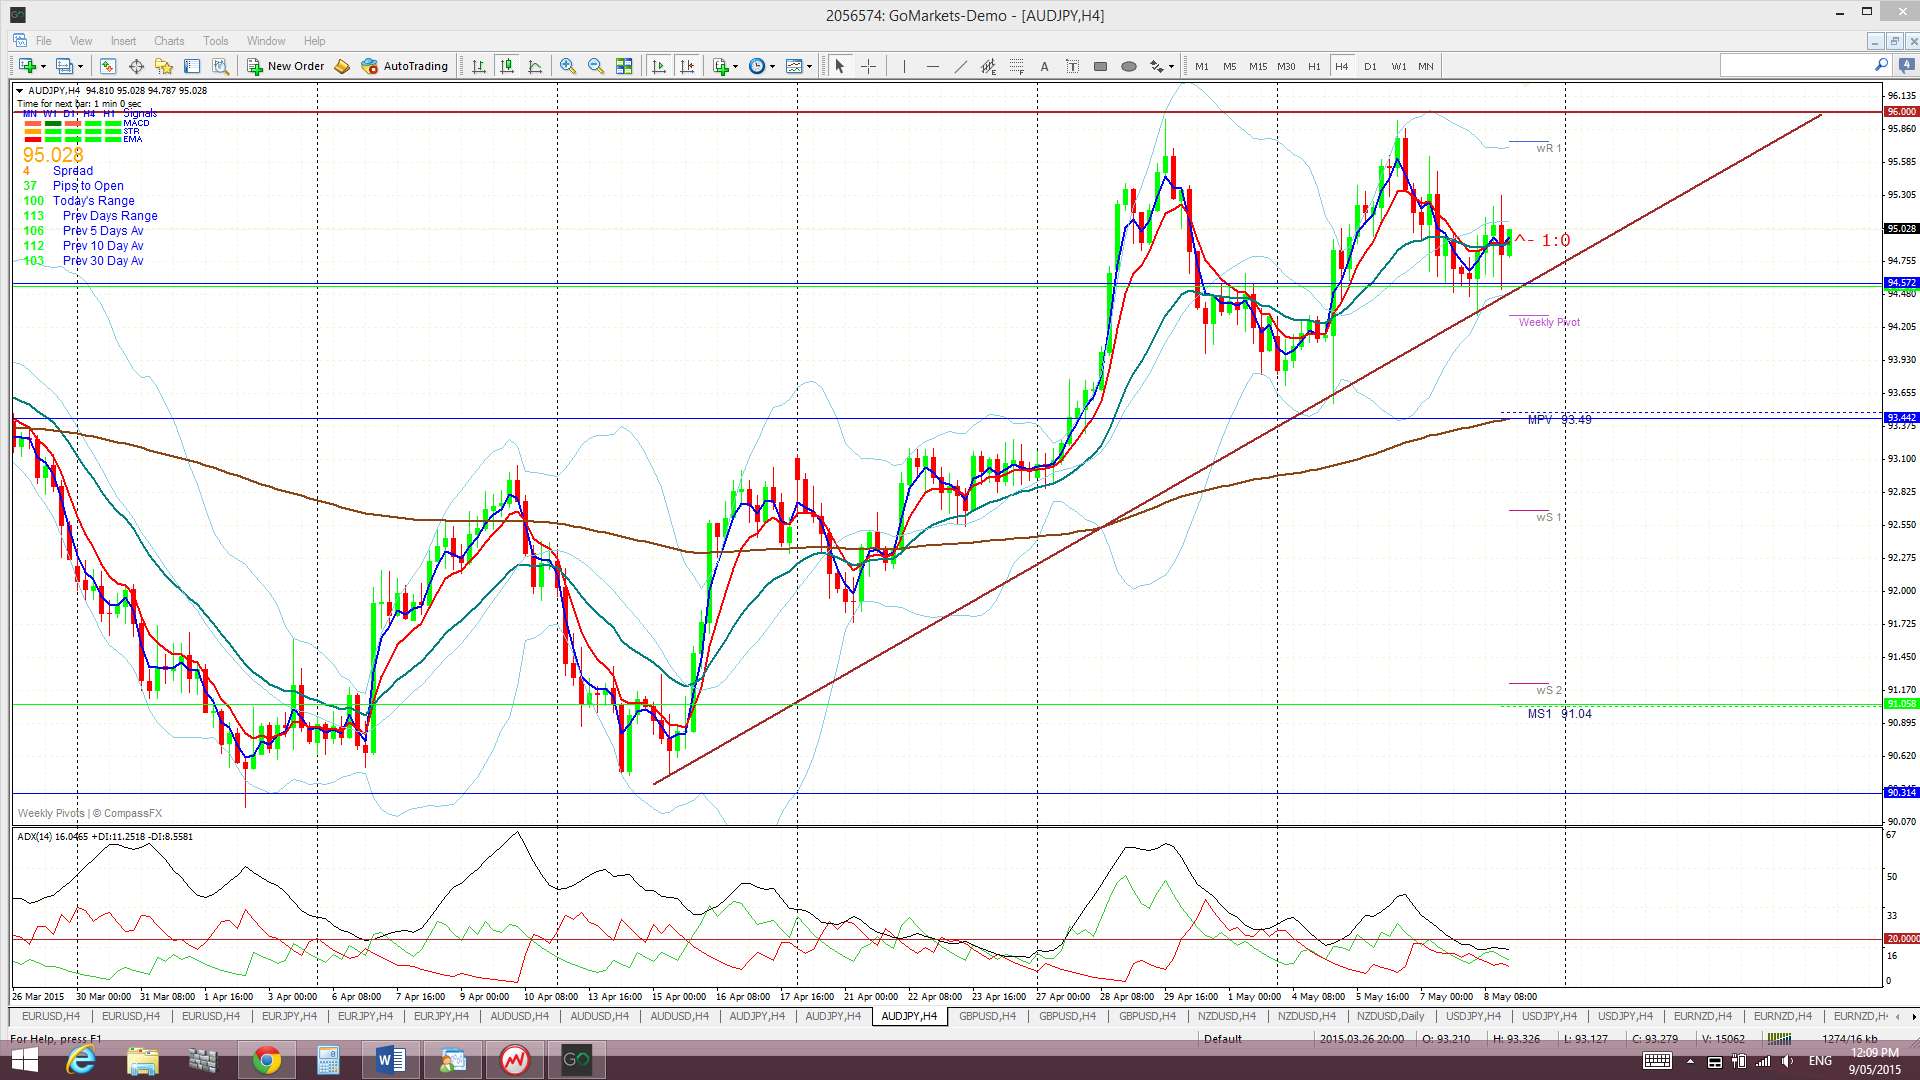
A/J: The A/J chopped up and down under the previous S/R level of 96 but this price action has formed up into a bullish ascending triangle with 96 as resistance and, clearly, the level to watch in coming sessions. I would expect any daily, or better still weekly, close above 96 to be a rather bullish signal. Check the weekly A/J chart to see the importance of the 96 level.
The weekly chart also continues to show price action holding above the weekly 200 EMA and the monthly chart shows the A/J conforming to a triangle pattern.
Price is trading above the Cloud on the 4hr, daily and monthly chart but in the Cloud on the weekly chart.
The weekly candle closed as a bullish candle.
As for the A/U, there is a lot of data to impact the A/J next week including Business Confidence, the Annual Budget, Chinese Industrial Production data as well as all the US$ sensitive data.
- I’m watching for any new TC signal on this pair, the 4hr chart’s bullish ascending triangle and the 96 level.
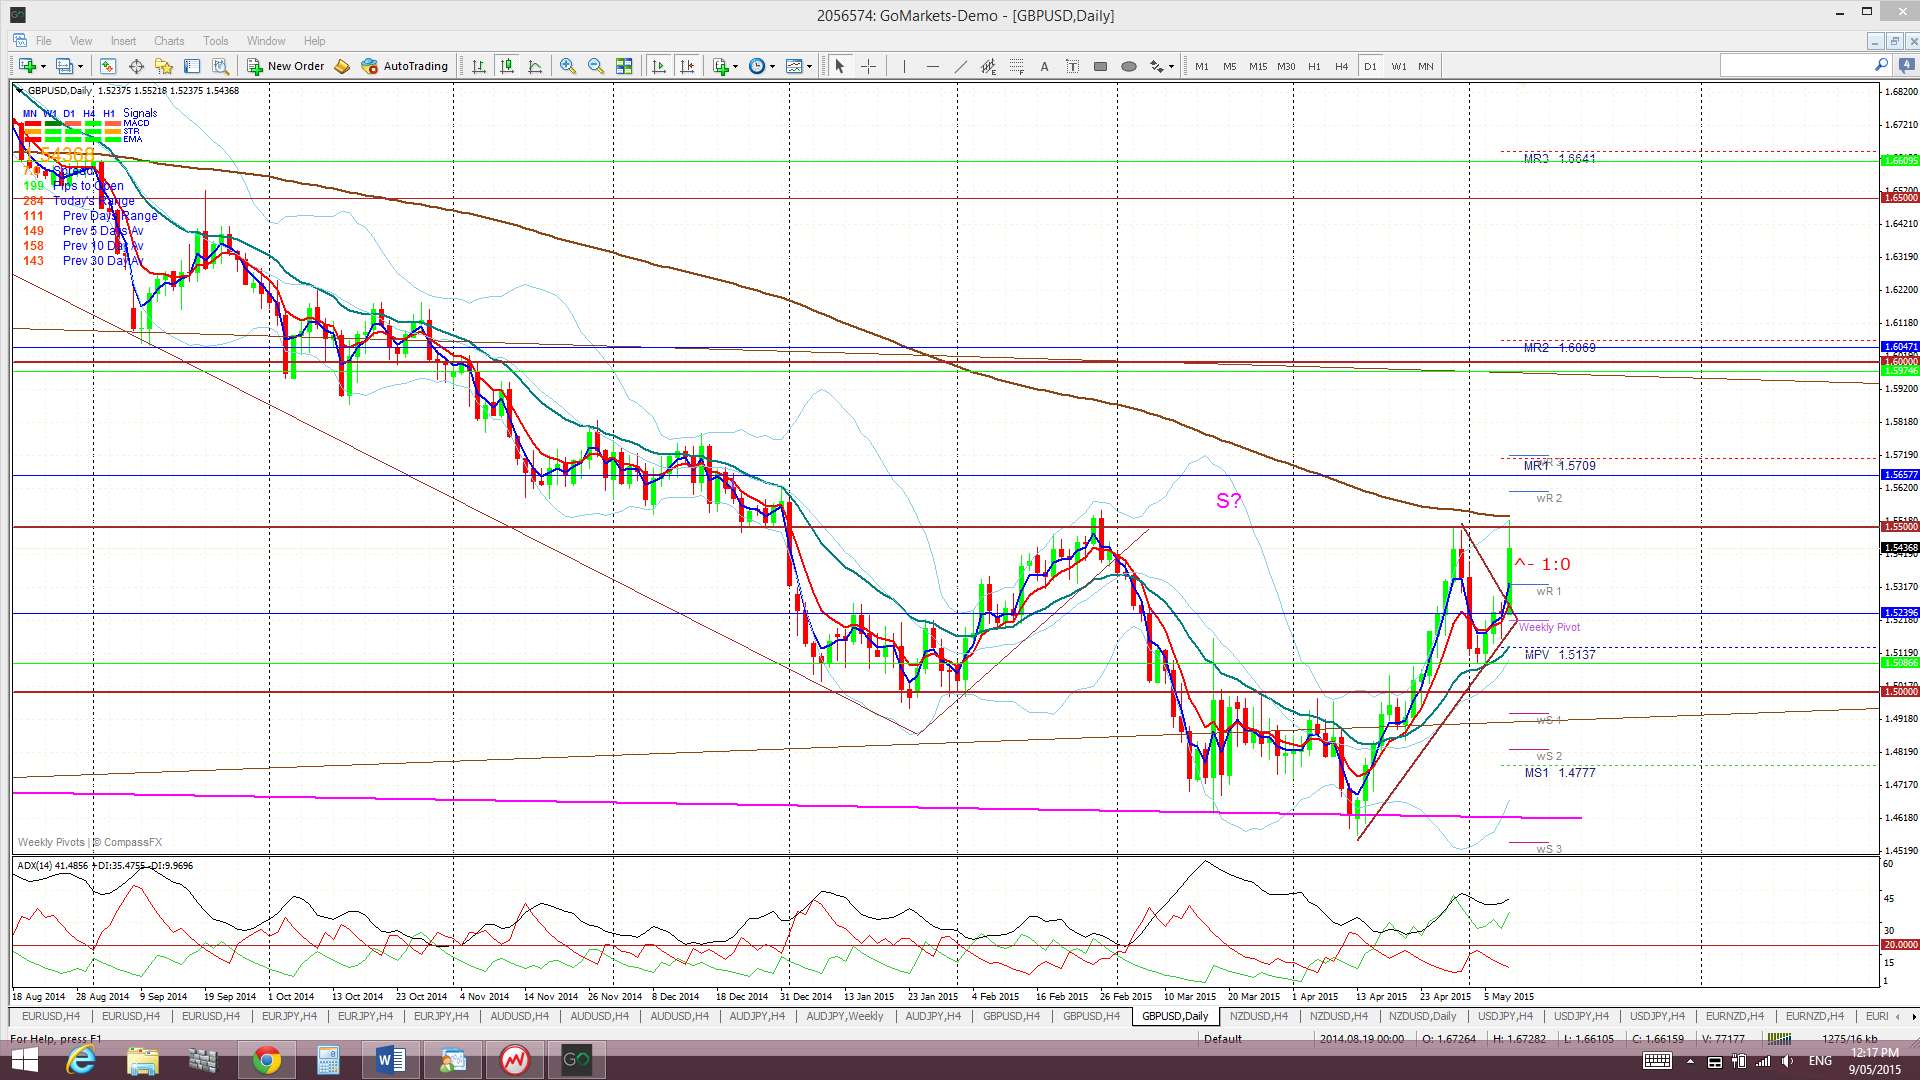
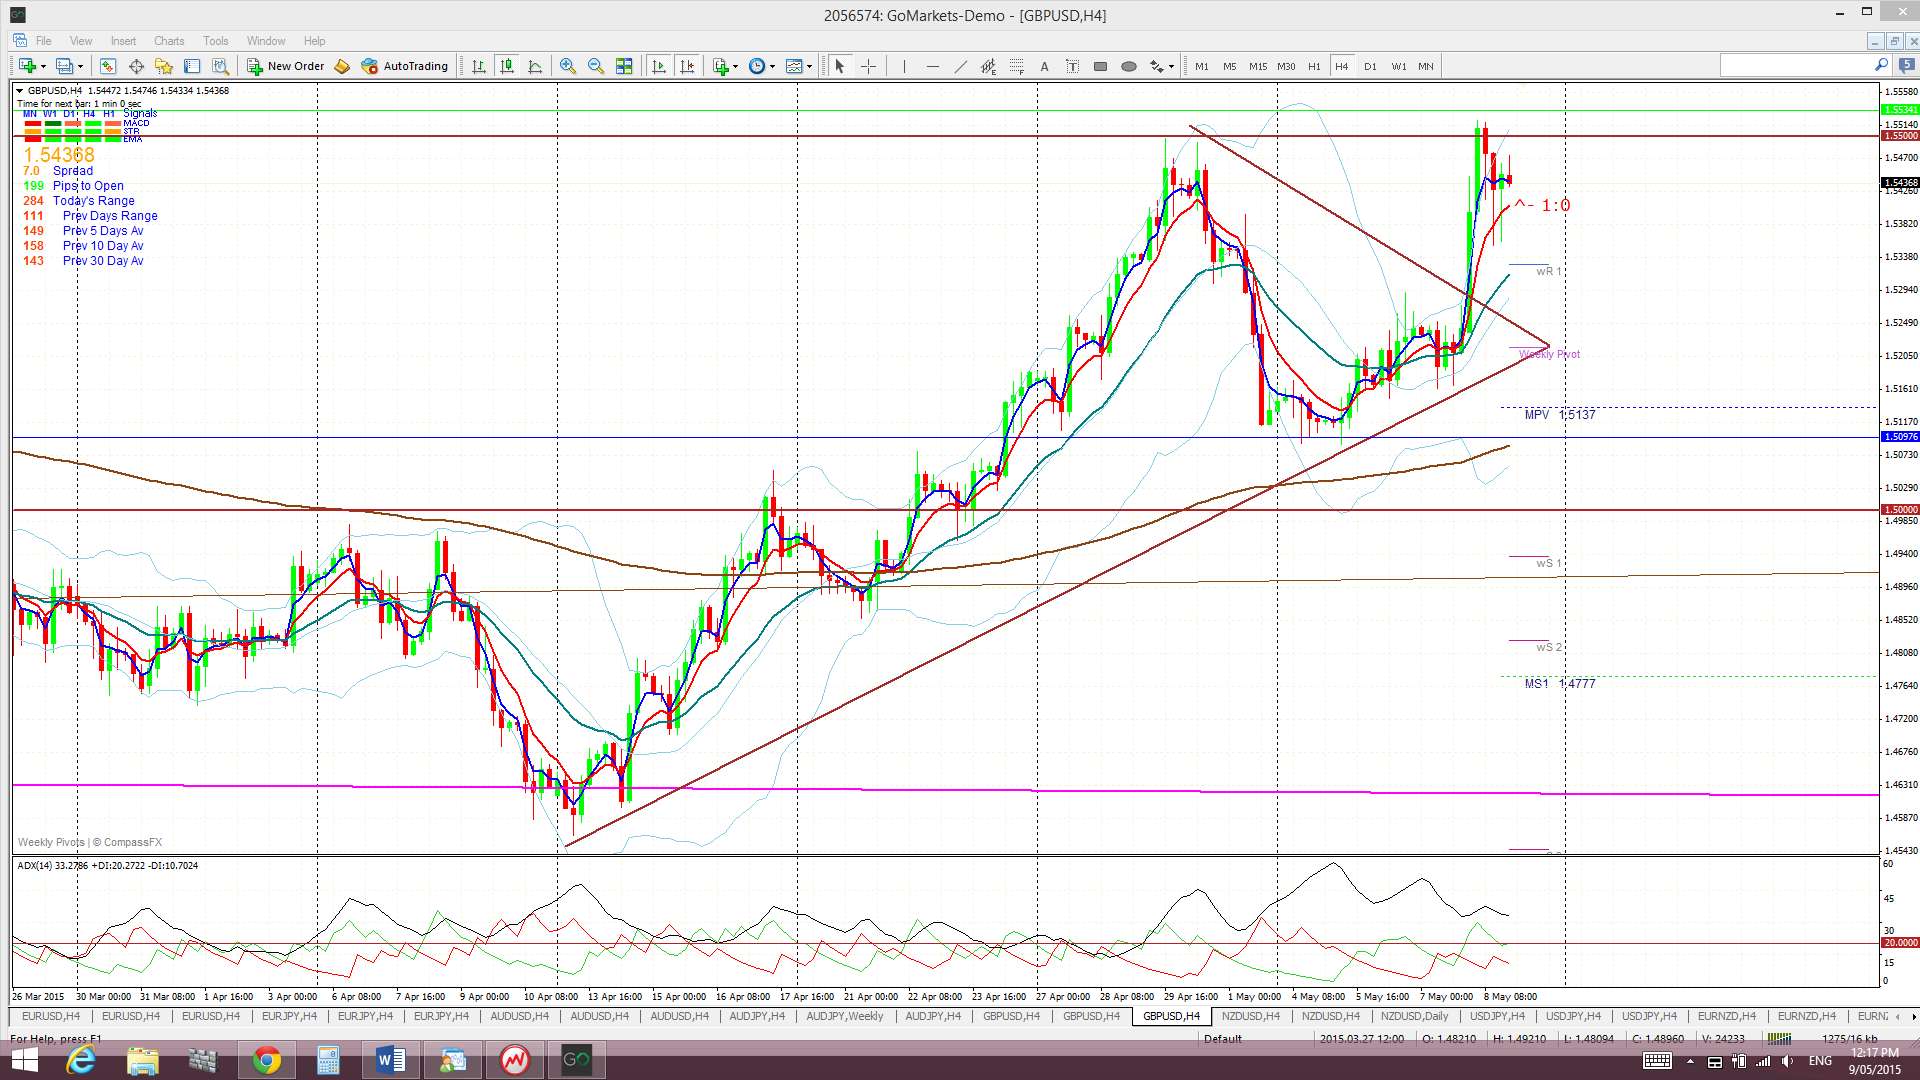
G/U: Cable price action formed up into a consolidation-style triangle pattern leading up to the UK election. Price rallied and made a bullish breakout from this triangle as soon as exit poll data was released and the Cable spent much of Friday’s Asian session just below the 1.55 level as NFP was then watched. This data release didn’t add much more fuel here though but given price had already moved over 280 pips for the day, a value well above its usual daily range, that now seems rather appropriate. The 1.55 value now gives traders a level to watch and trade from in coming sessions.
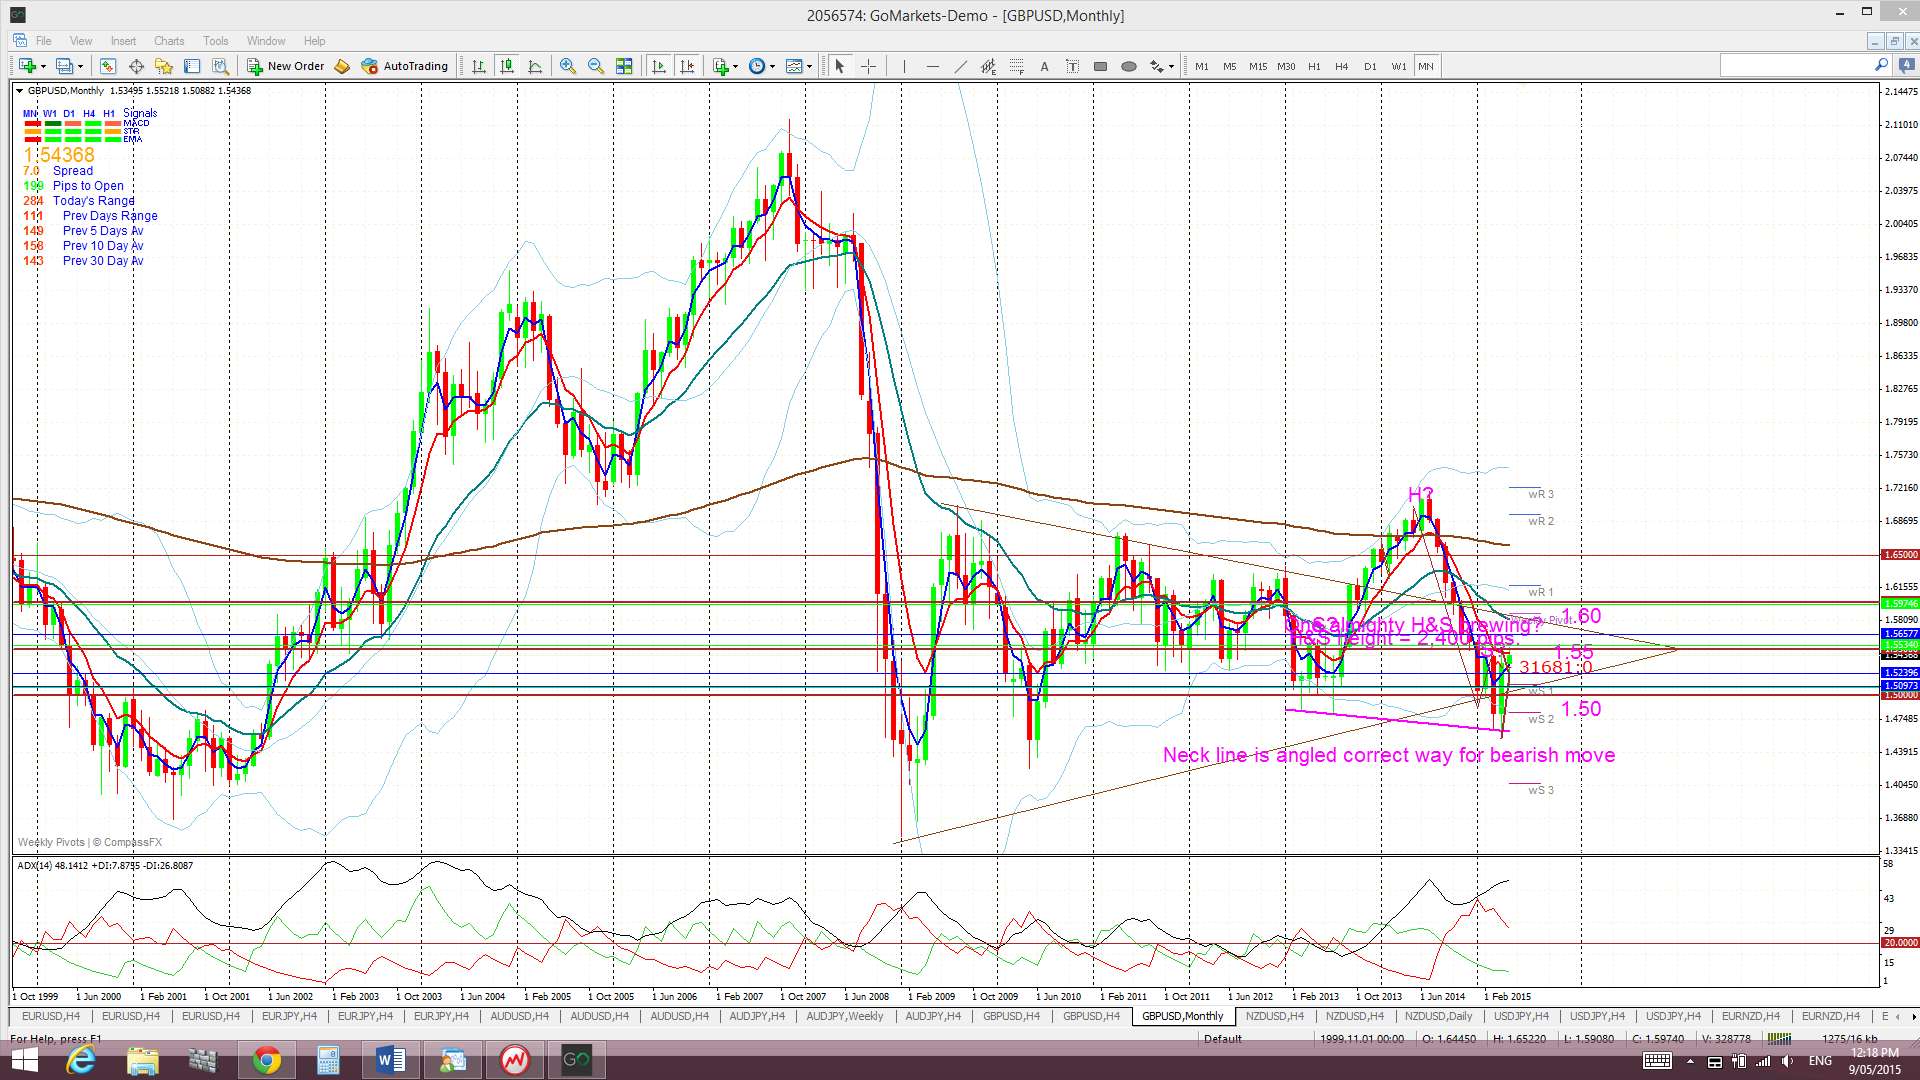
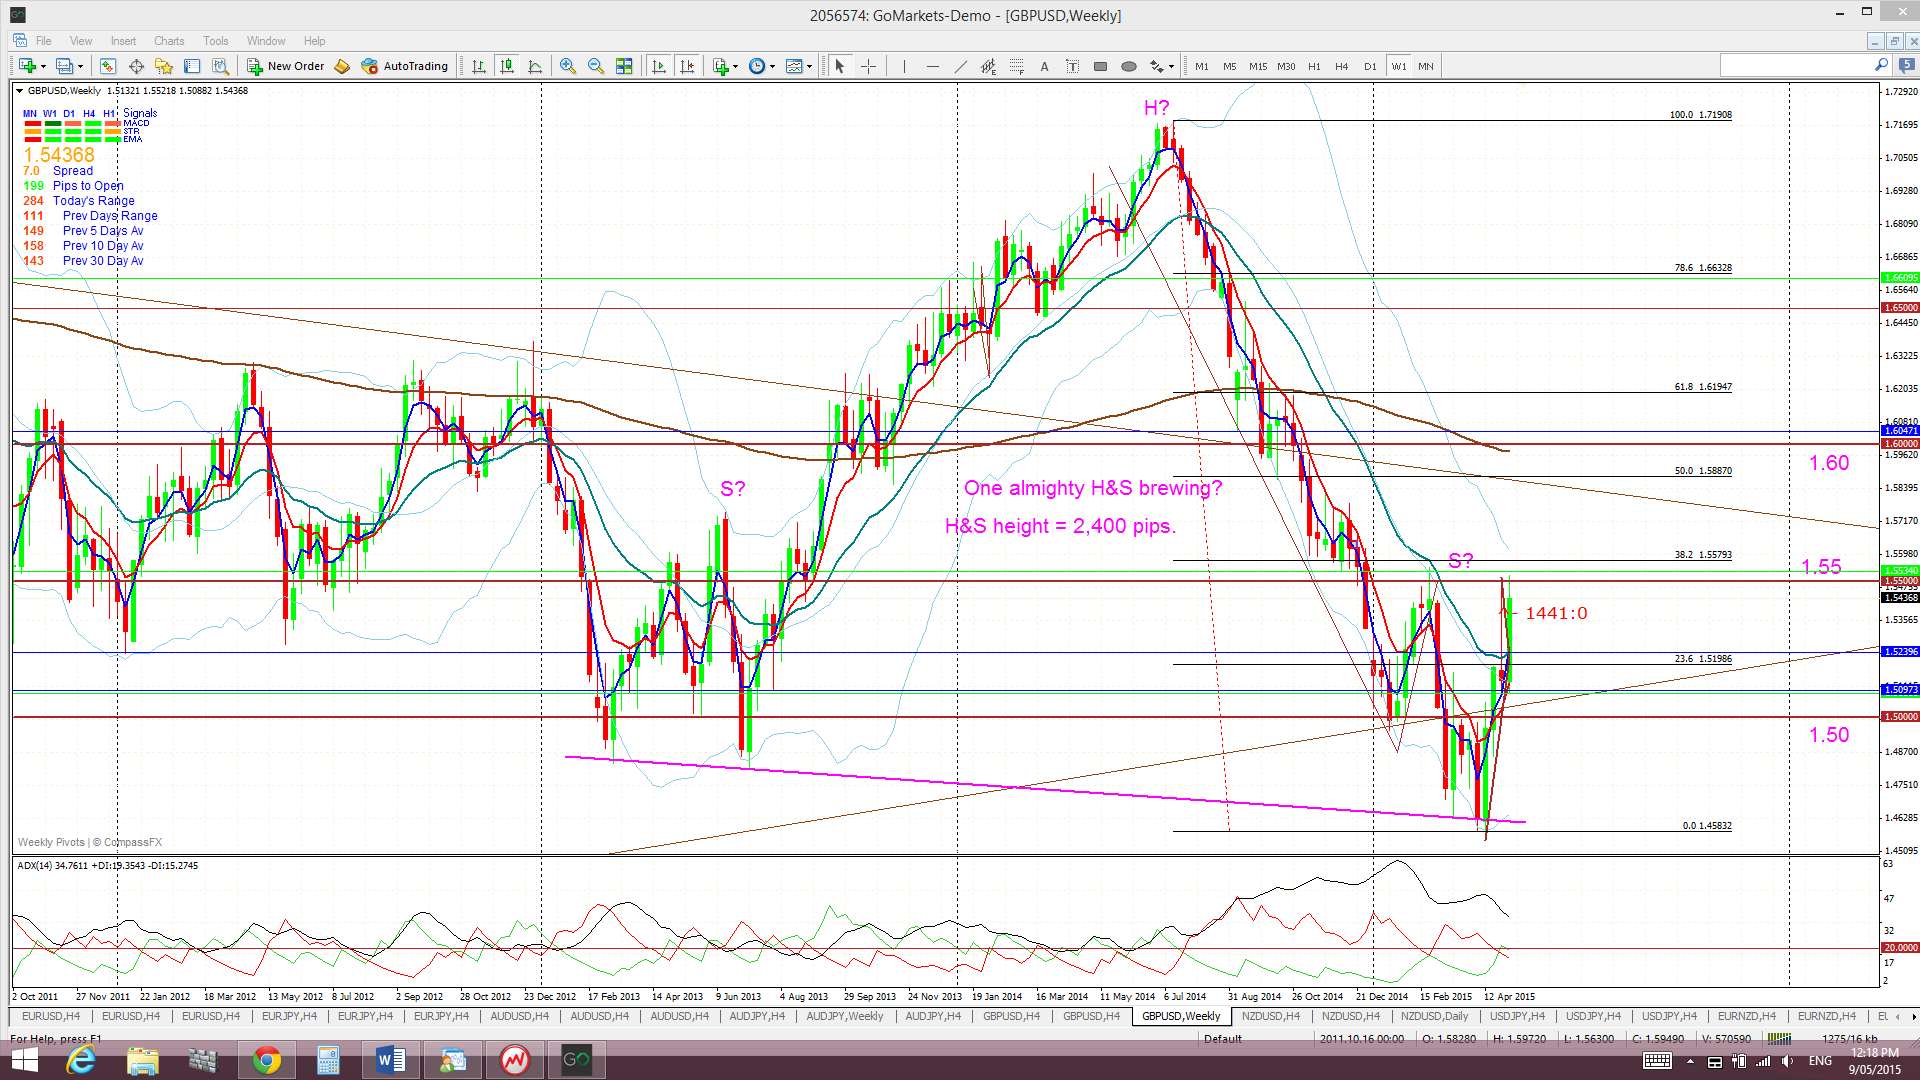
Weekly chart H&S: There is still a possible bearish H&S pattern forming on the weekly chart and the failure to continue above 1.55 is supporting this pattern for the time being. The height of the pattern is about 2,400 pips and suggests a similar move lower with any break and hold below the ‘neck line’. Recall that the GBP/USD printed a monthly close in March below 1.50, the first since June 2010. This bearish development supports the H&S pattern BUT we will need to see a close and hold below the ‘neck line’ to confirm any such bearish breakdown. I will also be watching the 1.55 level as any weekly close and hold above this would void this pattern for me.
Any bullish continuation above 1.55 would suggest that a trip up to near the 50% fib of this swing low move might be in order as this is also near the weekly 200 EMA and the key 1.60 level.
Price is now trading above the Cloud on the 4hr and daily charts but below on the weekly chart and in the Cloud on the monthly chart.
The weekly candle closed as a large bullish, essentially, engulfing candle.
As if the UK election hasn’t been enough for the Cable to contend with, there is a lot more high impact data for it to deal with next week: an Interest Rate decision, Manufacturing data, Employment and Wages data and a BoE Inflation report. Watch for these events to trigger any reaction around the 1.55 level.
- I’m watching for any new TC signal on this pair and the 1.55 level.
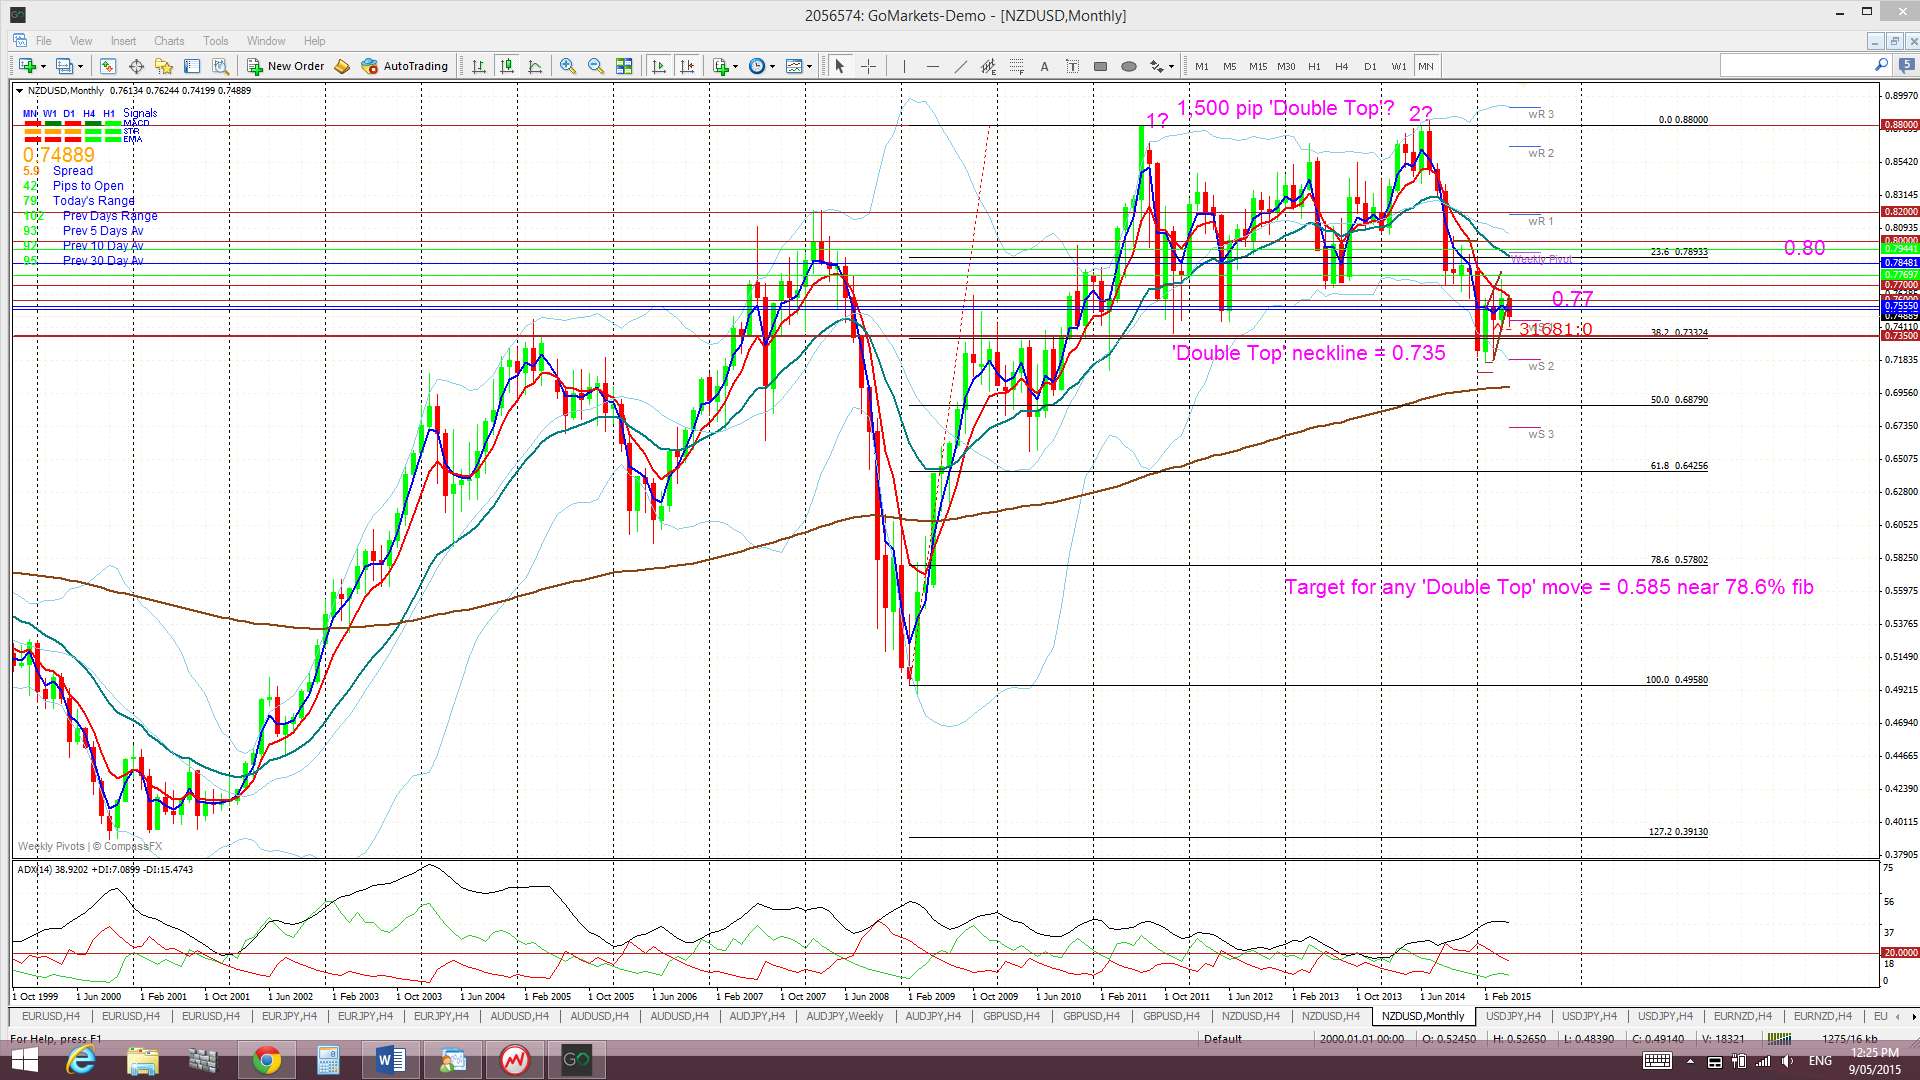
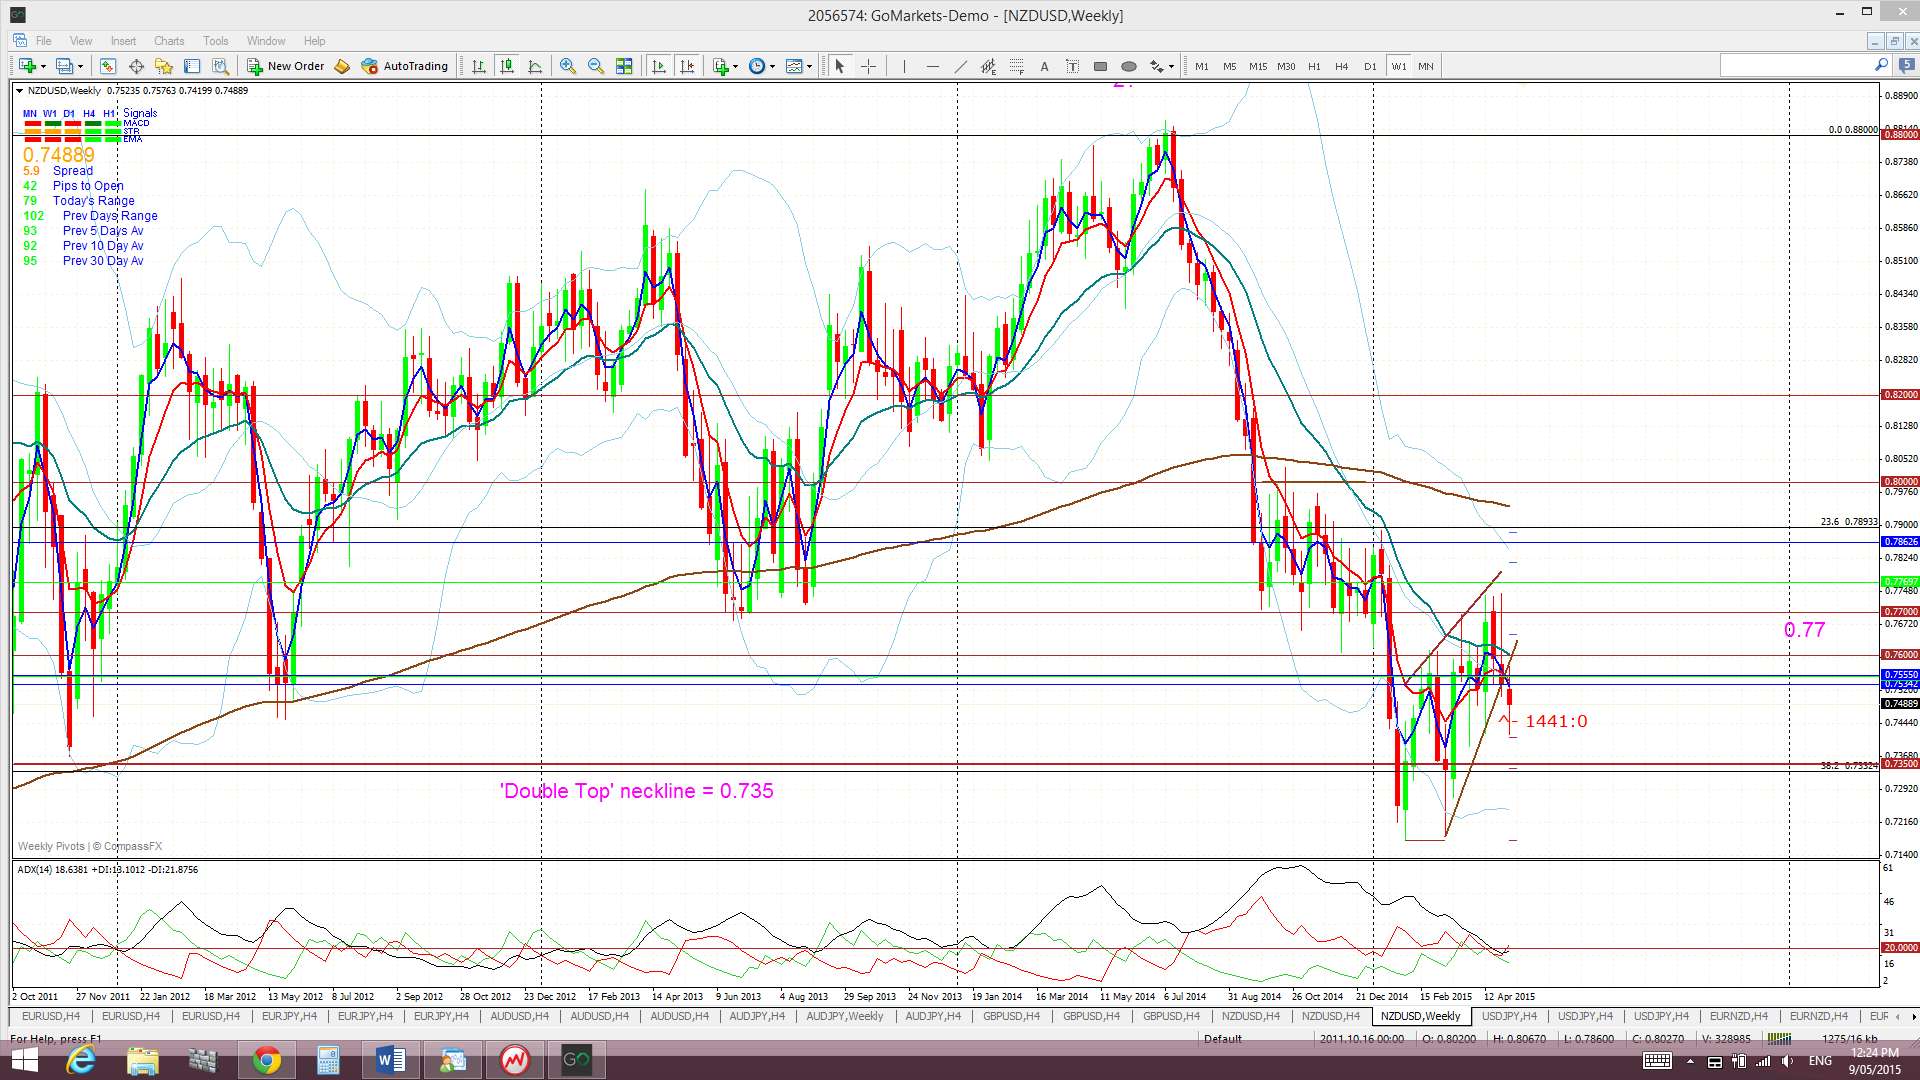
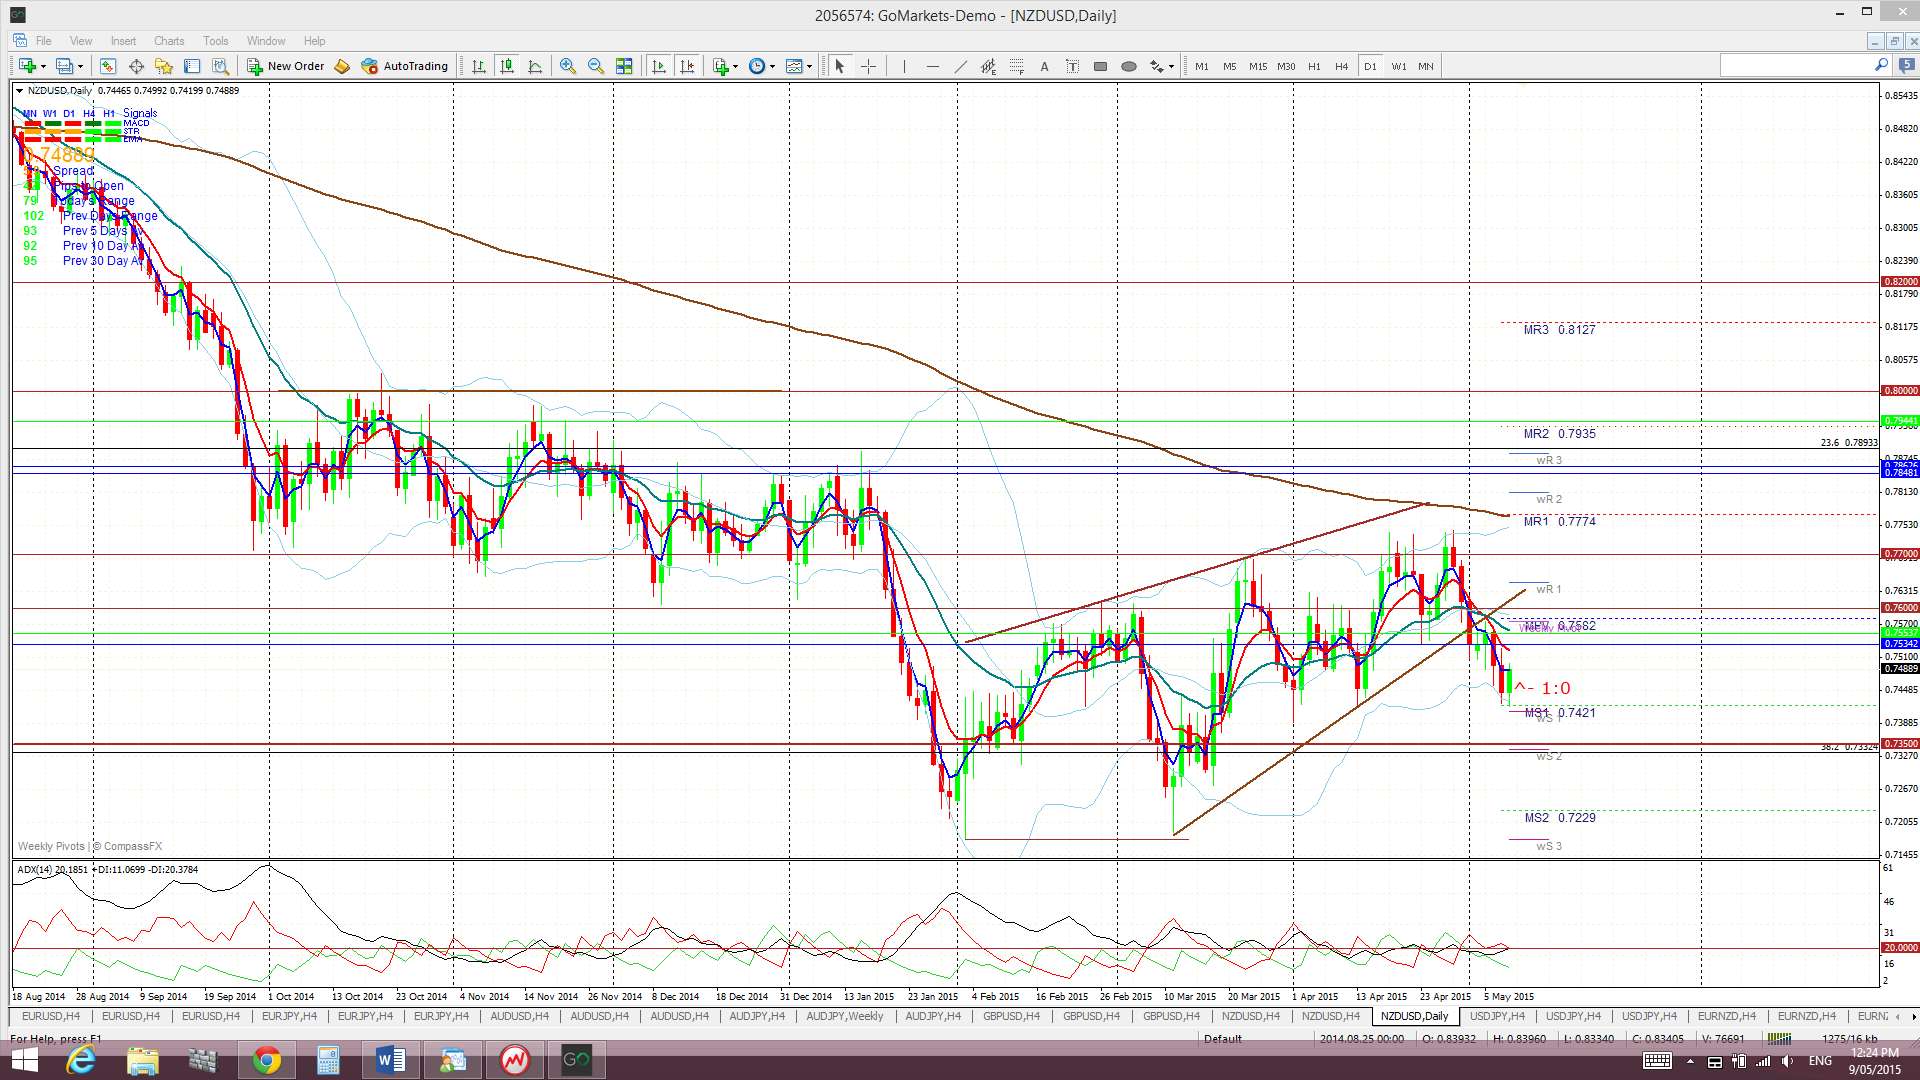
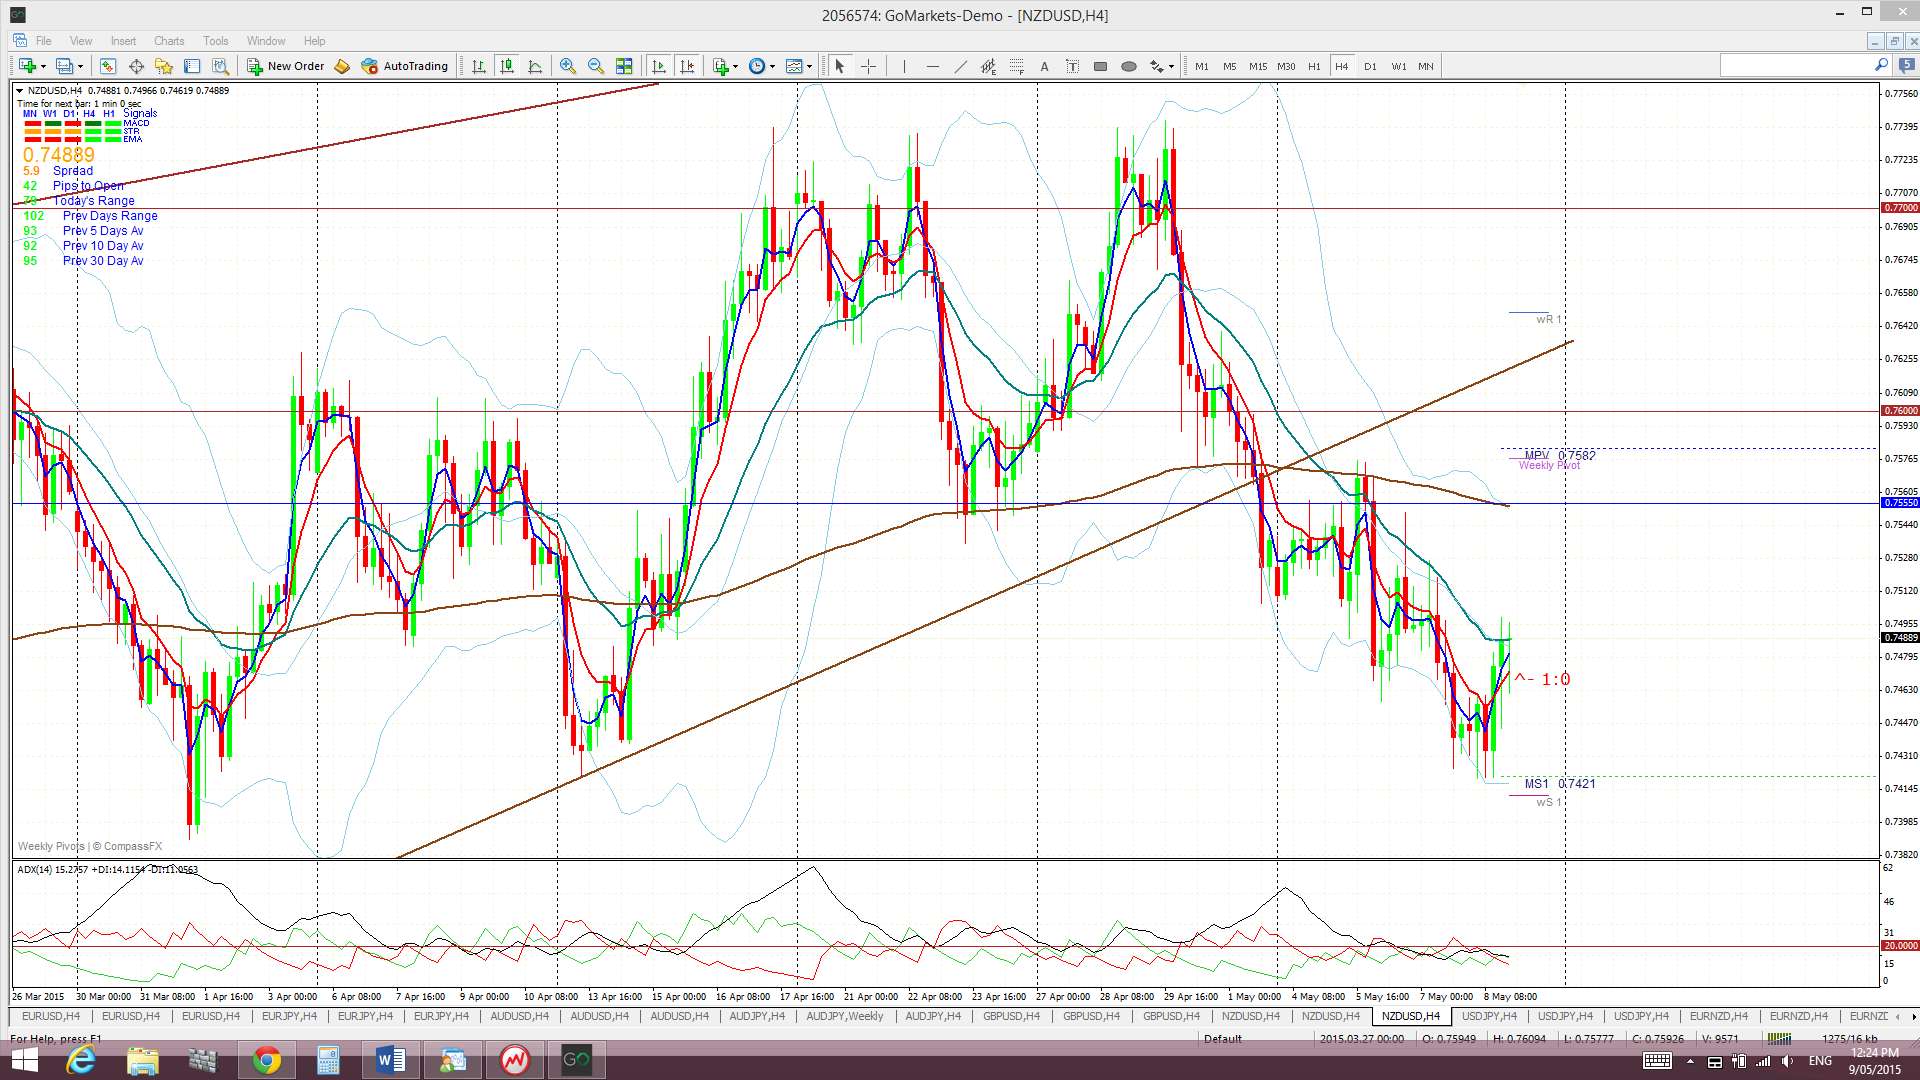
Kiwi: NZD/USD: The Kiwi chopped lower last week following on from the previous week’s bearish ascending wedge breakdown. Continued weakness would see this pair most likely heading to test 0.735 yet again.
AUD/NZD: I still want to draw attention to the AUD/NZD monthly chart and I wrote a separate article about this pair mid-week that can be found through this link. The monthly AUD/NZD candle closed for April as a bullish engulfing candle above parity and may suggest a reversal here. This would sit quite reasonably for me especially if the US$ continues to weaken. Both the AUD and NZD are commodity currencies and would benefit from any continued US$ weakness. However, Australia produces both ‘hard’ and ‘soft’ commodities whereas New Zealand produces mostly ‘soft’ commodities. Thus, US$ weakness and a recovery with commodity pricing stands to add more support to the AUD relative to the NZD:
Back to the NZD/USD: ‘Double Top’ breakdown on Monthly chart? The monthly chart still reveals a possible ‘Double Top’ pattern with a neck line at 0.735 in the making. The monthly candle close below this level for January suggested a possible 2,000 pip bearish follow through move as this is the height of the ‘Double Top’ BUT there does not seem to be a hold below this key level JUST YET.
Price is now trading below the Ichimoku Cloud on the 4hr and weekly charts but in the top of the Cloud on the daily chart and in the middle of the Cloud on the monthly chart.
The weekly candle closed as a bearish ‘Spinning Top’ candle reflecting the indecision here.
The NZD/USD has been struggling to capitalise on any US$ weakness of late and faces a bit of high impact data this week with a Financial Stability Report, a RBNZ Gov Wheeler speech and Retail Sales data and this is on top of Chinese and US$ sensitive data. Watch how the Kiwi reacts around 0.735 with all of this data.
- I’m watching for any new TC signal on this pair and the 0.735 level.
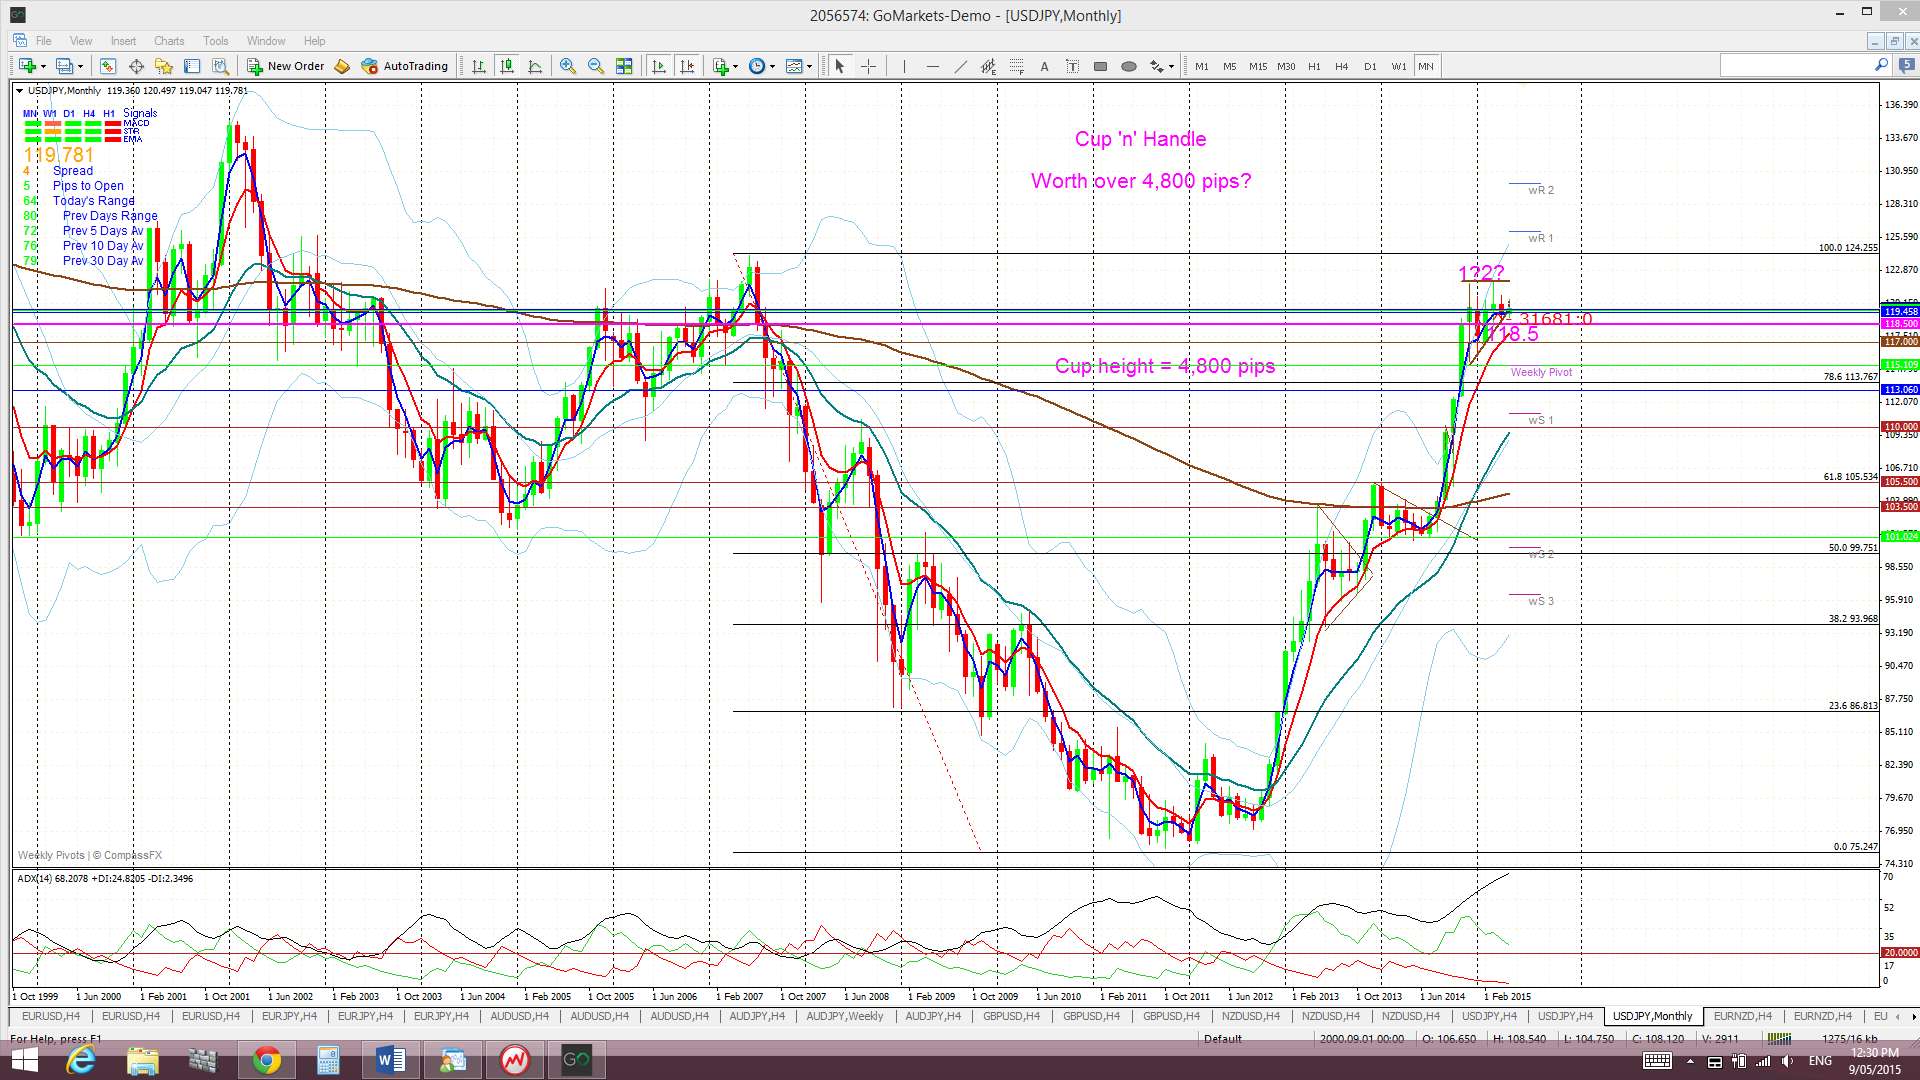
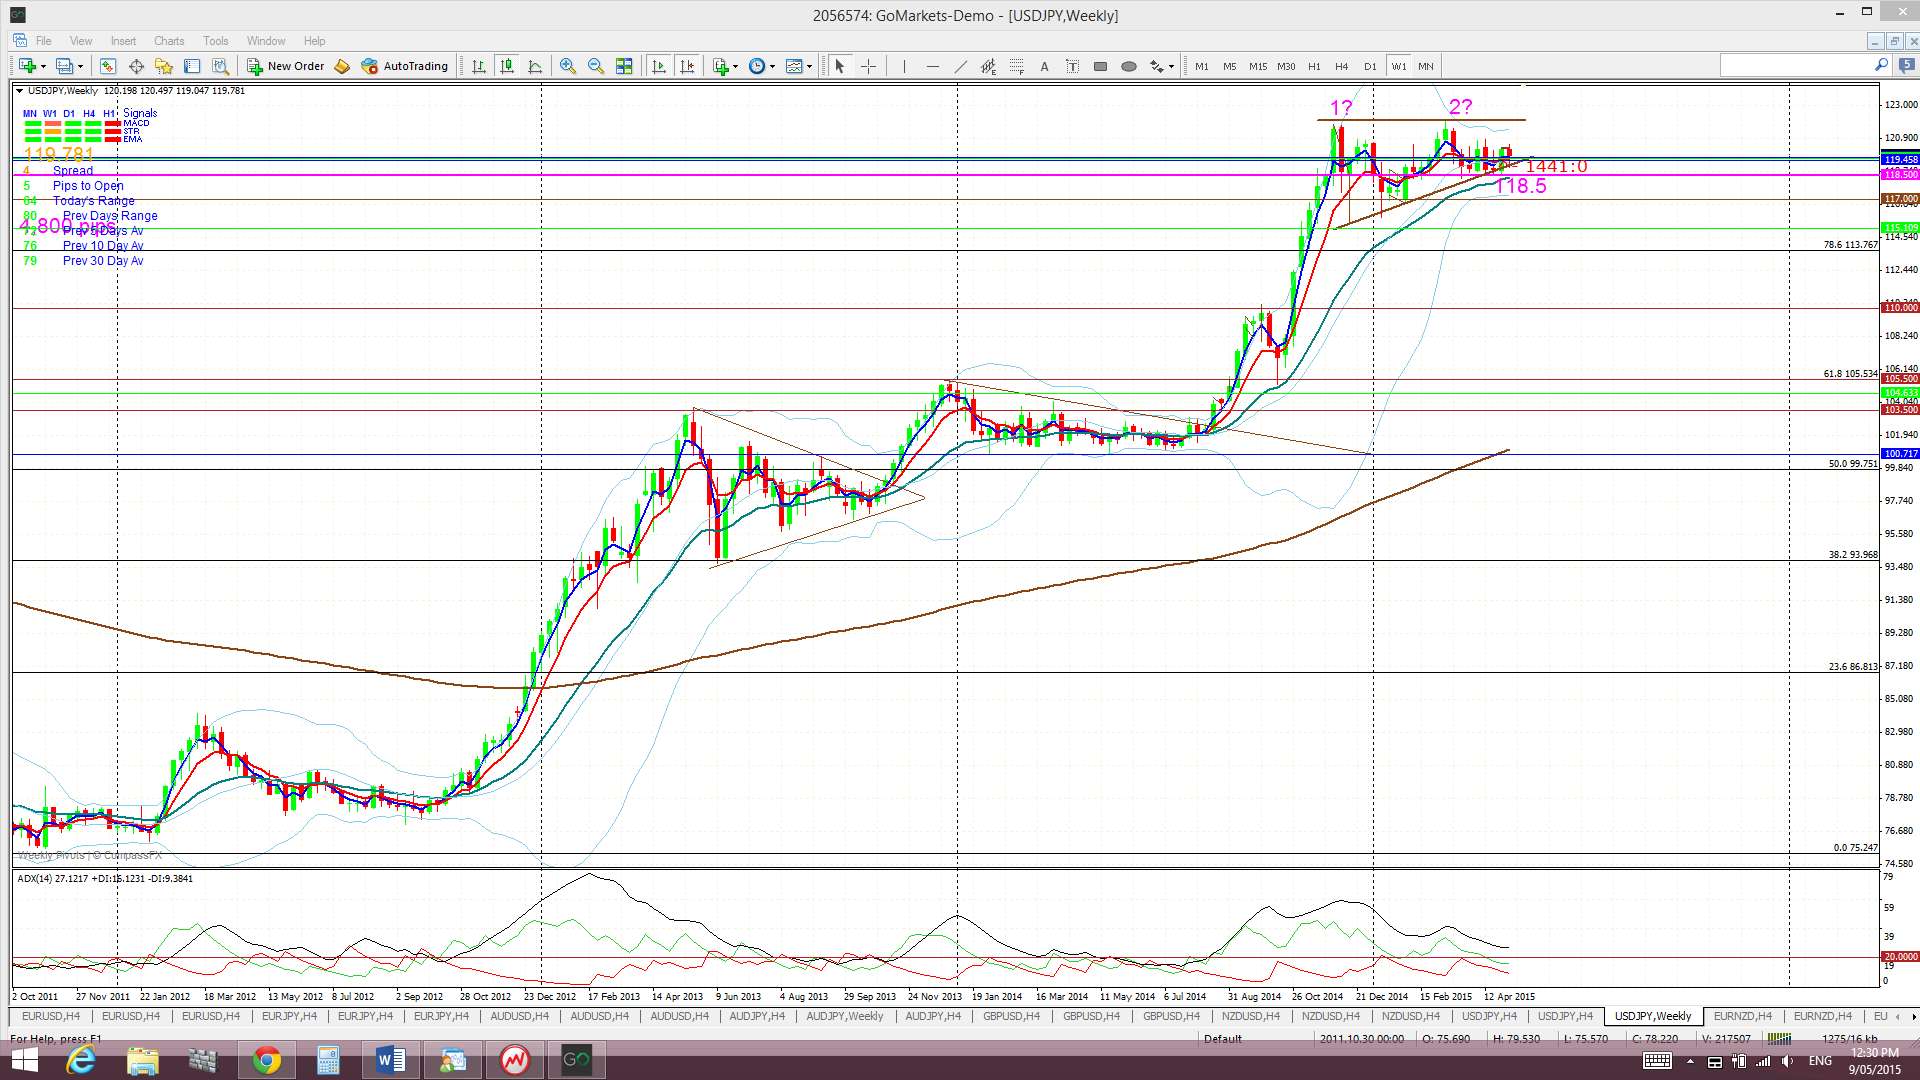
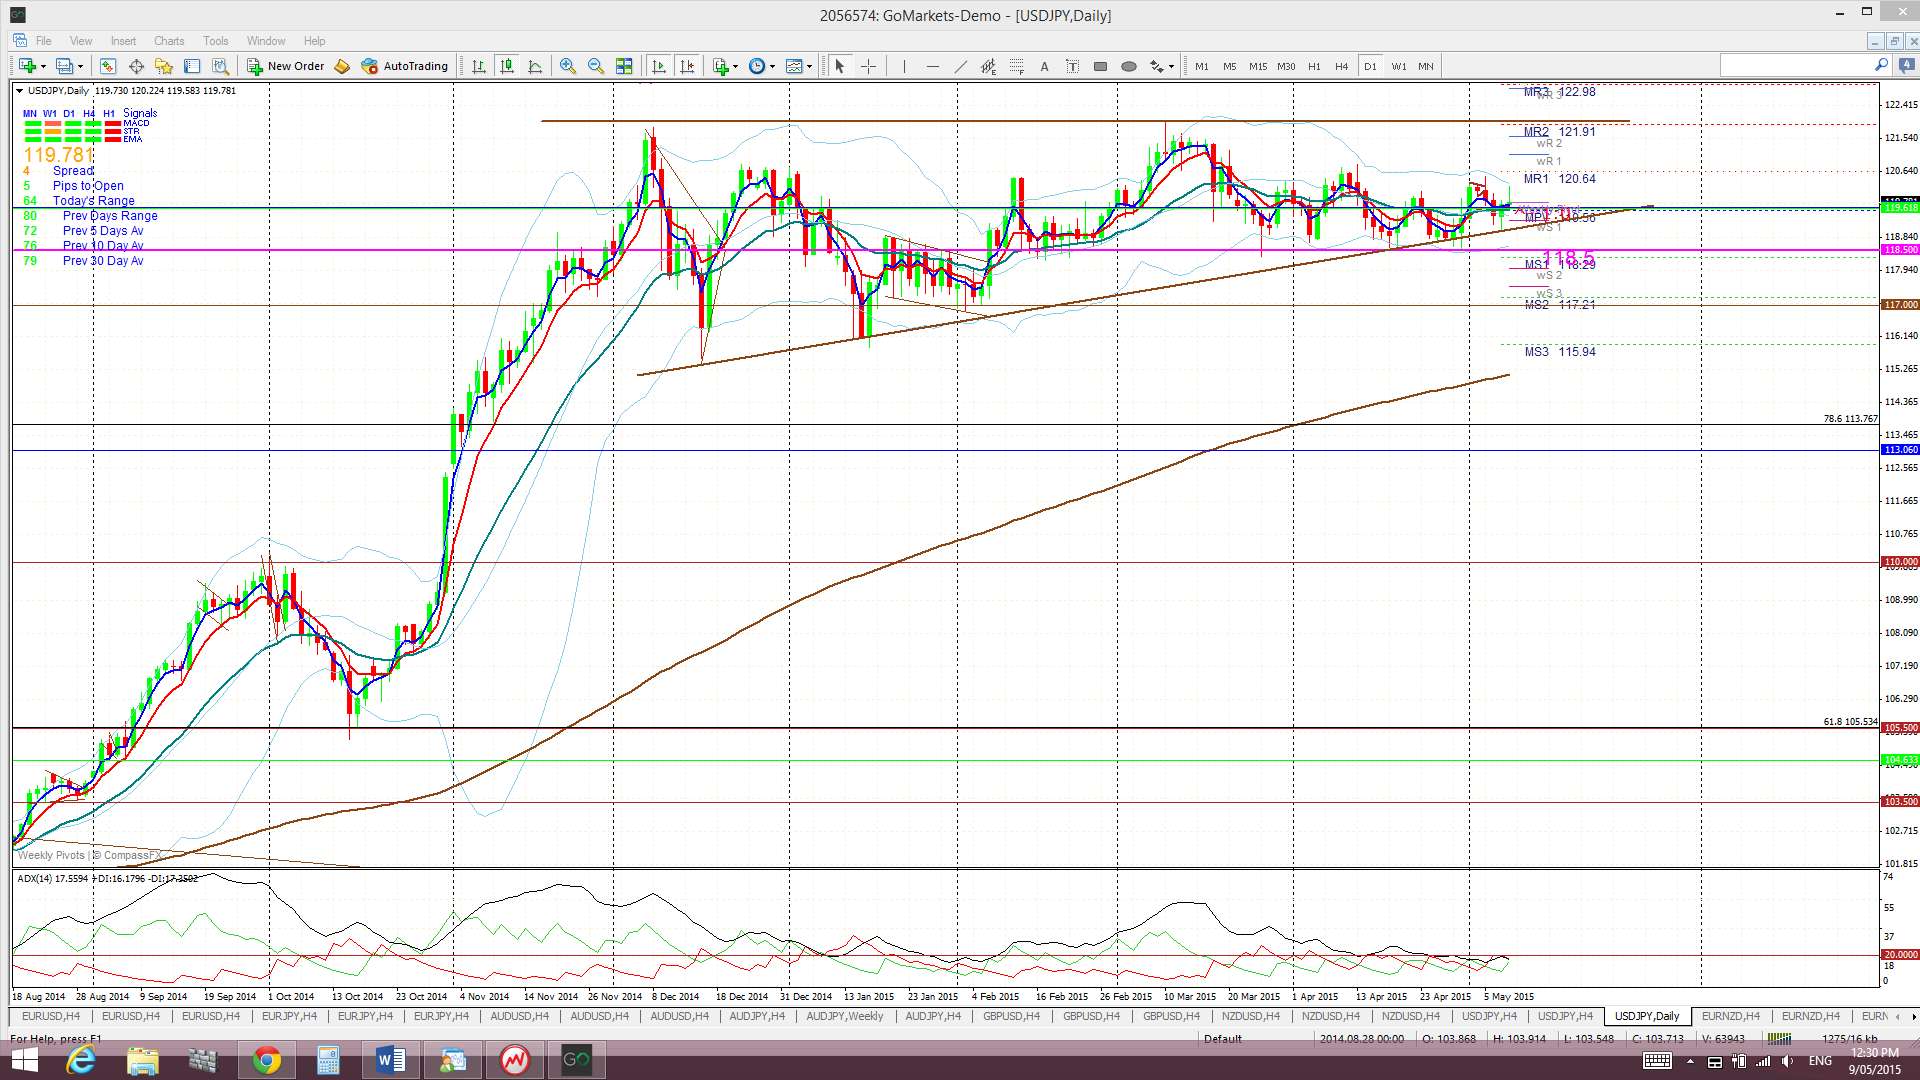
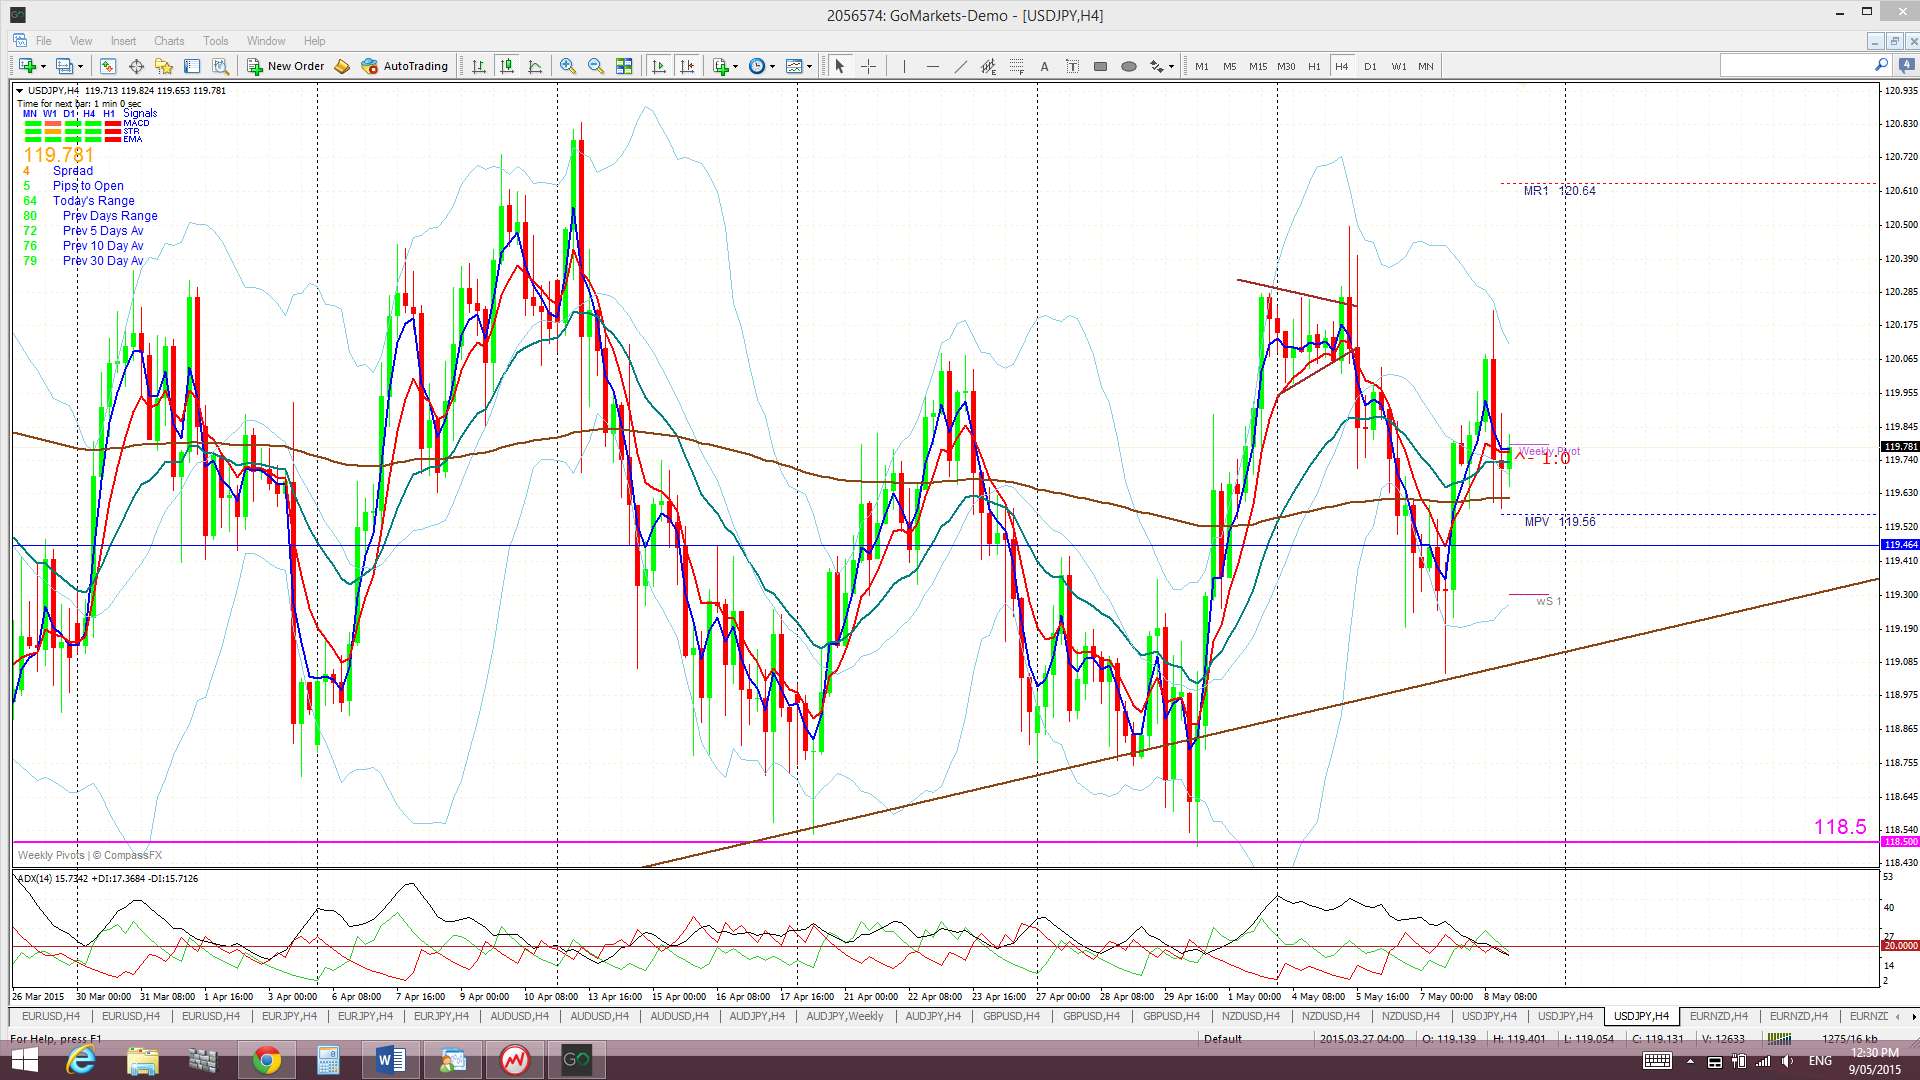
The Yen: U/J: The U/J chopped down to test support again last week before bouncing higher. The daily/weekly charts still show a bullish ascending triangle pattern developing and I continue to view this choppy triangle action as helping to form the ‘Handle’ of a potential Cup ‘n’ Handle on the monthly chart.
Price is trading above the Cloud on the 4hr, weekly and monthly charts but in the Cloud on the daily chart. November 2013 was the first monthly candle close above the Ichimoku Cloud since mid-2007 and the bullish hold above the monthly Cloud continues to be noteworthy.
The weekly candle closed as a small bearish ‘Spinning Top’ candle.
Monthly Chart Bullish Cup’ n’ Handle pattern: There looks to be a new bullish Cup ‘n’ Handle forming up on the monthly chart. The theory behind these patterns is that the height of the ‘Cup’ pattern is equivalent to the expected bullish move from the ‘handle’ breakout. The height of the Cup for the U/J weekly chart is around 4,800 pips.
- I’m watching for any new TC signal on this pair, the ‘Handle’ trend lines and the 118.5 level.
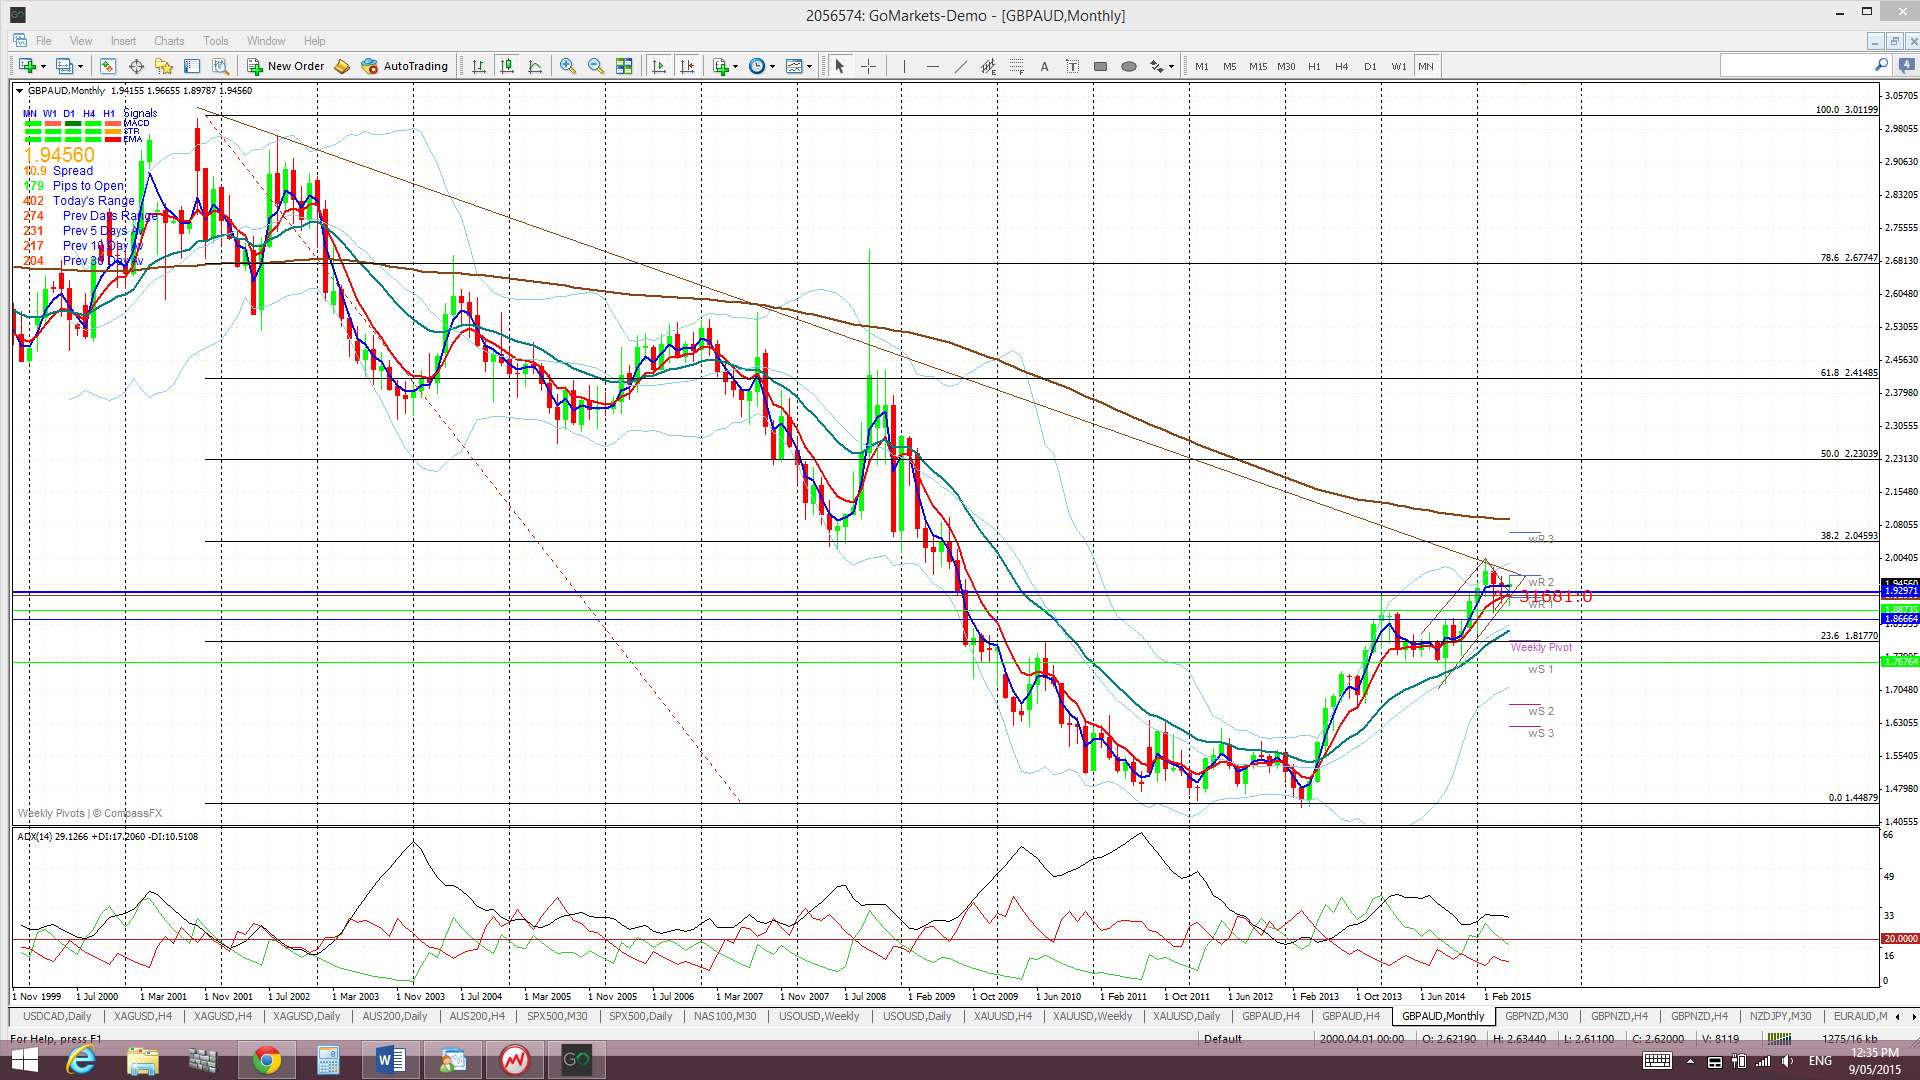
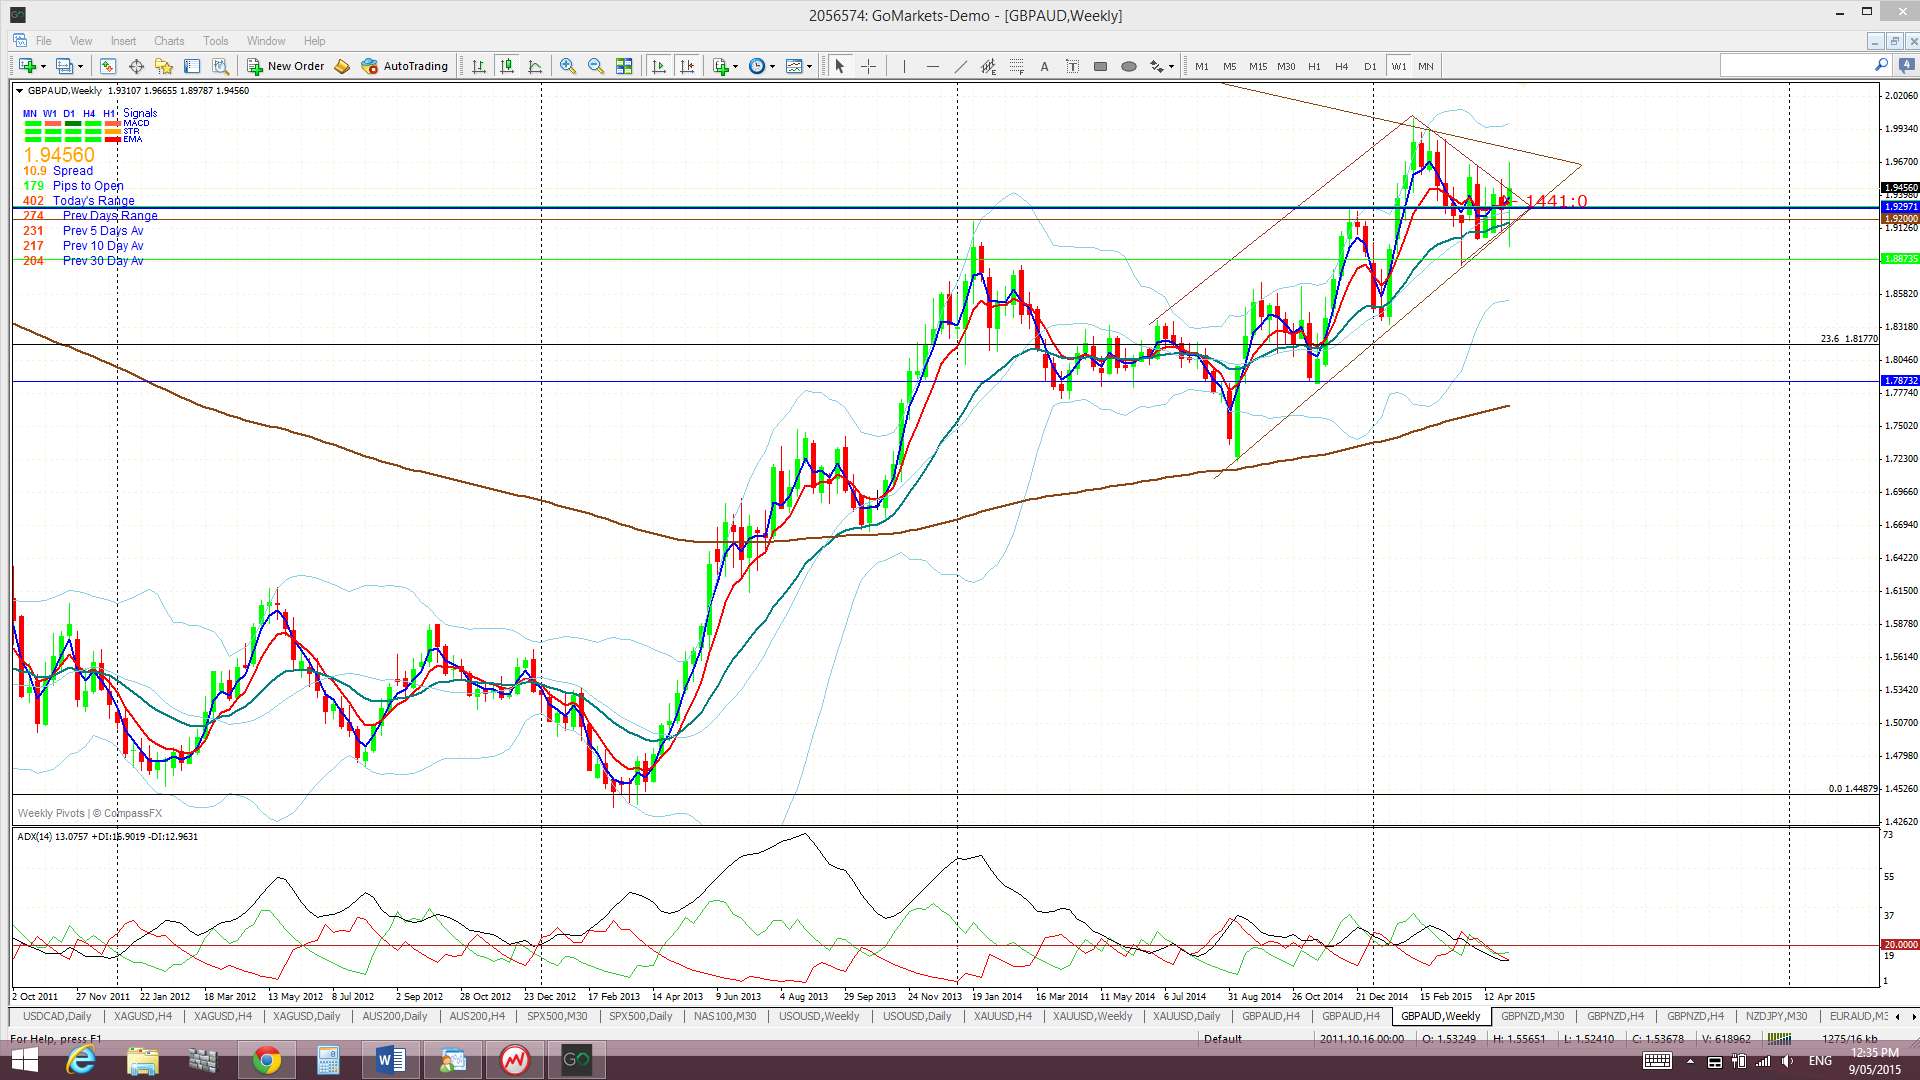
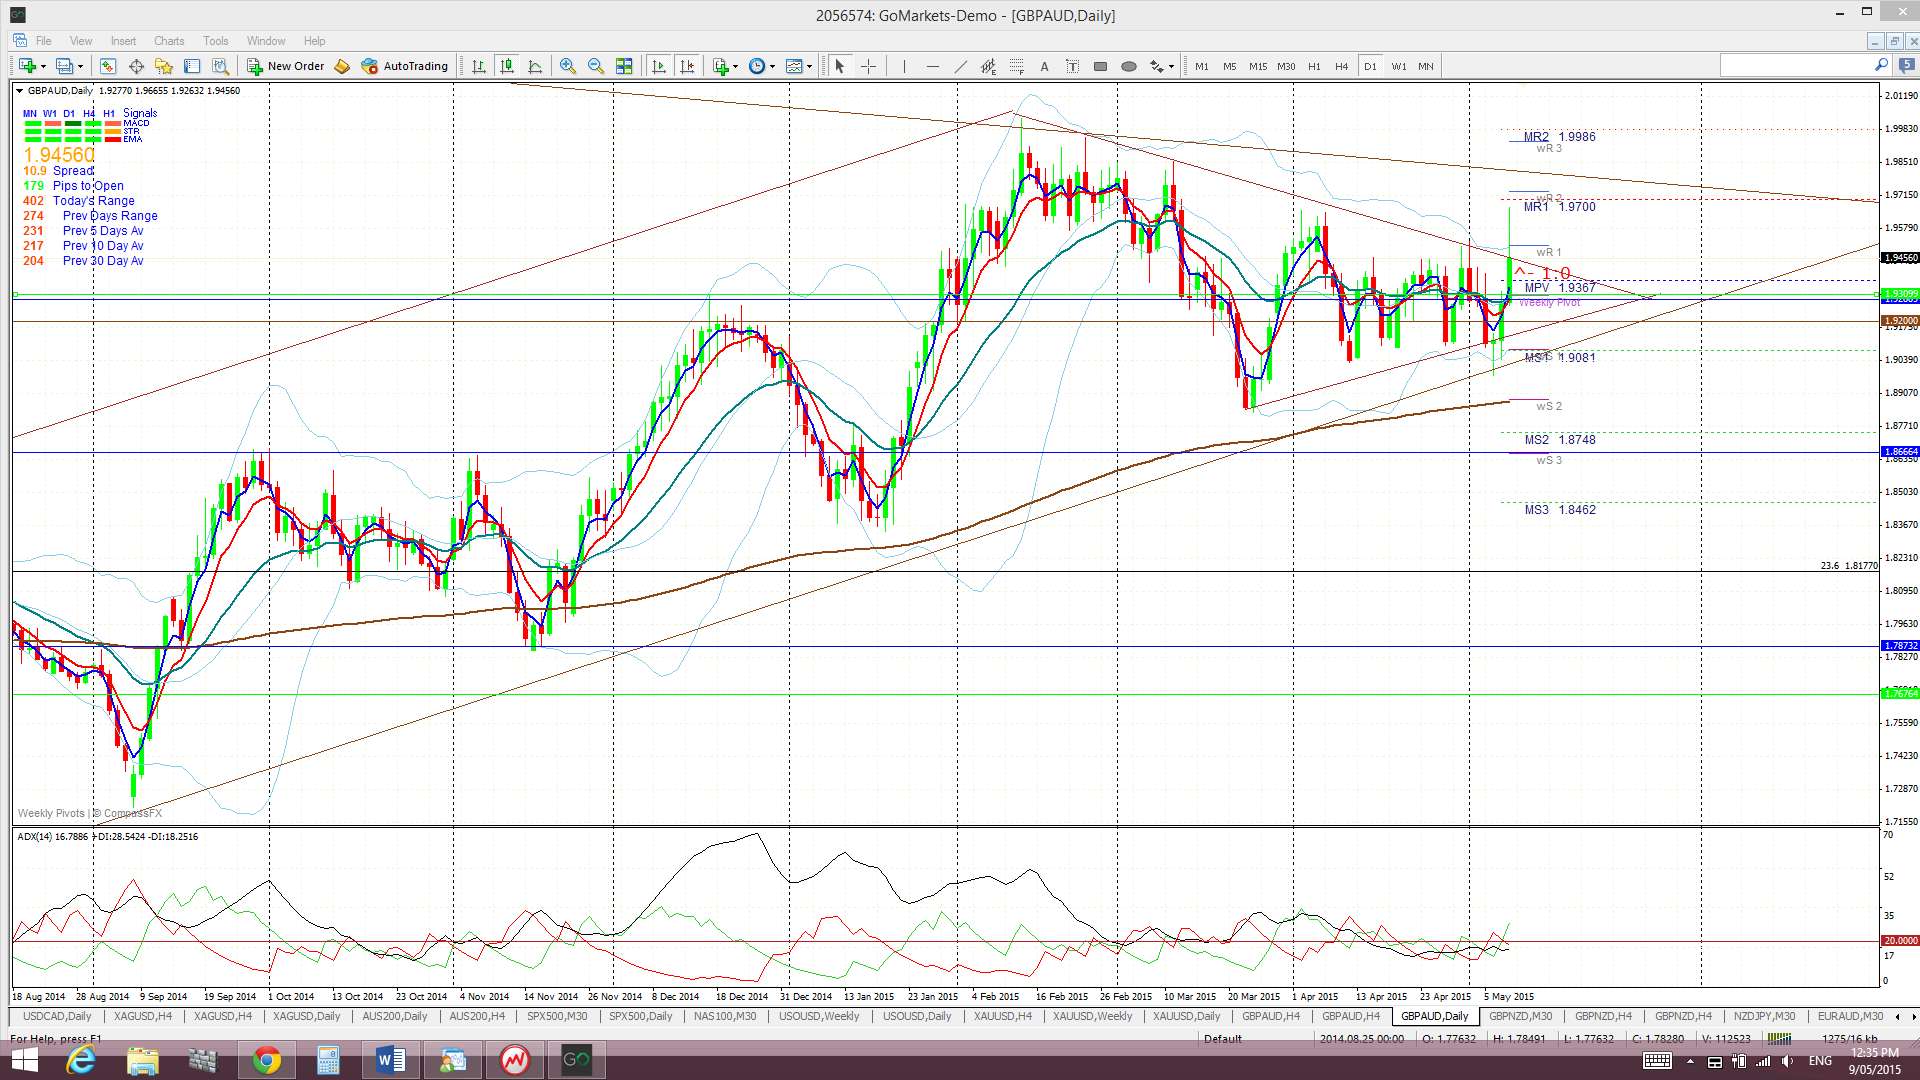
GBP/AUD: This pair rallied after the UK election and made a bullish breakout attempt from the daily chart triangle pattern and also triggered a new 4hr chart TC signal. I wrote a separate piece about this pair on Friday which can be found through the following link.
Price action pulled back later on Friday though and closed right on the top trend line of the daily chart’s symmetrical triangle. This triangle is set within an ascending trading channel on the weekly chart that is set within a triangle pattern on the monthly chart! The monthly chart’s bear triangle trend line is now only 360 Pips above current price and will be the level to watch in coming sessions. A break above this trend line would mark a significant bullish shift.
Price is trading above the Ichimoku Cloud on the 4hr, daily, weekly and monthly charts.
The weekly candle closed as a bullish coloured ‘Spinning Top’ style candle.
There is a bit of high impact data relevant for the GBP and AUD this week. See notes as per the A/U and Cable.
- There is an open TC signal here BUT I’m also watching the daily chart’s triangle trend line, and, then, monthly chart’s bear trend line.

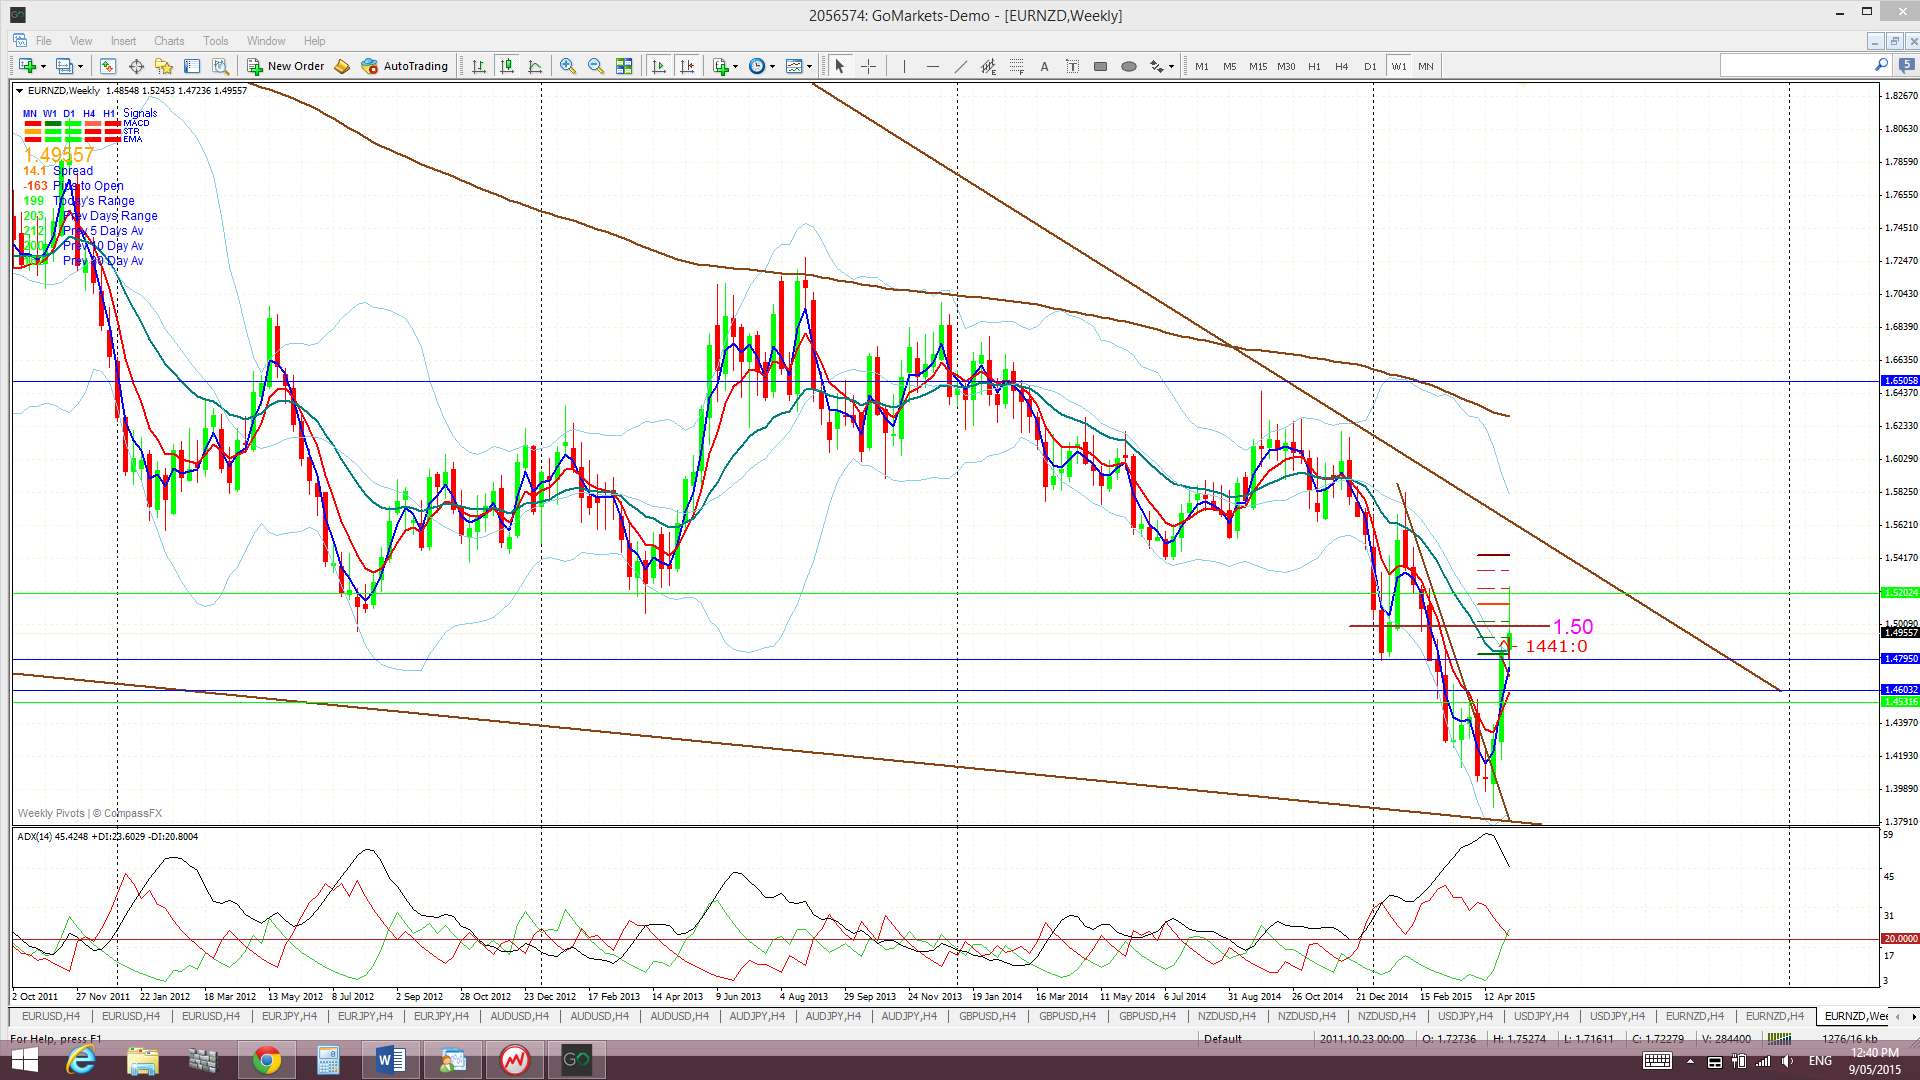
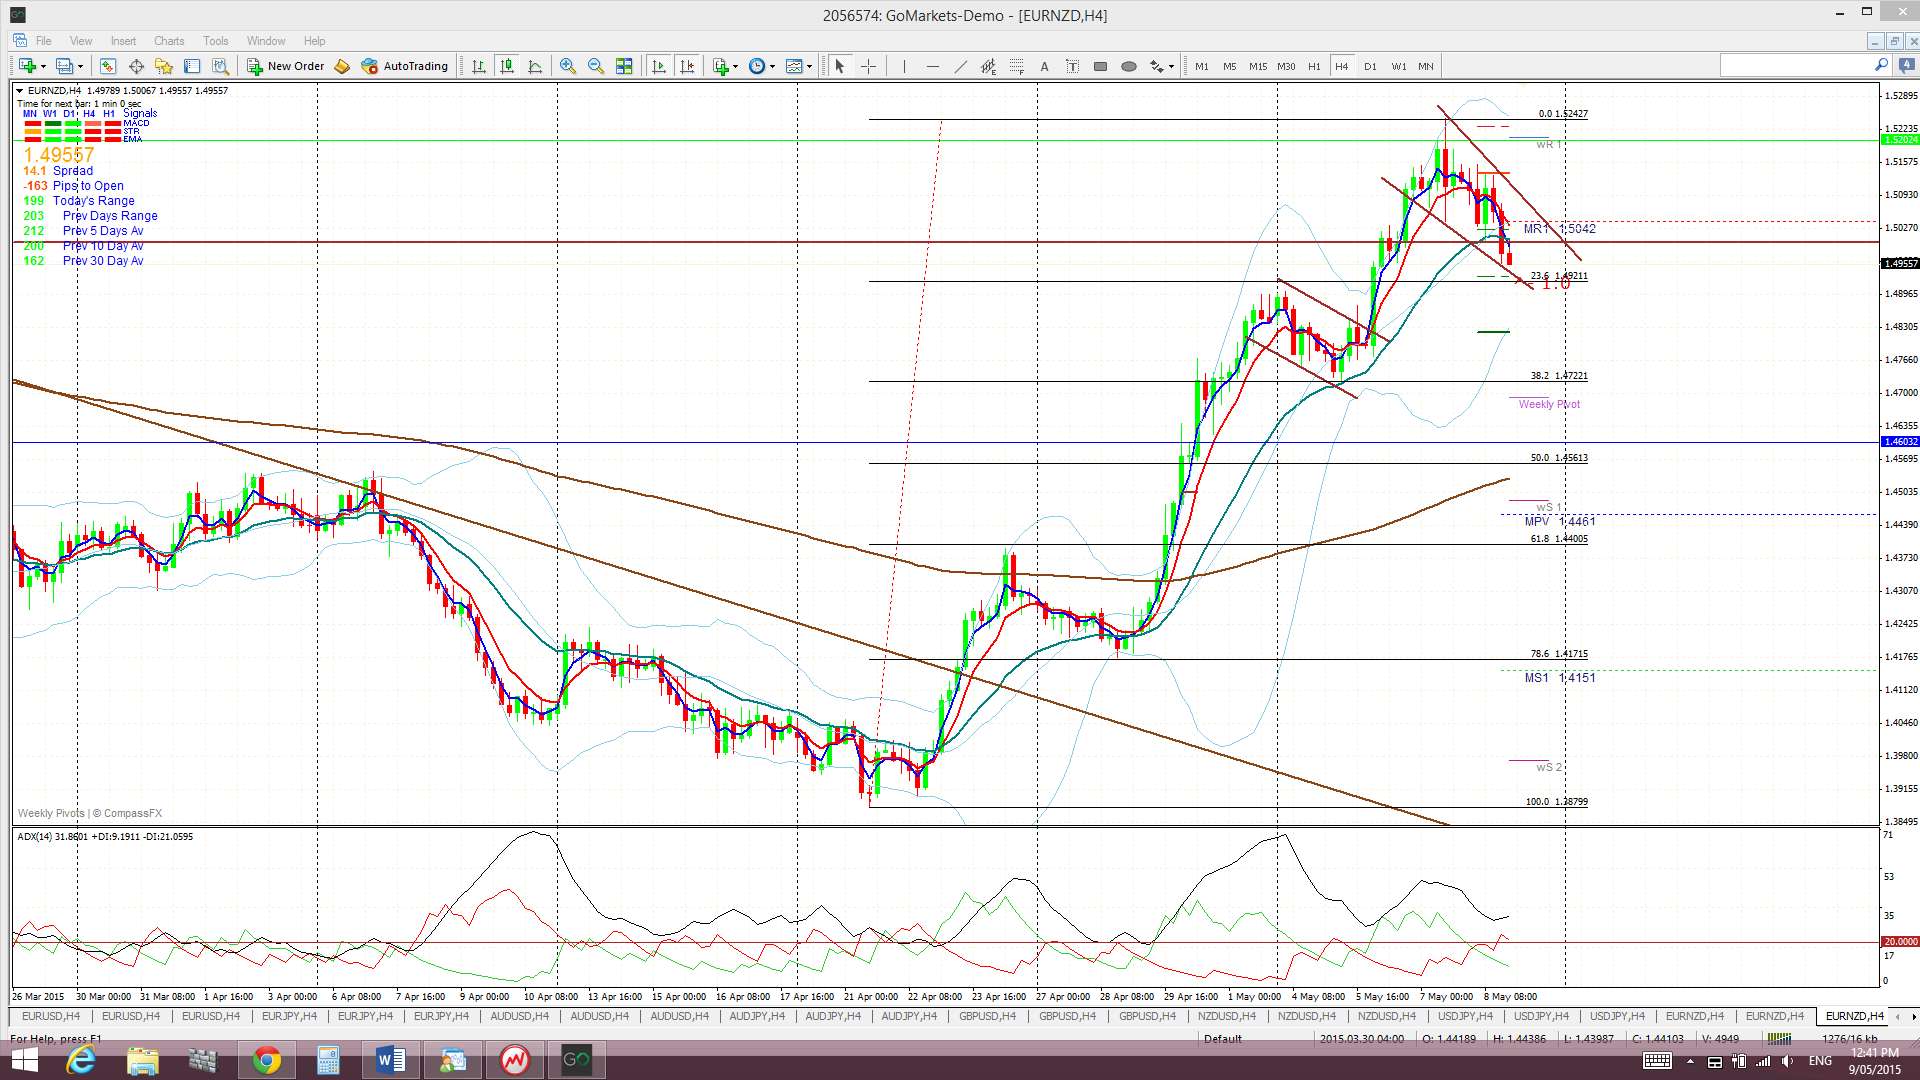
EUR/NZD: Price action consolidated in a Bull Flag to start the week and the resultant bullish breakout gave up to 360 pips before price stalled at the daily 200 EMA. This resistance will be the level to watch next week as price action consolidates again within another Flag pattern below this level.
I’m still seeing price consolidate within a monthly chart bullish descending wedge here. A break and hold above the daily 200 EMA is worth watching for as it would leave an open pathway for price to move up to test the monthly chart’s upper wedge trend line, a distance of over 600 pips!
A bit more of a pullback down to the 50% fib and 4hr 200 EMA would not be out of order here though, even as part of an overall bullish continuation move, so traders need to watch the Flag trend lines.
Price is now trading above the 4hr & daily Clouds but below the weekly and monthly Clouds.
The weekly candle closed as a bullish candle.
There is a lot of EUR and NZD sensitive news to impact here in the coming week. See notes as per the EUR/USD and NZD/USD.
- I’m watching for any new TC signal, the 4hr chart Flag trend lines and the daily 200 EMA.

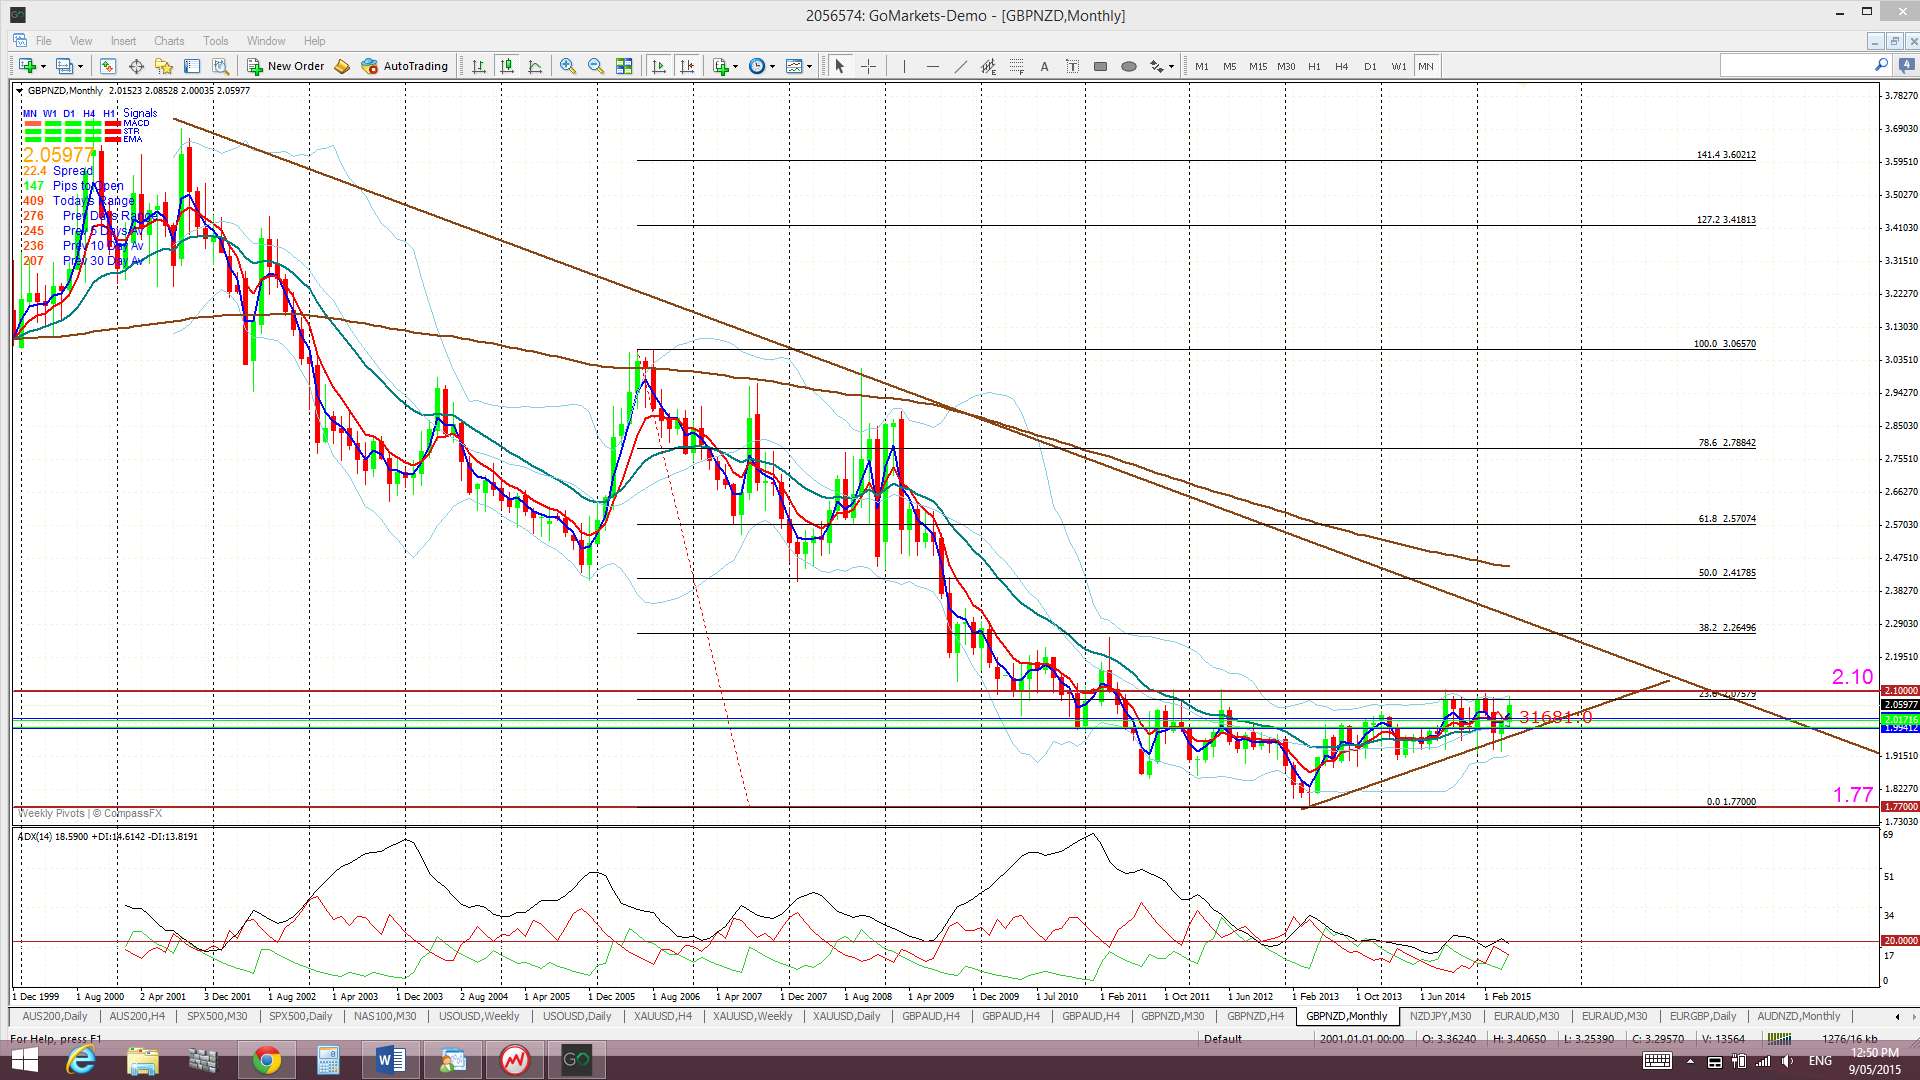
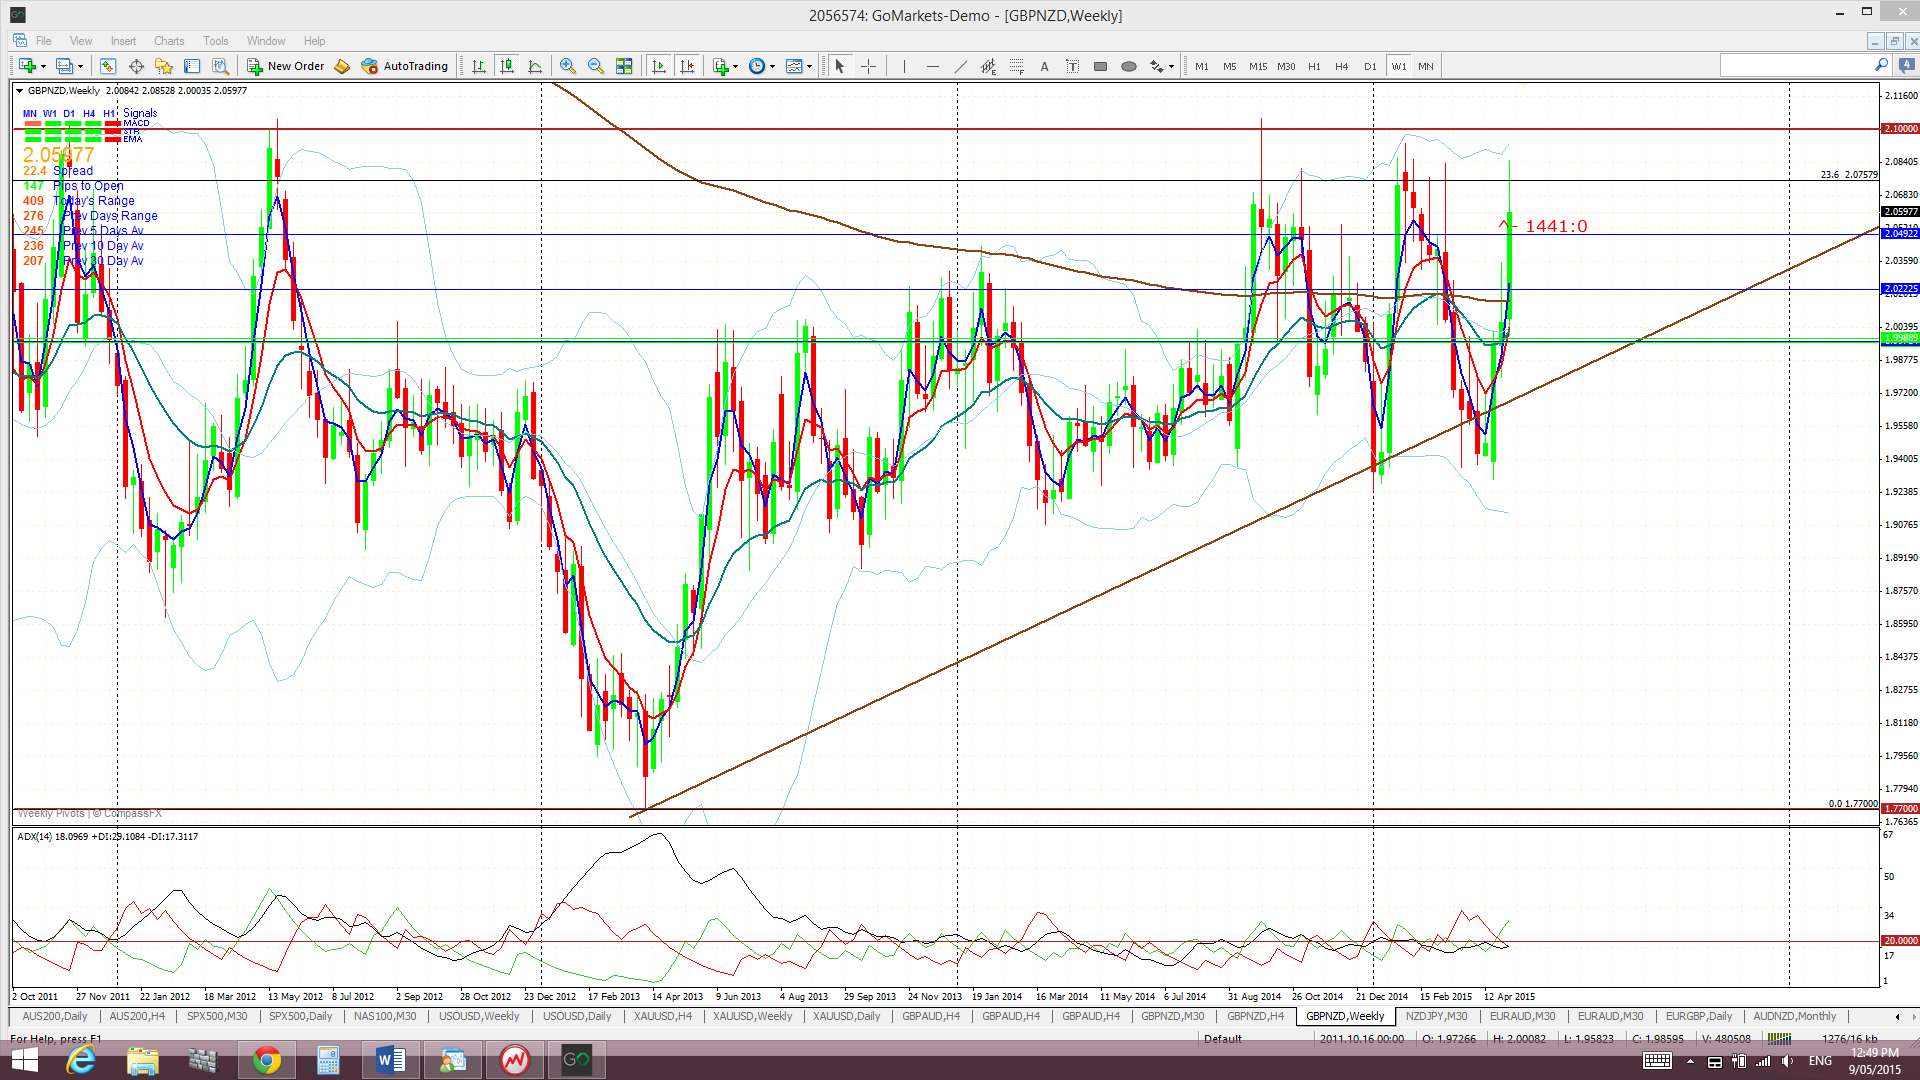
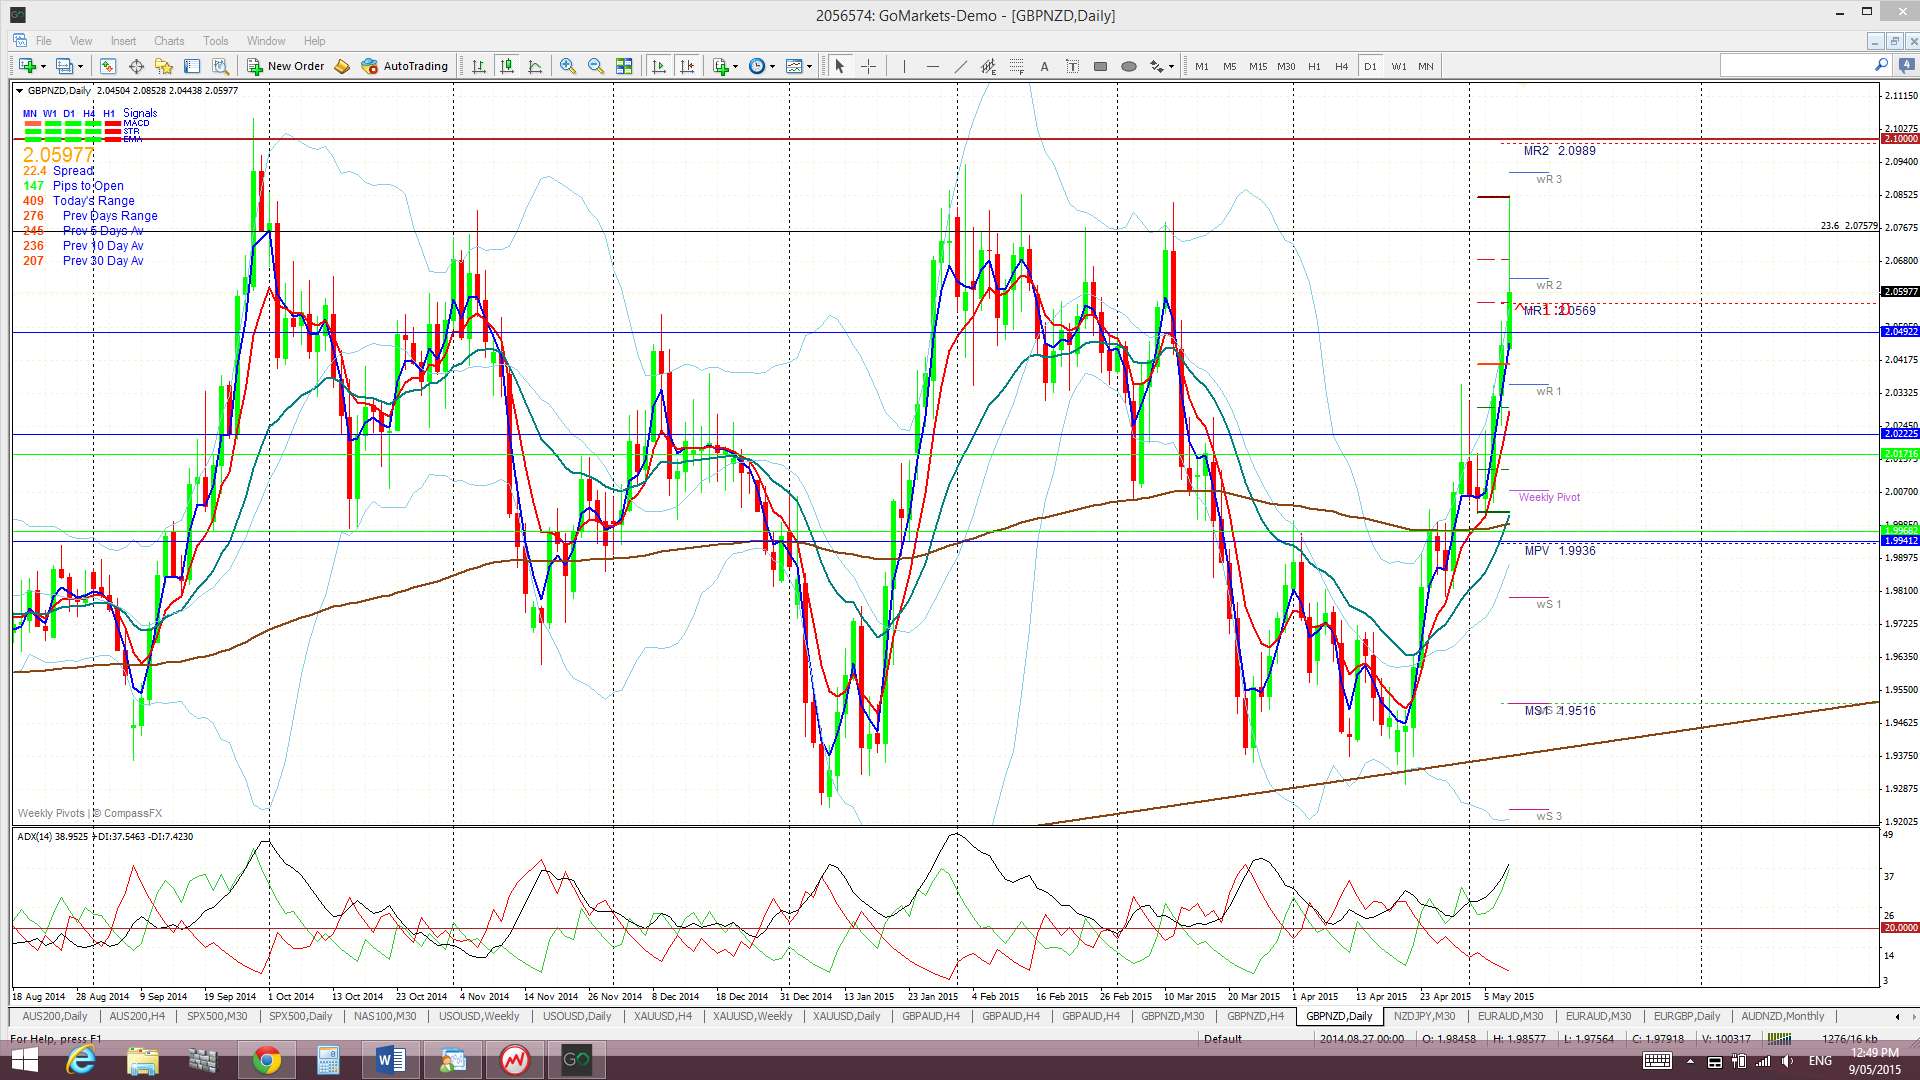
GBP/NZD: This pair rallied after the UK election and I also wrote a separate piece about this pair on Friday which can be found through the following link. My main focus here is to watch how this pair reacts around the key 2.10 level.
The monthly chart still shows this pair in a down trend and trading under a bear trend line. However, price has bounced up off the 1.77 level and looks to be carving out a recovery from this base. This chart also shows the 2.10 level as a clear-cut longer term S/R level and this is giving the monthly and weekly charts a bit of an ascending triangle appearance with price now only about 400 Pips below this resistance.
The GBP/NZD is now trading above the Cloud on the 4hr, daily and weekly chart but is in the bottom of the Cloud on the monthly chart.
The weekly candle closed as large bullish candle.
There is a bit of GBP and NZD sensitive news to impact here in the coming week. See notes as per the Cable and NZD/USD.
- I’m watching for any new TC signal and the 2.10 level.

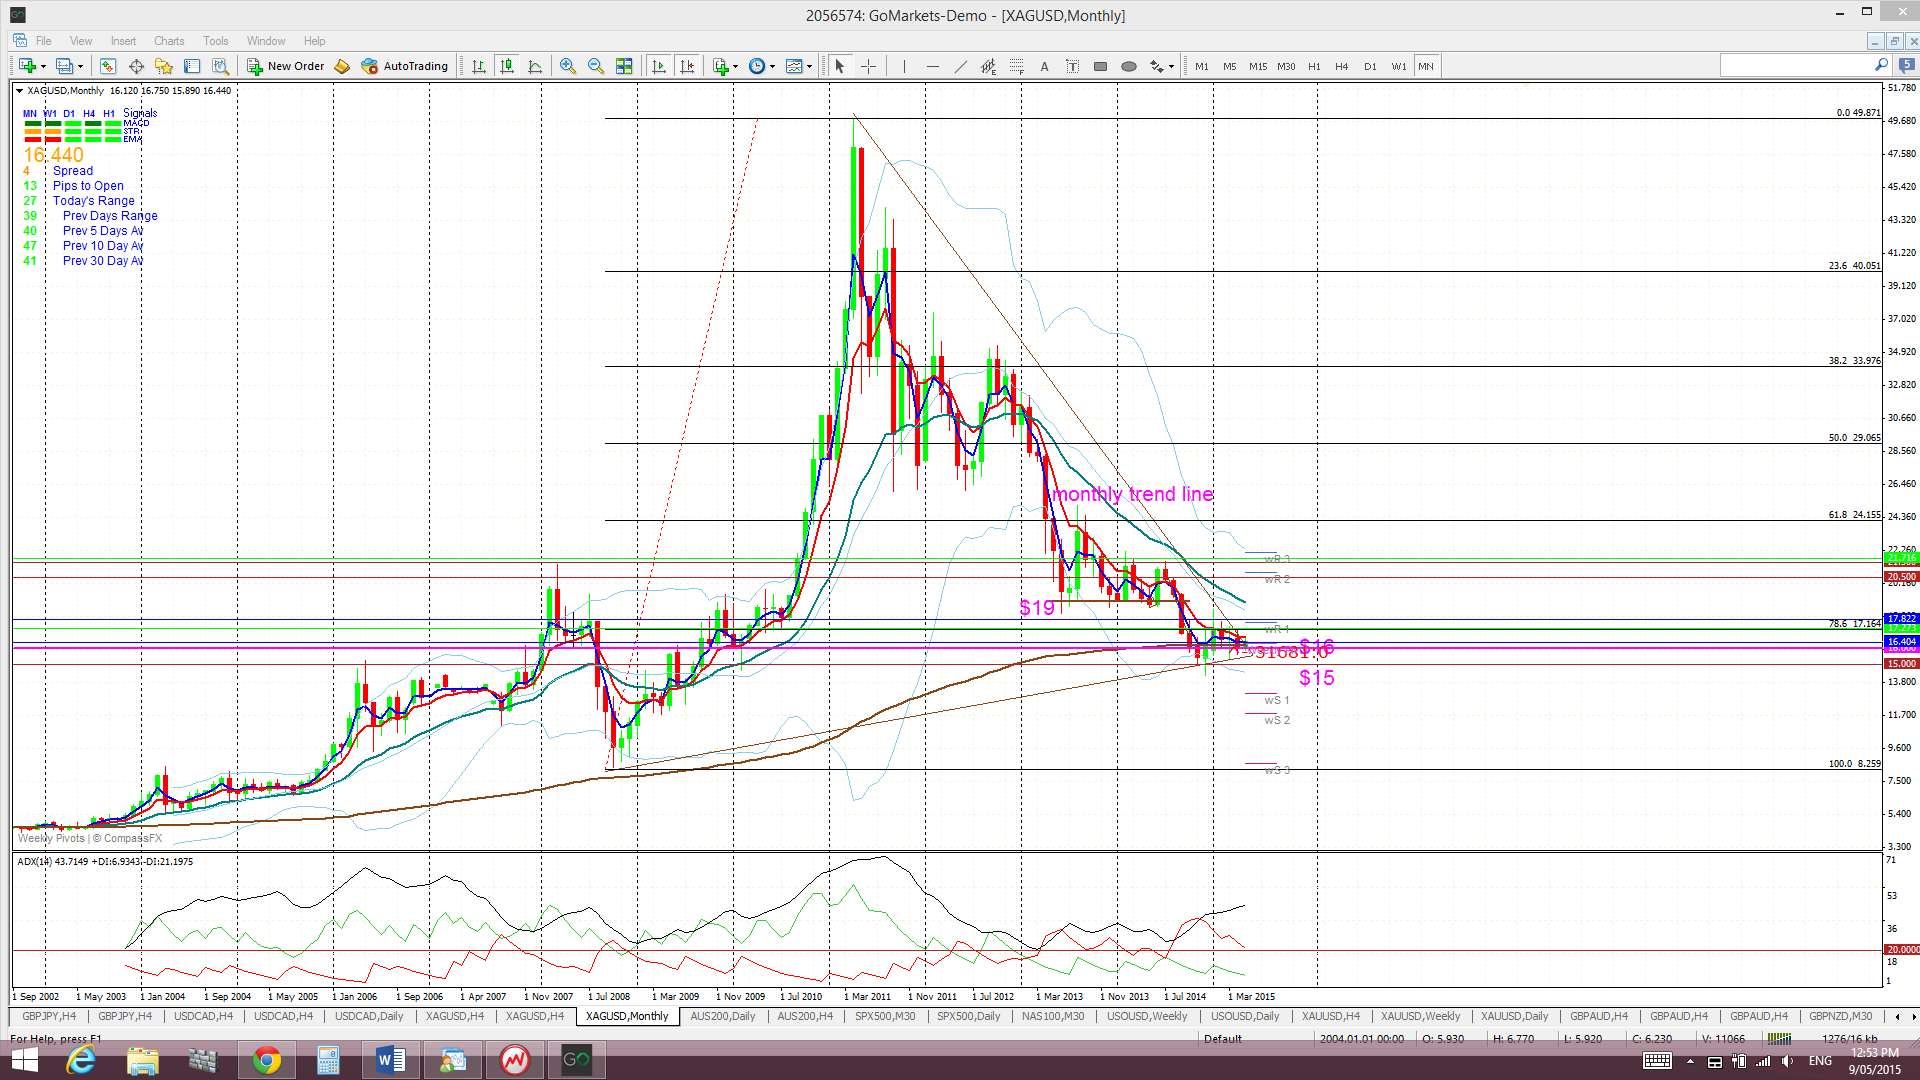
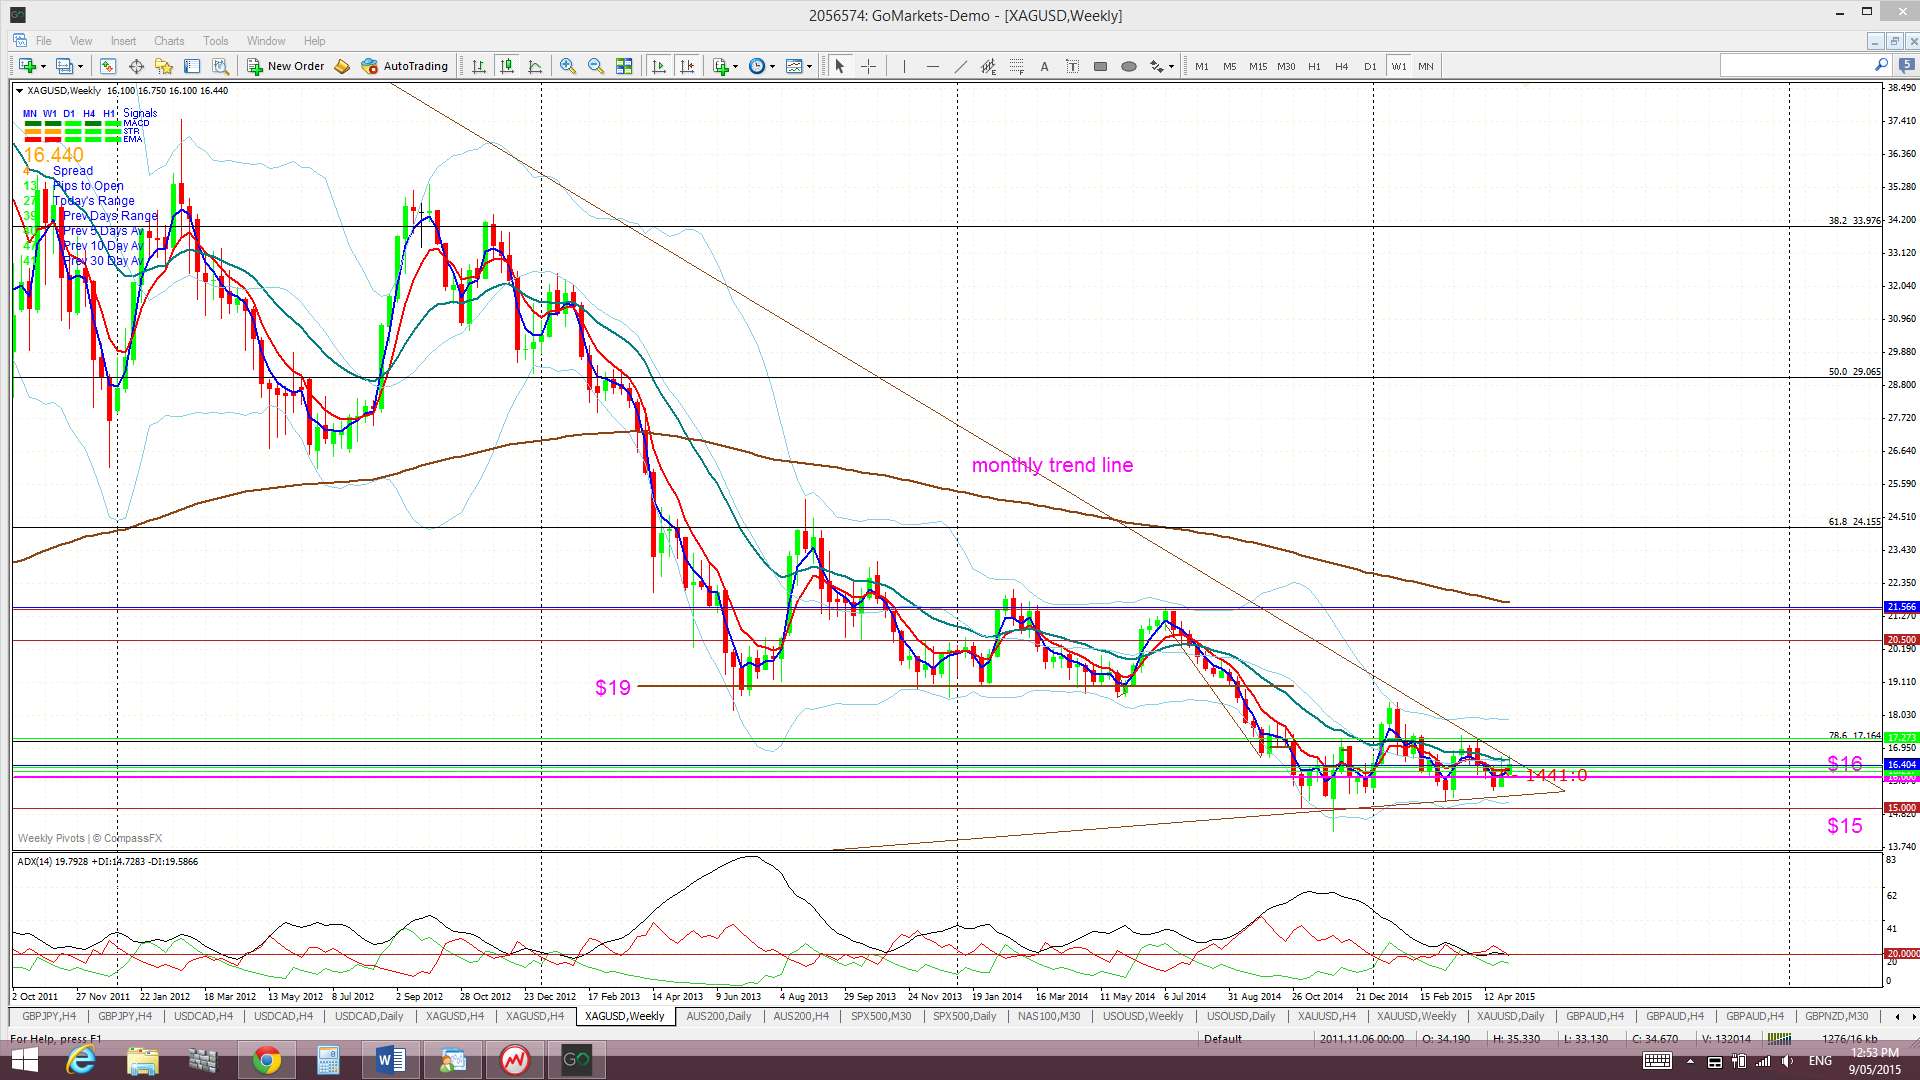
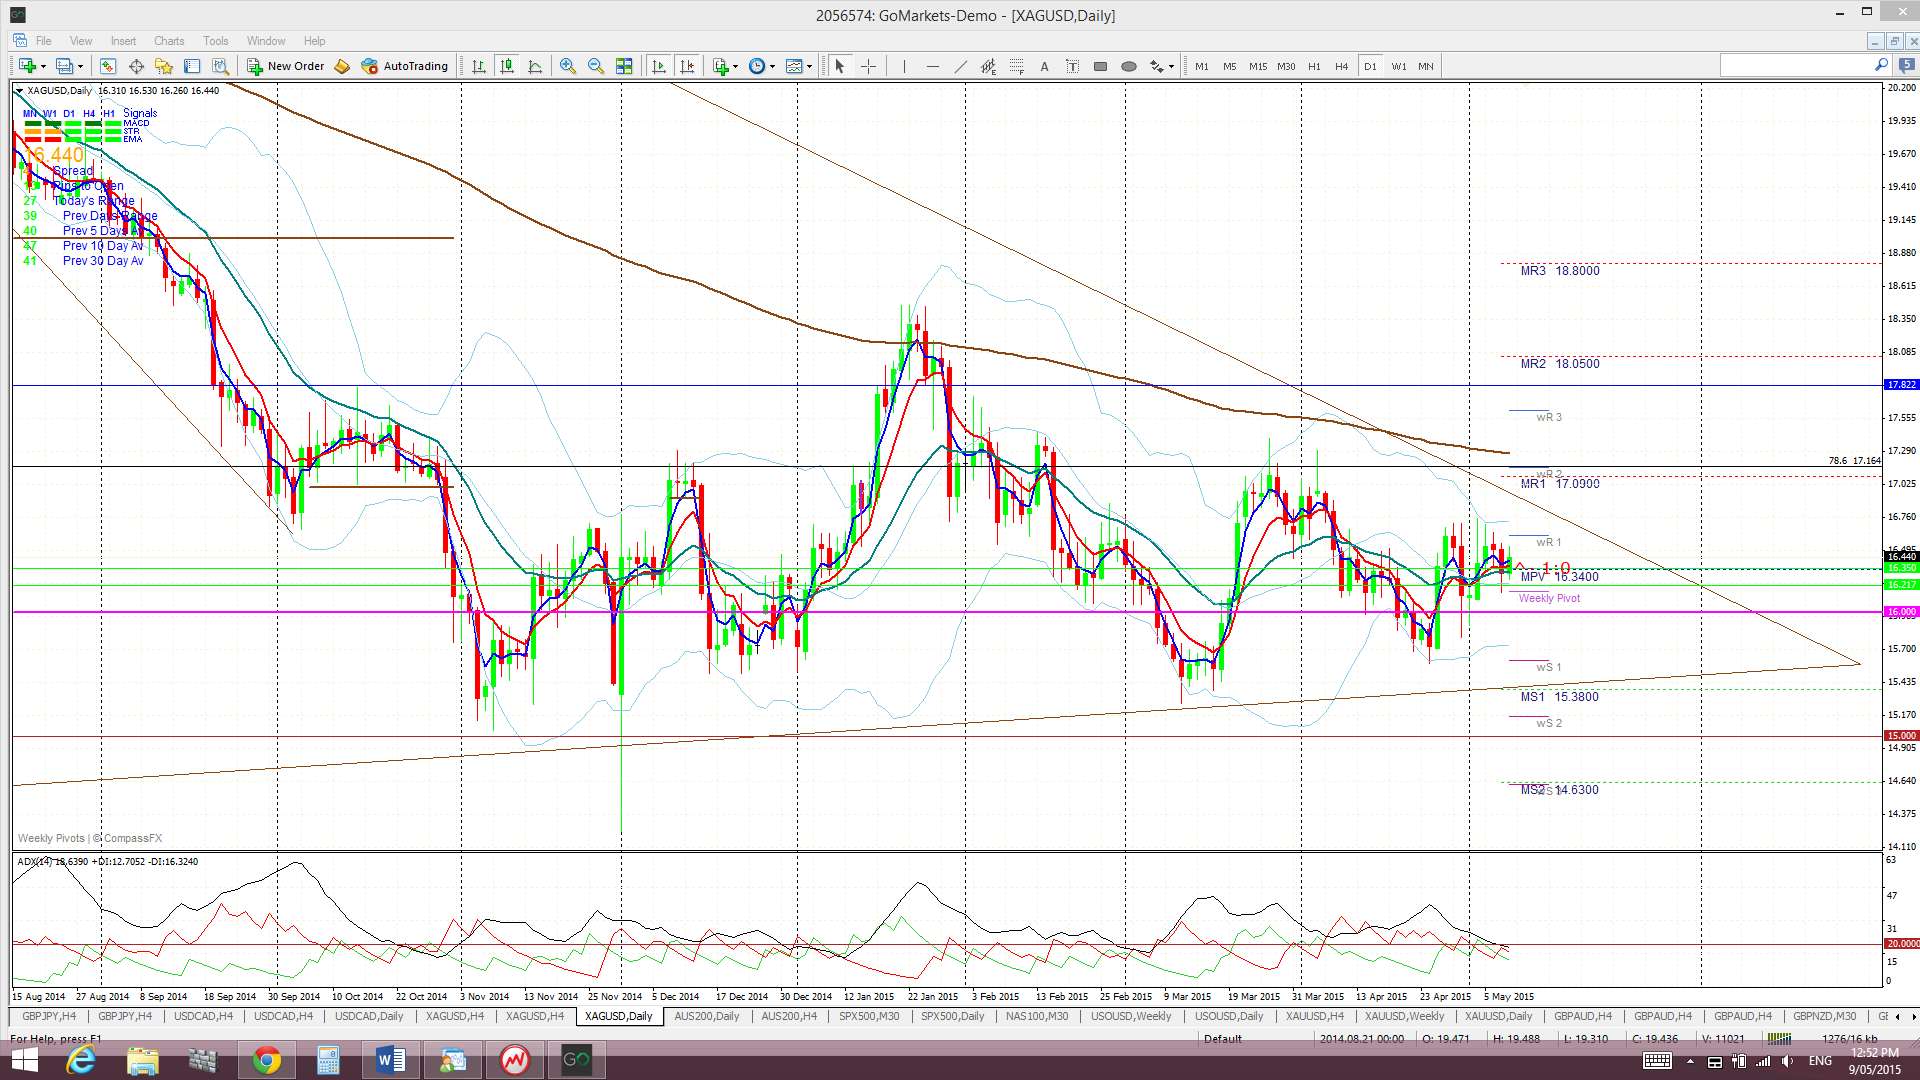
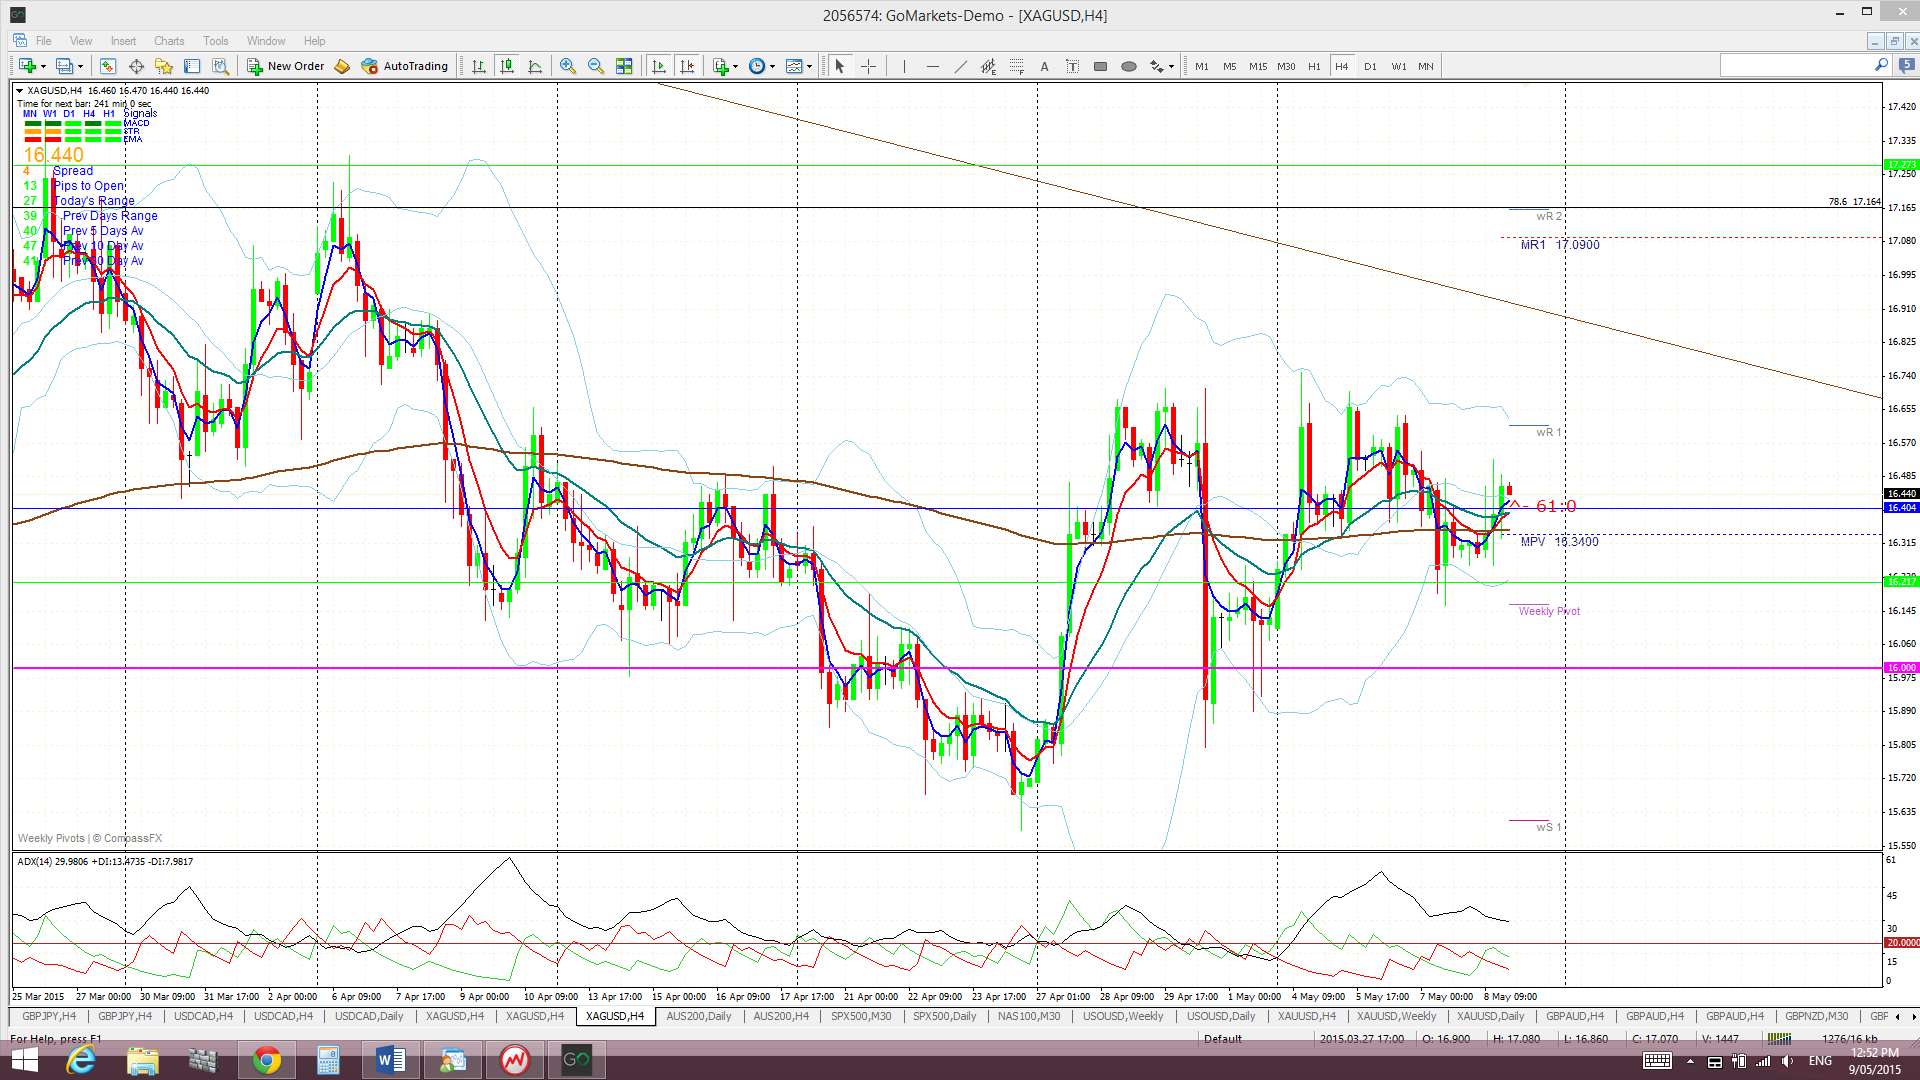
Silver: Silver chopped sideways for all of last week above $16 support. I’m still more focused on the monthly chart’s triangle trend lines and how price action is trading towards the apex of this triangle. I believe the next major move with the US$ may determine how Silver moves from this support:
- a weakening US$ may trigger a bullish triangle breakout but
- a strengthening US$ may trigger a breakdown for Silver and, if so, the 2000 lows near $8 would be a likely target.
Silver is trading above the Ichimoku Cloud on the 4hr chart but below the Cloud on the daily, weekly and monthly charts.
The weekly candle closed as a small bullish candle.
- I’m watching for any new TC signal, the $16 and $15 levels and the monthly chart’s triangle pattern.
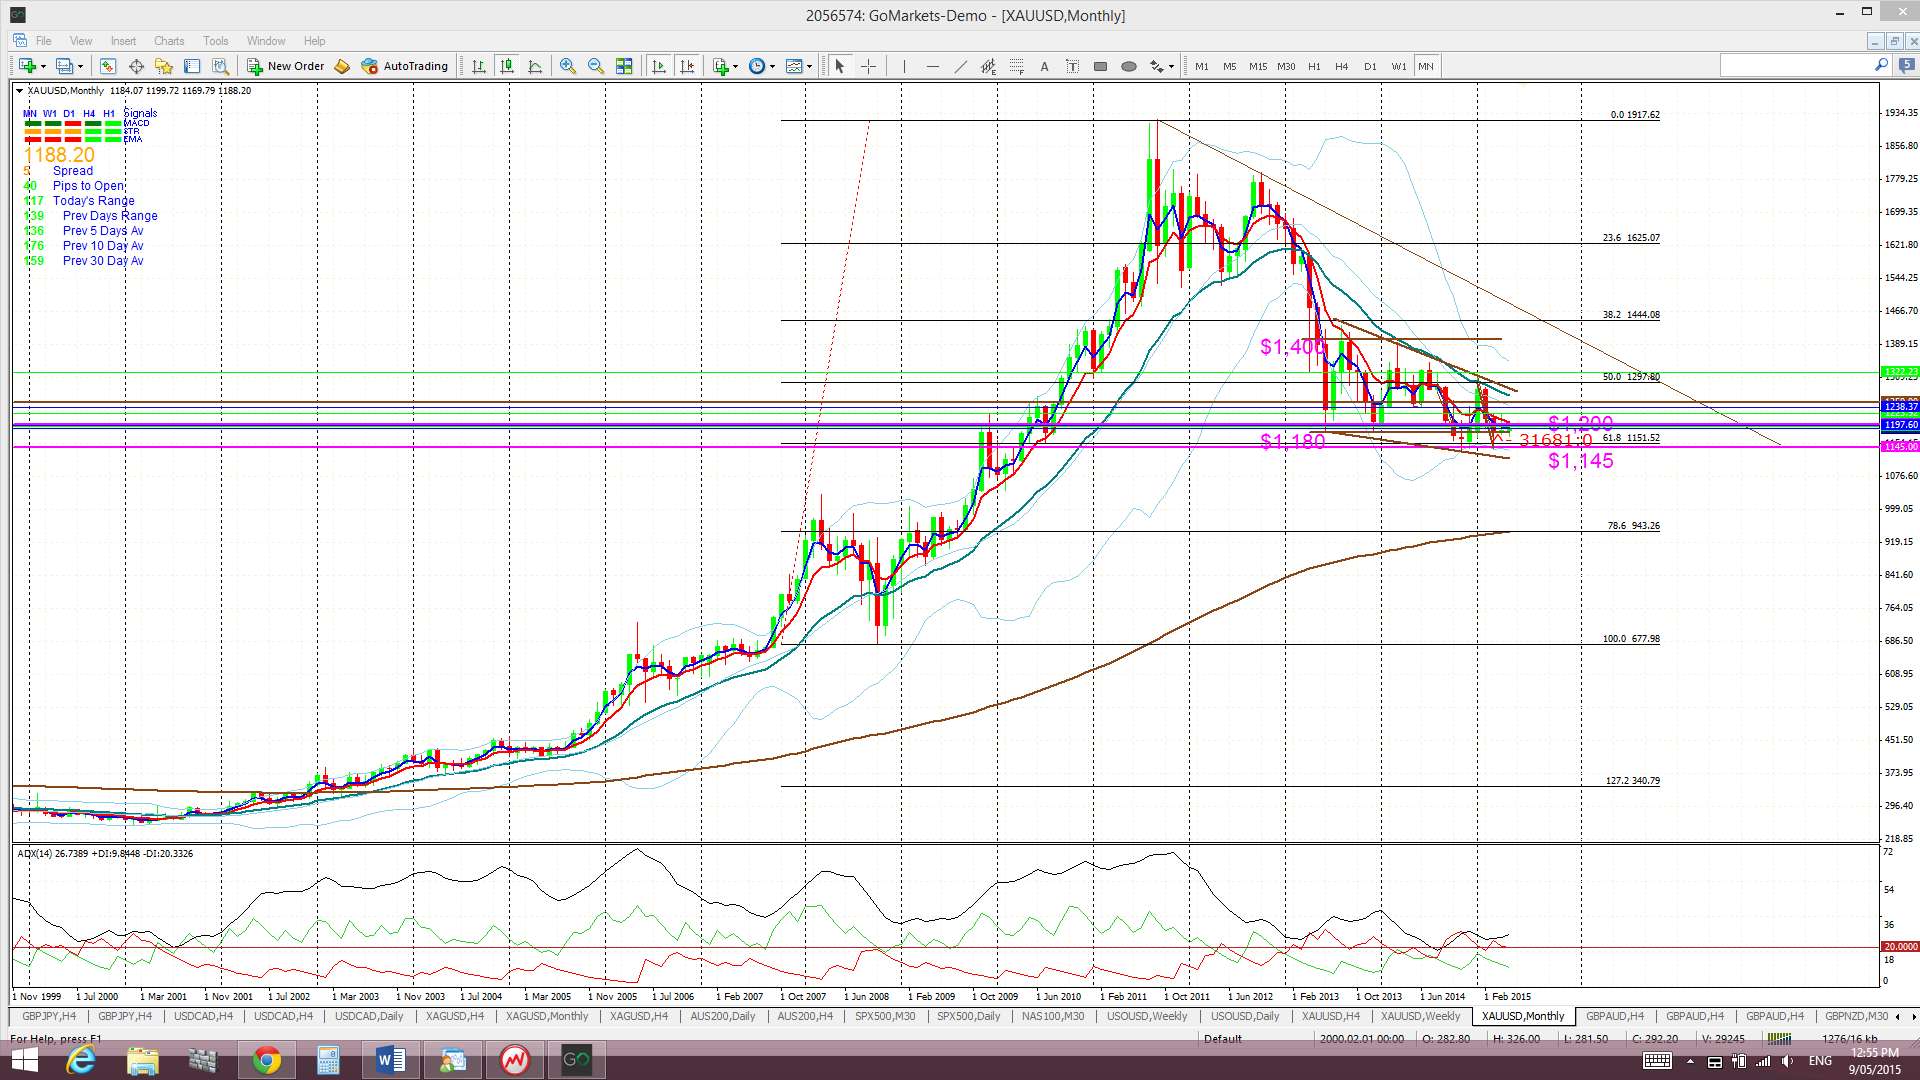
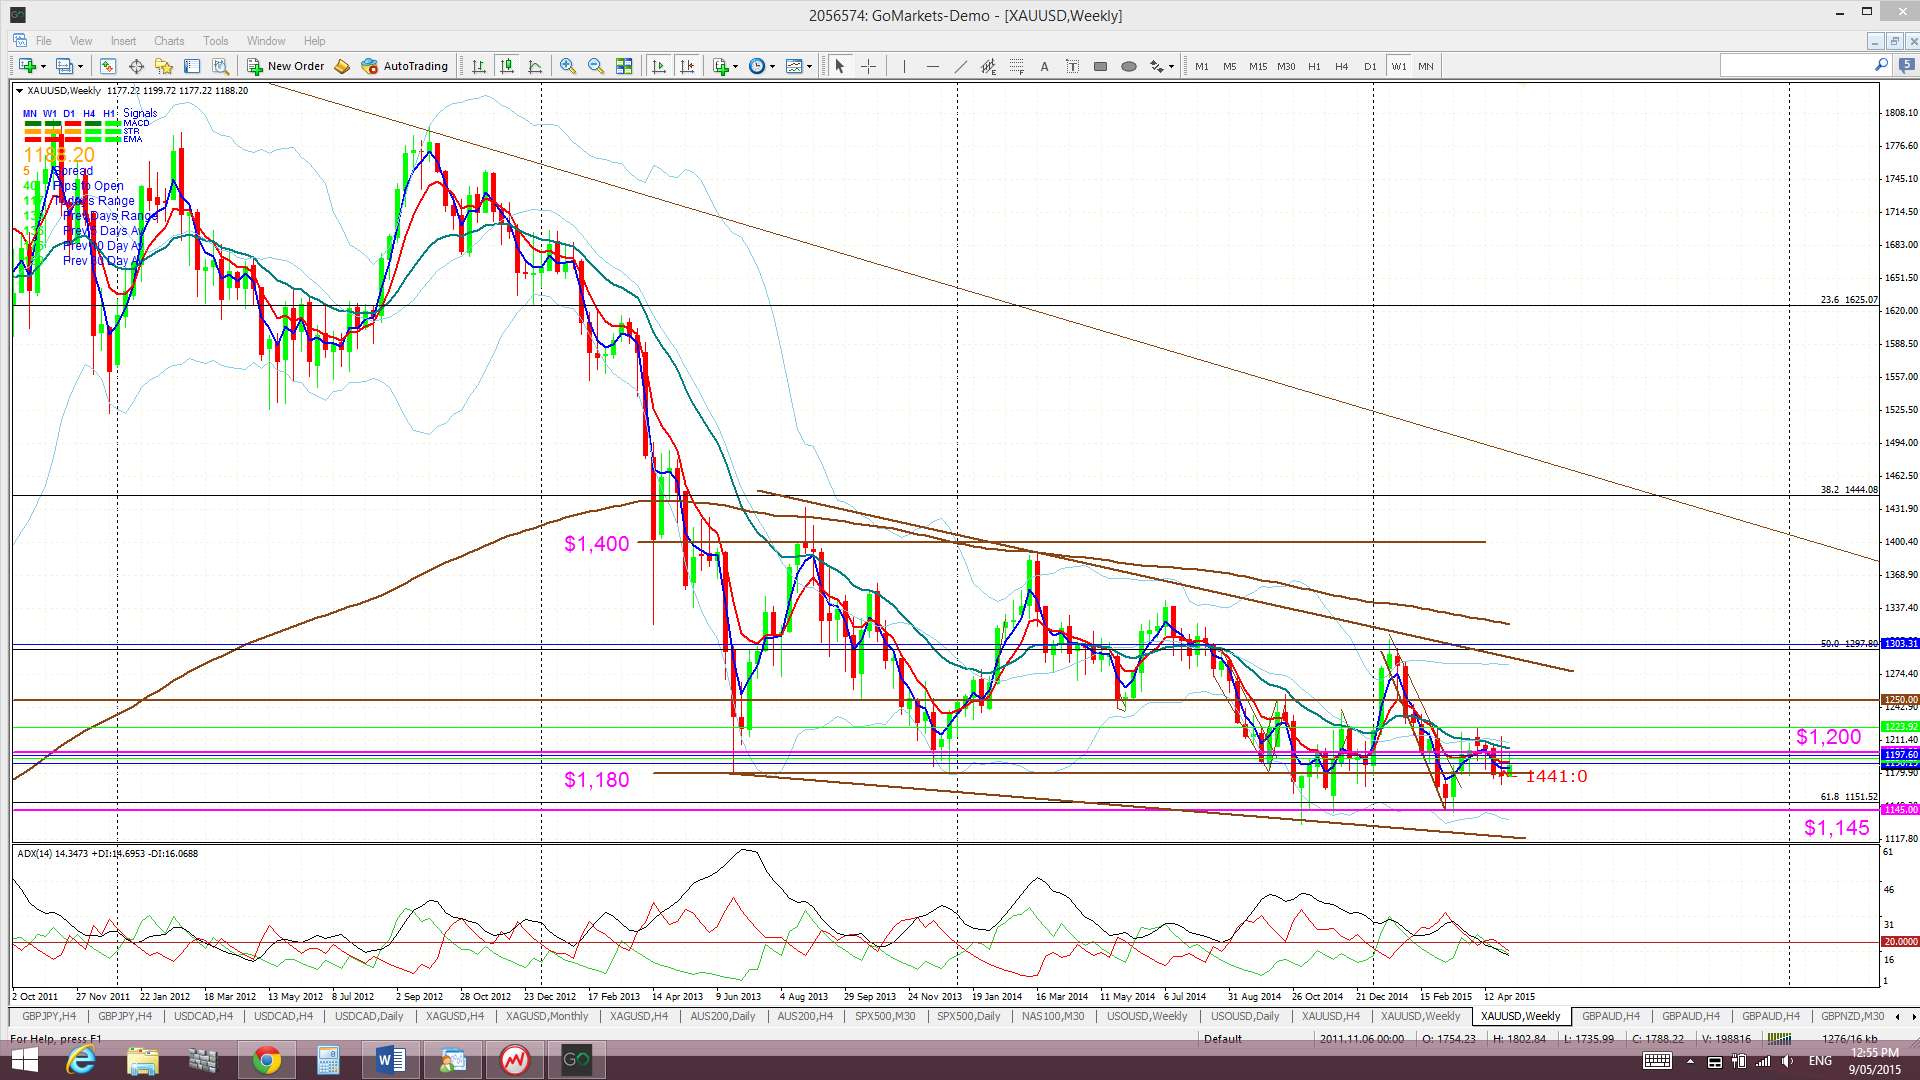
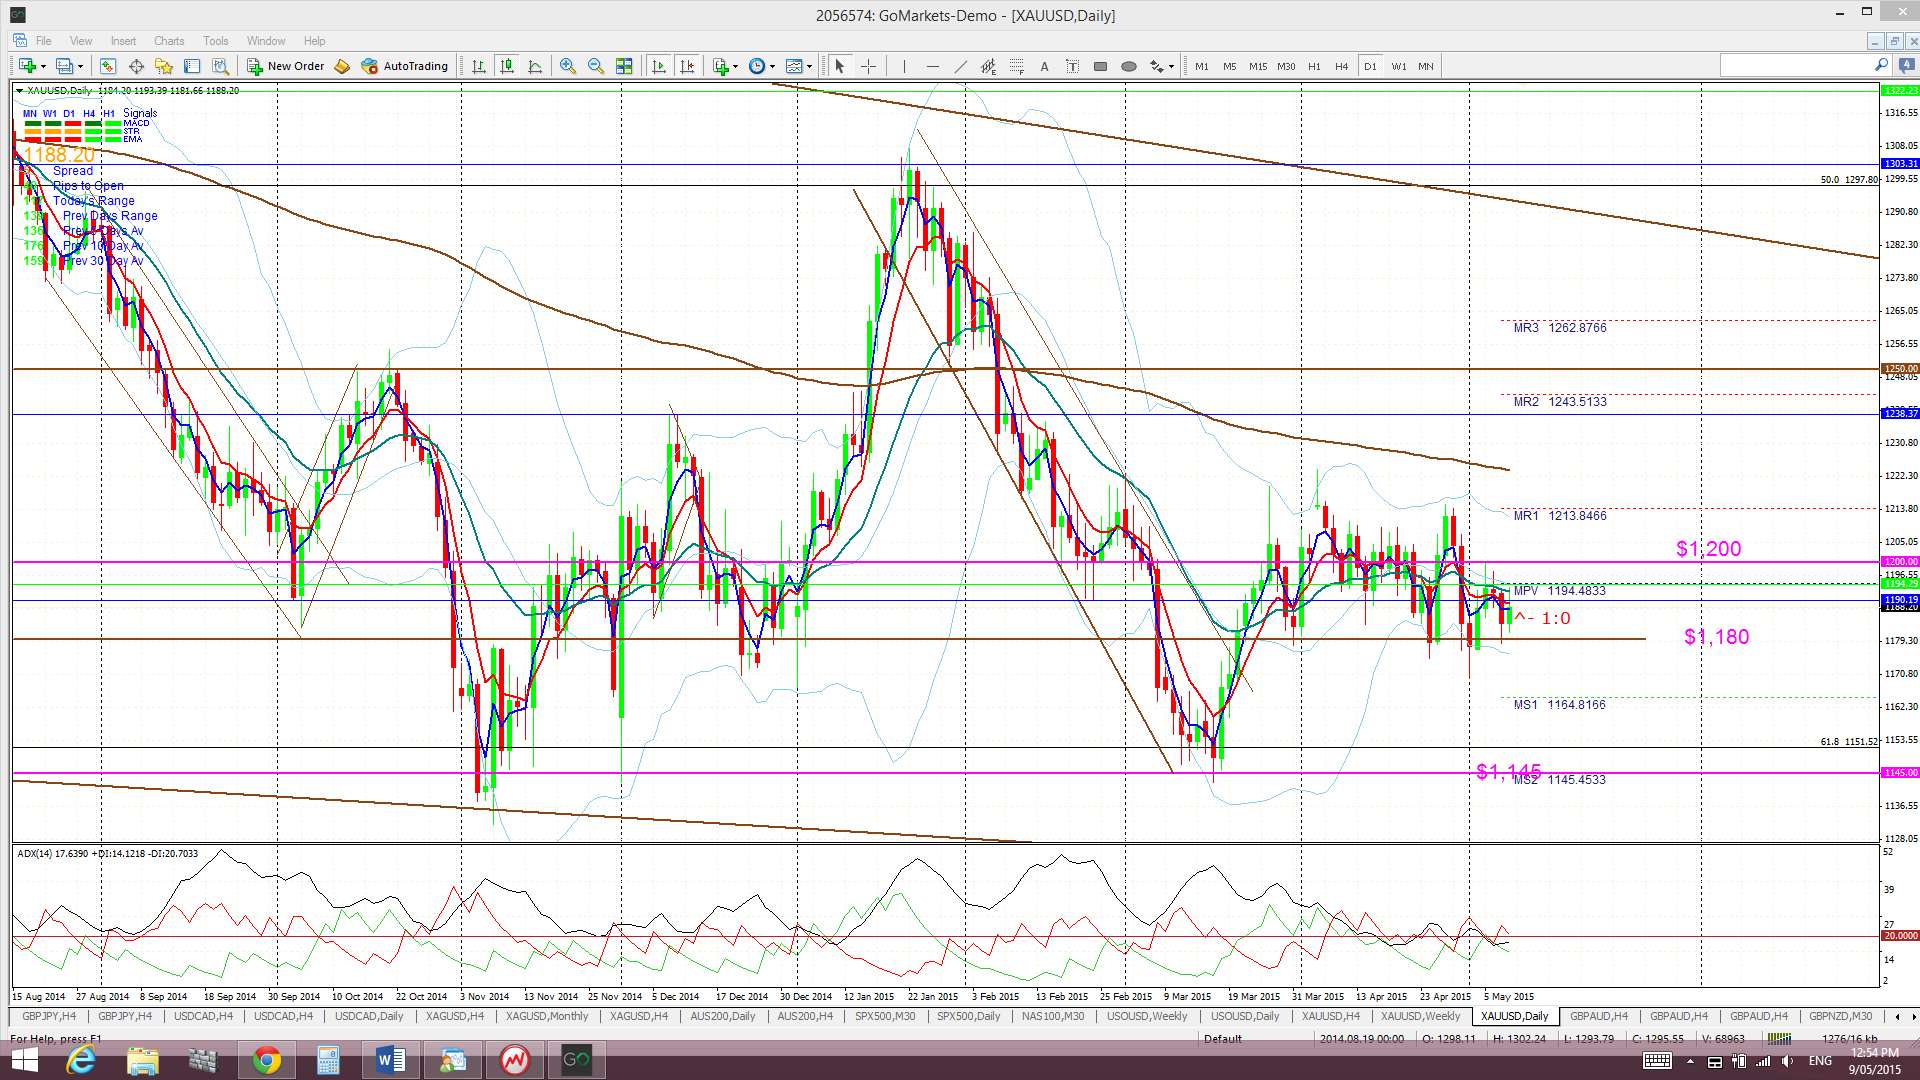
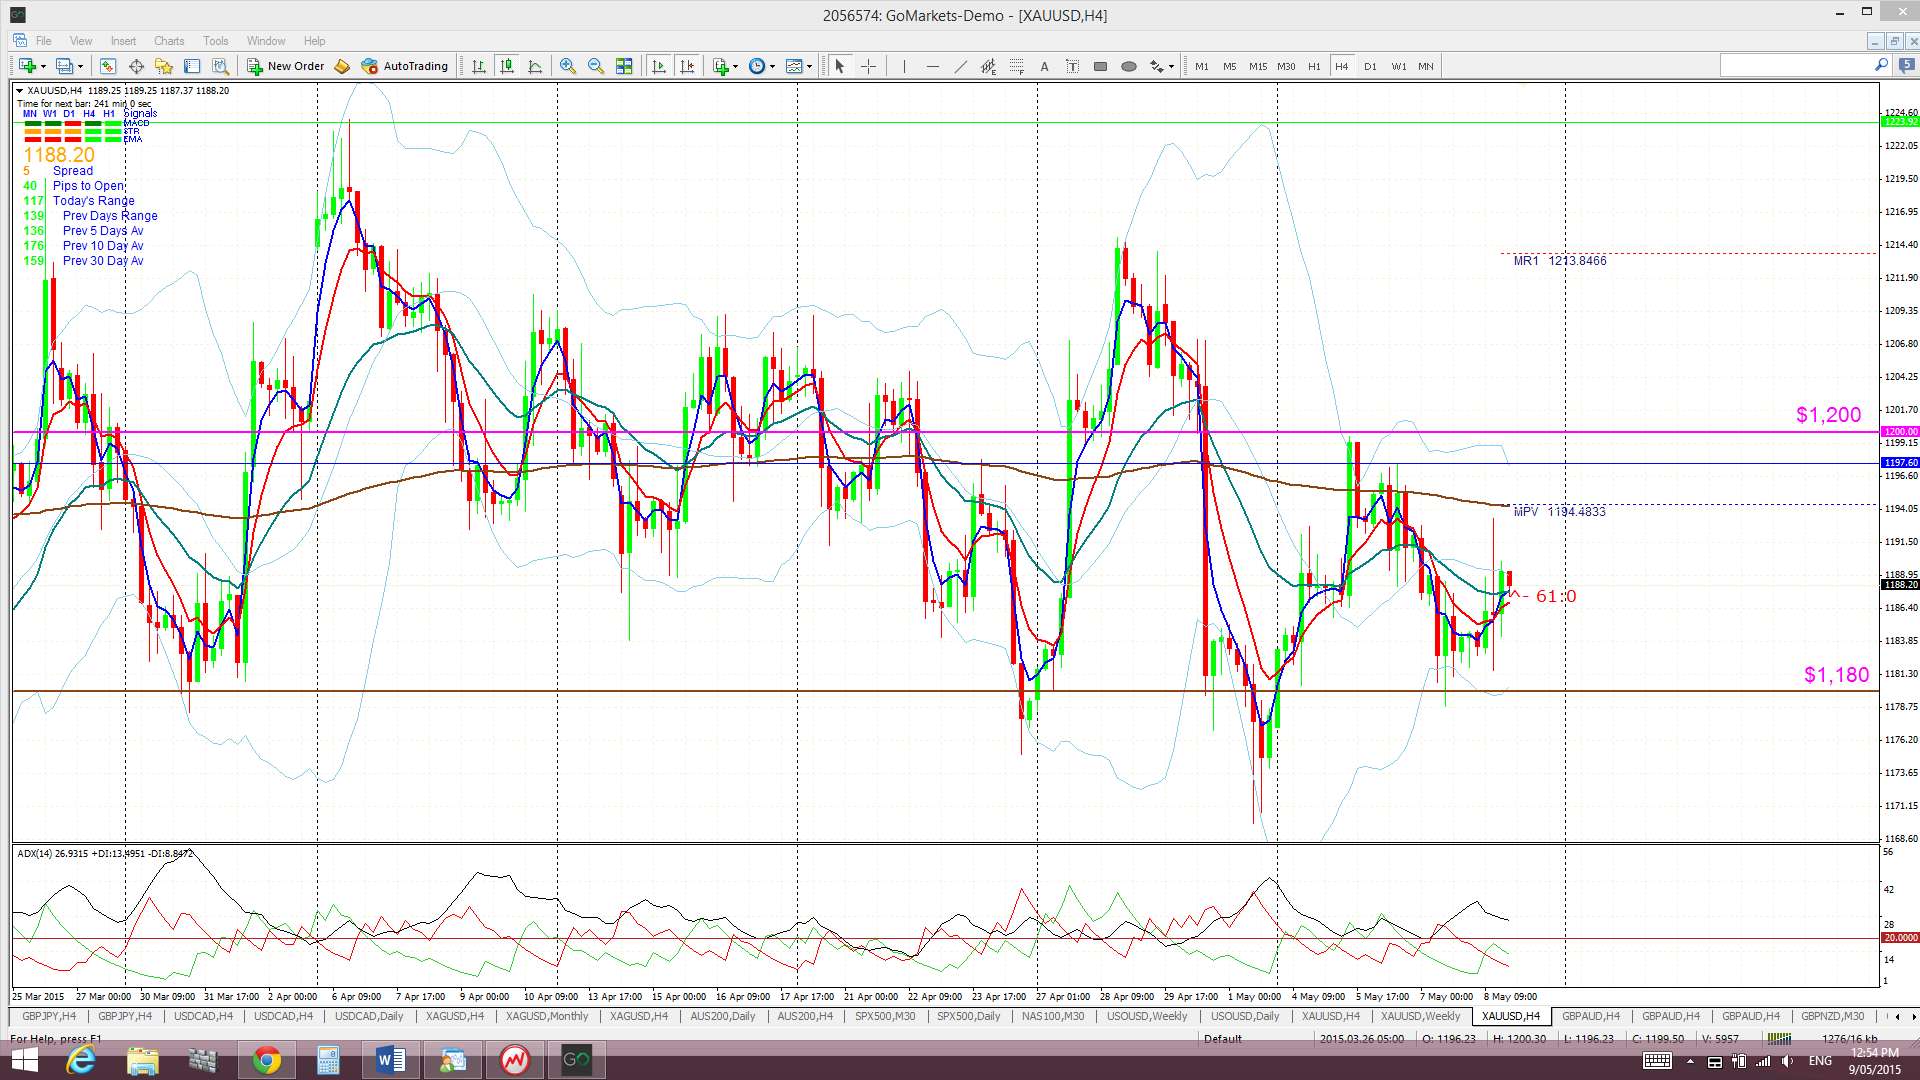
Gold: Gold chopped around between the key $1,200 and $1,180 S/R levels for most of last week.
Gold does continue to hold above the 61.8% Fib retracement of the 2008-2011 bull run that is near $1,145. The daily, weekly and monthly charts show that Gold is really just chopping sideways above this 61.8% fib support and seems to be biding its time whilst waiting for the next major move with the US$.
Any renewed US$ strength and new break and hold below $1,145 would suggest a pull back here. Bearish targets below $1,145 include the $1,000 psychological level and, then, the 78.6% fib near $950.
Gold is trading in the Cloud on the 4hr chart but below the Ichimoku Cloud on the daily, weekly and monthly charts.
The weekly candle closed as a small bullish candle.
- I’m watching for any new TC signal, the triangle trend lines and the $1,200 and $1,180 levels.
The post US$ lower but Stocks cheer recent data. appeared first on www.forextell.com.