The US$ has continued to recover after bouncing off strong support earlier in the week. The FX index charts have recently been aligned on the Ichimoku charts for a weak US$ and strong EUR but that alignment is now coming under pressure. ‘So what’ you say? An understanding of the FX index charts often helps to better understand movement across many of the currency pairs and so, IMHO, they’re worth keeping an eye on!
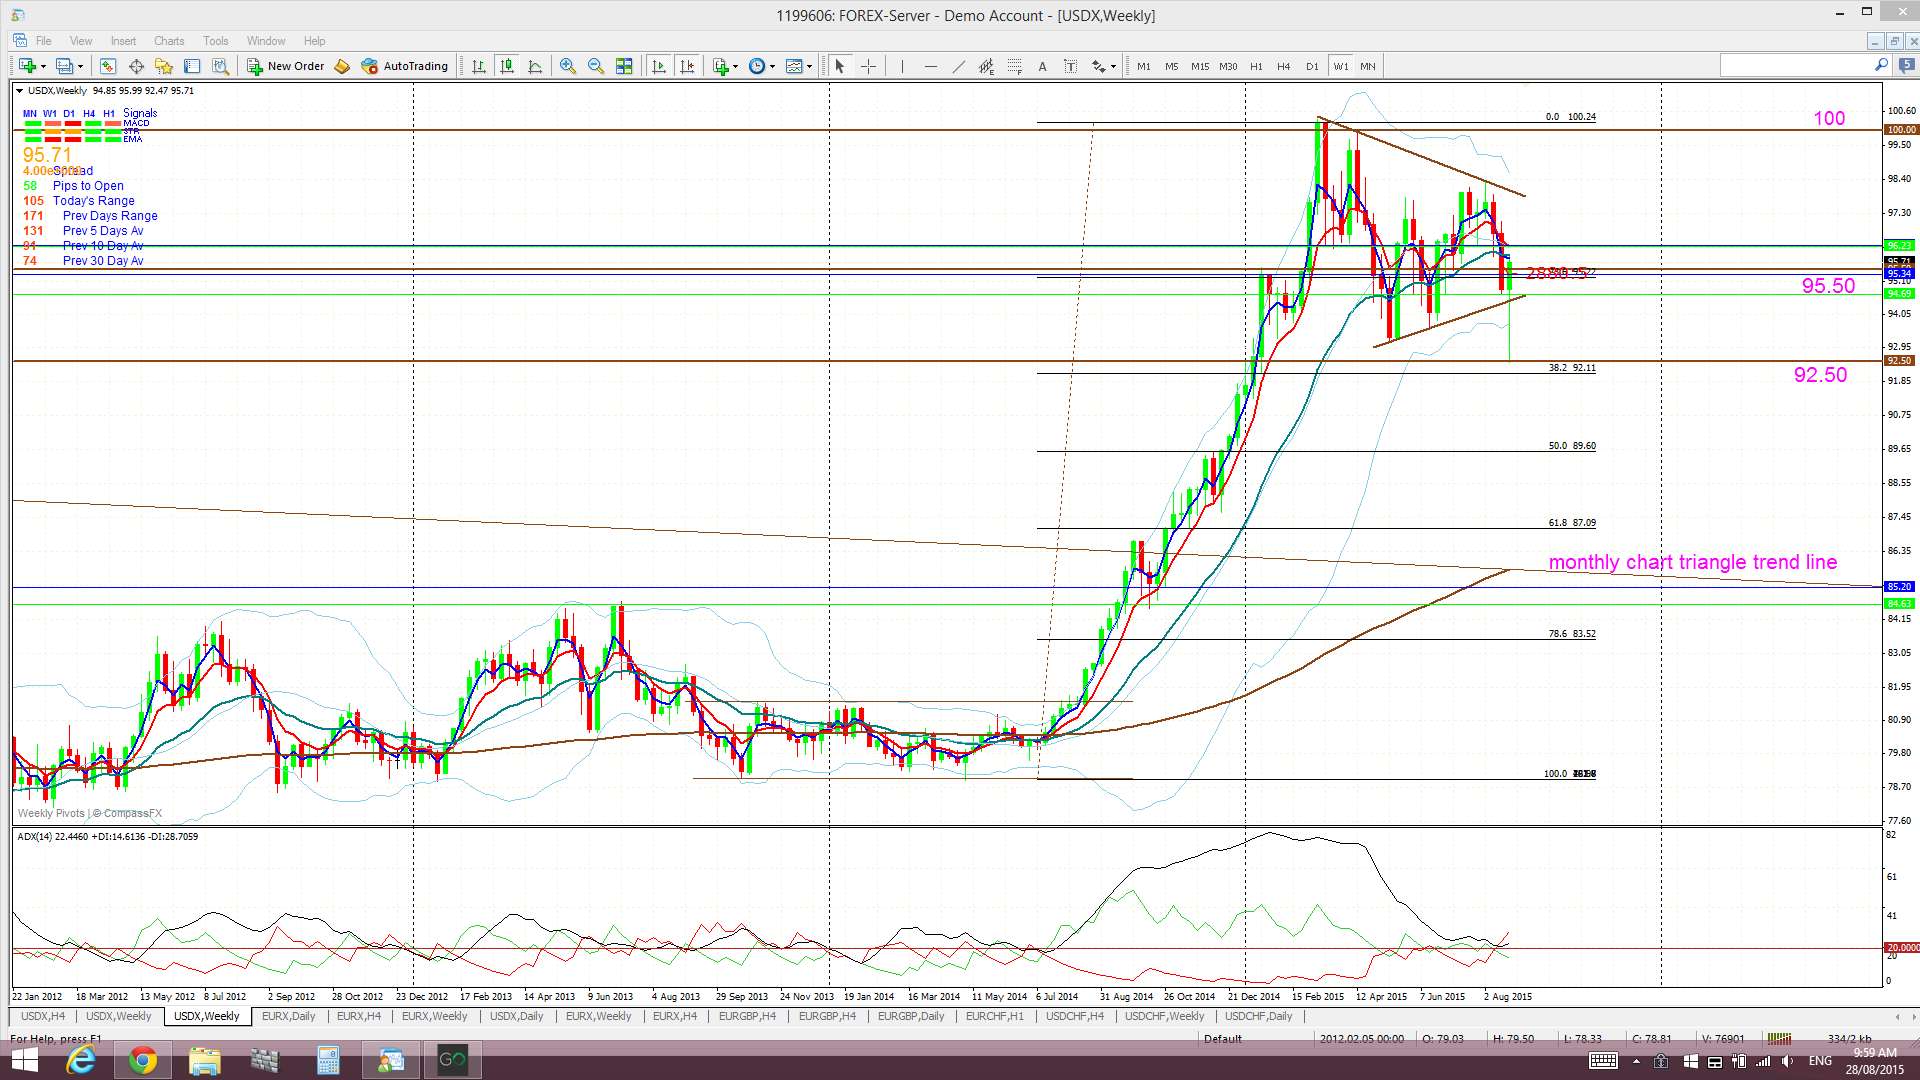
USDX weekly: the US$ bounced off major 92.50 support during the week and looks set to close the week continuing within the 5-month Flag pattern. The weekly candle is suggesting bullish-reversal and so we could be about to see US$ strength pick up or, at least, some choppy action to the upside if price resorts to range-trading:
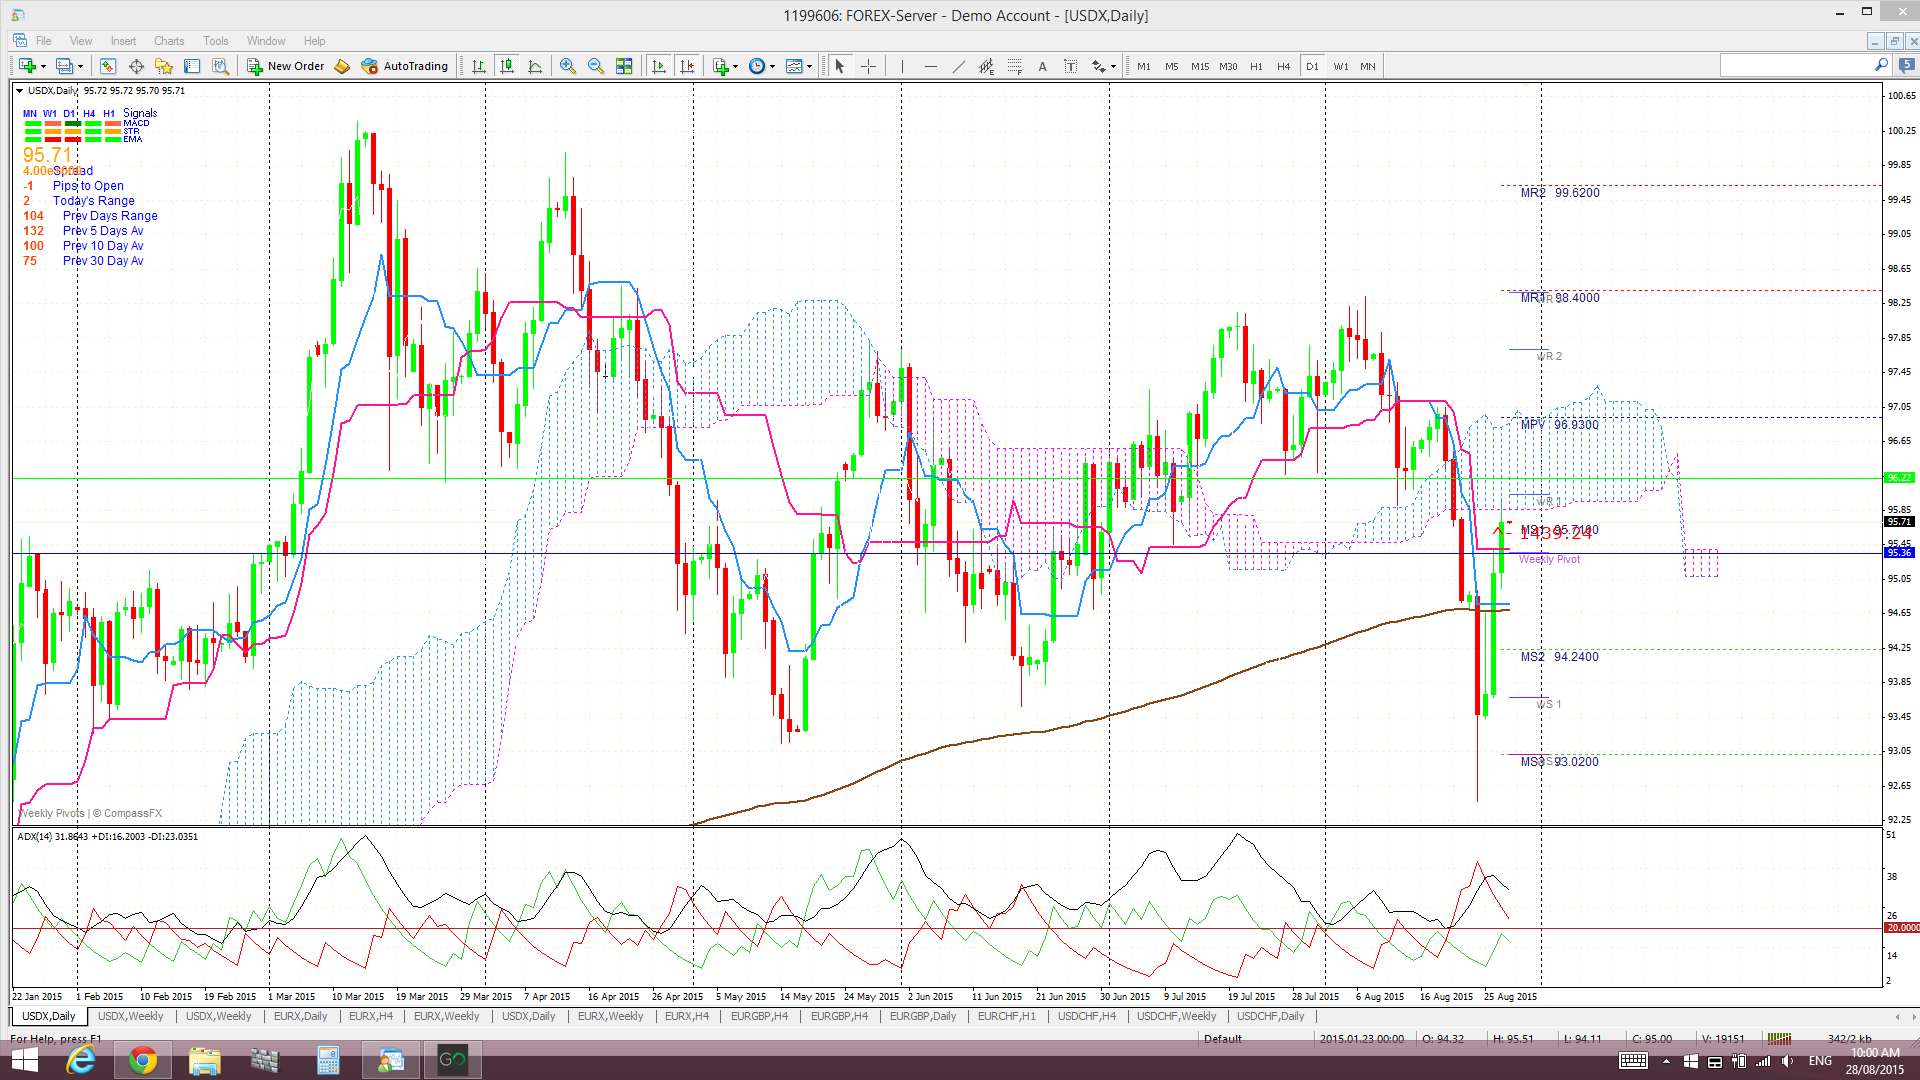
USDX daily Cloud: still below the Cloud for now, which is bearish, but is back up trading just under this resistance zone:
USDX 4hr Cloud: price is trying to move back up through the 4hr Cloud:

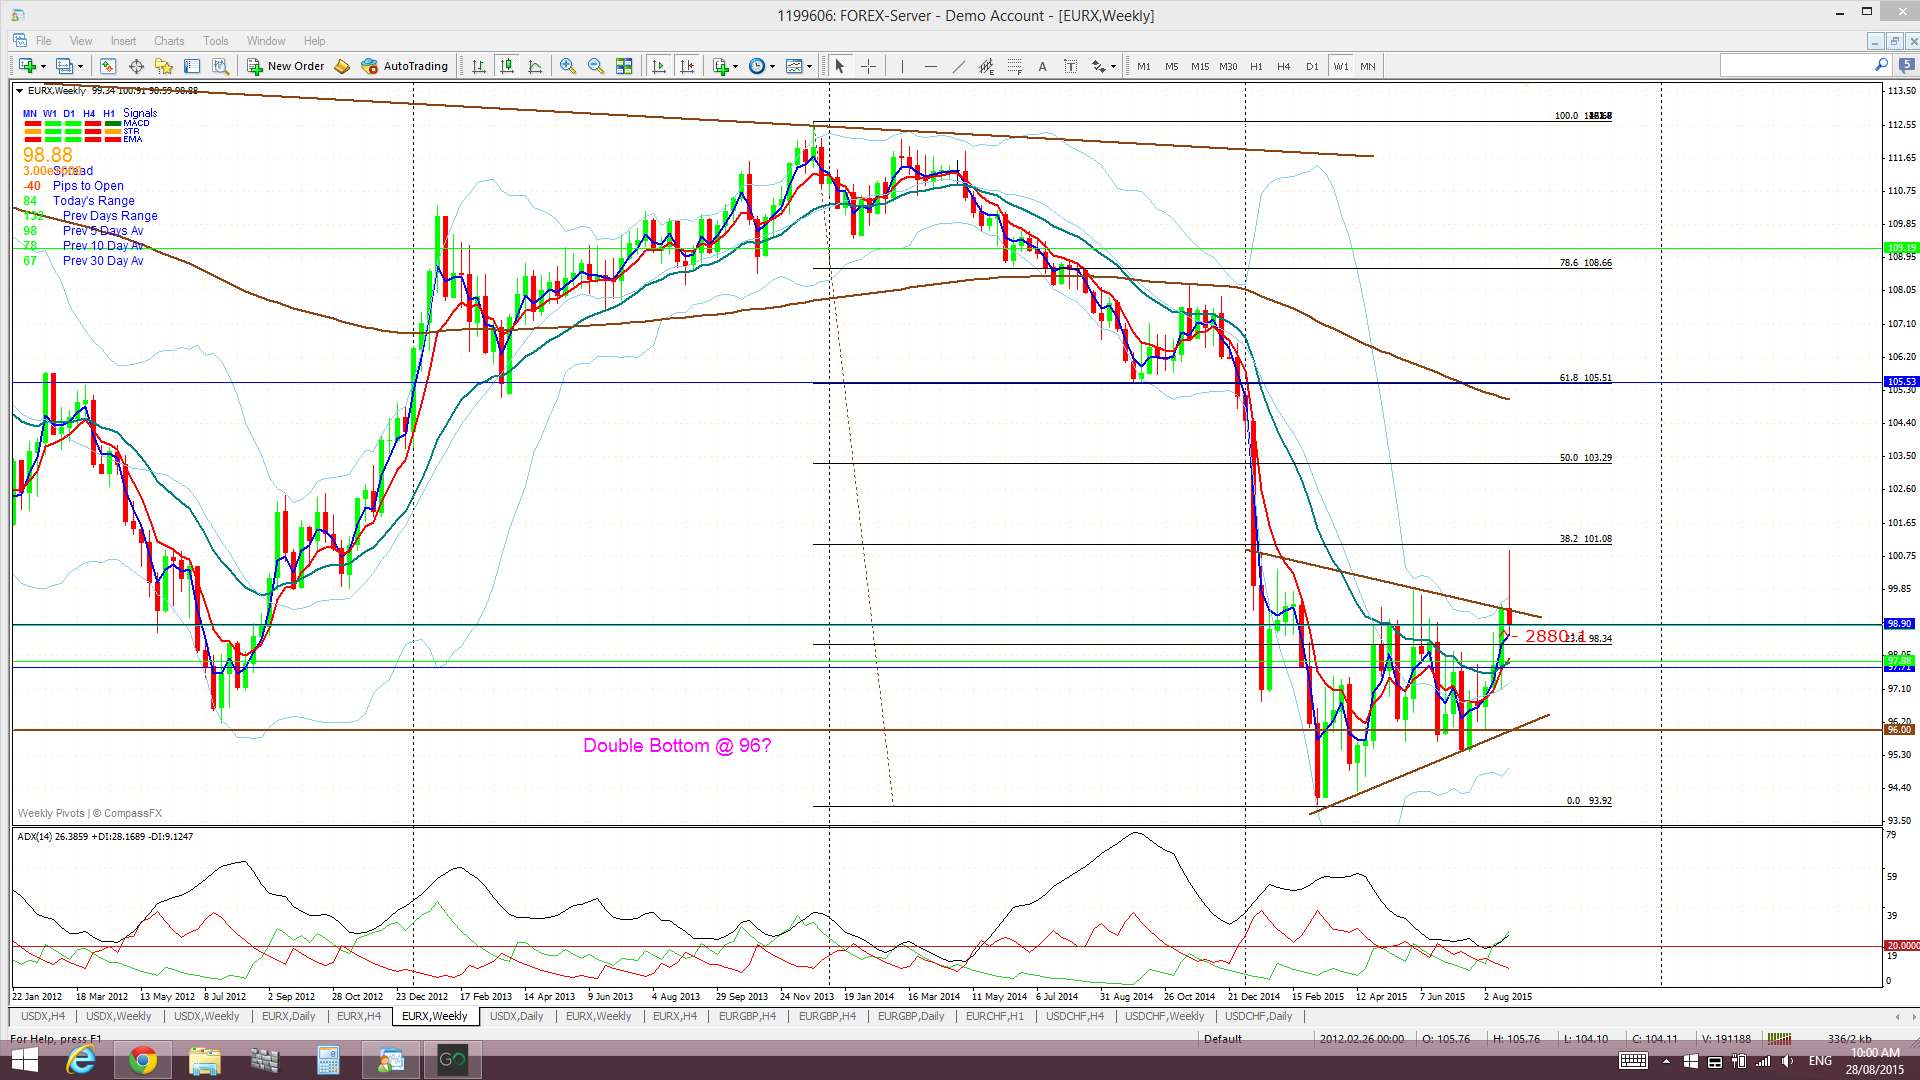
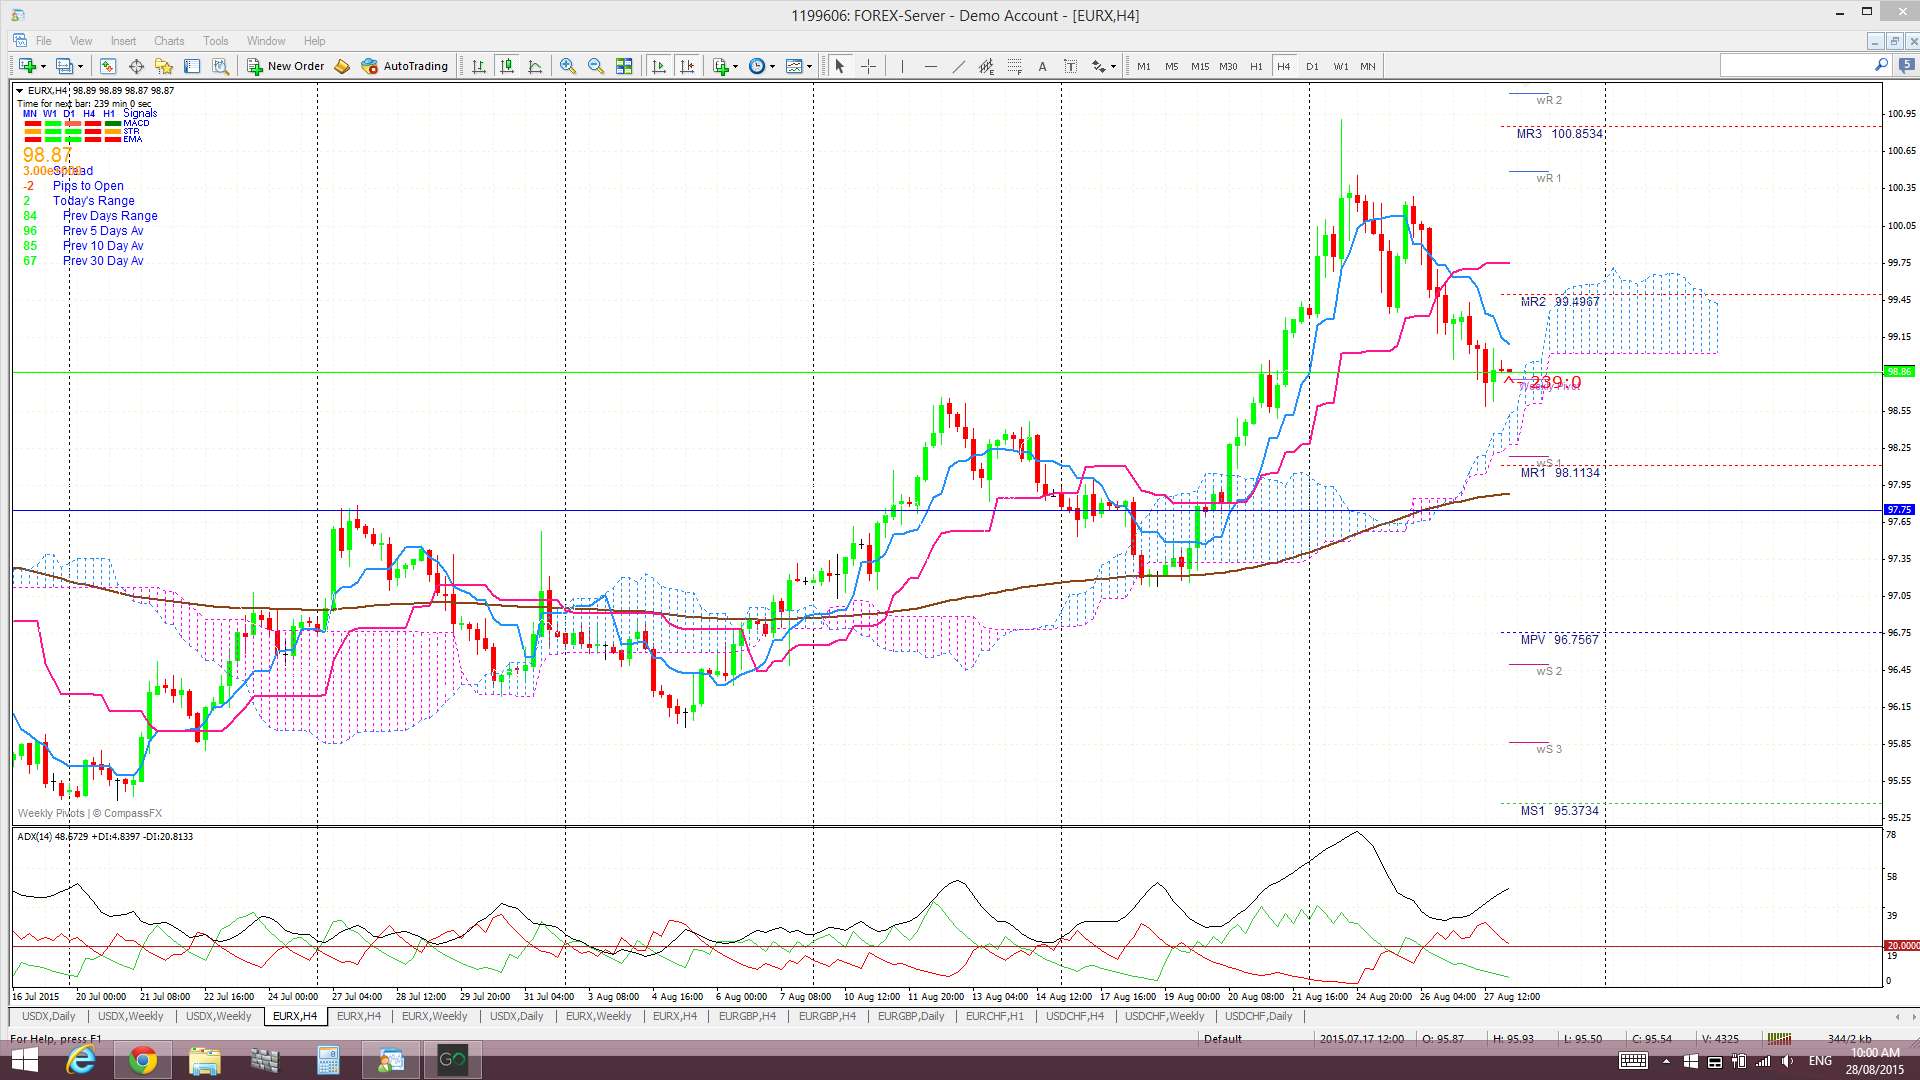
EURX weekly: a bearish reversal candle is forming and price looks set to close back within the Flag. This could signal some bearish continuation or, at least, some weakness by way of range-trading:
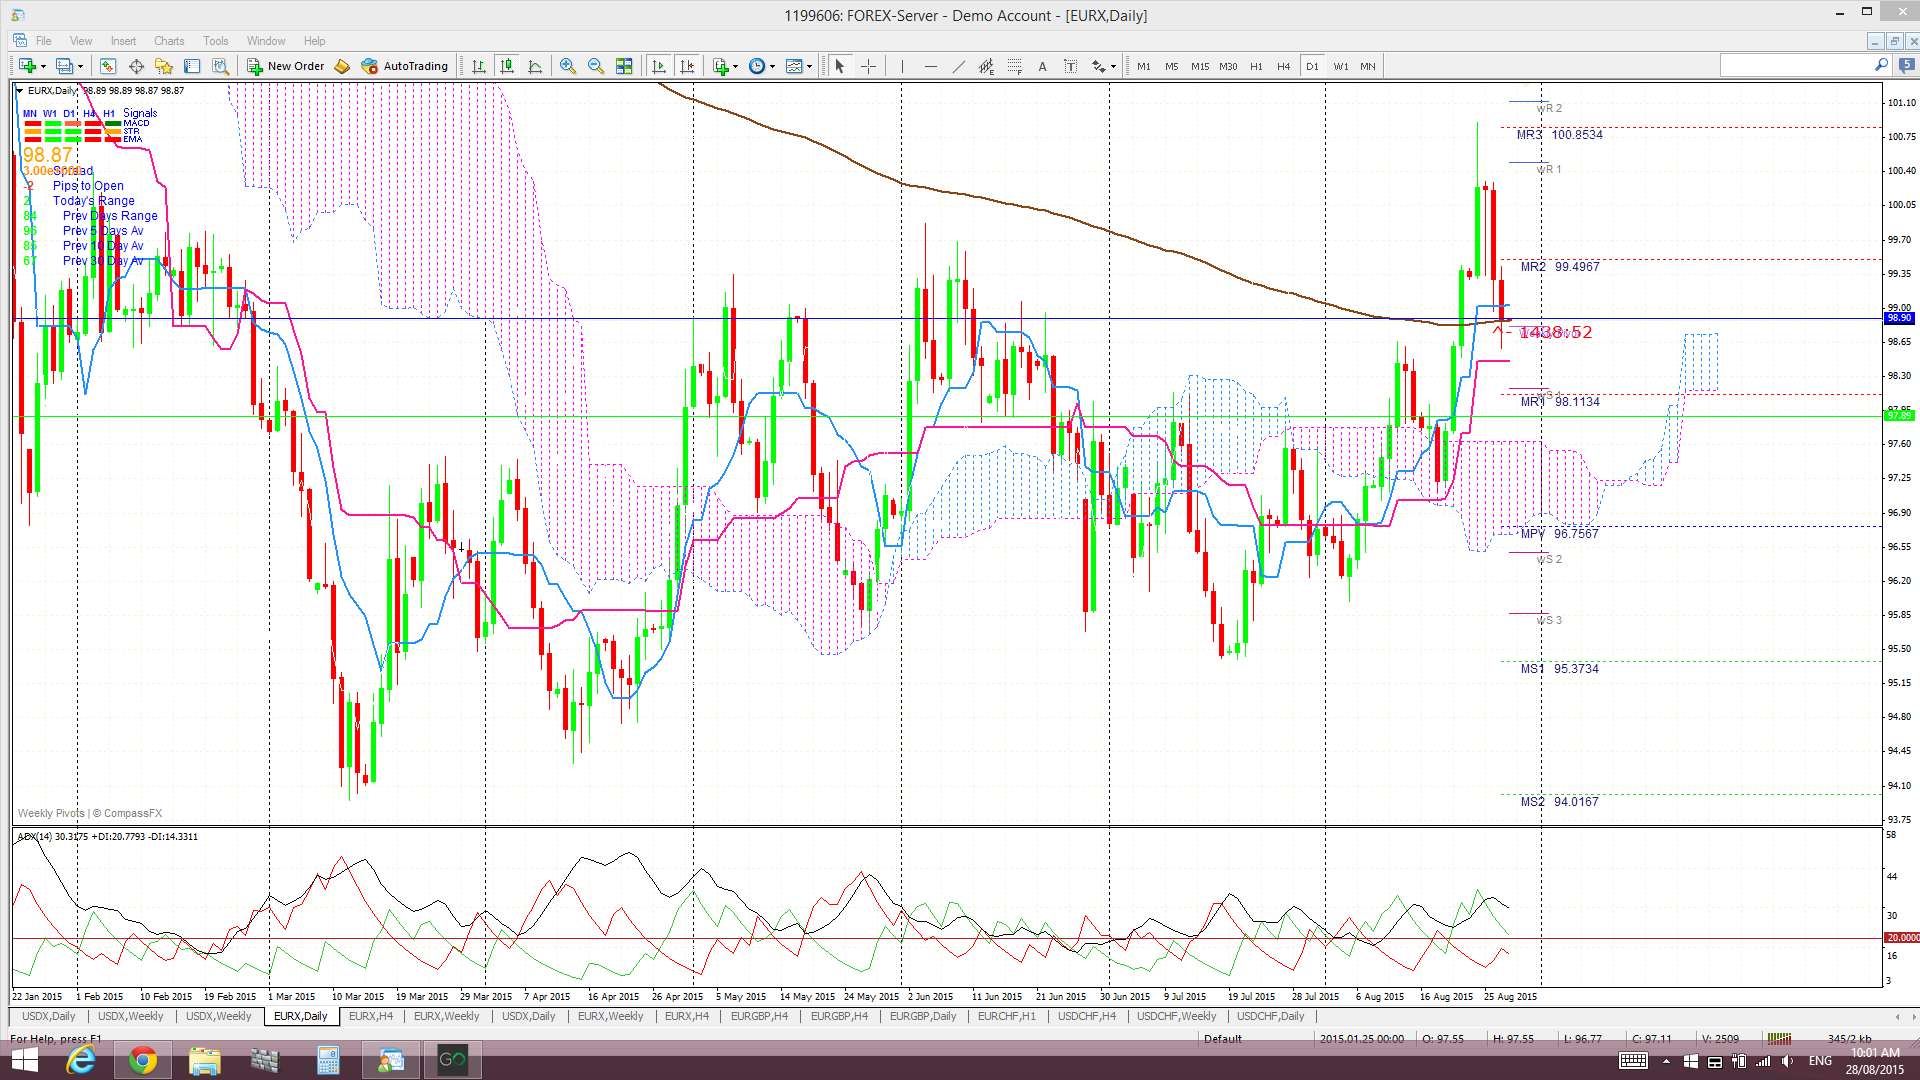
EURX daily: still bullish and above the Cloud for now:
EURX 4hr Cloud: heading down to test support from the 4hr Cloud:
Summary: the previous two weeks have been ones where US$ weakness and EUR strength shaped FX trading. The developing weekly candles on the FX index charts are suggesting we could be in for a pause of that sentiment and, perhaps, reversal. Traders would be well advised to consider the relative strength of the US$ to the EUR when considering directional trading on FX pairs.
For example: I highlighted earlier in the week how the EUR/USD was heading up to test major 1.18 resistance. Price reached up to within 100 pips of this region but has now pulled back to the tune of around 450 pips:
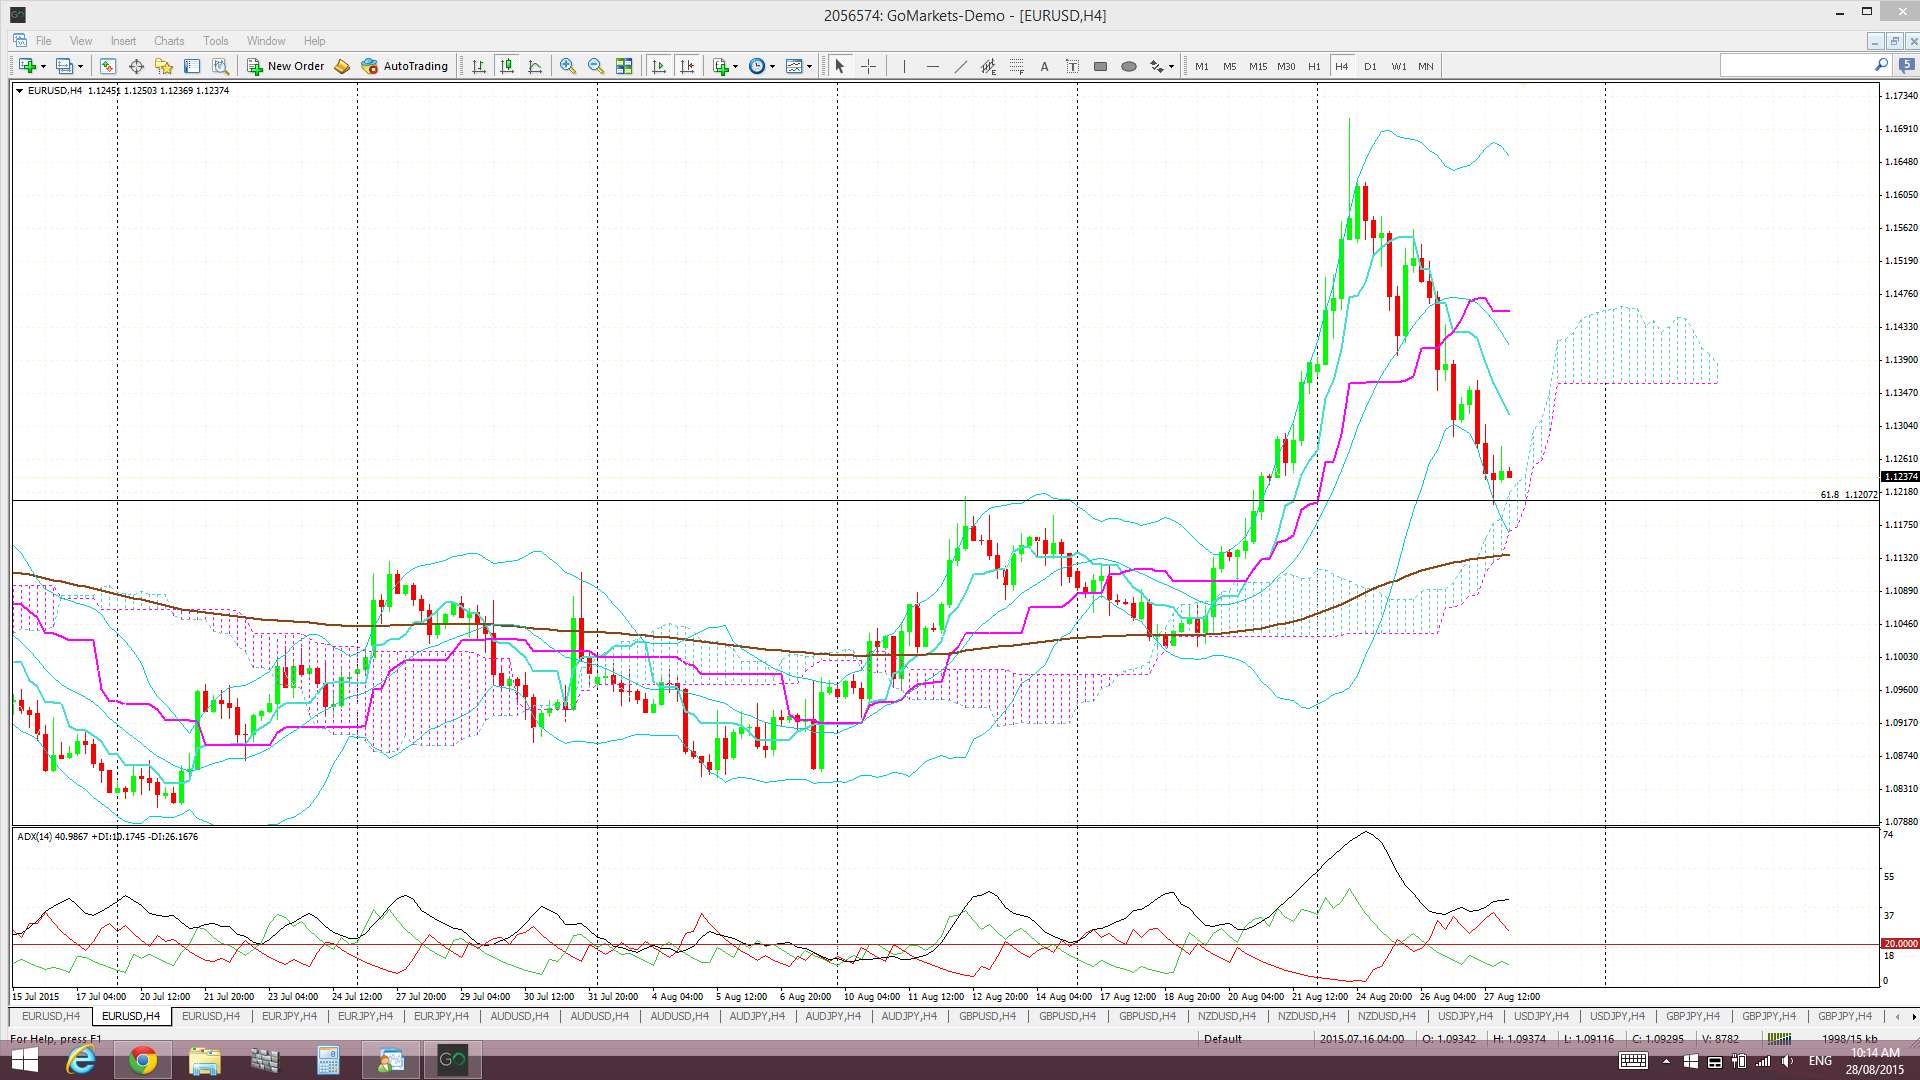
E/U 4hr:
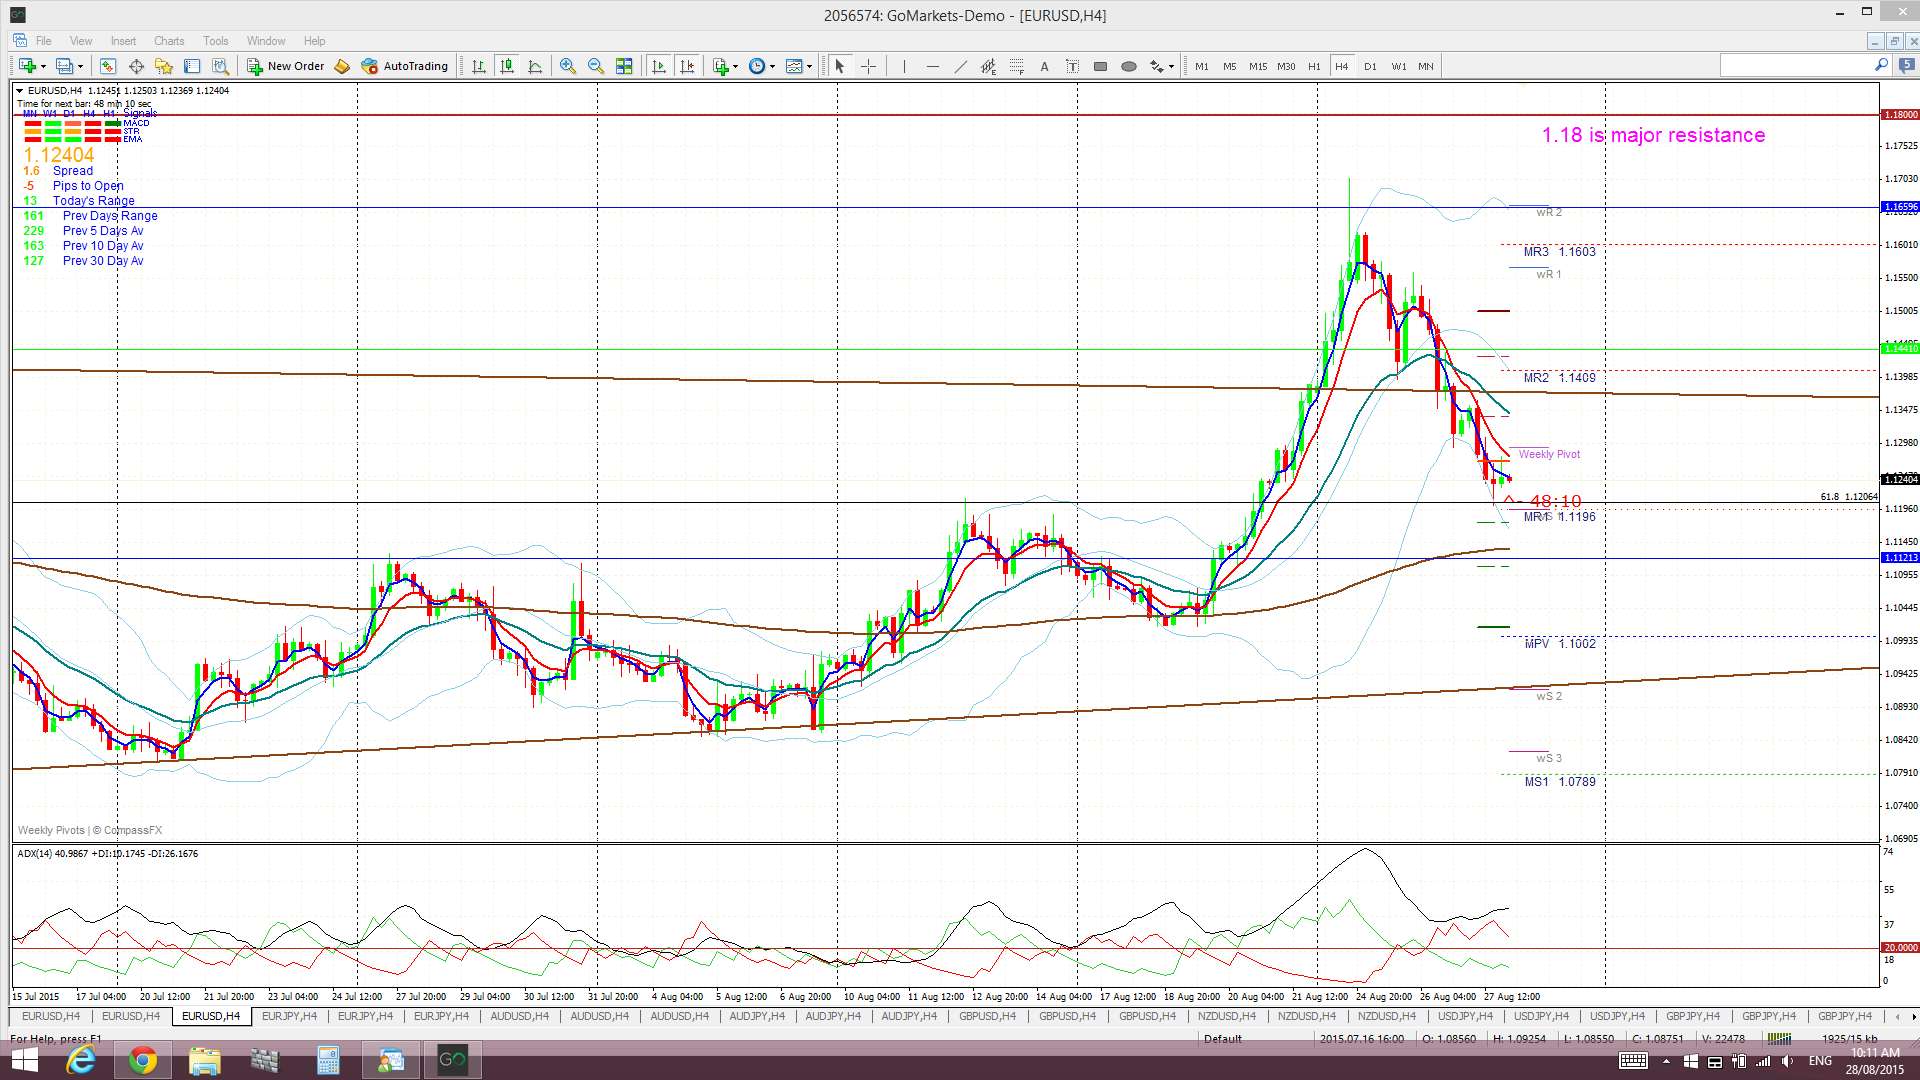
E/U weekly: the weekly charts shows the E/U still conforming to a possible Bear Flag and so, whereas a bullish breakout looked imminent earlier in the week, bearish continuation within the Flag pattern may be in store from here on:

E/U Ichimoku Charts: price action is above both the 4hr and daily Clouds for now but watch for any bearish shift lower AND for any continued US$ strength:

The post US$: sentiment shifting back to the upside? appeared first on www.forextell.com.