USDX
Monthly: The April candle is still printing a bearish coloured ‘Inside’ candle. This candle has yet to close but it does seem to hint at a possible change given it follows on from 9 months of bullish candles. The 100 level is still proving to be some resistance.
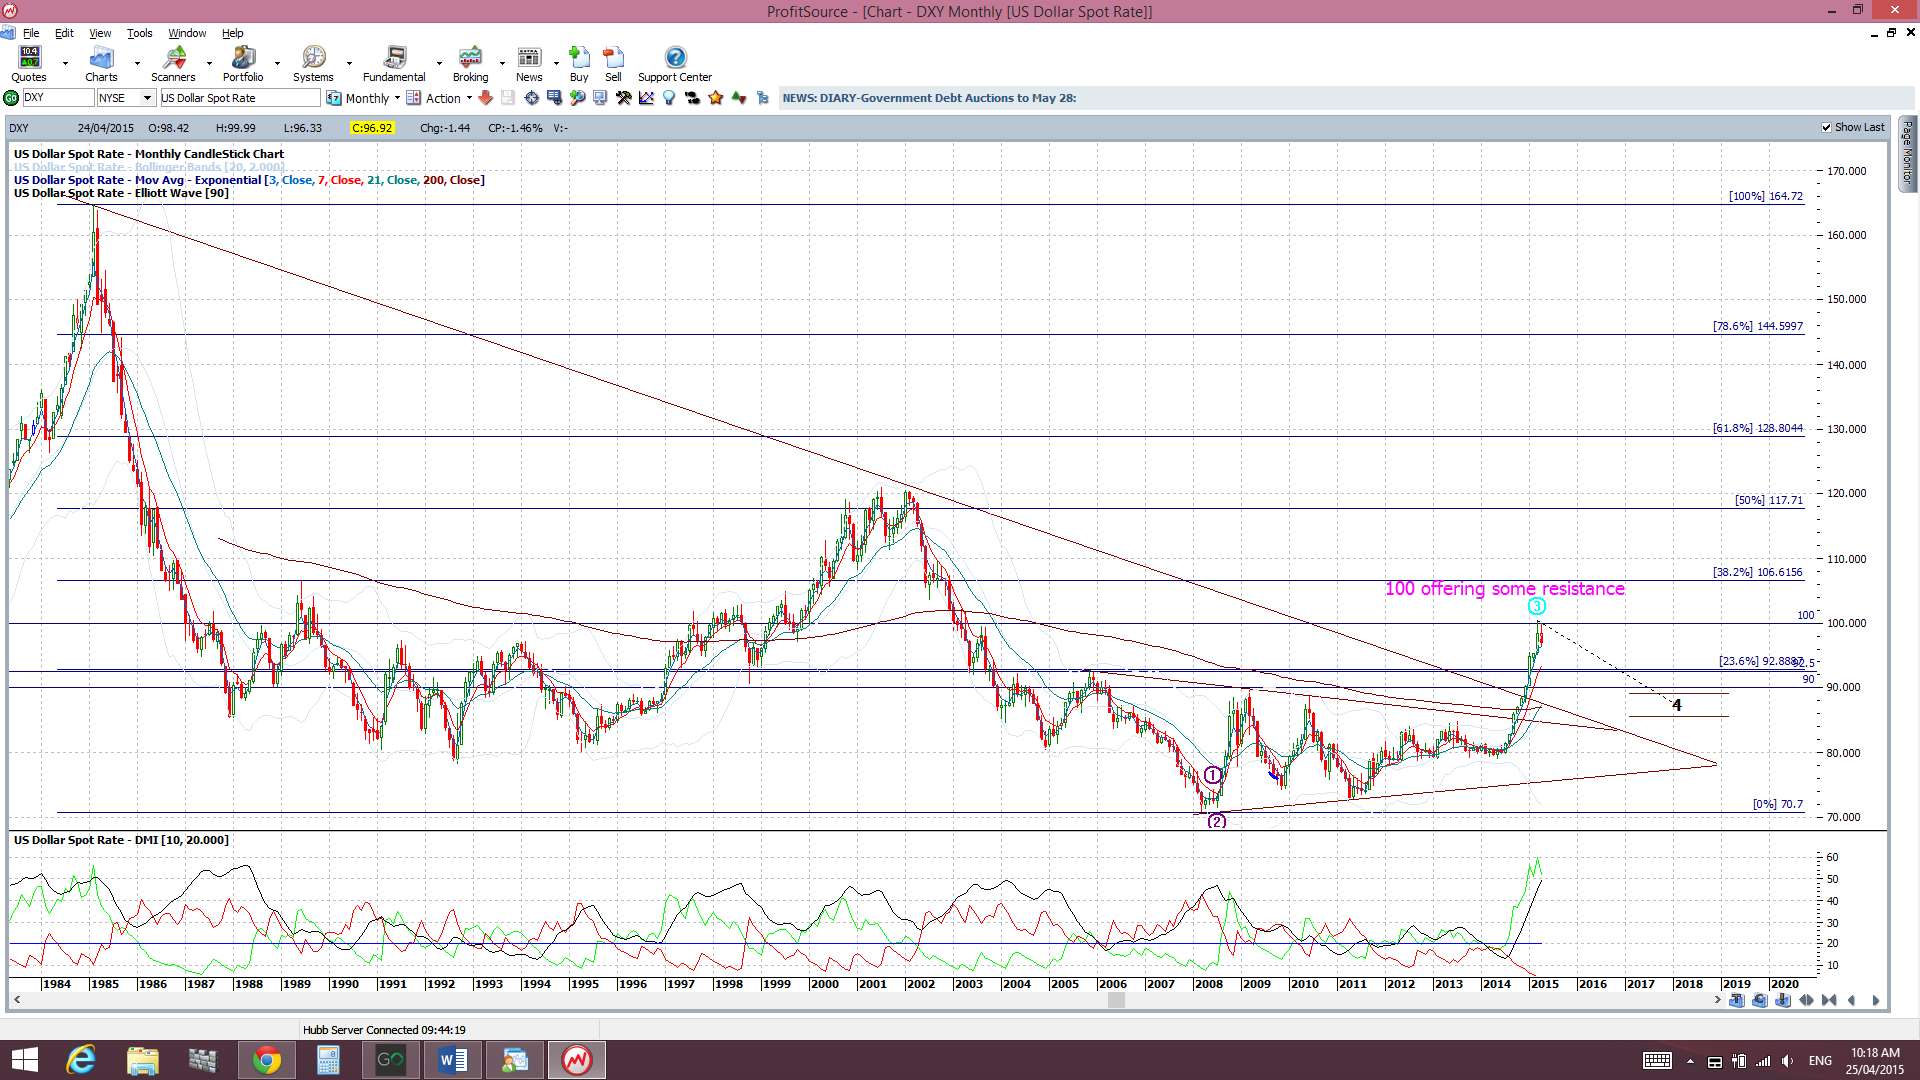
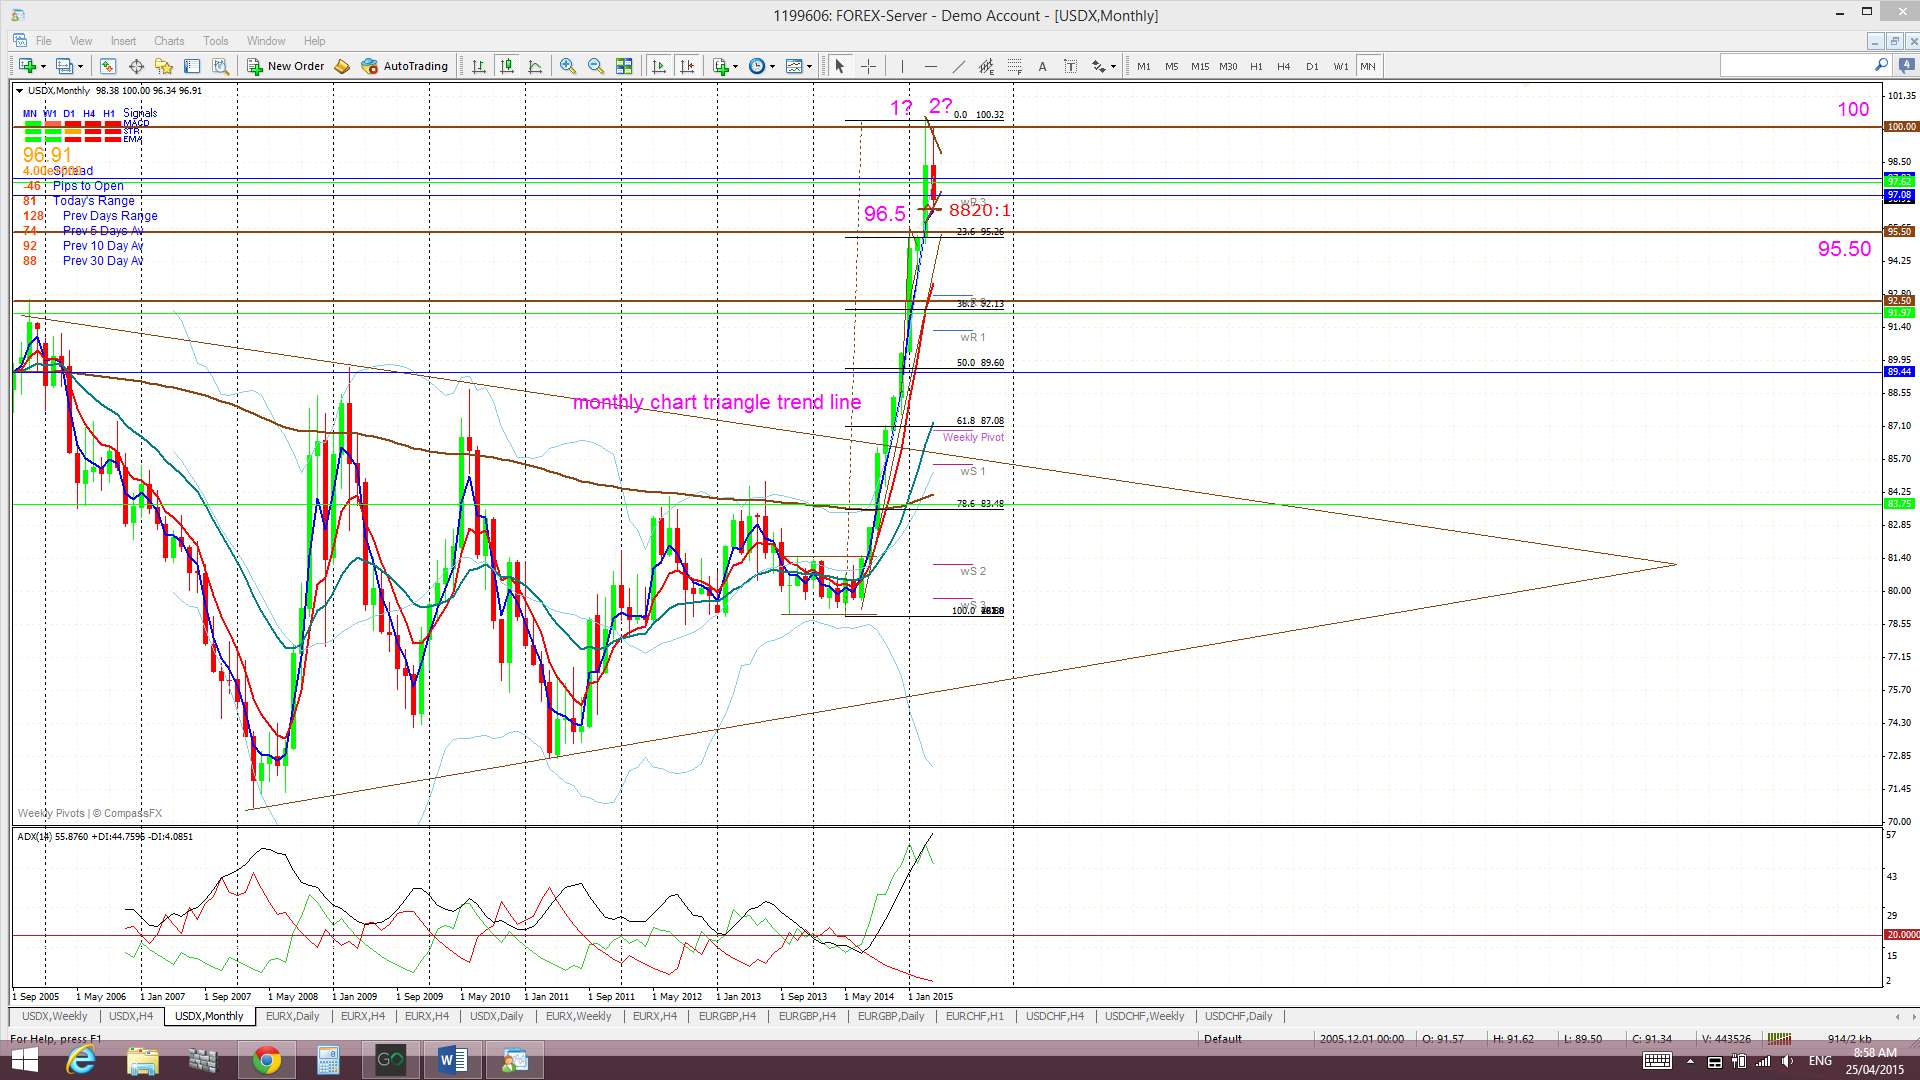
Monthly Ichimoku: The April candle is well above the Cloud.
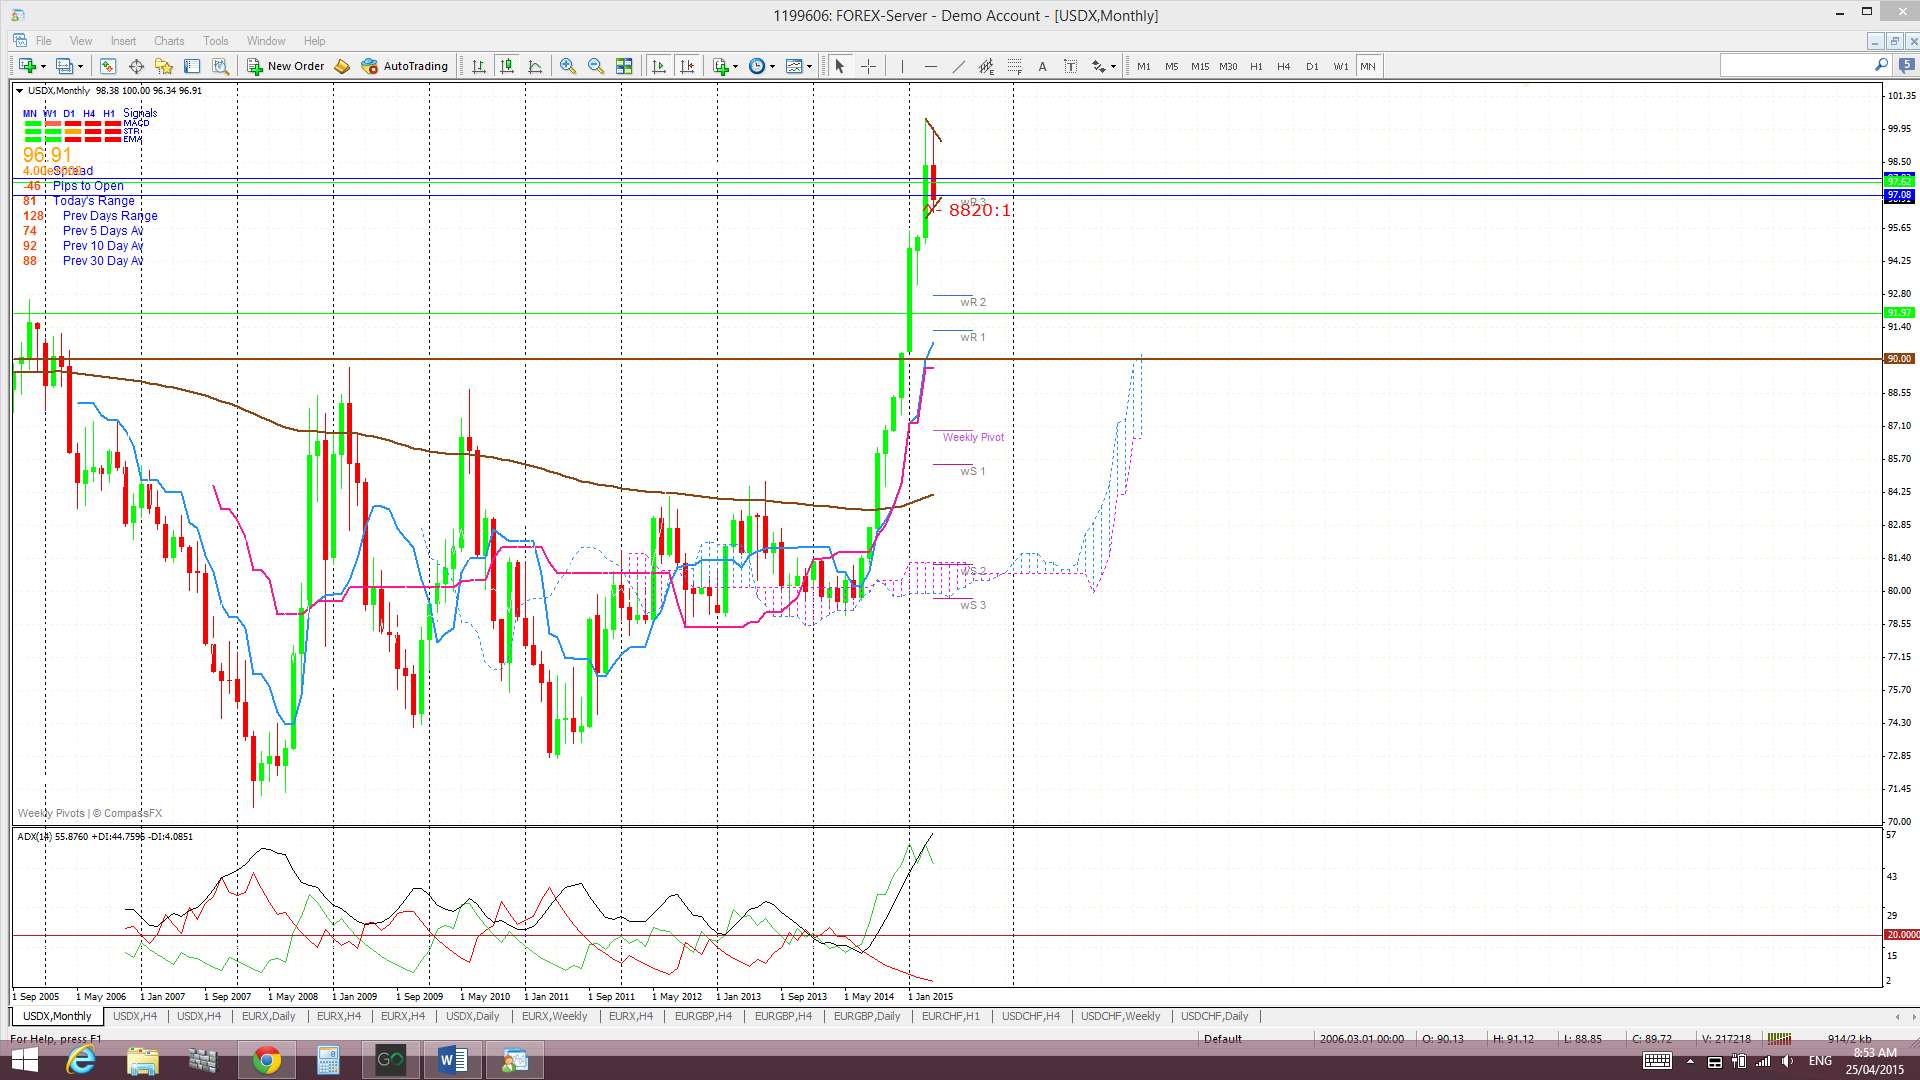
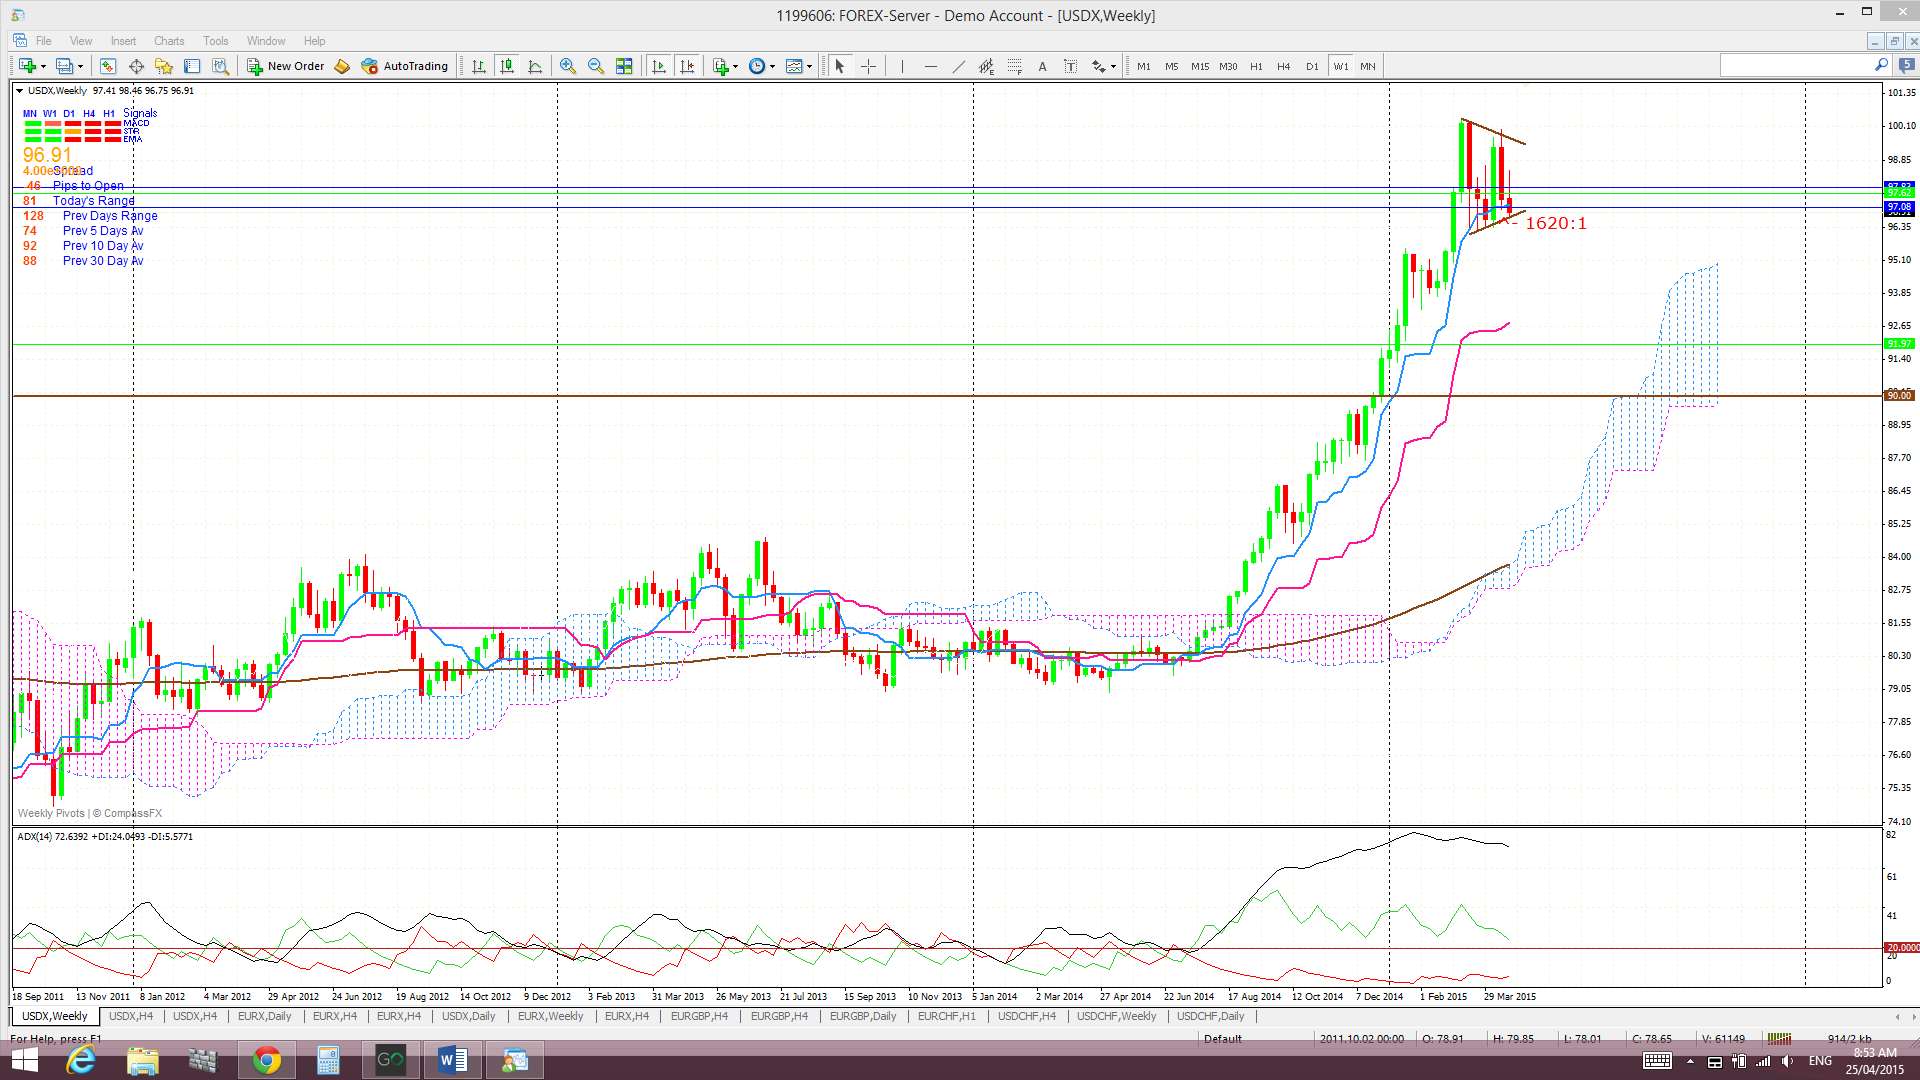
Weekly: Last week’s candle closed as a small bearish candle with a long upper shadow. It is worth remembering that a 61.8% fib pull back of this lengthy US$ rally would bring price down to near the previous monthly triangle breakout region. There is a wedge evident on this chart now as well and one has to also consider the possibility that this could evolve into another Bull Flag!
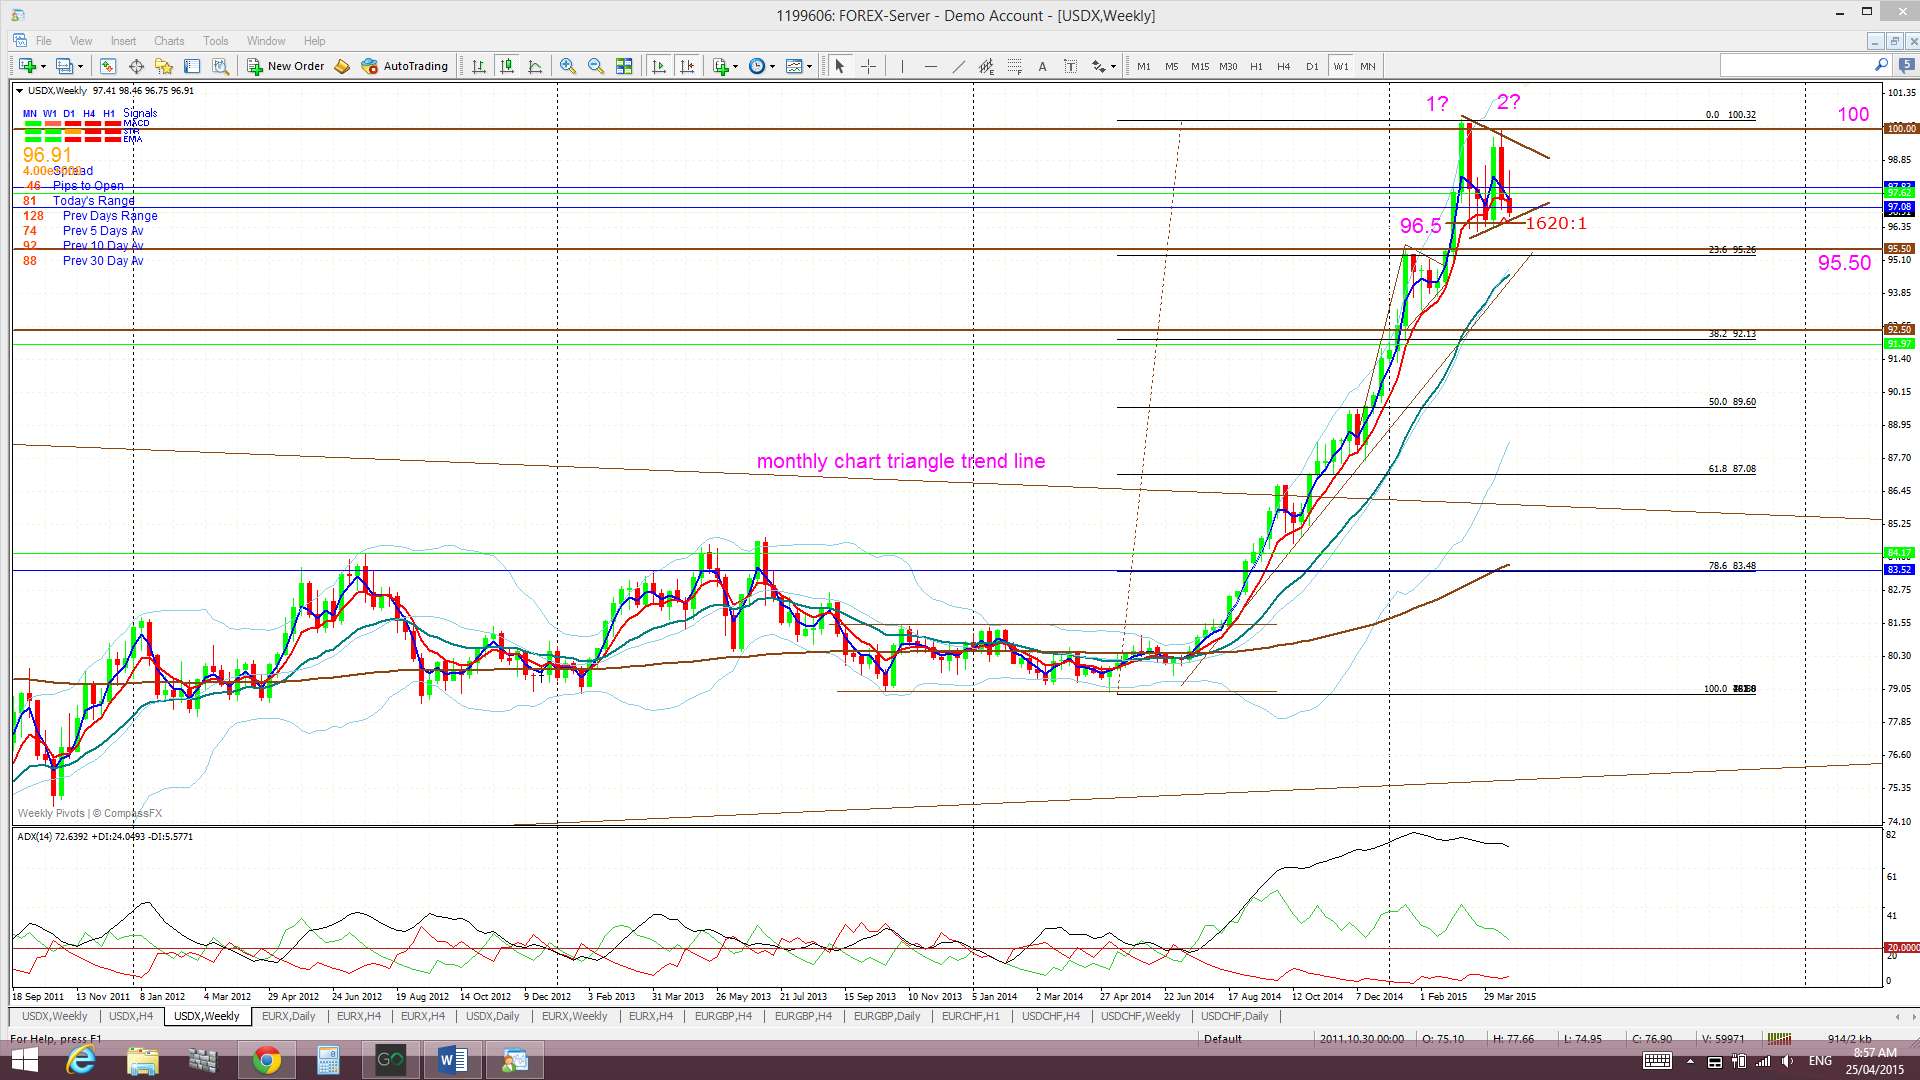
Weekly Ichimoku: The weekly candle closed well ABOVE the weekly Cloud.
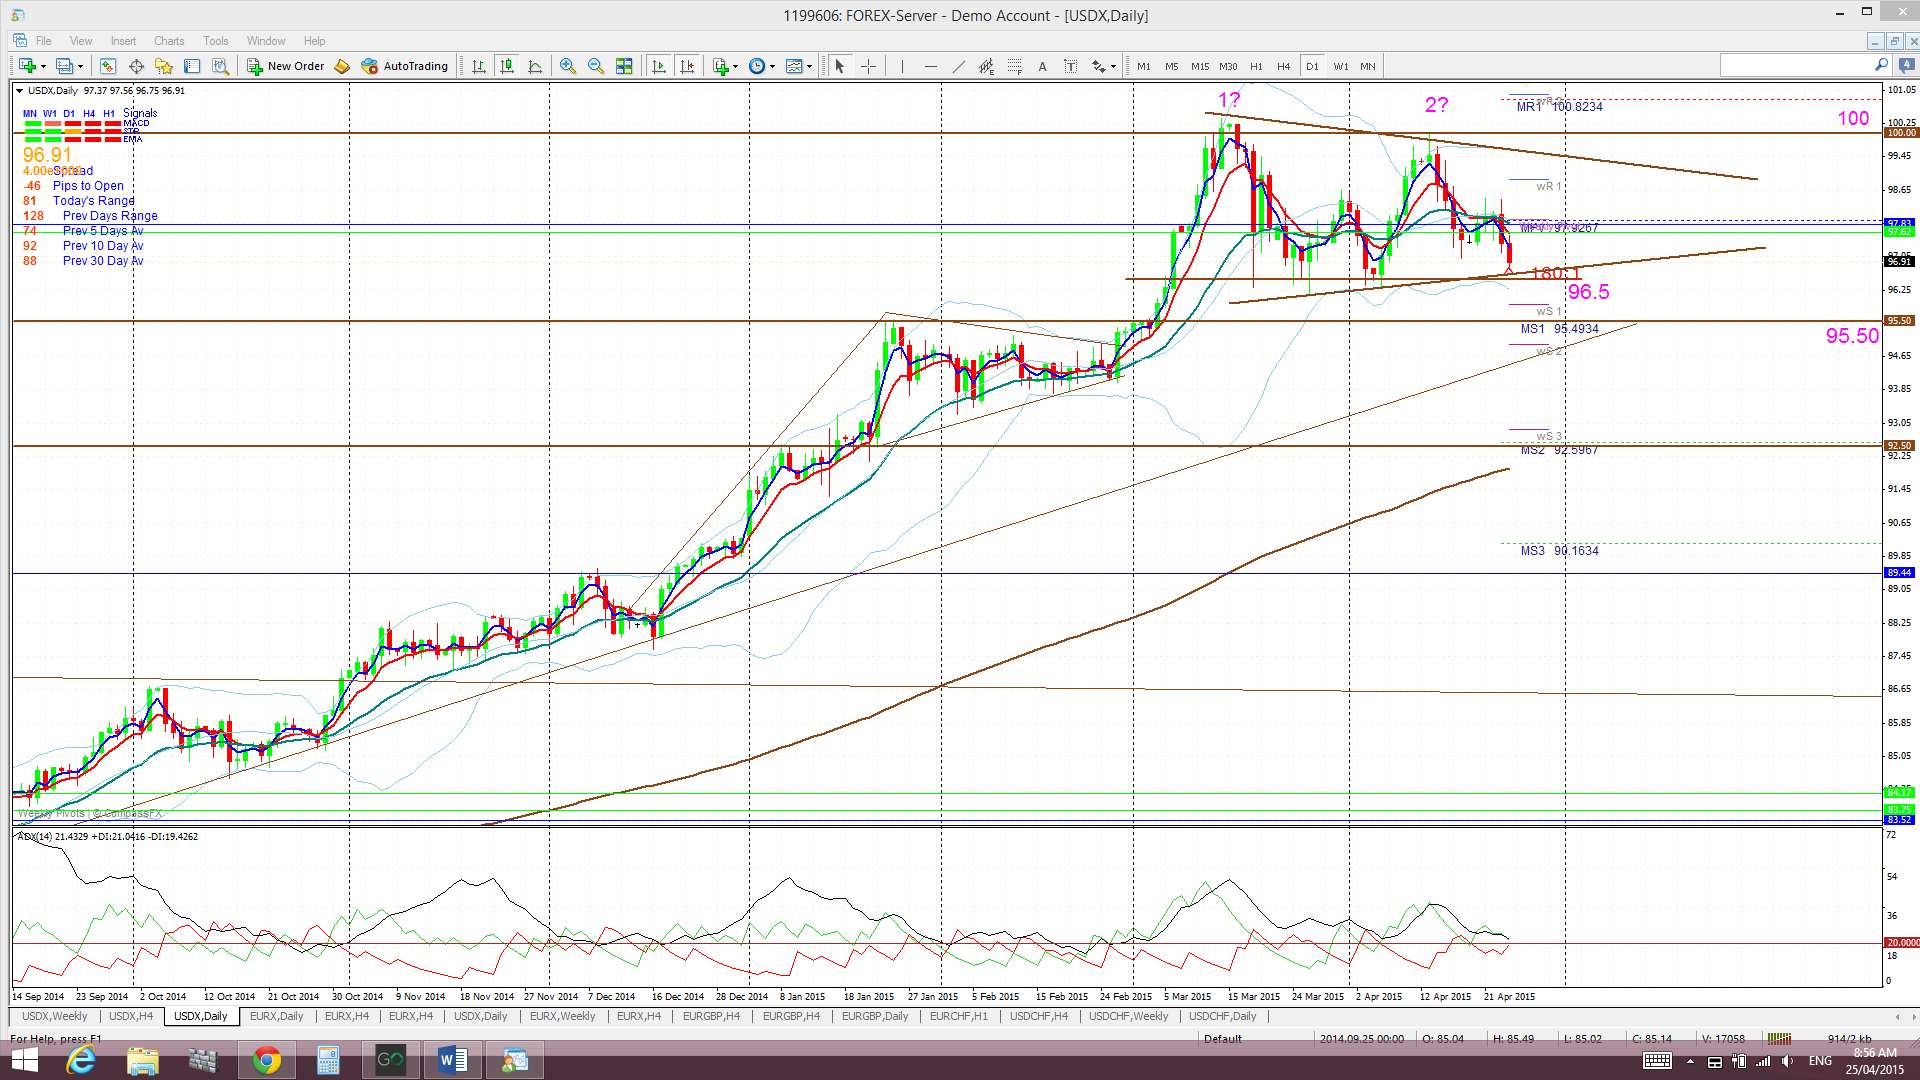
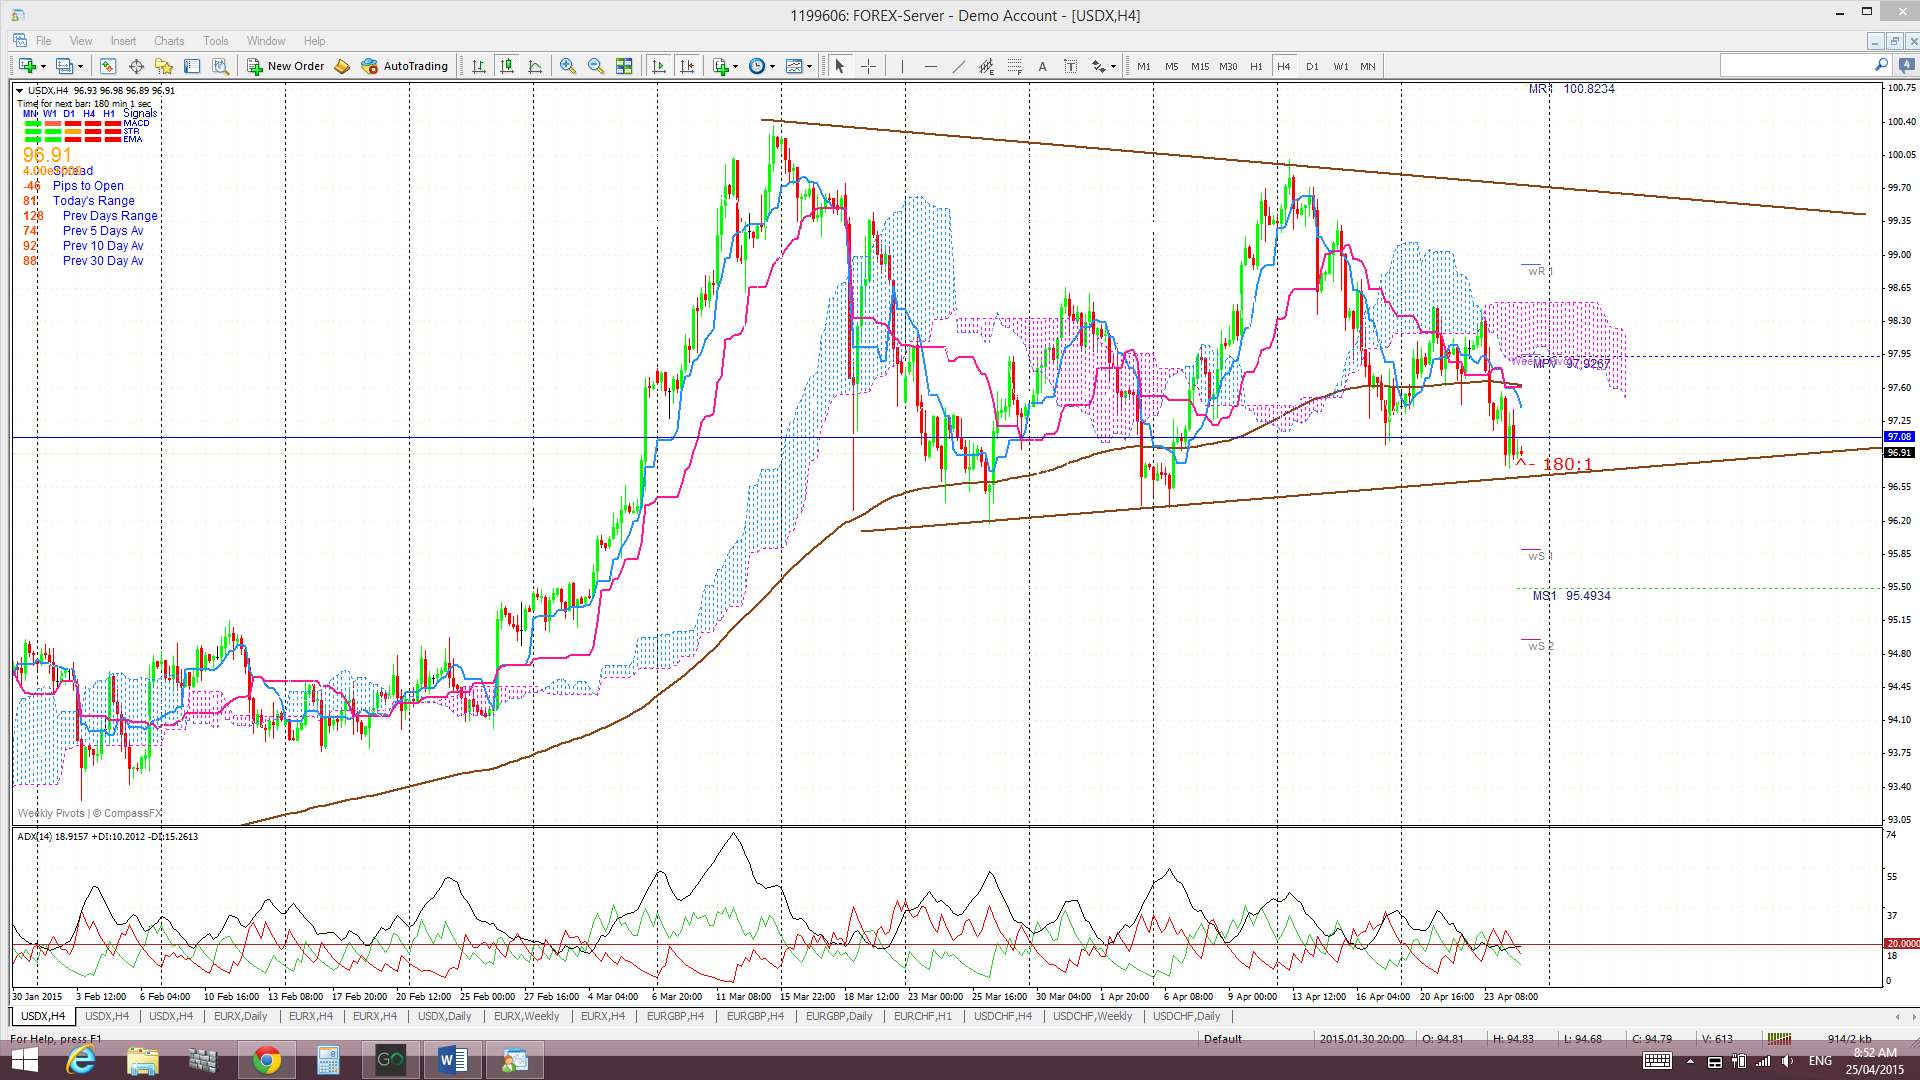
Daily: Price has chopped up and down this week. The 100 level remains as resistance above current price as it forms a potential ‘Double Top’ region. Technically, the ‘neck line’ of this ‘Double Top’ would be closer to 96.50 but I am more focused on the S/R region of 95.50.
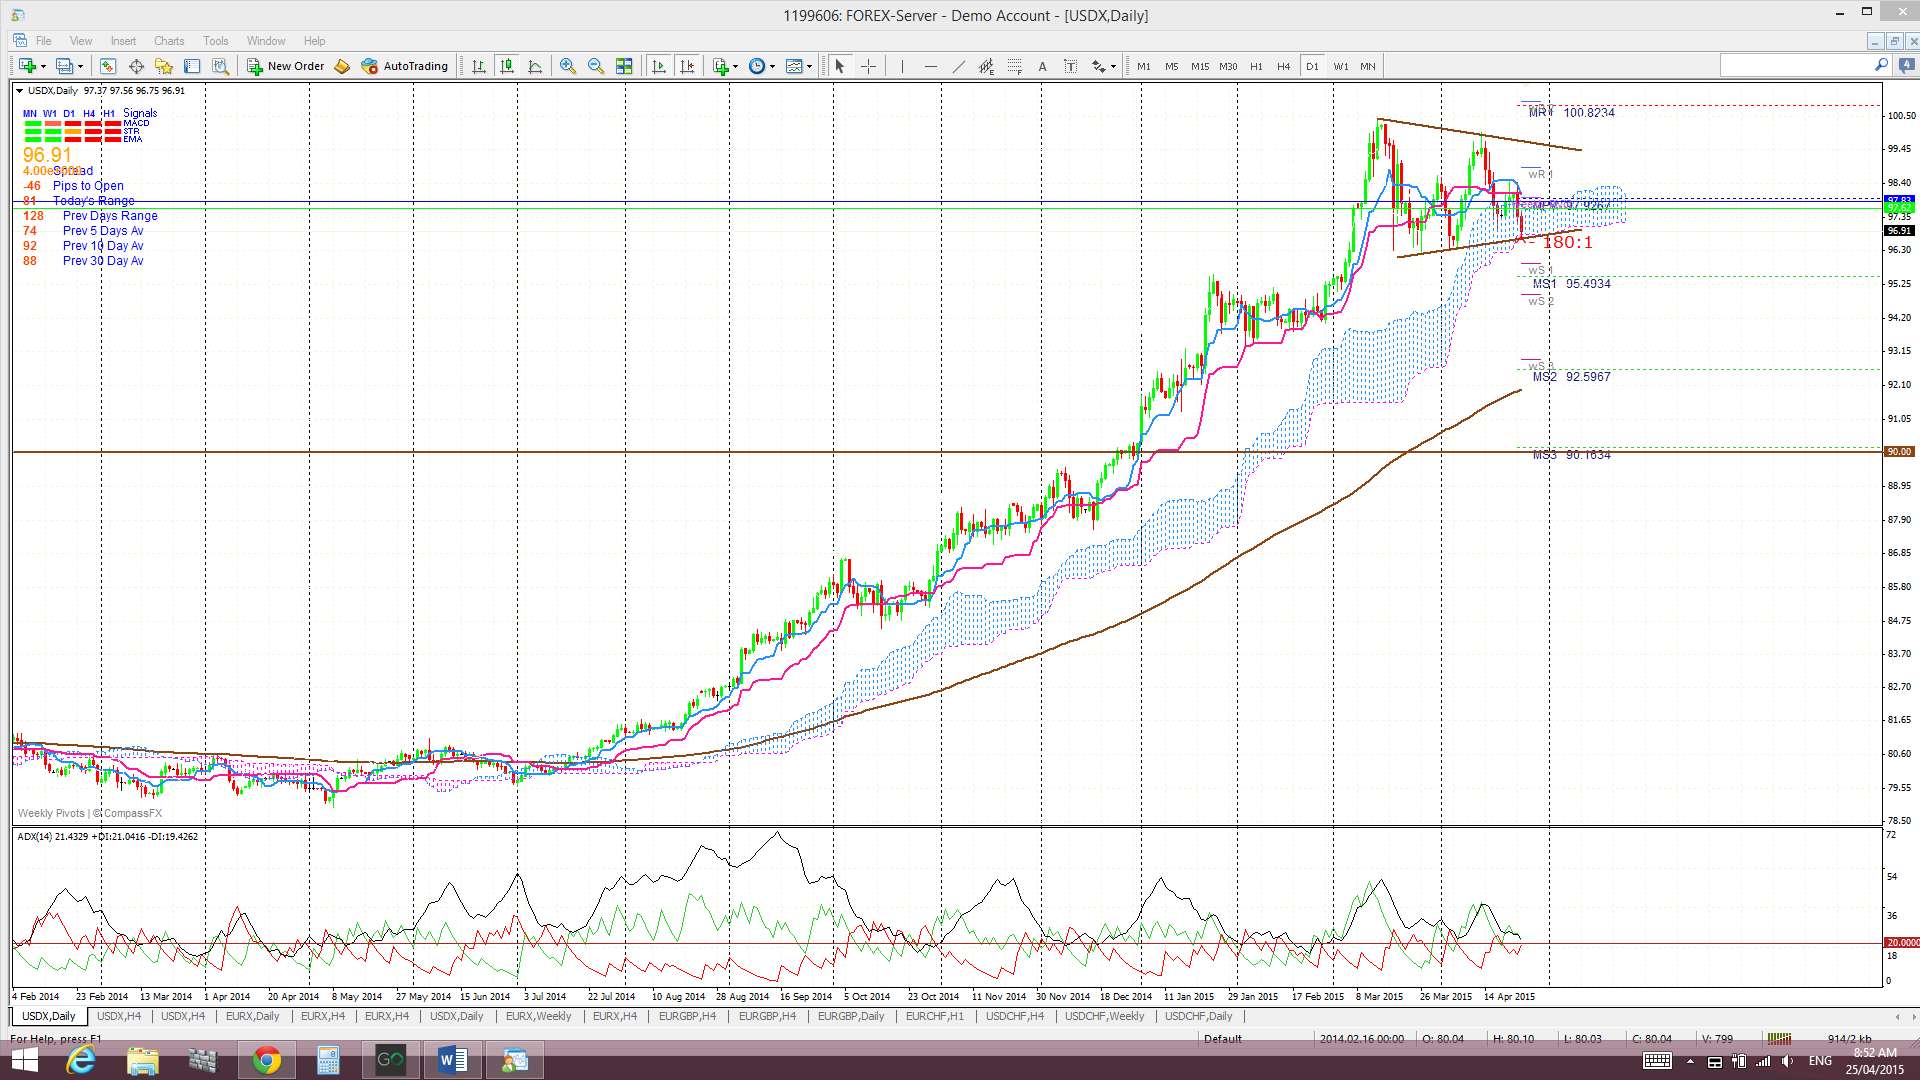
Daily Ichimoku Cloud chart: Price is back in the daily Cloud and trading towards the lower of edge of this region. This is the first period of being Cloud-bound in over 9 months. The recent bullish Tenkan/Kijun cross looks to be closing off as well. The index is near the bottom edge of the Cloud and it wouldn’t have to fall too much further to enable 4hr and daily Cloud alignment for SHORT US$ trades. Note also how the wedge trend line is near the bottom of the daily Cloud and how these levels align closely to the ‘neck line’ 96.50 region. A close and hold below this trend line, the bottom of the daily Cloud and 96.50 level would support bearish follow through and undermine any Bull Flag. Personally though, I would still also want to see a close and hold below 95.50.
4hr: Price chopped up and down last week but didn’t stray too far from the half way mark between the upper and lower limits of the recent trading range (100 – 95.50). This price action formed up into a triangle on the 4hr time frame and price broke the lower edges of this support on Friday. I remain on the lookout for any move and hold below 95.50 or above 100. A close and hold below 95.50 would suggest we could be in for more of a pull back.
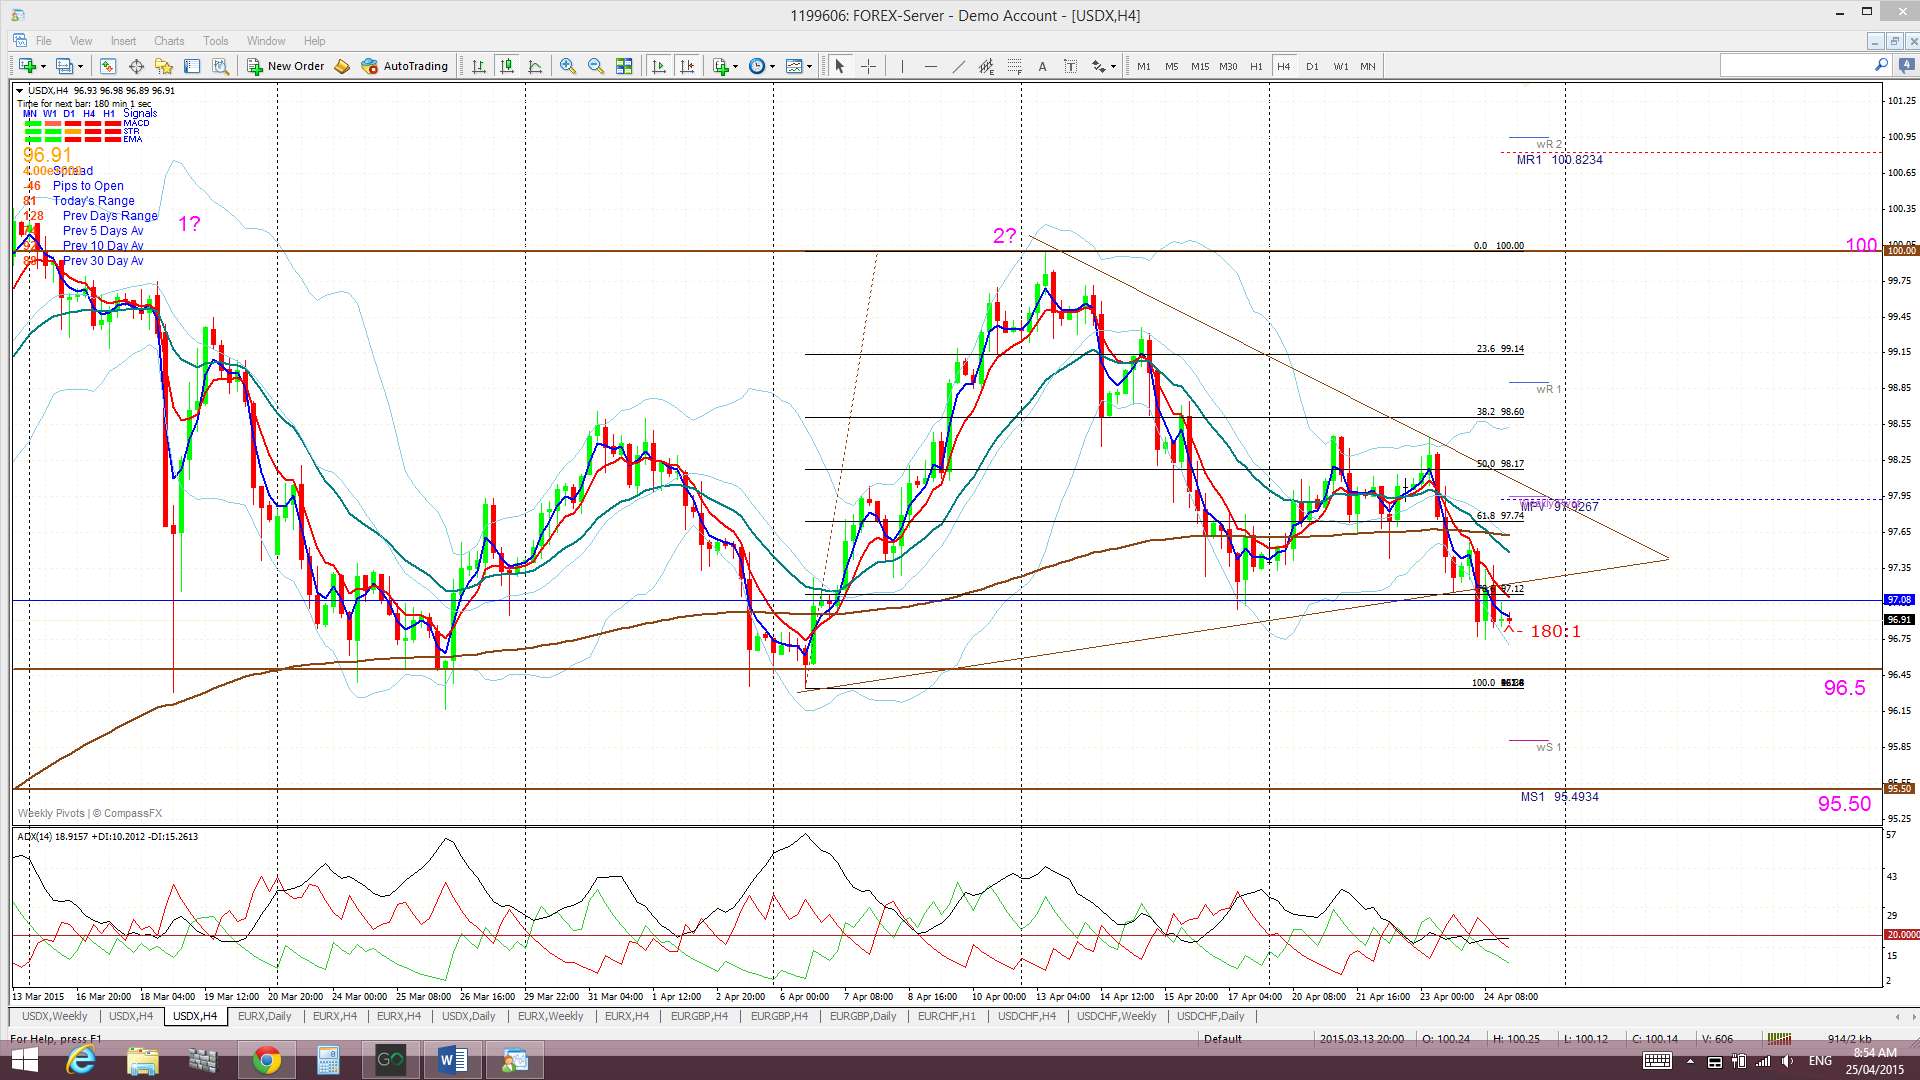
4hr Ichimoku Cloud chart: Price chopped below the 4 hr Cloud last week. This chart is divergent from the daily chart and suggests choppiness.
EURX
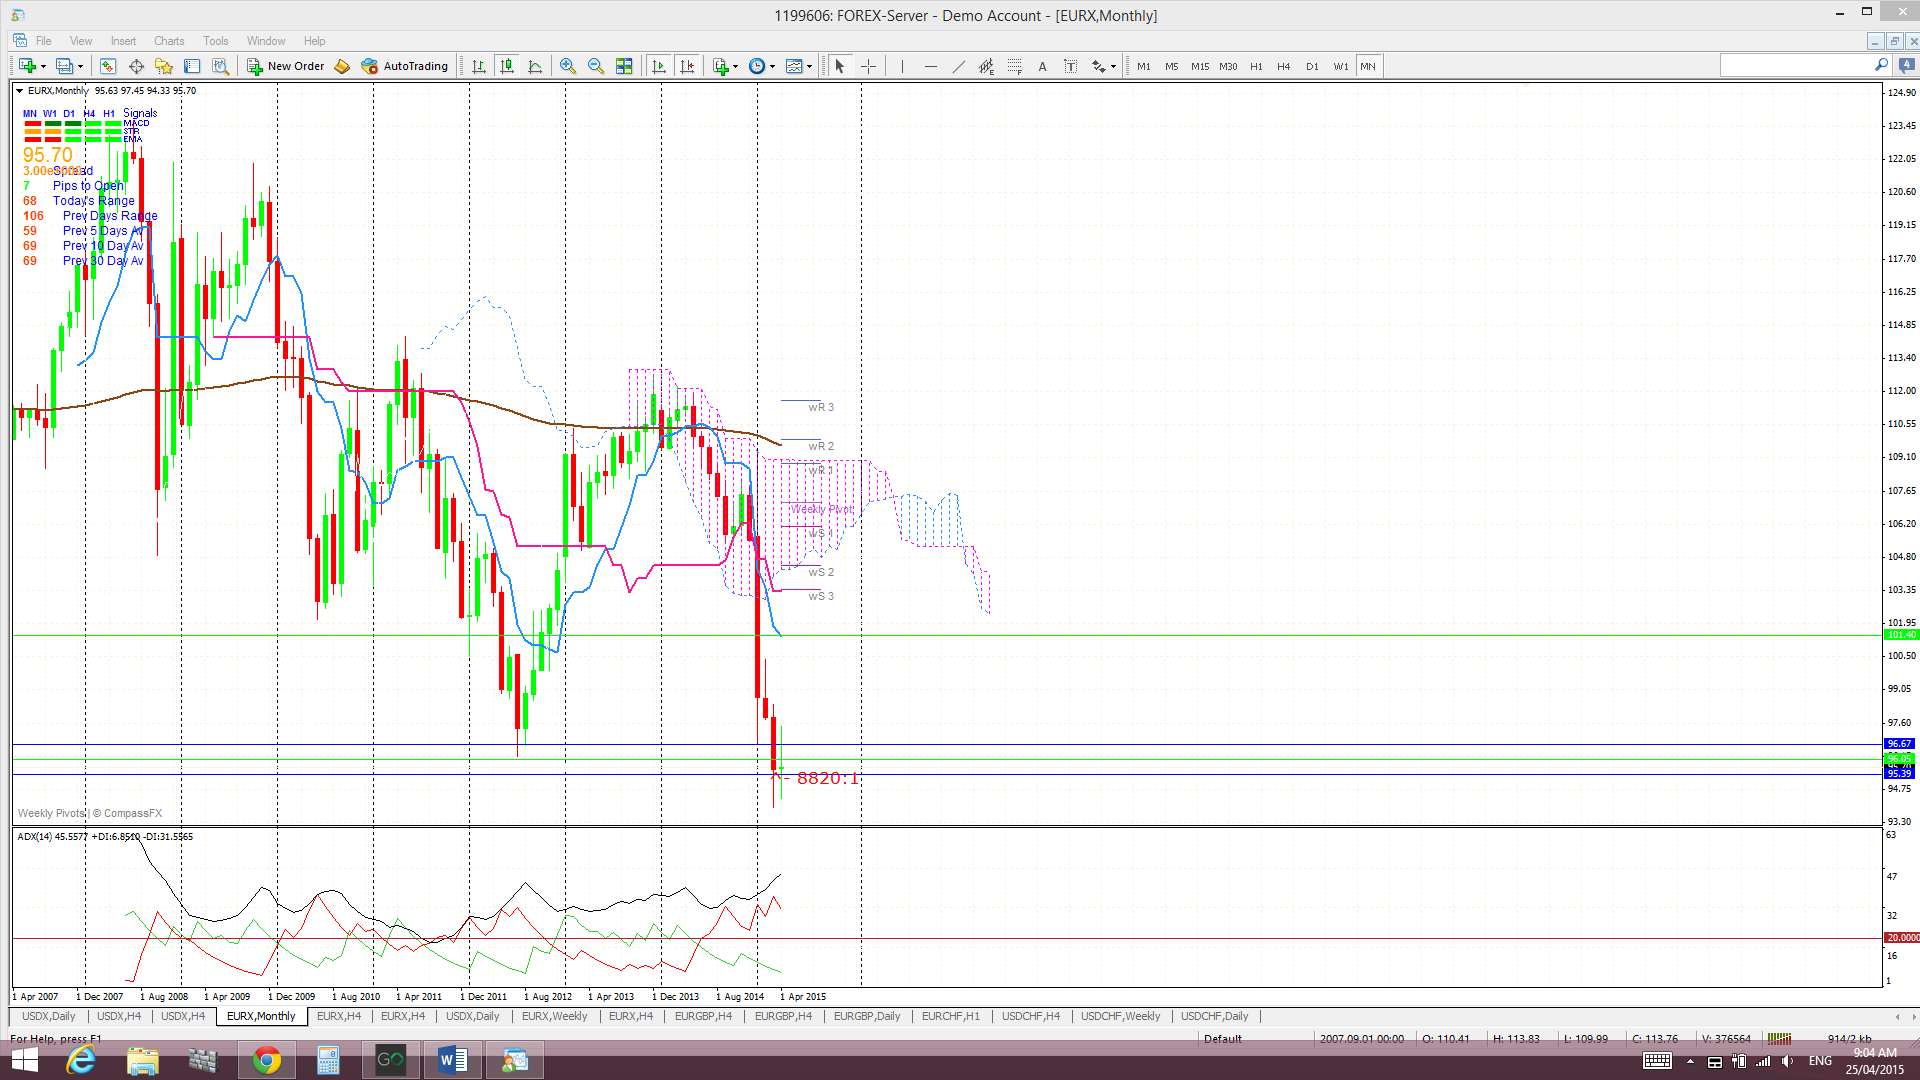
Monthly: The April candle though is printing a bullish coloured Doji but is just below key 96 support.
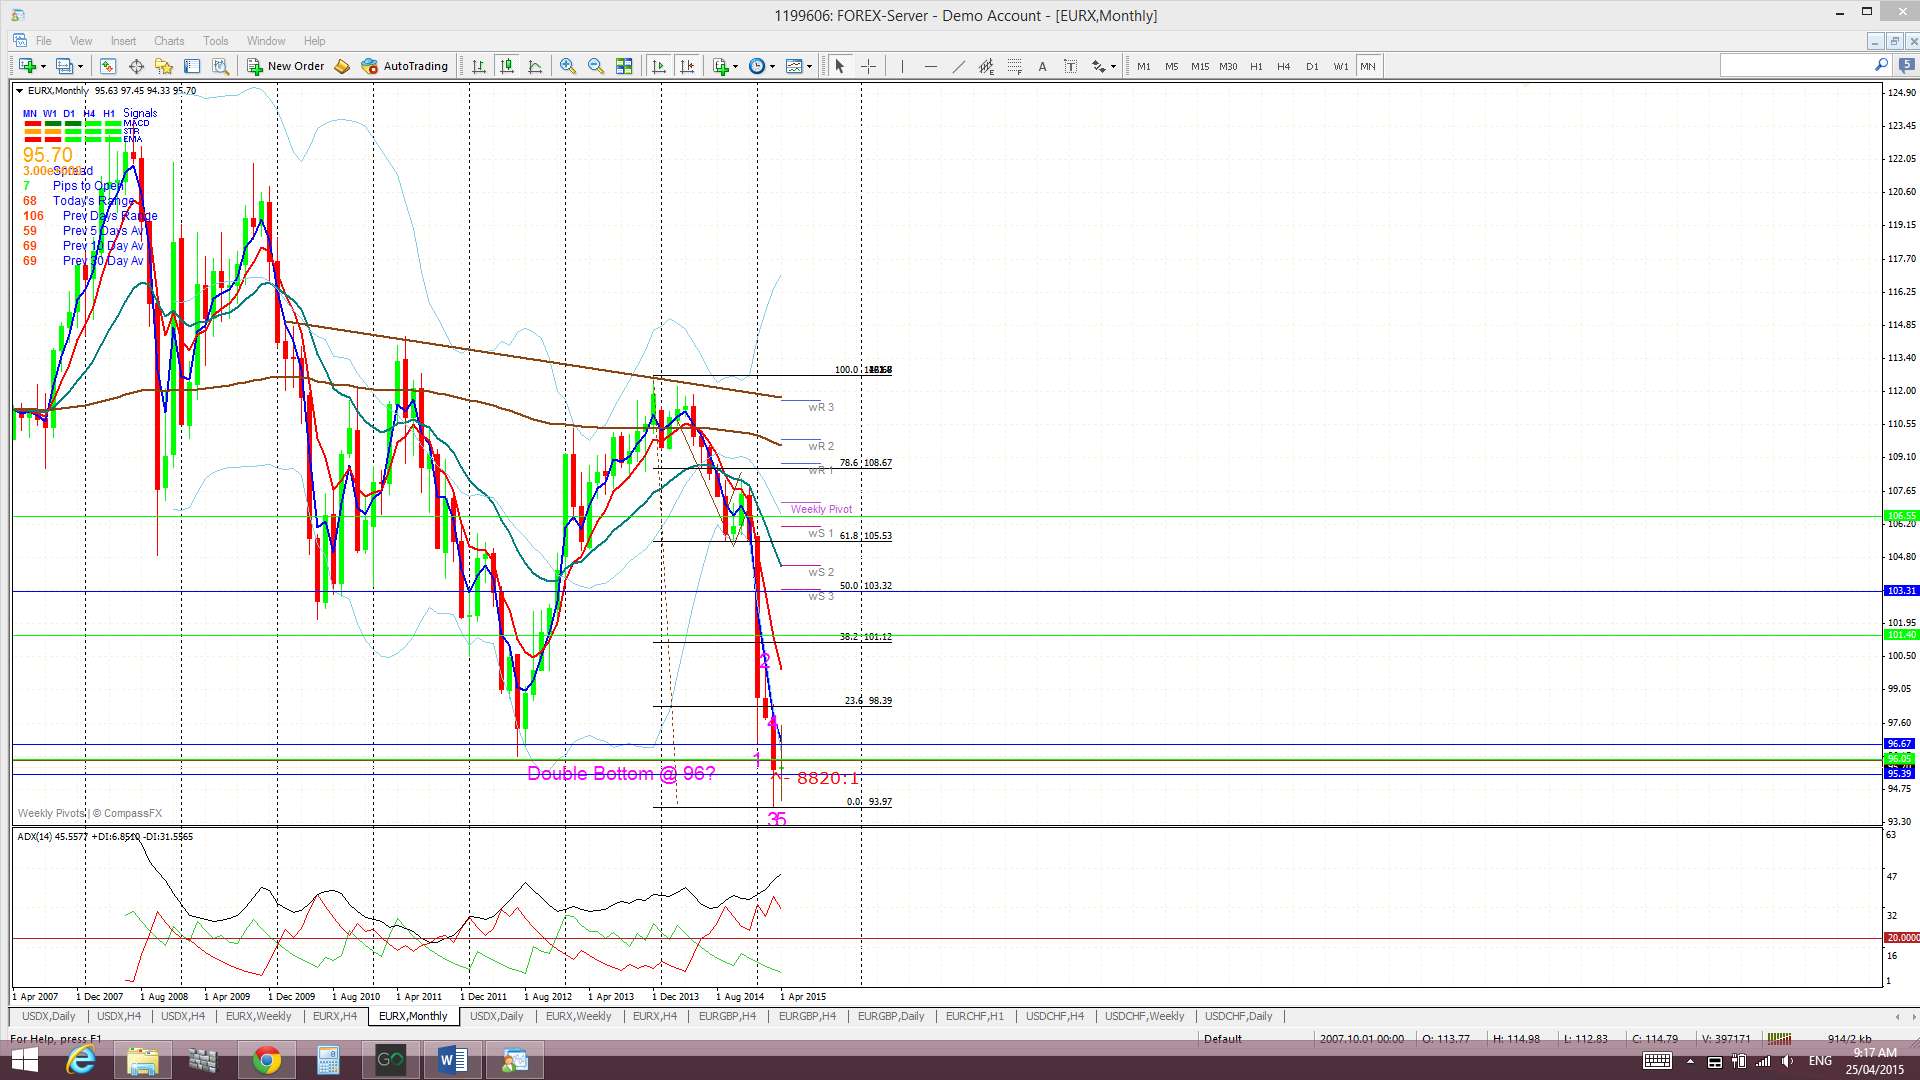
Monthly Ichimoku: The April candle is still below the Cloud.
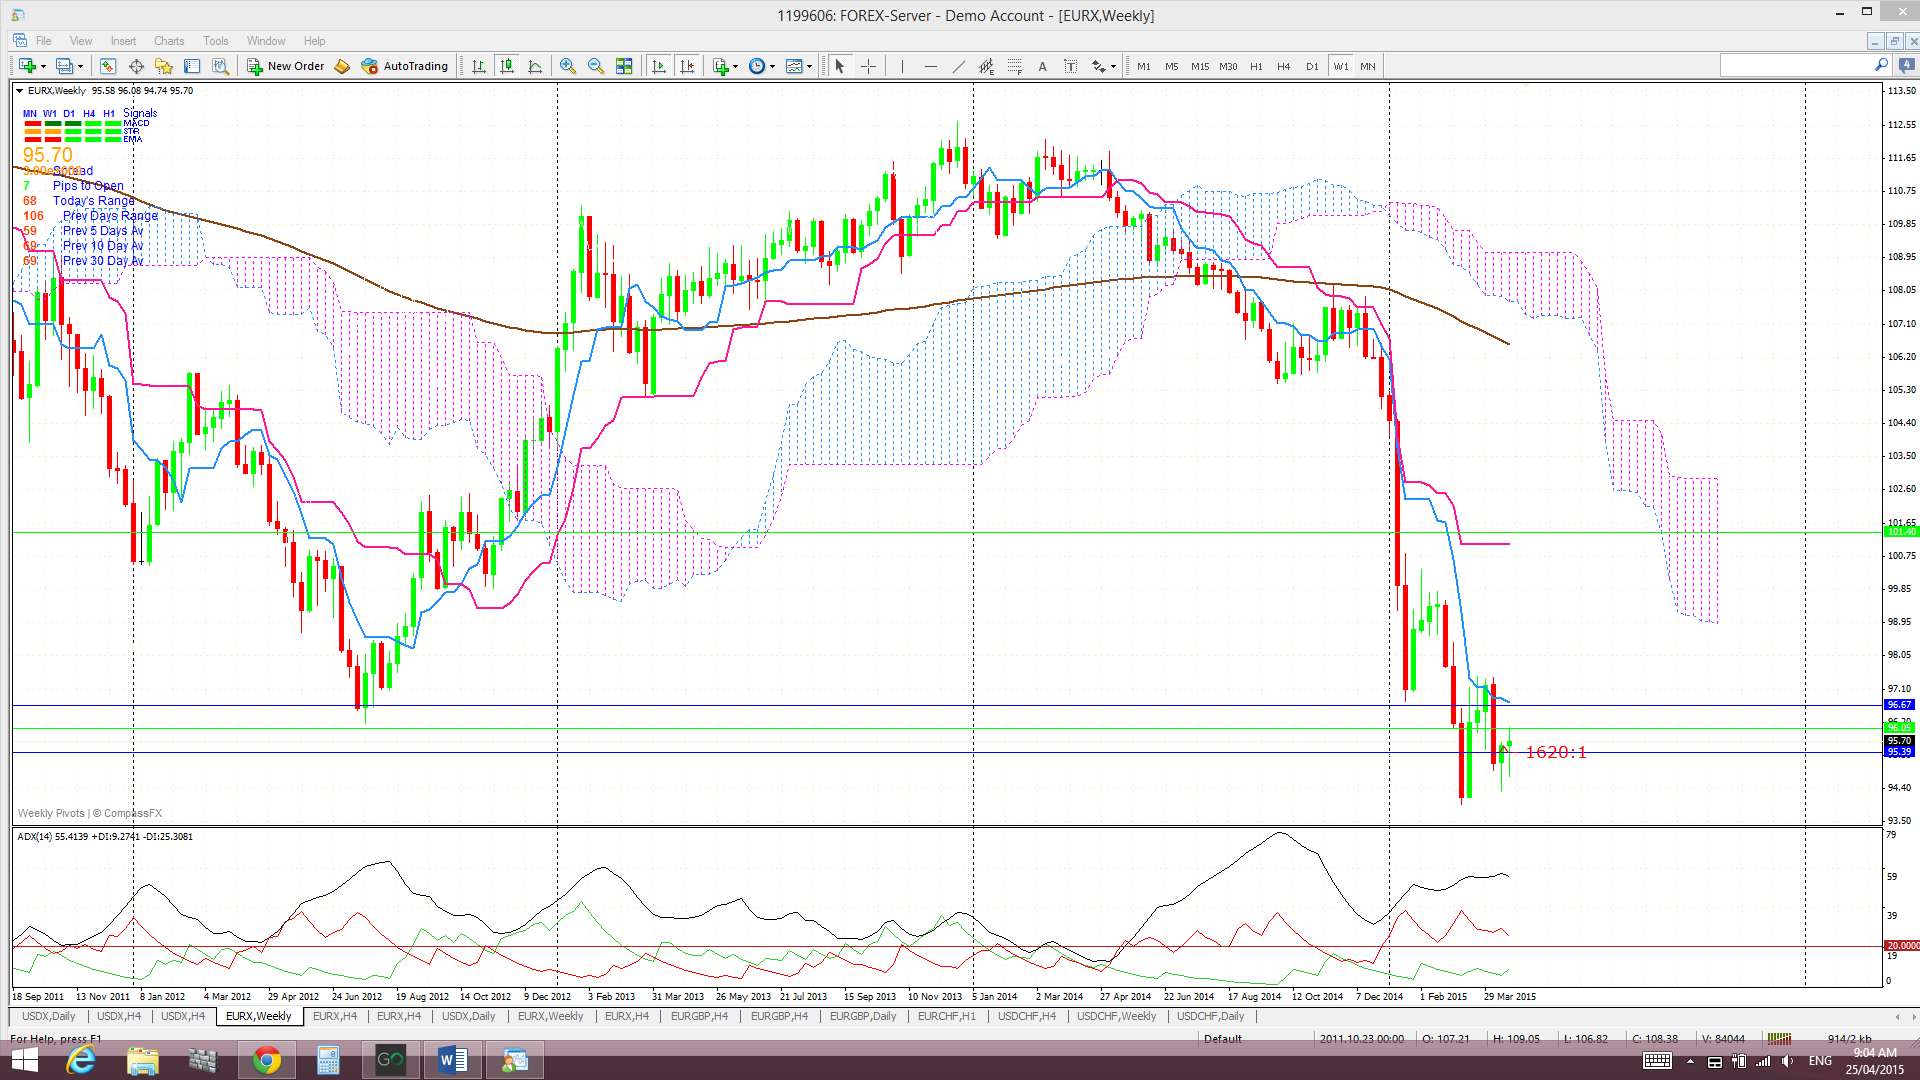
Weekly: The weekly candle closed as a bullish coloured Doji candle. The weekly chart shows that a 61.8% fib retracement of the recent lengthy bear move is back up near the 105.50 level and weekly 200 EMA. Any move back above 96 and continued recovery effort might see the index target this region.

Weekly Ichimoku: Price is still trading well below the weekly Cloud.
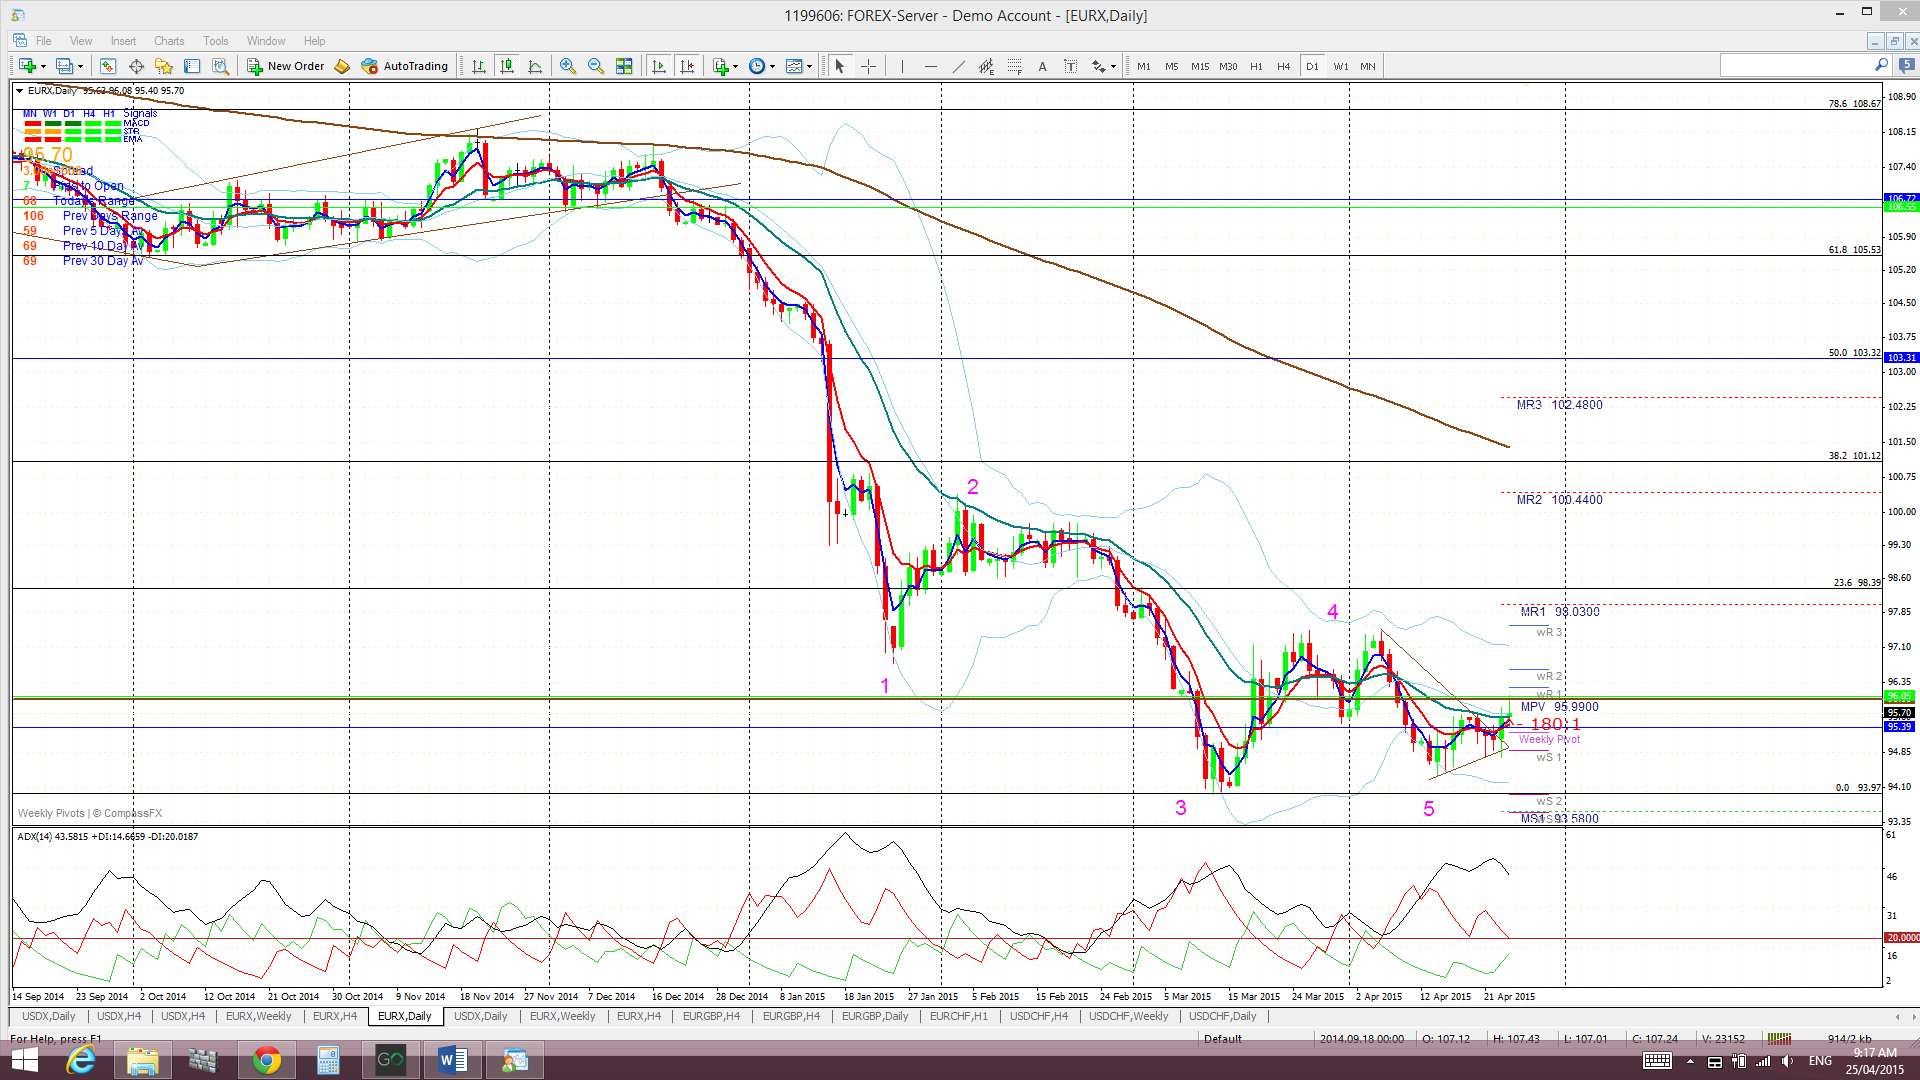
Daily: Price chopped along sideways last week. Note how the daily chart here aligns with the Bear Market Truncation general pattern though. This patterns supports a continued bullish bounce here and was sourced from Steve Burns.

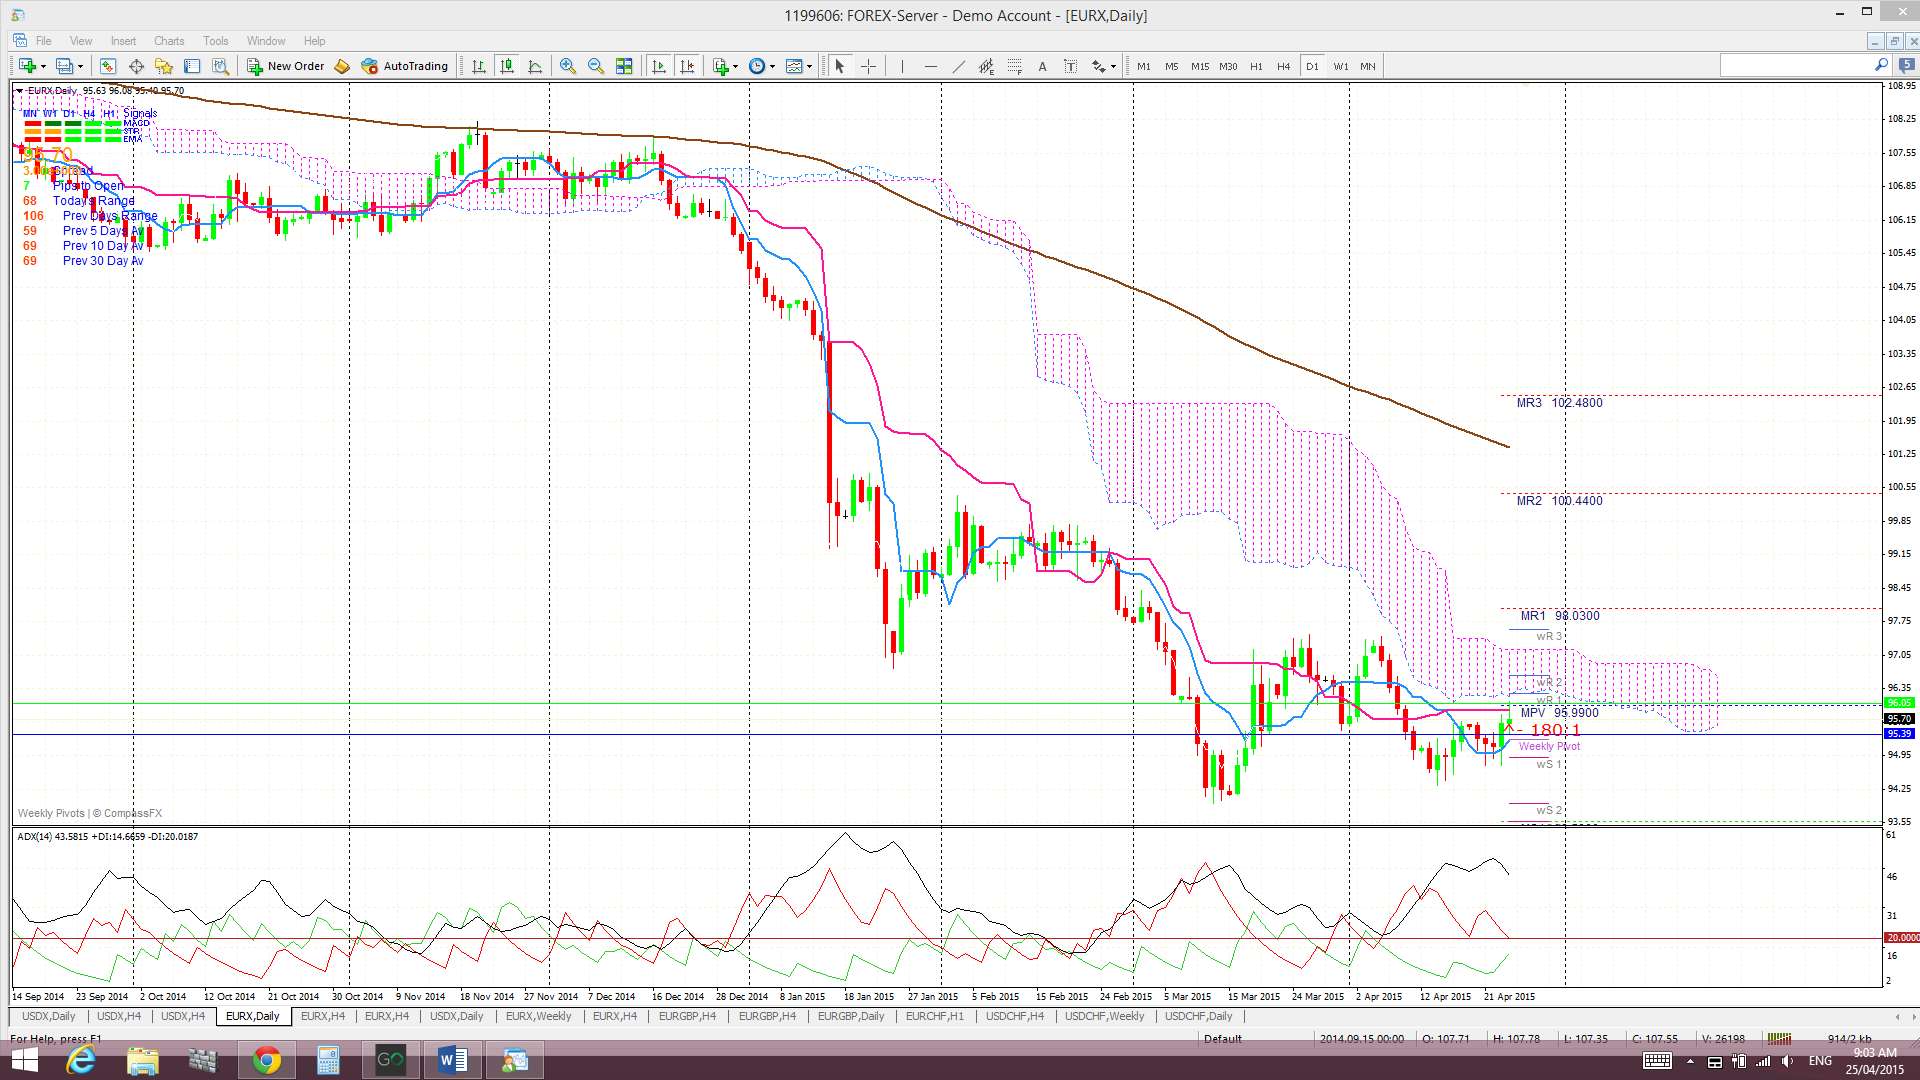
Daily Ichimoku Cloud chart: Price is still trading below the daily Cloud and the bearish Tenkan/Kijun cross remains open.
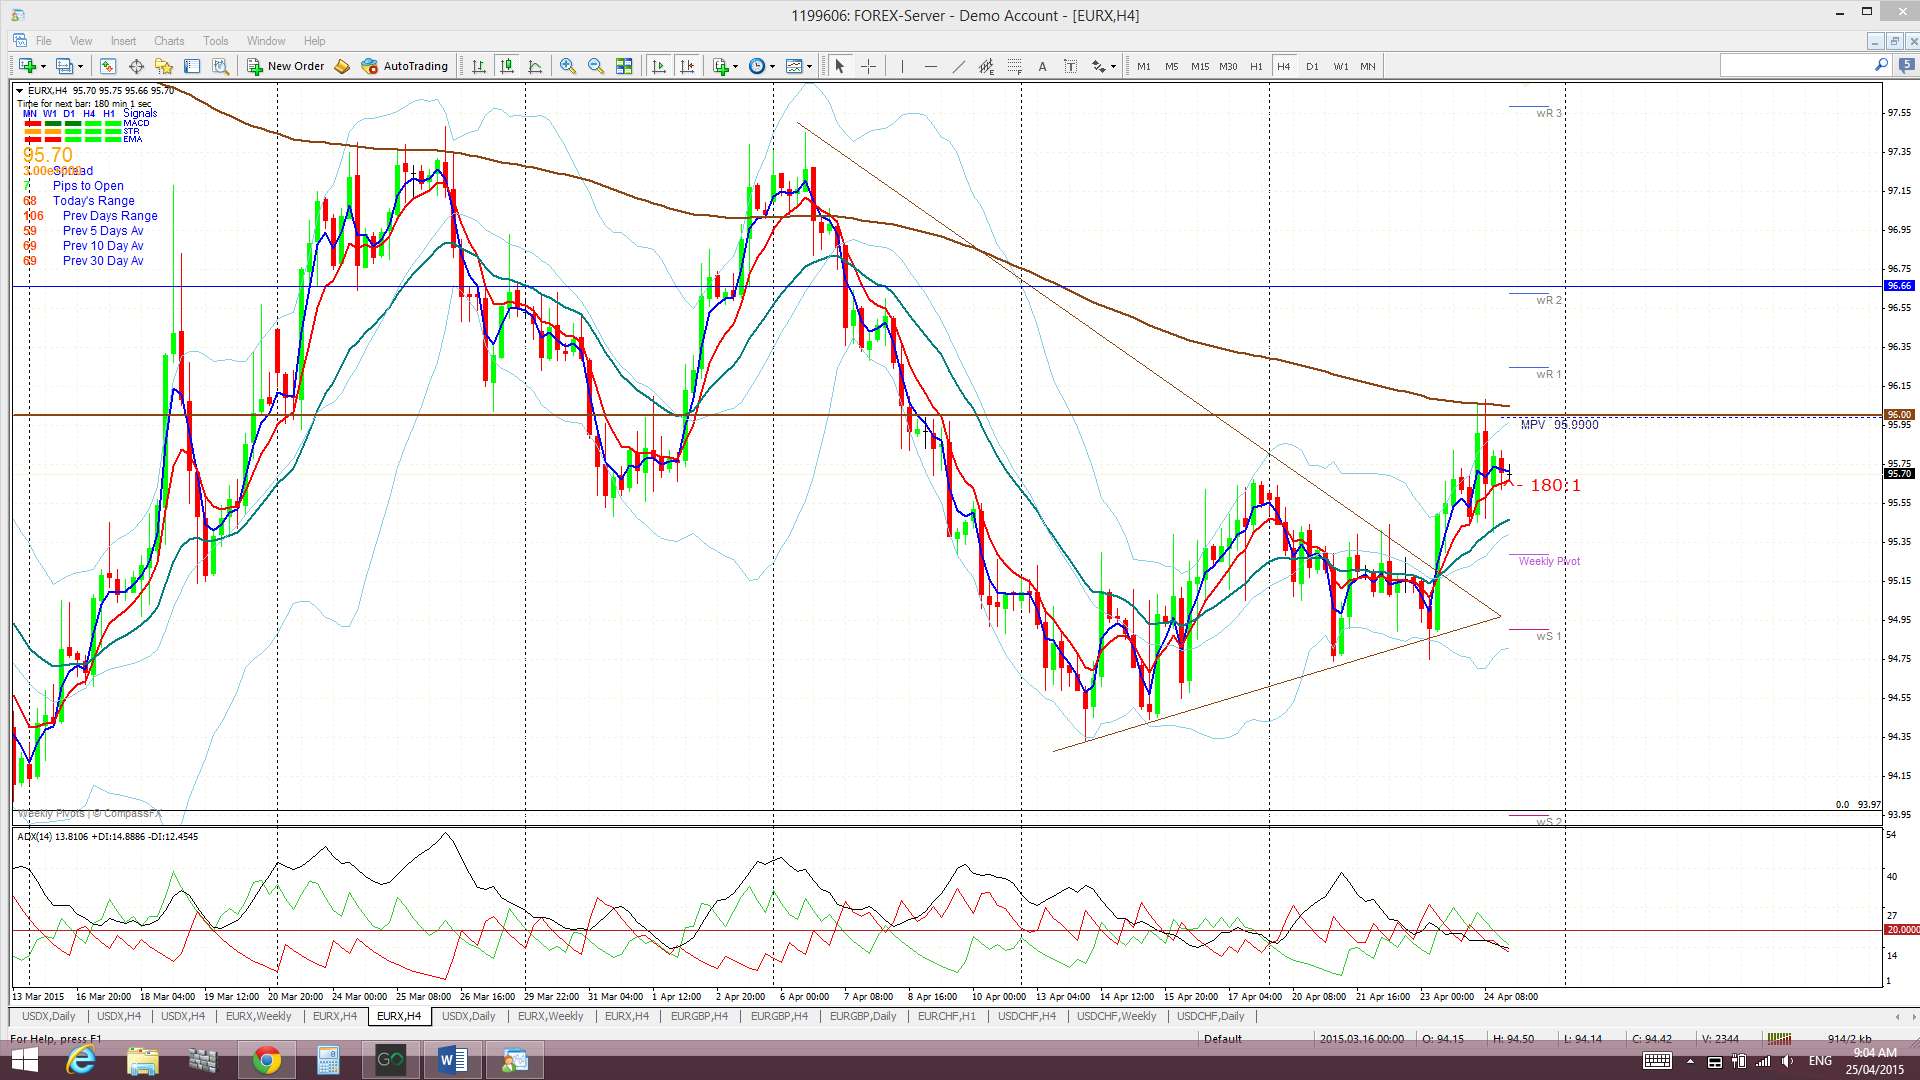
4 hr: Price consolidated within a triangle for much of last week but made a bullish breakout on Thursday. The 96 remains as some resistance though.
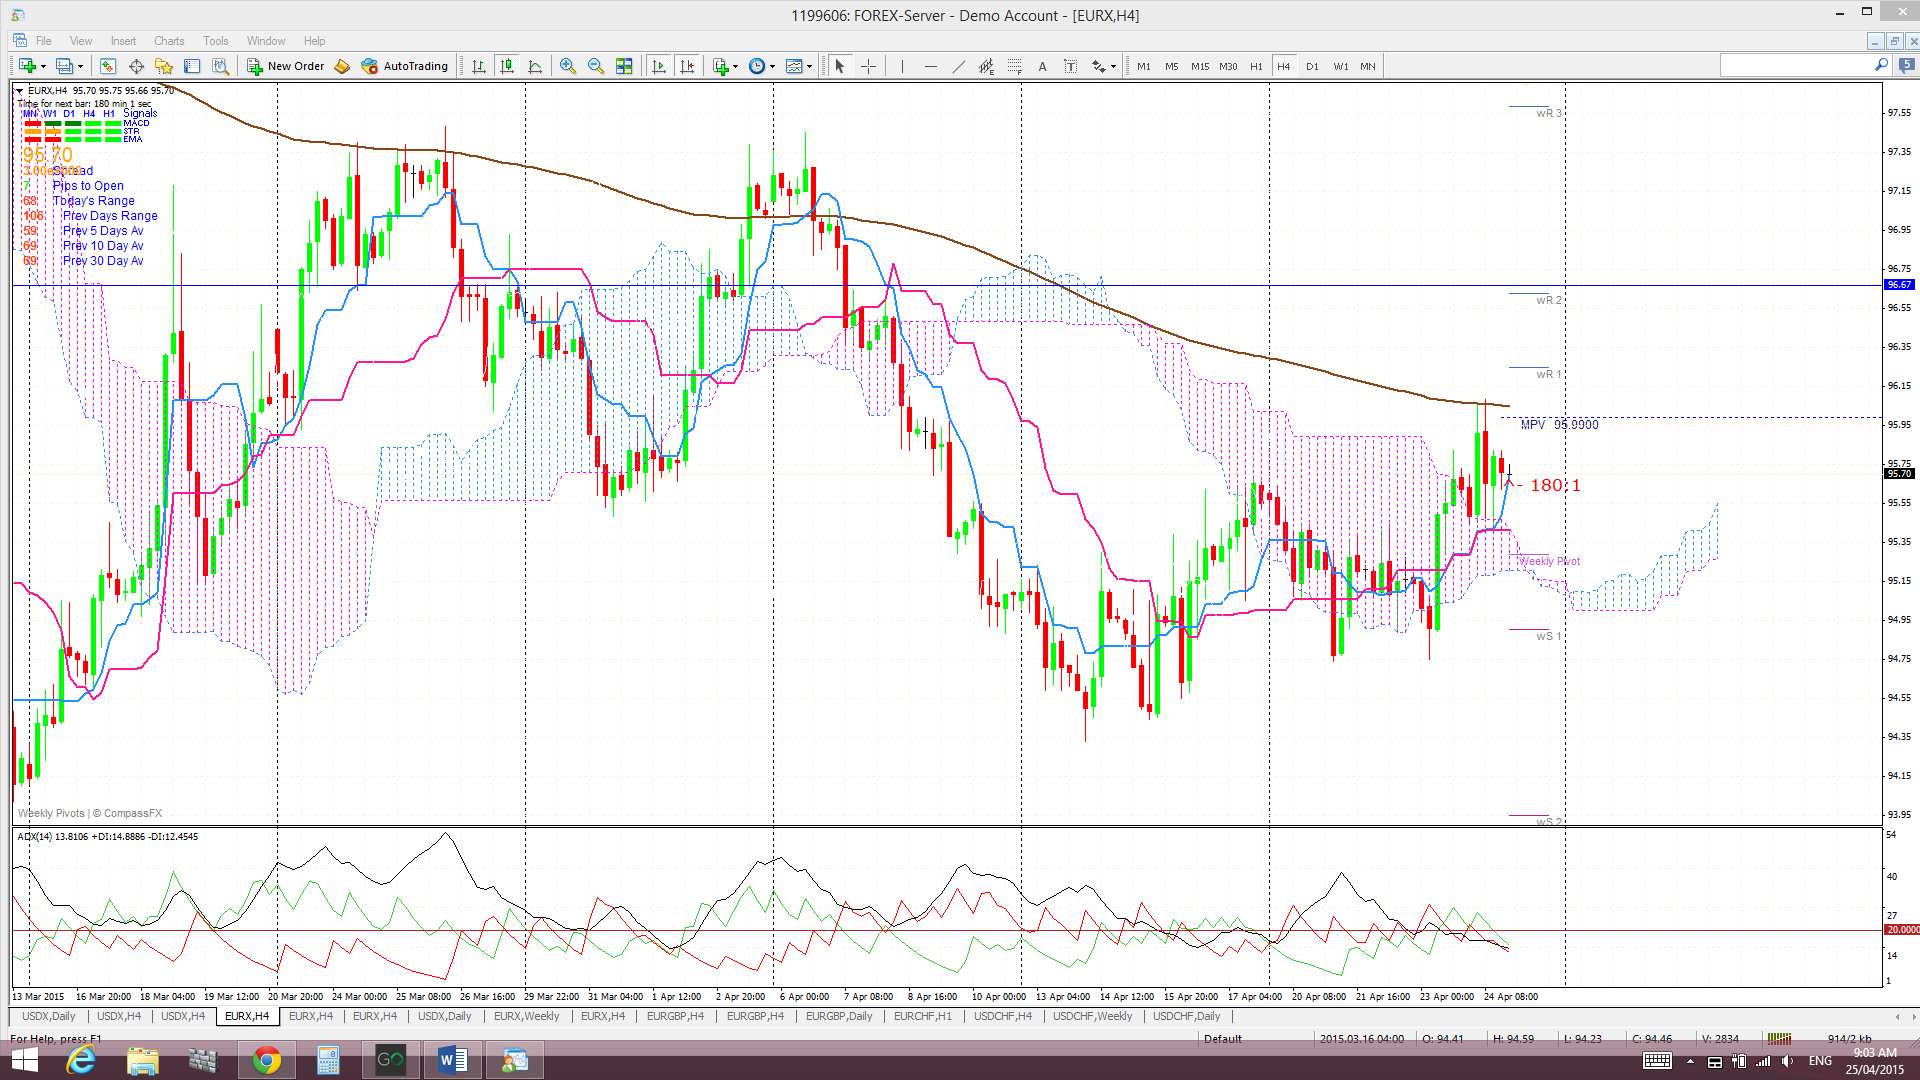
4 hr Ichimoku Cloud chart: The EURX traded in the 4hr Cloud for most of last week but closed just above this resistance region. This chart is divergent from the daily chart and suggests choppiness.
Comments:
Daily and 4hr Cloud alignment: The FX indices are currently out of alignment and this suggests EUR and USD based FX pairs could remain choppy in coming sessions. However, further weakness on the USD index could soon lead to alignment for SHORT US$ trades on the USD index. Added to this, any continued US$ weakness would soon flip the EURX index into alignment for LONG EUR and, if so, this would result in the FX indices being aligned for RISK ON trading. US stock indices already seem to be headed this way and, so, it is conceivable that currencies could soon join them.
USDX: the USDX closed lower last week following a week of further disappointing US economic data. The index has struggled to make a close and hold above the key 100 level and this is helping to shape up a ‘Double Top’ on its charts. The ‘neck line’ of this daily chart pattern looks to be at around 96.50 but my focus is on a lower S/R region at 95.50.
I still prefer to see a new close and hold above 100 before being confident of any sustainable bullish continuation and below 95.50 to be confident of possible bearish follow through. Next week’s FOMC and Federal Funds Rate announcement may bring a decisive breakout move here but, also, the on-going Greek-debt crisis remains a possible trigger event as well. A potential ‘Bull Flag’ pattern has emerged on the USDX charts and, so, another possible outcome is that price action could well just chop around within this pattern until there is some clear resolution of this significant Greek-debt situation. The current Greek bailout arrangement expires in June although officials are hoping for a resolution before then. Thus, one possible scenario is a couple more months of this rang-bound US$.
I see that the key US$ levels to watch as being:
- Any new close and hold above 100 would support bullish continuation.
- Any new close and hold below 95.50 would support a deeper pullback.
EURX: The EURX closed slightly higher again last week despite continued anxiety about Greek debt repayment and a possible Grexit. Divergence between the EZ and US economies continues to be a dominant theme with the Eurozone entering a monetary easing cycle with the US emerging from one but continued US$ weakness has again helped to boost the EURX.
The levels to watch on the EURX, apart from the key 96 level, include:
- 105.5: The weekly chart reveals that a 61.8% fib retracement of the recent lengthy bear move is back up near the 105.50 level and weekly 200 EMA. Any move back above 96 and continued recovery effort might see the index target this region.
- 94: Any hold below 96 might suggest bearish continuation as it represents a break of a monthly chart ‘Double Top’. If so, the recent low printed near 94 will come back into focus.
Note: The analysis provided above is based purely on technical analysis of the current chart set ups. As always, Fundamental-style events, by way of any Ukraine, Ebola, Eurozone or Middle East events and/or news announcements, continue to be unpredictable triggers for price movement on the indices. These events always have the potential to undermine any technical analysis.
The post US$ weakens under the ‘Double Top’. appeared first on www.forextell.com.