The US$ weakened after the FOMC rate hike due to less hawkish than expected commentary from the the Fed Chair Janet Yellen. The US$ index has fallen below the support of the Ichimoku Cloud and a recent trend line but managed to hold above the psychological 100 level to see out the week. The 100 level is in focus for both the EUR$ and US$ indices next week and will be the one to watch in coming sessions for any make or break activity on both!
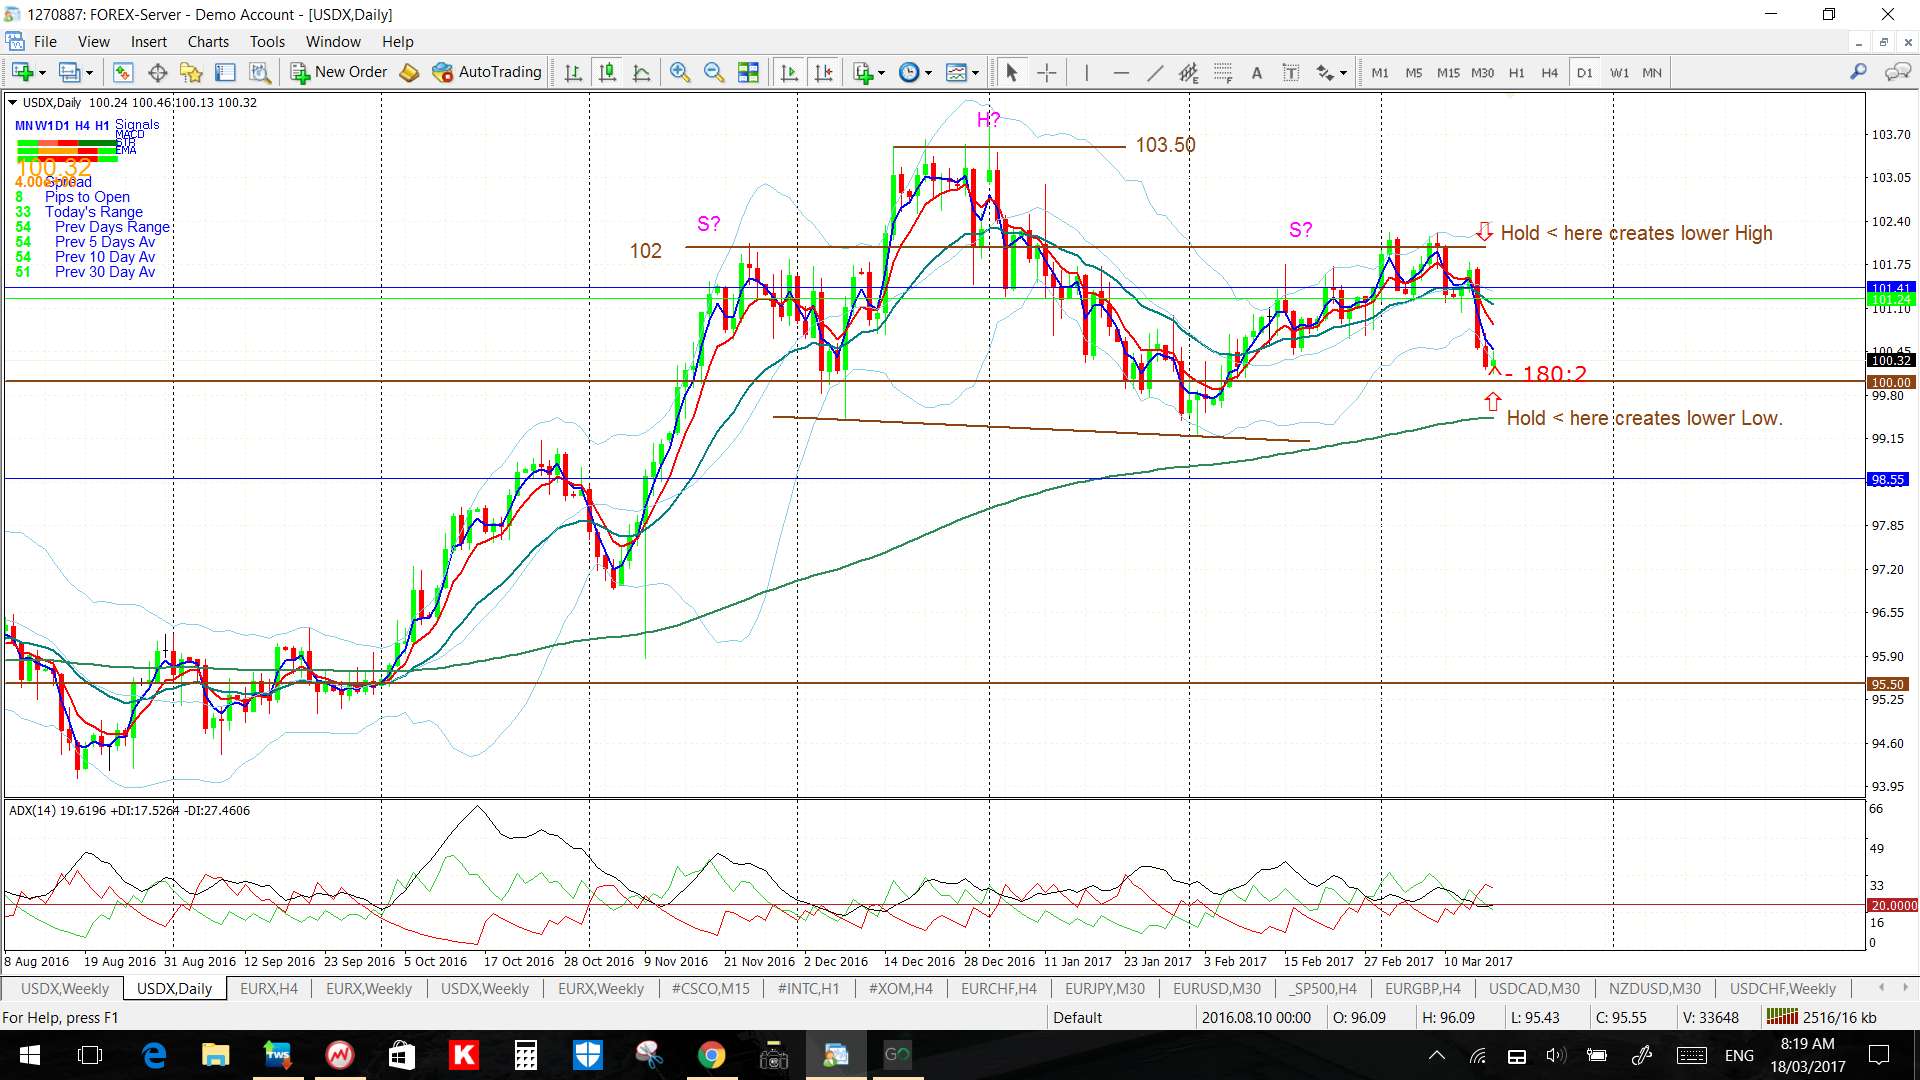
USDX daily: watch next week for any make or break at the 100 level. Any hold above this support would bring 102 resistance back into focus:
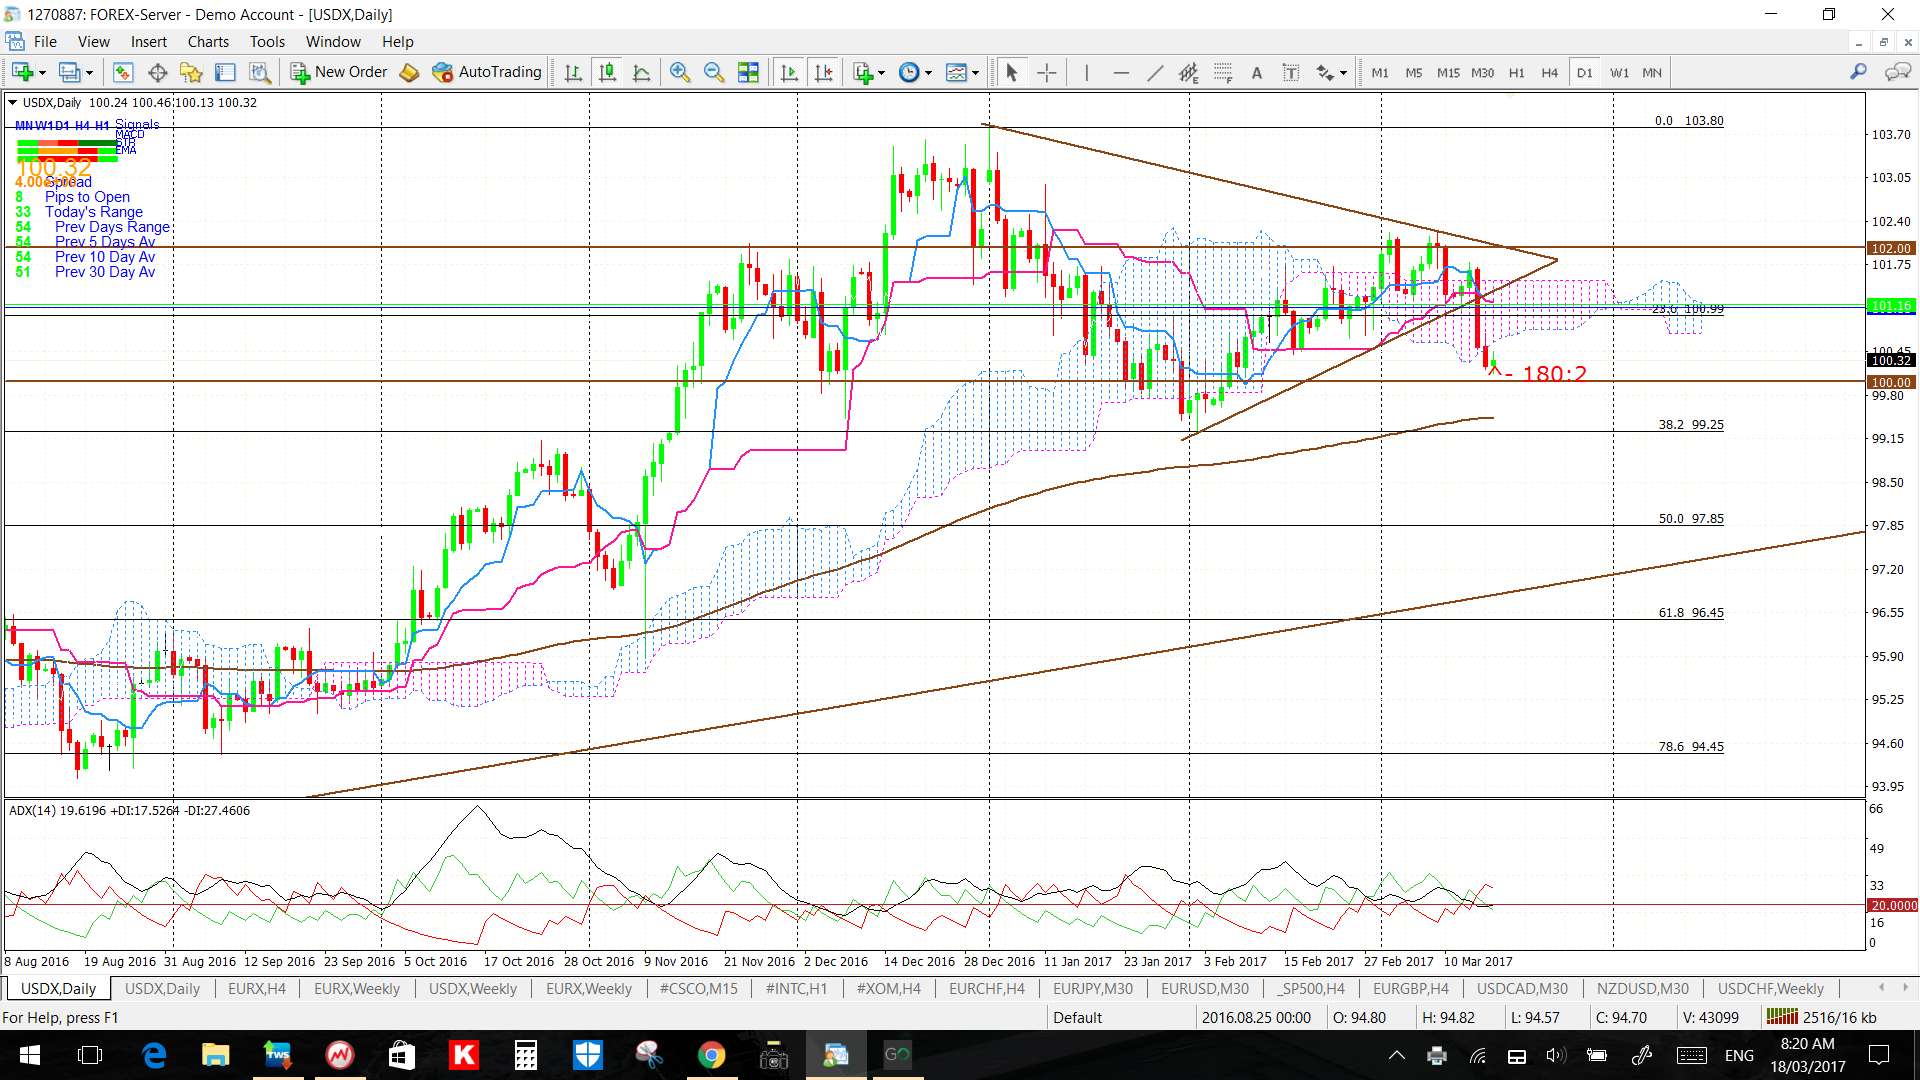
USDX daily Cloud: price fell below the support of the daily Cloud and a recent triangle trend line.
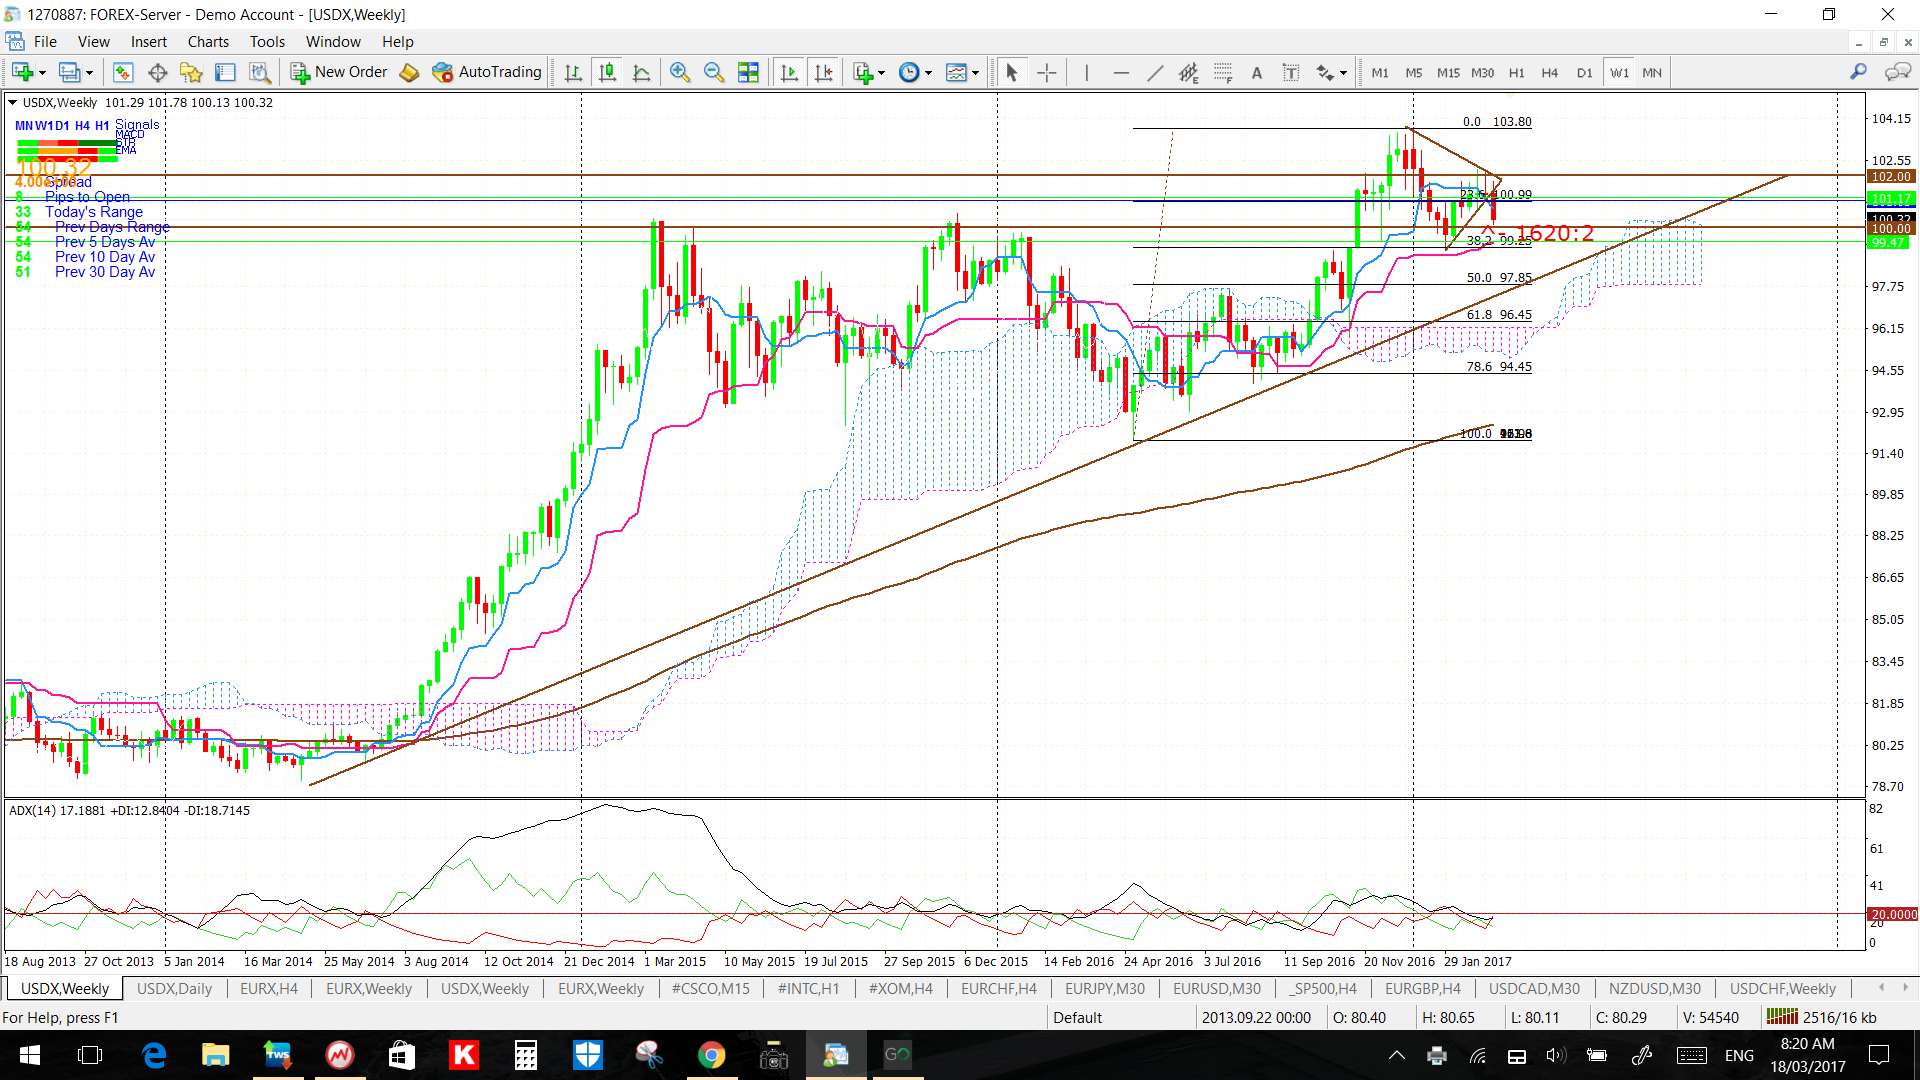
USDX weekly: the previous week’s bearish-reversal ‘Shooting Star‘ weekly candle should have been enough warning! The weekly candle from the week just closed was large and bearish but note how price action is still above a long-term support trend line. Note also how the 61.8% fib of the last swing high move is down near the top of the weekly Cloud. Thus, the levels to watch with any bearish continuation are: 100 and then whole numbers followed by the weekly support trend line and then the 61.8% fib and weekly Cloud junction near 96.50.
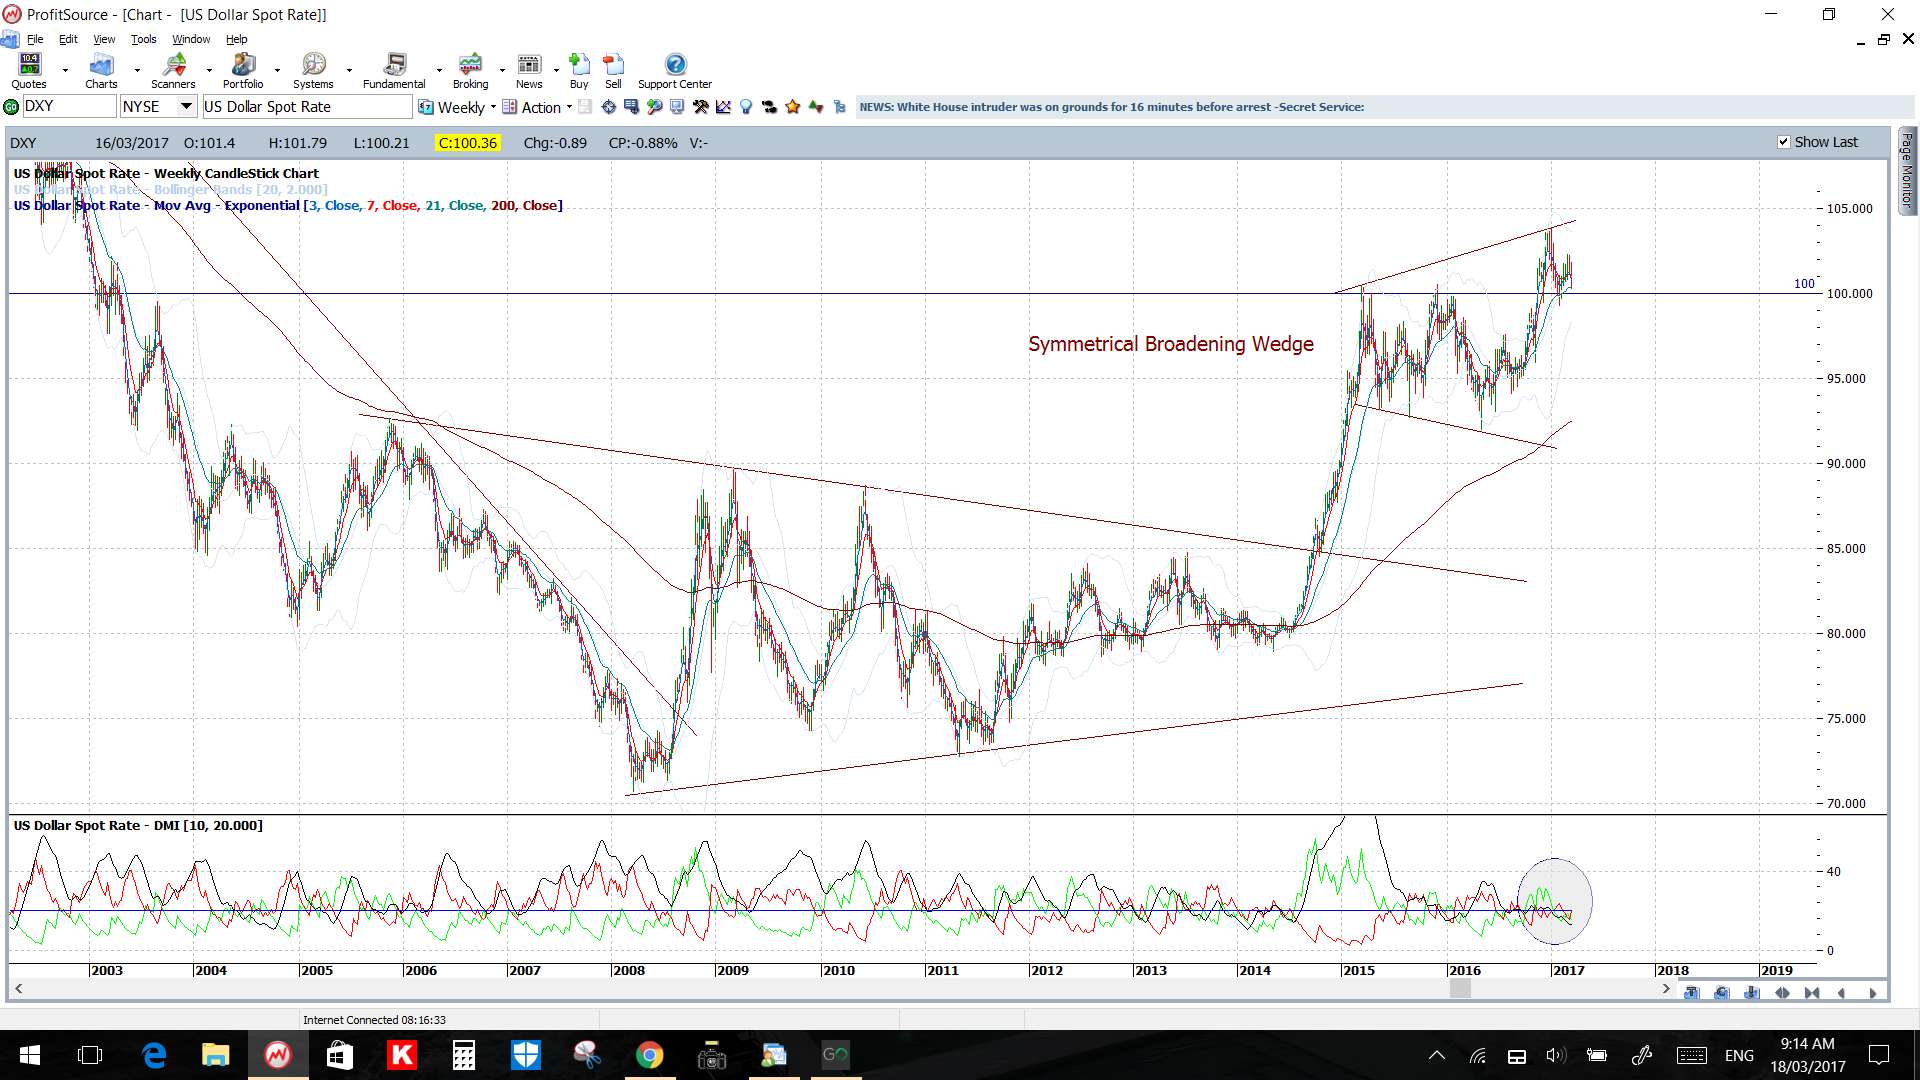
USDX weekly: keep in mind though that the US$ has been shaping up in a larger ‘Symmetrical Broadening Wedge’ pattern and, as this website suggests, the exit can be random, that is, either bullish or bearish.
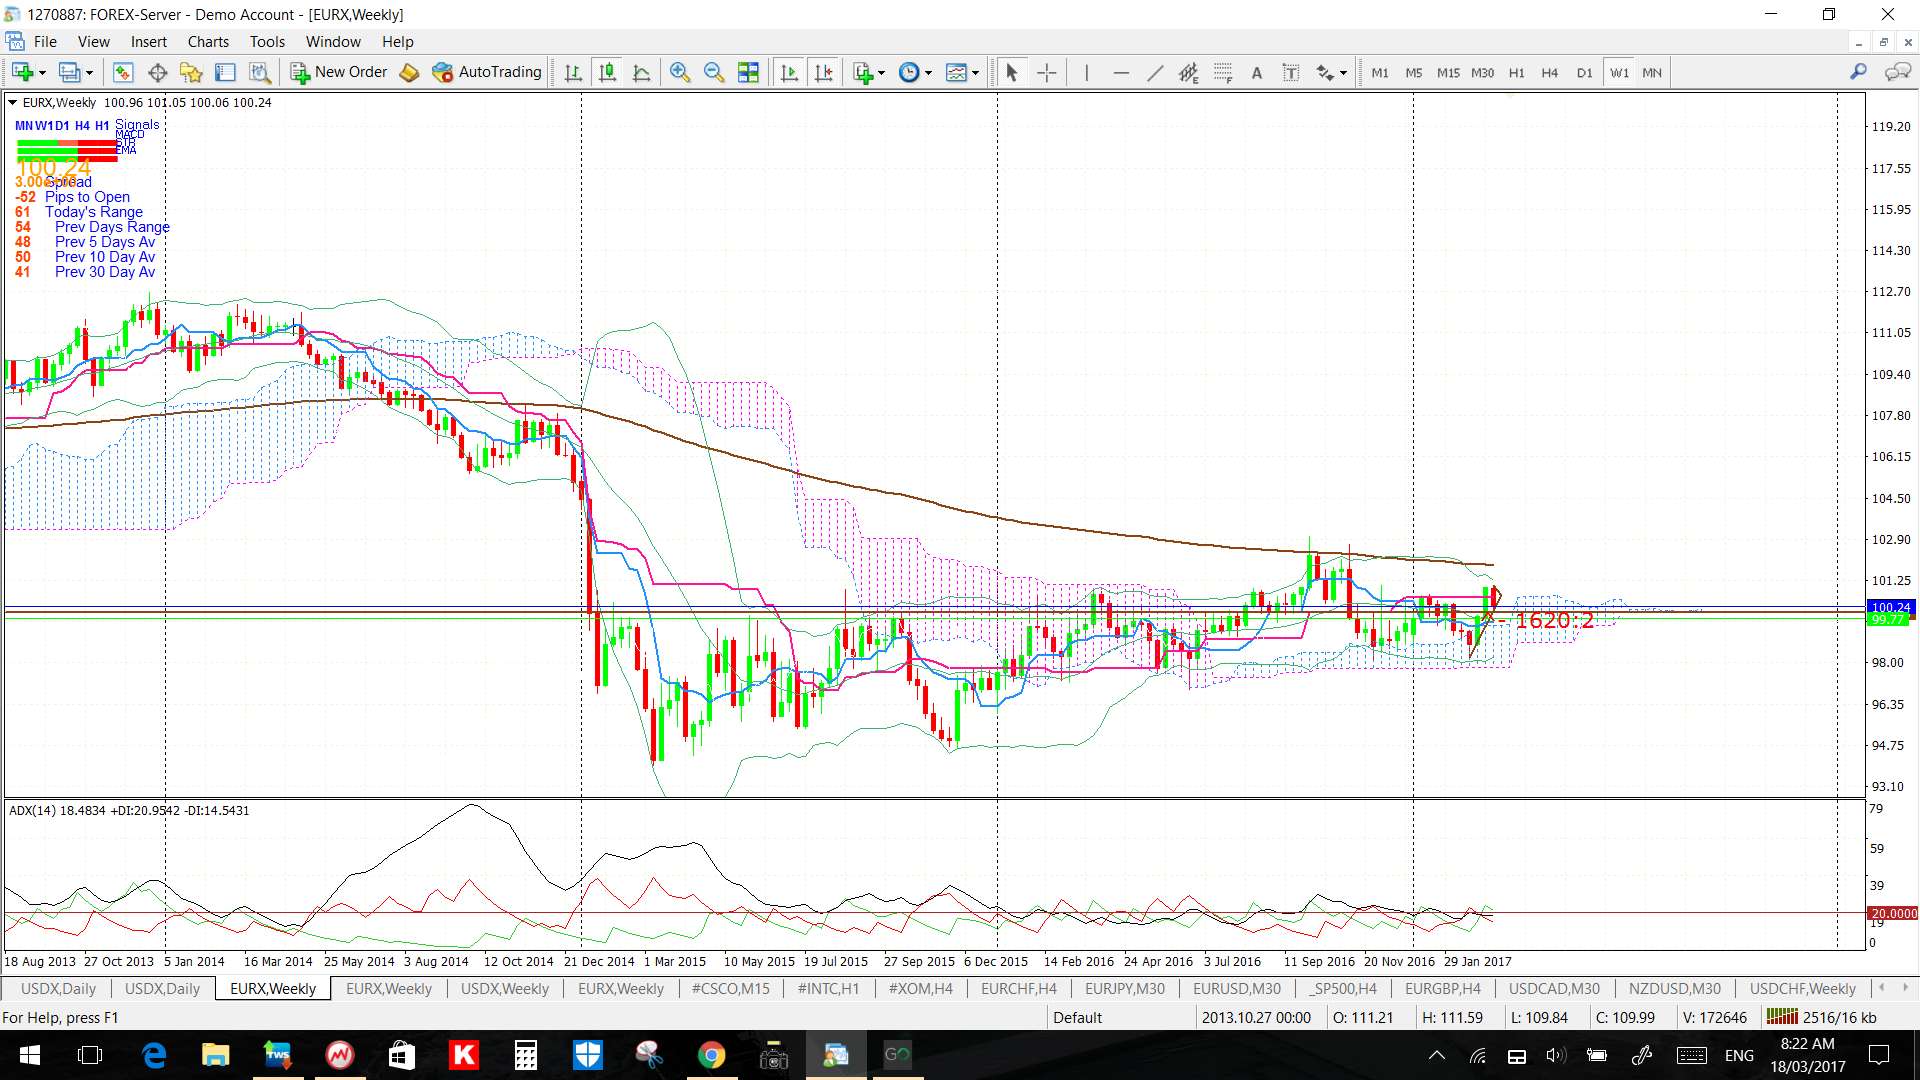
EURX weekly: this index closed the week with a bearish coloured ‘Inside’ candle reflecting ‘indecision’ but managed to hold above the Ichimoku Cloud and the key 100 level. There has been less dovish rhetoric coming from the ECB though with mention that rates could rise before the end of QE and so traders need to keep this potential shift in bias in mind when contemplating EUR$ pairs.
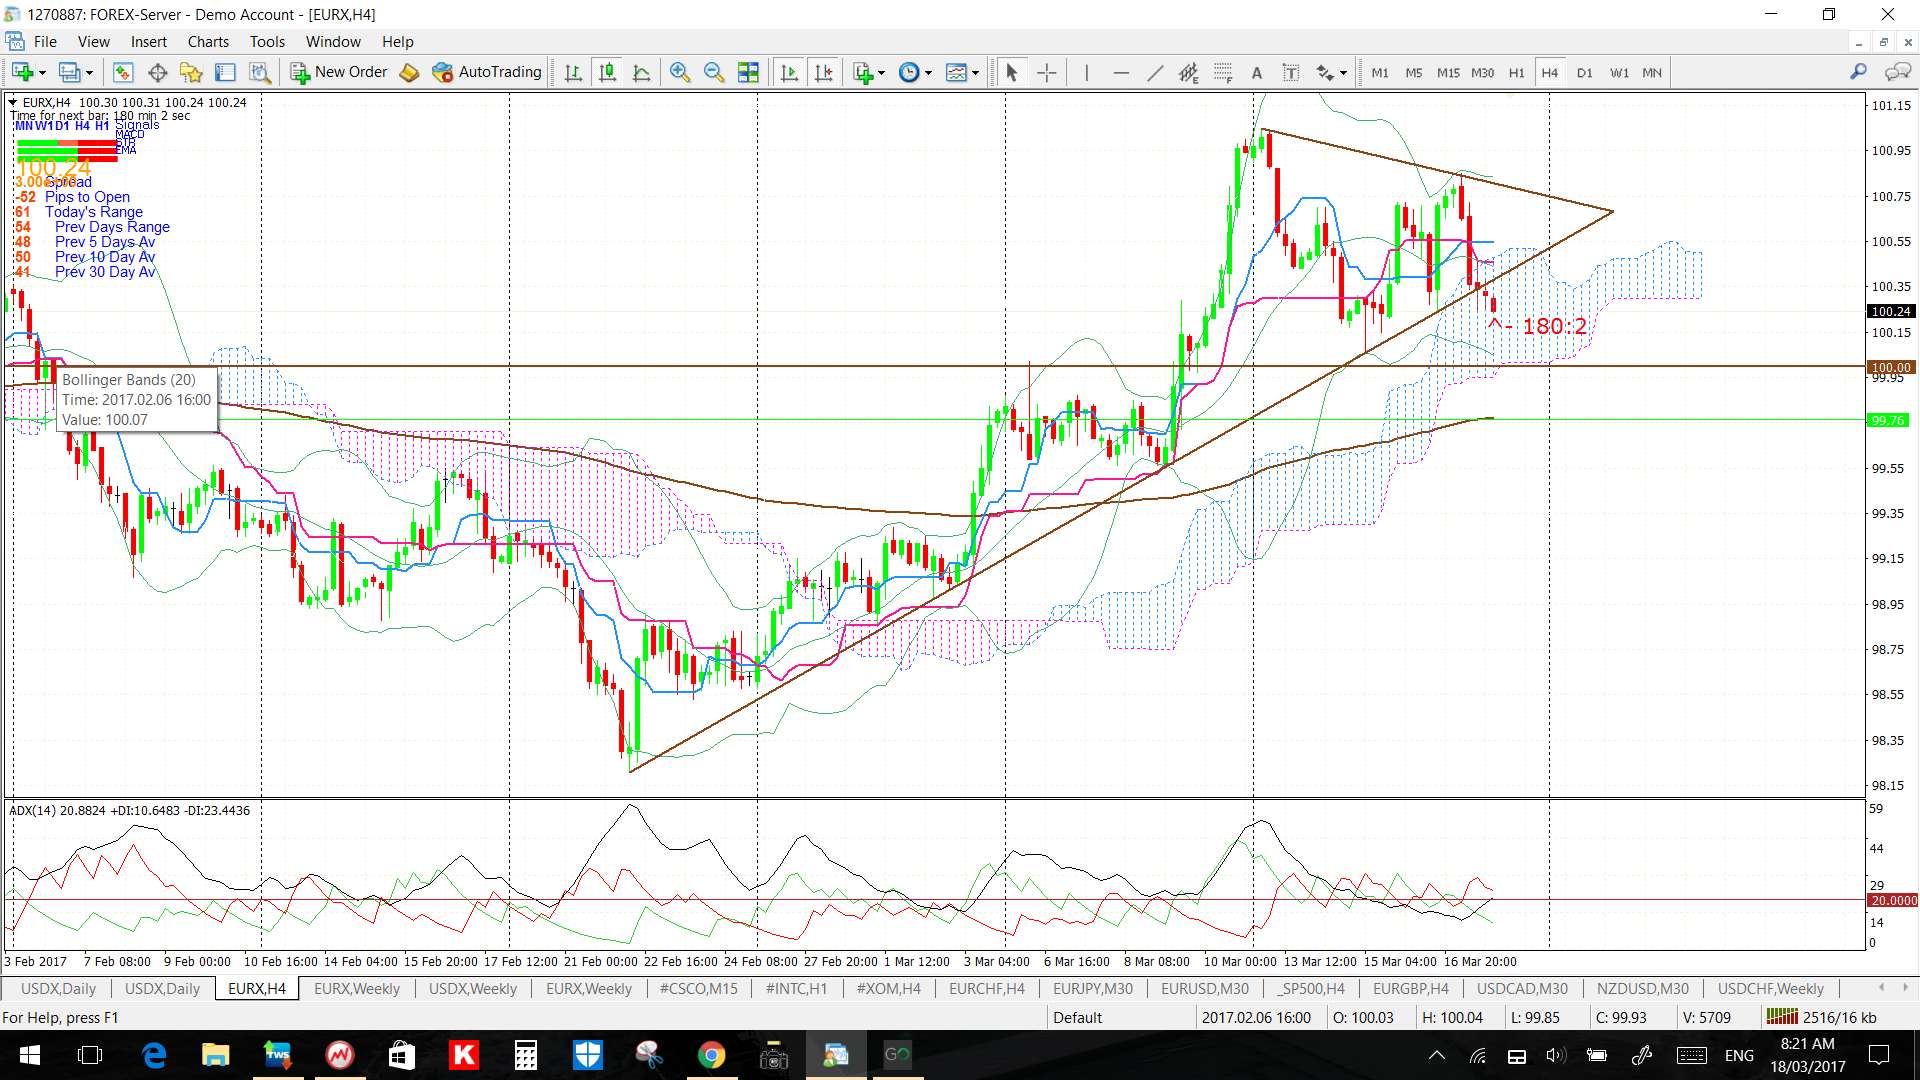
FX Index Alignment: I noted yesterday how the FX Indices had moved back into alignment but that has been short lived. The US$ is below the Cloud on the 4hr and daily chart and still aligned for SHORT US$. However, the EURX is above the Cloud on the daily chart but has slipped back into the Cloud on the 4hr chart and so is back to being divergent. I’ll be watching for any EURX support coming from the bottom of the 4hr Cloud which is rather near the key 100 level:
Calendar: there isn’t a lot of USD-sensitive high impact data next week but watch out for any impact from the w/e G20 meetings and the Trump and many US Federal Reserve member speeches.

Summary: watch the following levels on both FX Indices:
- USDX: 100 and then whole numbers followed by the weekly support trend line and then the 61.8% fib and weekly Cloud junction near 96.50.
- EURX: 100.
The post US$ weaker after FOMC. appeared first on Trade Charting.
The post US$ weaker after FOMC. appeared first on www.forextell.com.