USDX
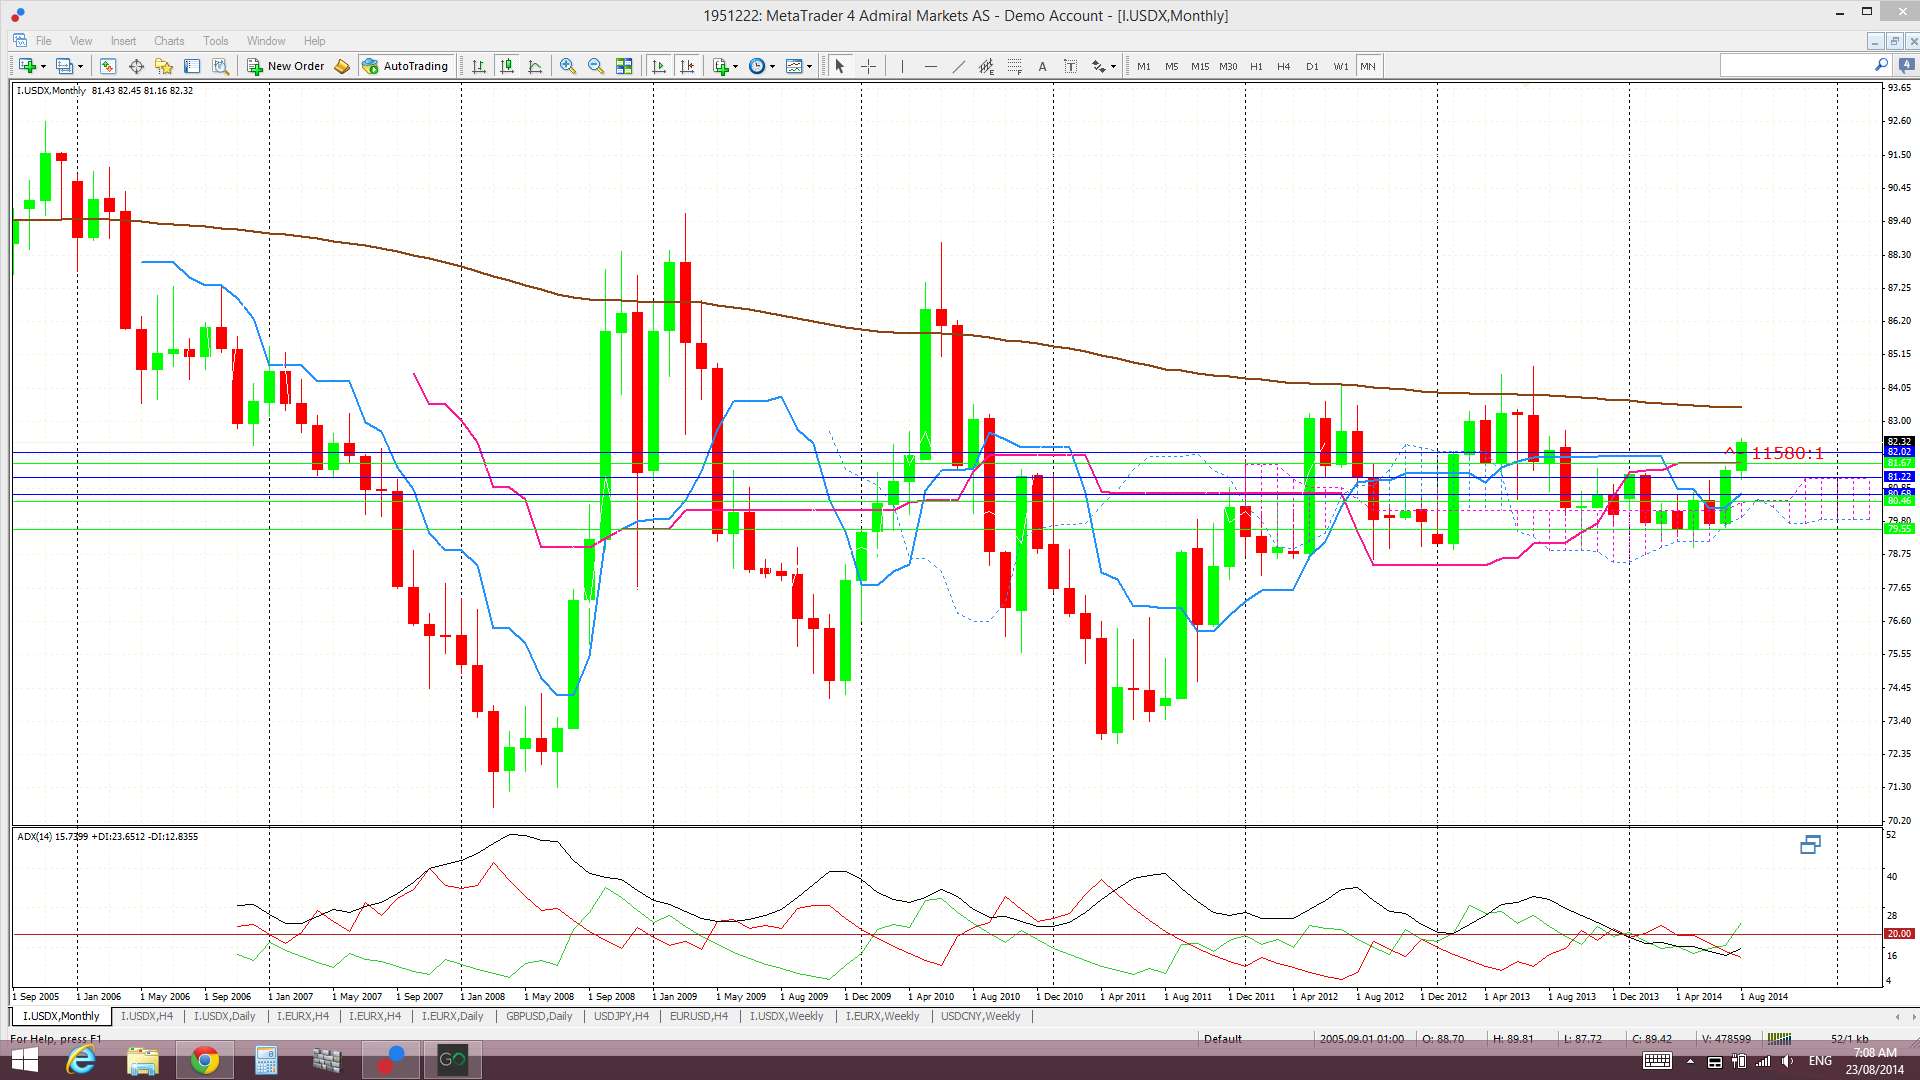
Monthly: What a difference a week makes! The August candle has gone from printing a bearish coloured ‘Spinning Top’ last week to printing a decent sized bullish candle this week.
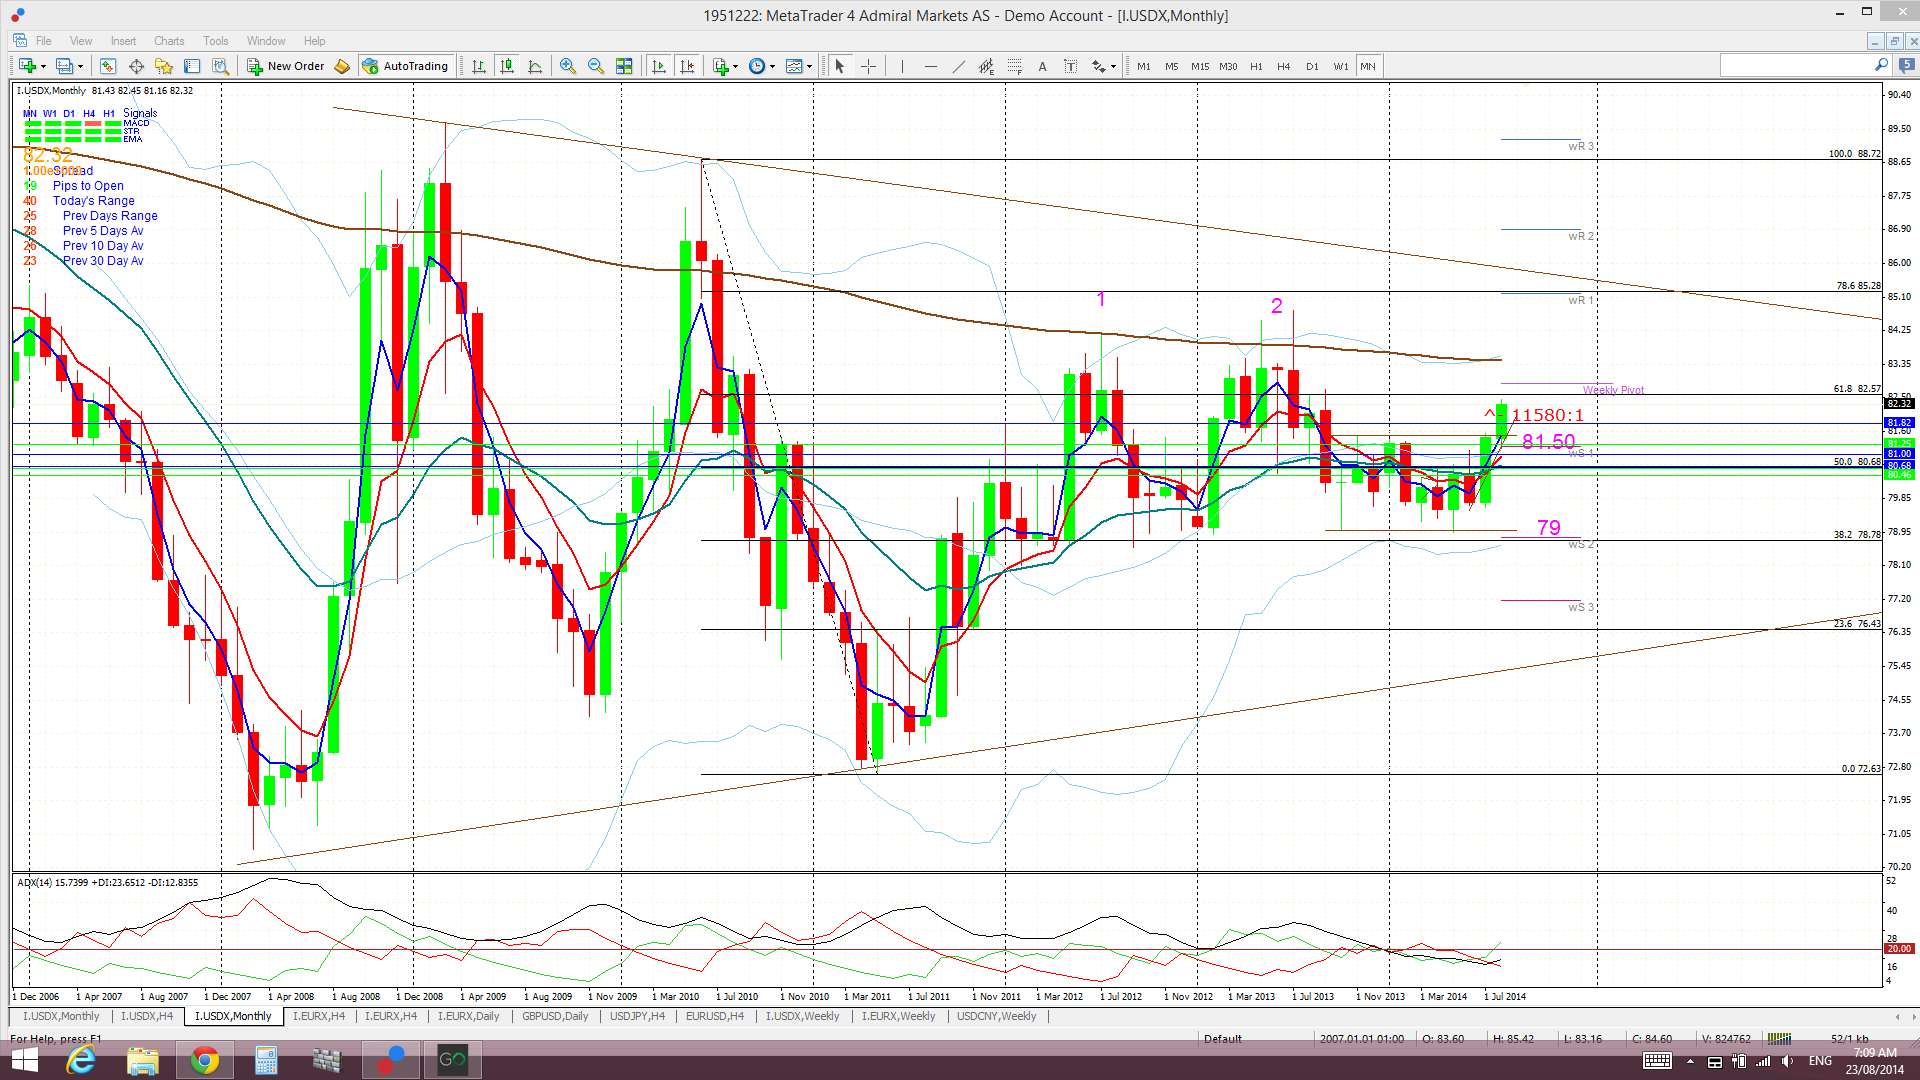
Monthly Ichimoku: The Aug candle is trading above the monthly Cloud. The Cloud band continues as rather narrow, bearish in nature and spanning horizontally. The monthly Cloud chart shows that, whilst the index had spent much of the last 6 months within the monthly Ichimoku Cloud, it is now trading freely above the Cloud. Decent tending markets might return if this index can remain free of the monthly Cloud and we have seen a glimmer of this during the last week.
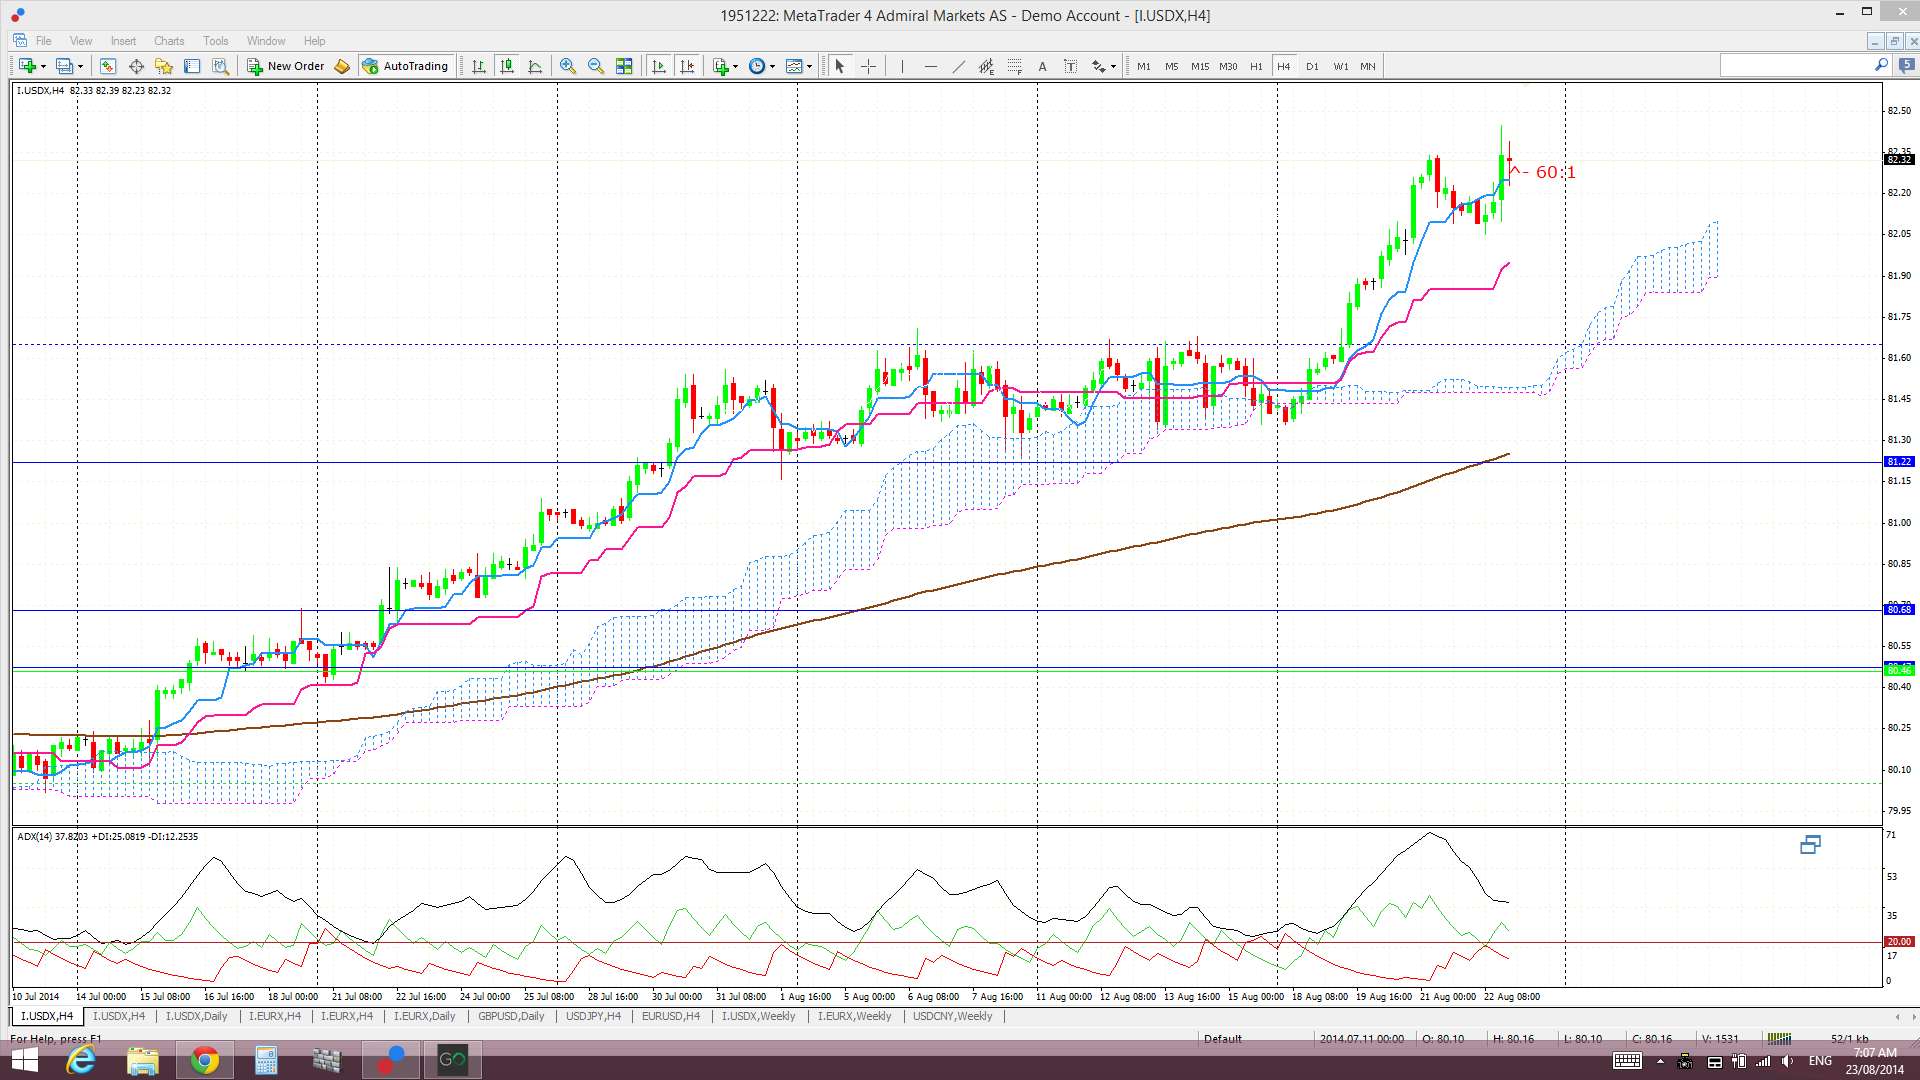
Weekly: The weekly candle closed as a large bullish candle and ABOVE the key resistance of 81.50 which is a significant bullish development. This is the first weekly close above this level in 11 months.

Weekly Ichimoku: Price is now trading ABOVE the weekly Cloud.

Daily: I had warned traders last week to be cautious of a possible ‘Bull Flag’. The index broke out of this Flag on Monday, moved above the 81.50 level and continued higher from there. The daily chart shows how price had essentially chopped sideways since last September in a range bound by the 79 and 81.50 levels and, thus, this breakout is significant.
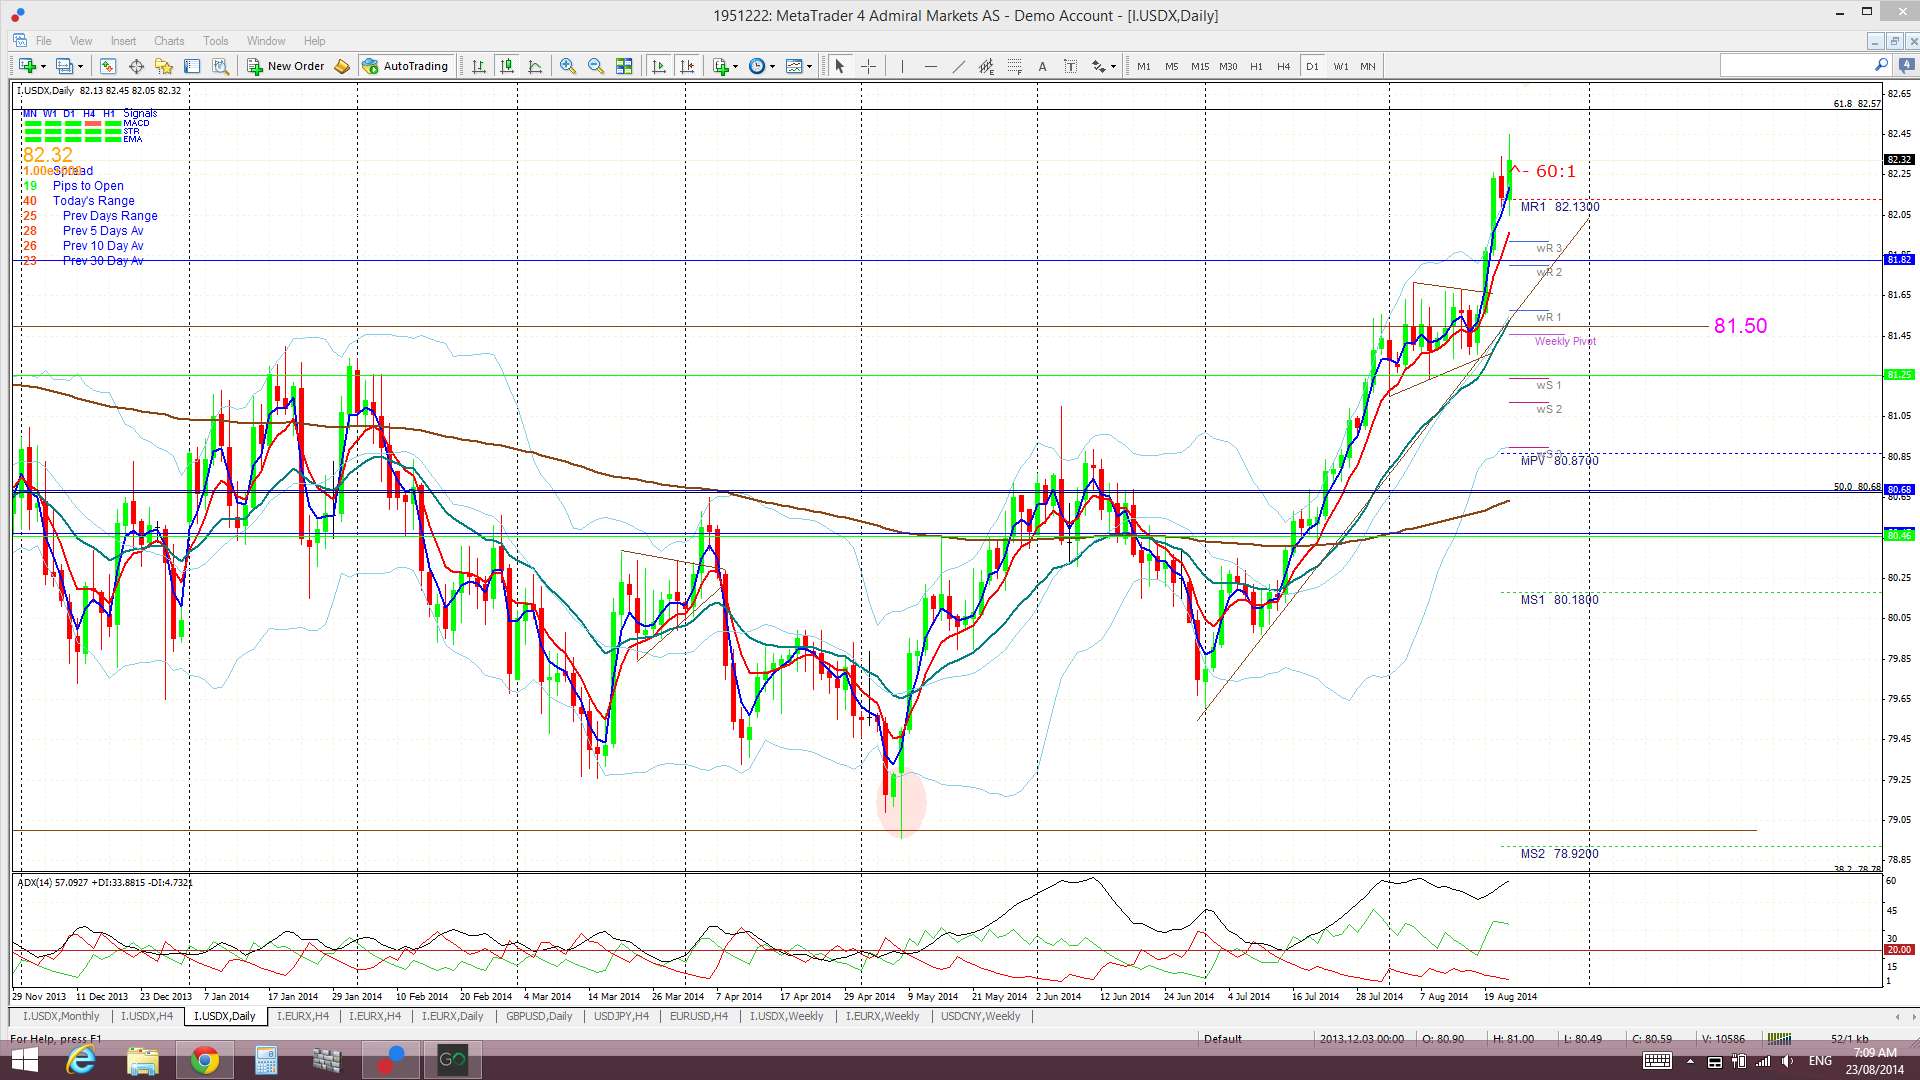
Daily Ichimoku Cloud chart: Price traded above the Cloud all week.

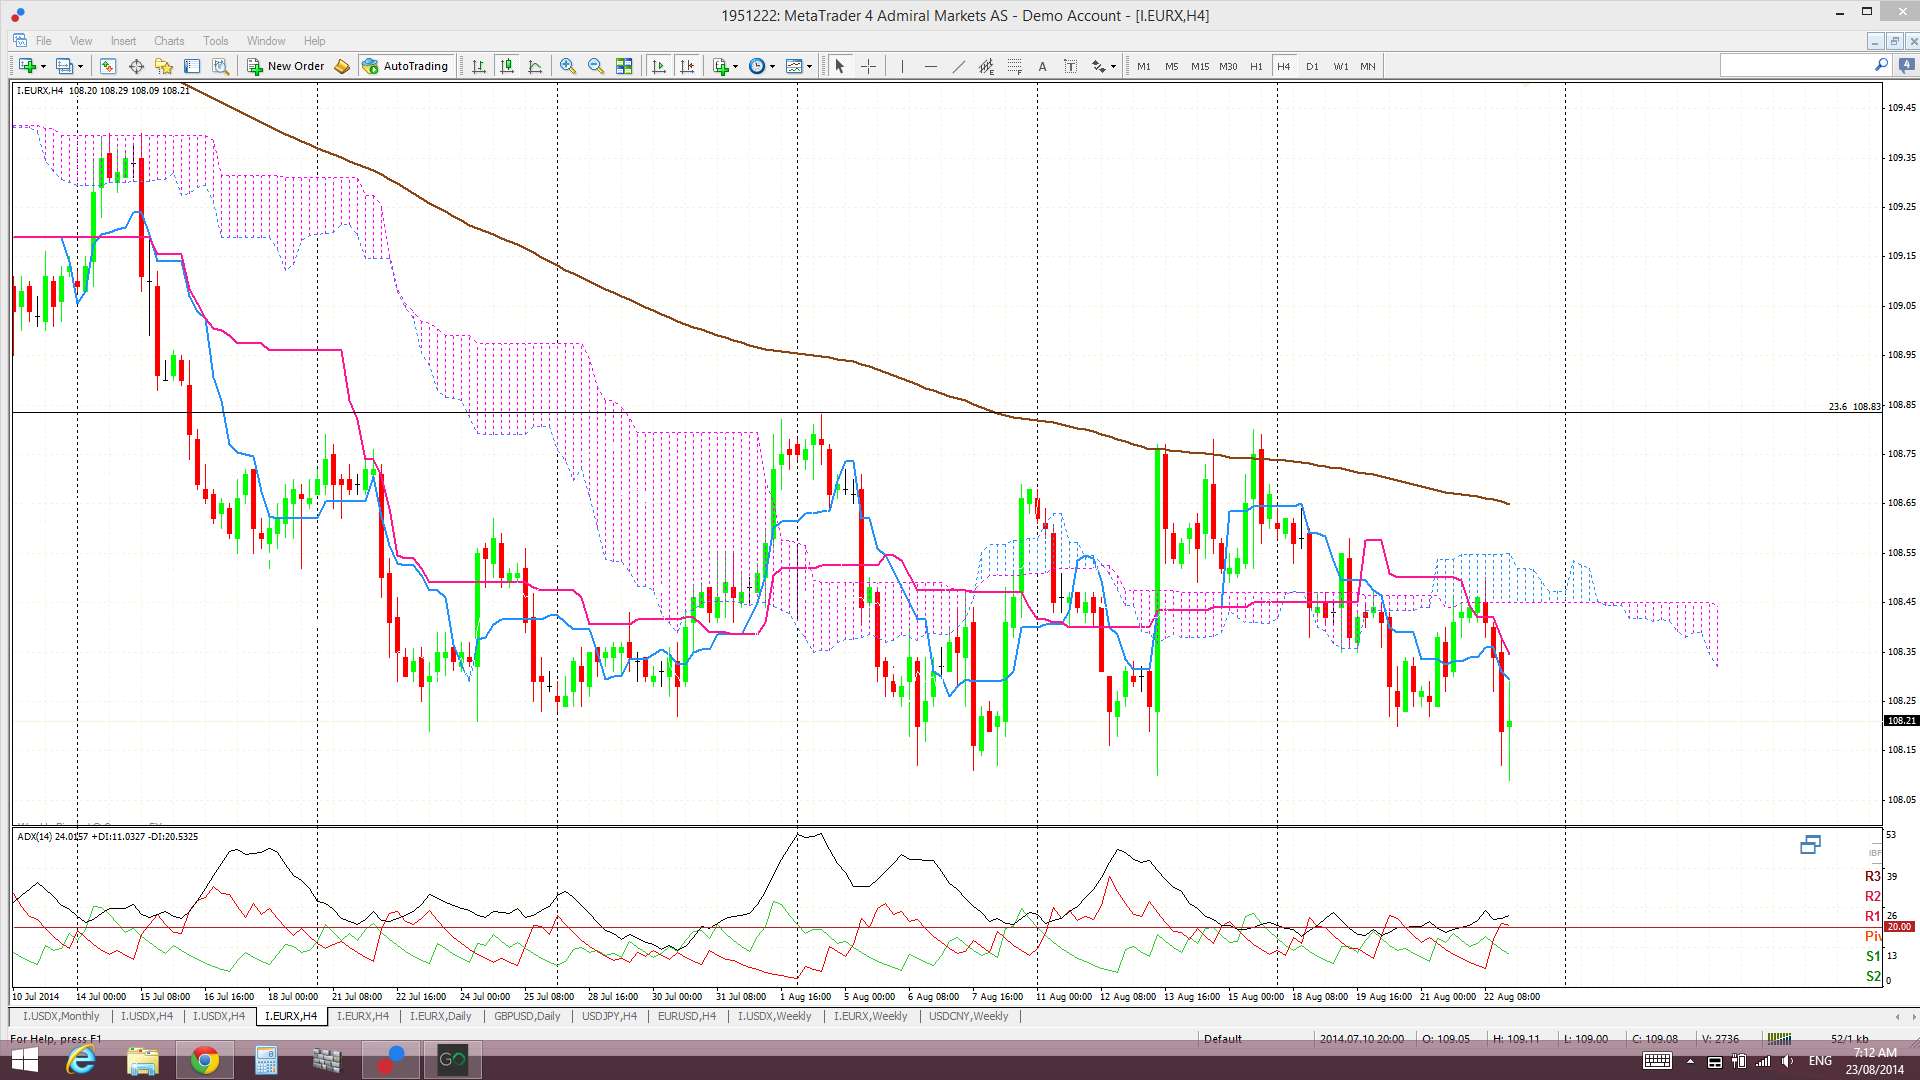
4hr: Price moved higher all week and the index has closed the week above the 81.50 level. It is now sitting just below the 82.50 level which is the 61.8% fib of the 2010-2011 bear move.
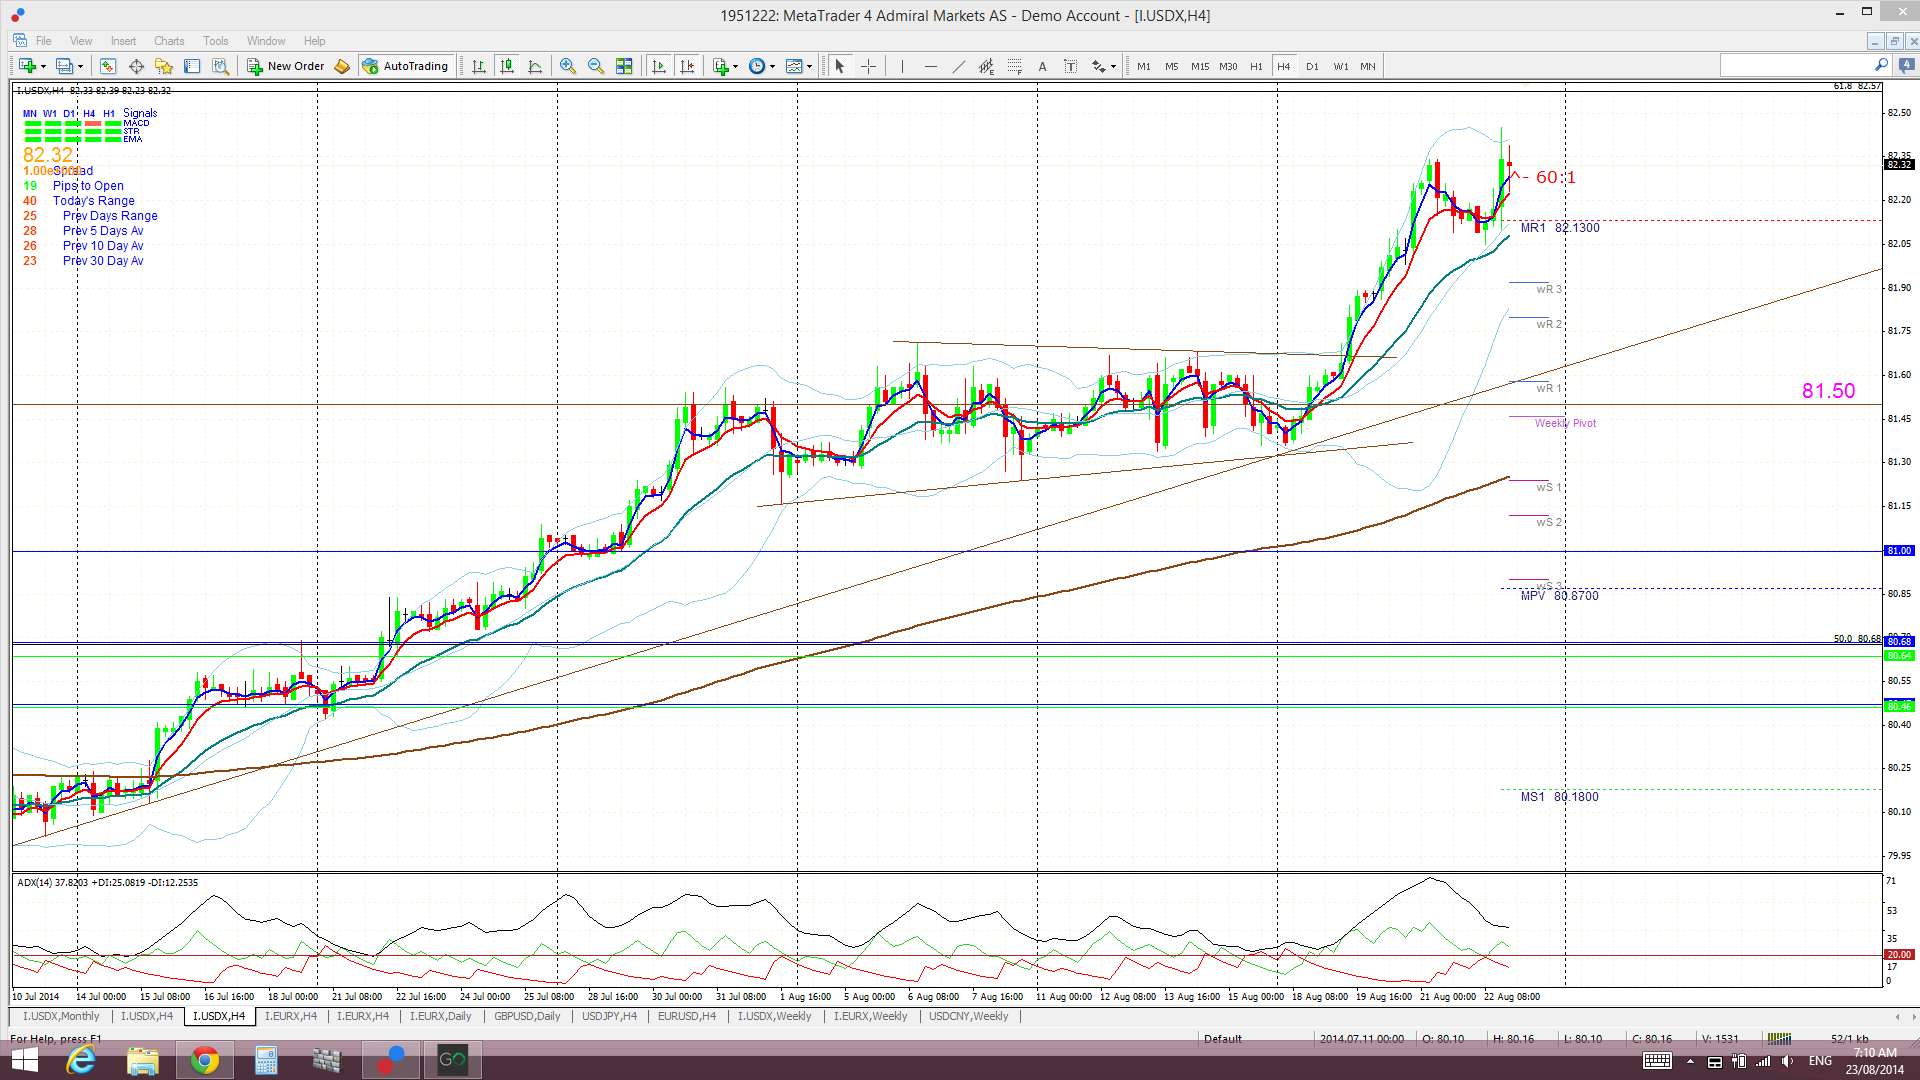
4hr Ichimoku Cloud chart: Price moved up and out of thin Cloud on Monday and continued to trade higher from there. This chart is still aligned with the daily chart and supports long USD trades.
EURX
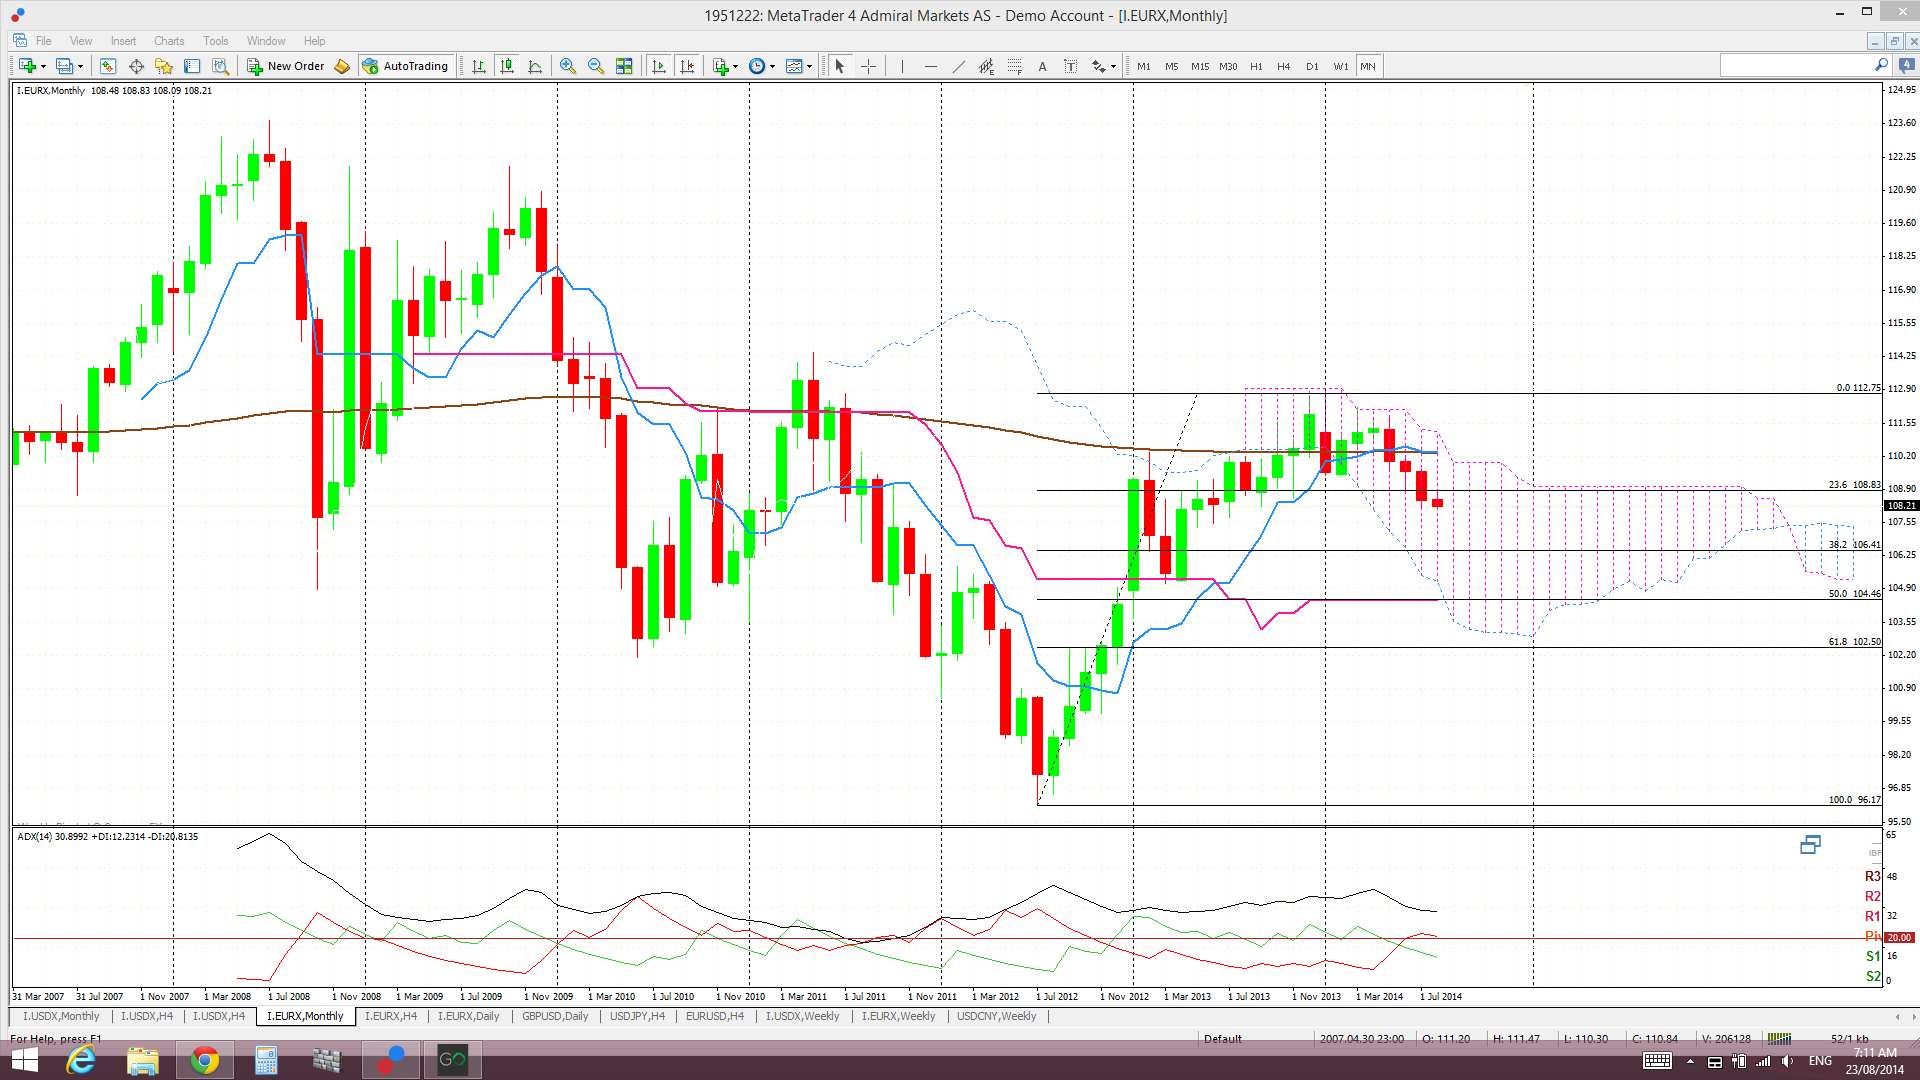
Monthly: The August candle is still printing a bullish coloured ‘Spinning Top’.
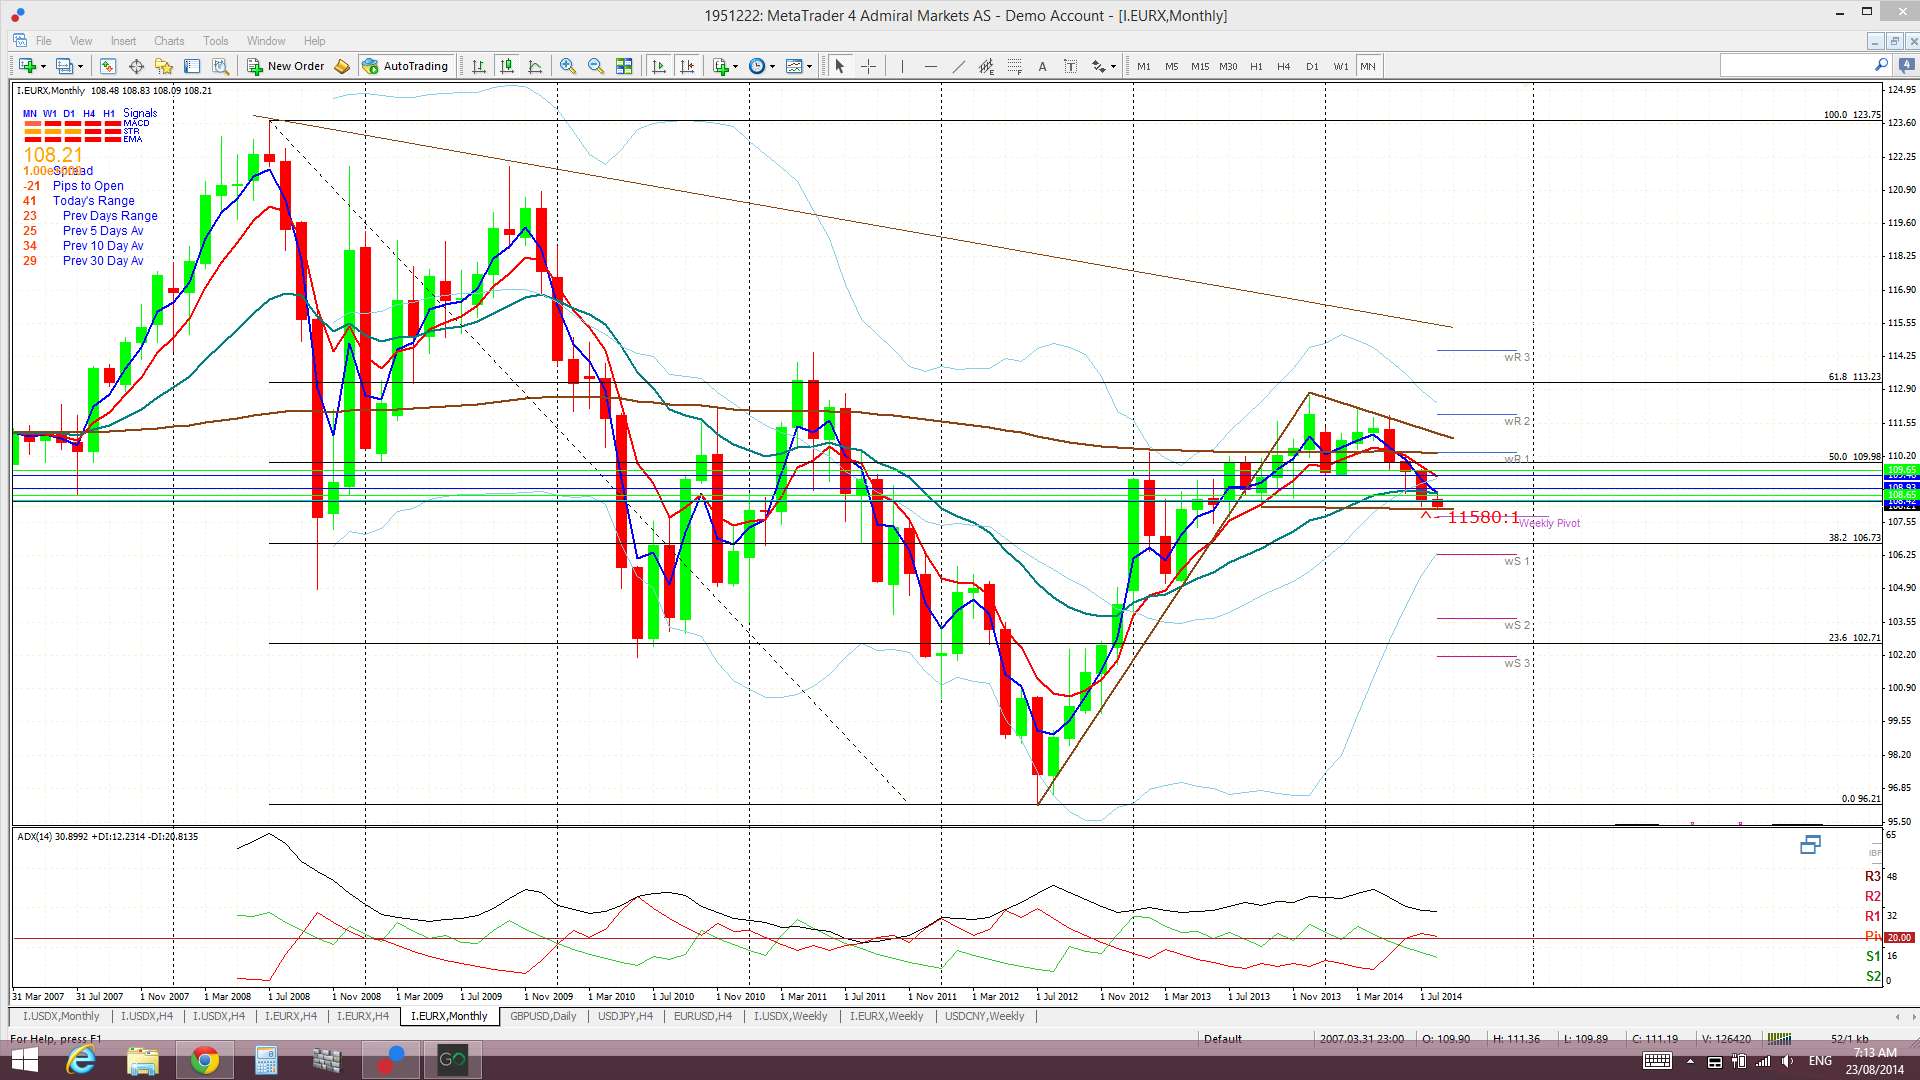
Monthly Ichimoku: The August candle is within the monthly Cloud. This index has spent much of the last 8 months within the monthly Cloud. There may need to be a clear breakout here before decent trending markets return.
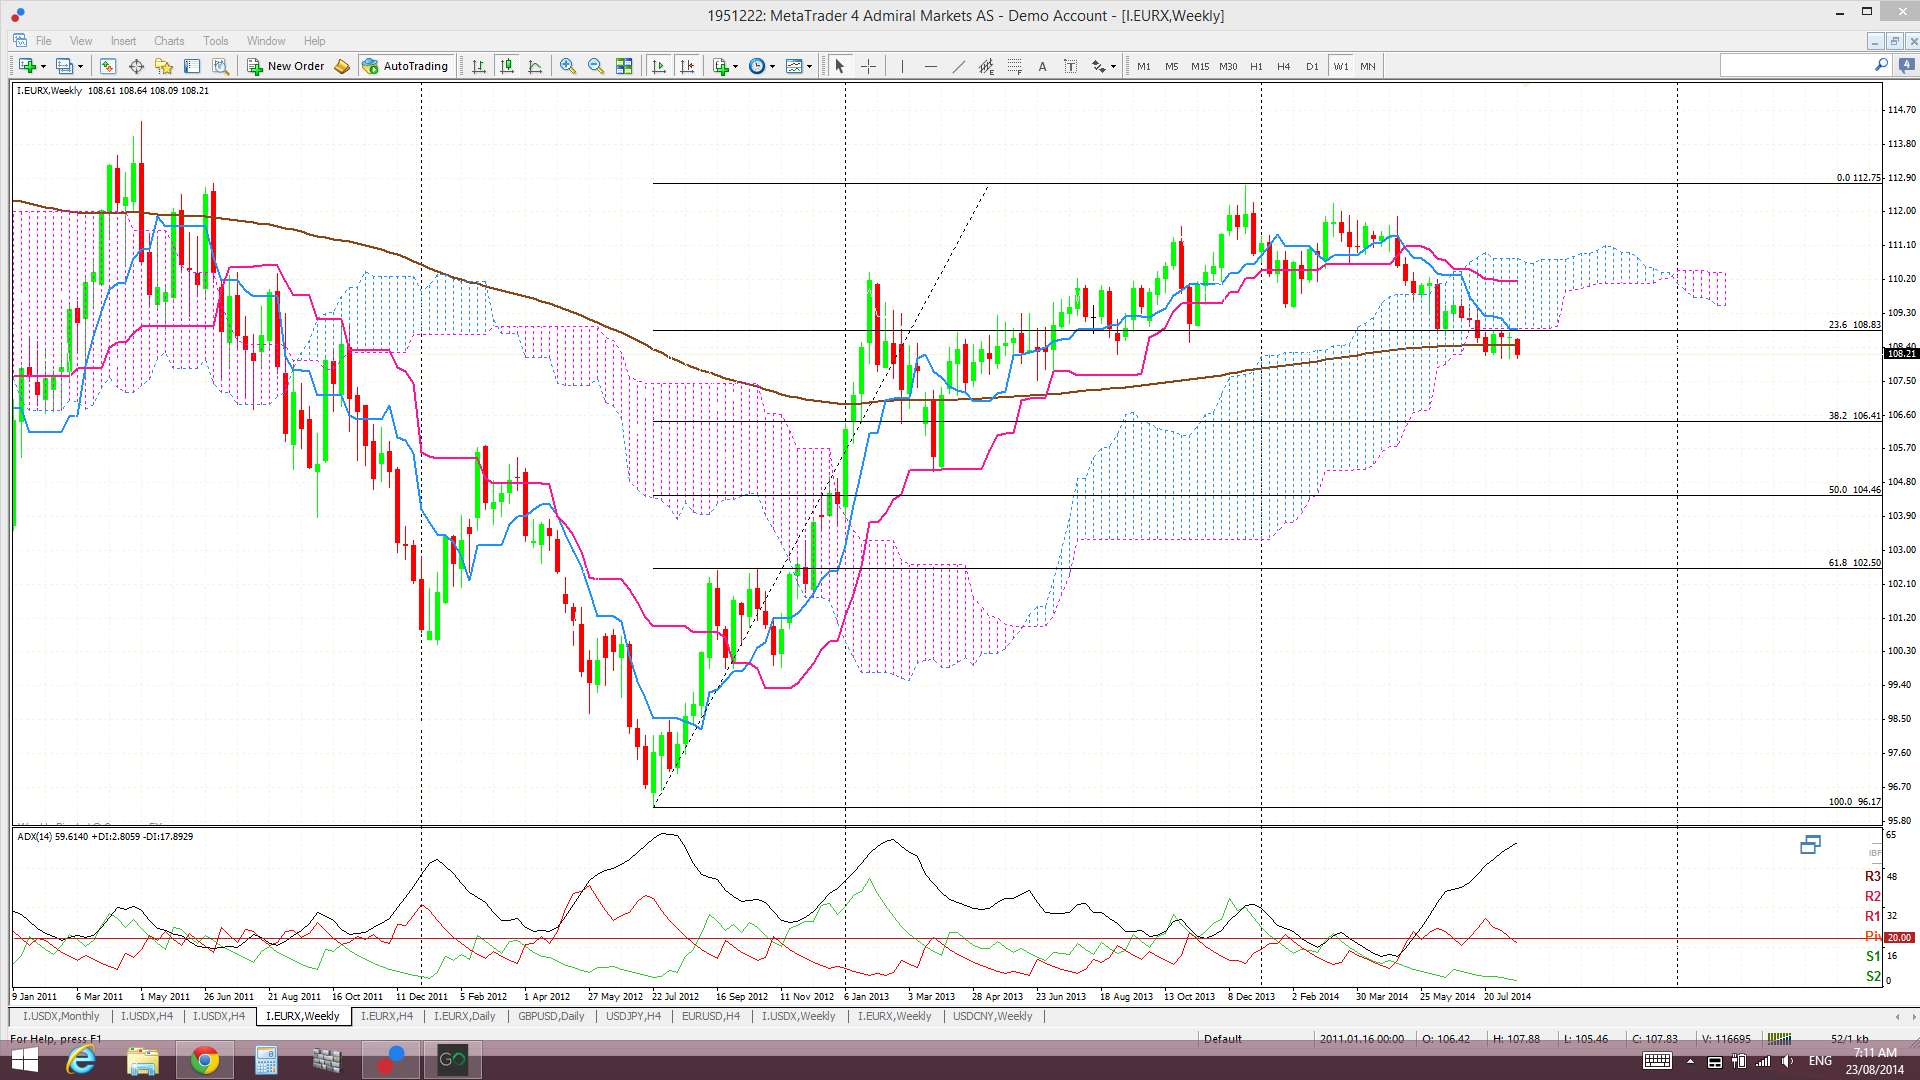
Weekly: The weekly candle closed as a bearish candle. It is trading below the weekly 200 EMA and the 108.5 level but sitting just above the revised support trend line.
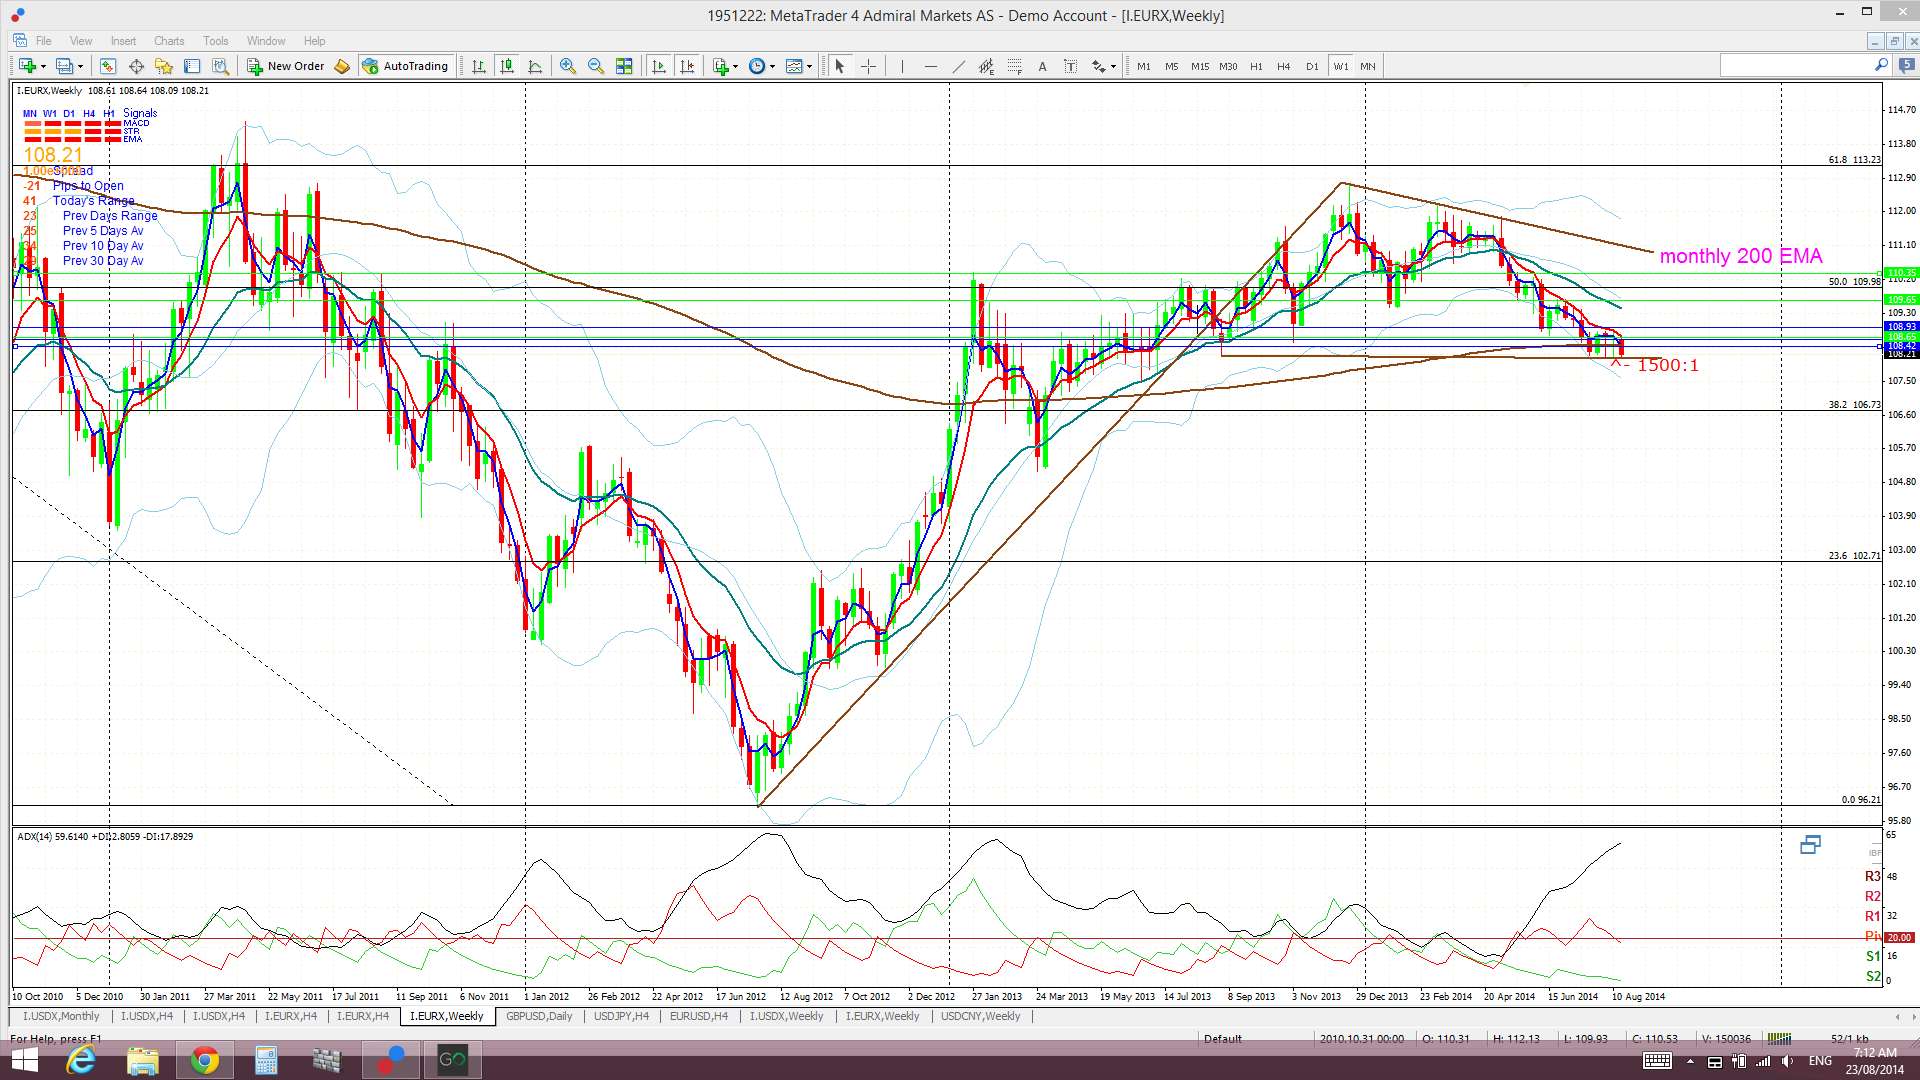
Weekly Ichimoku: Price is still trading below the weekly Cloud.
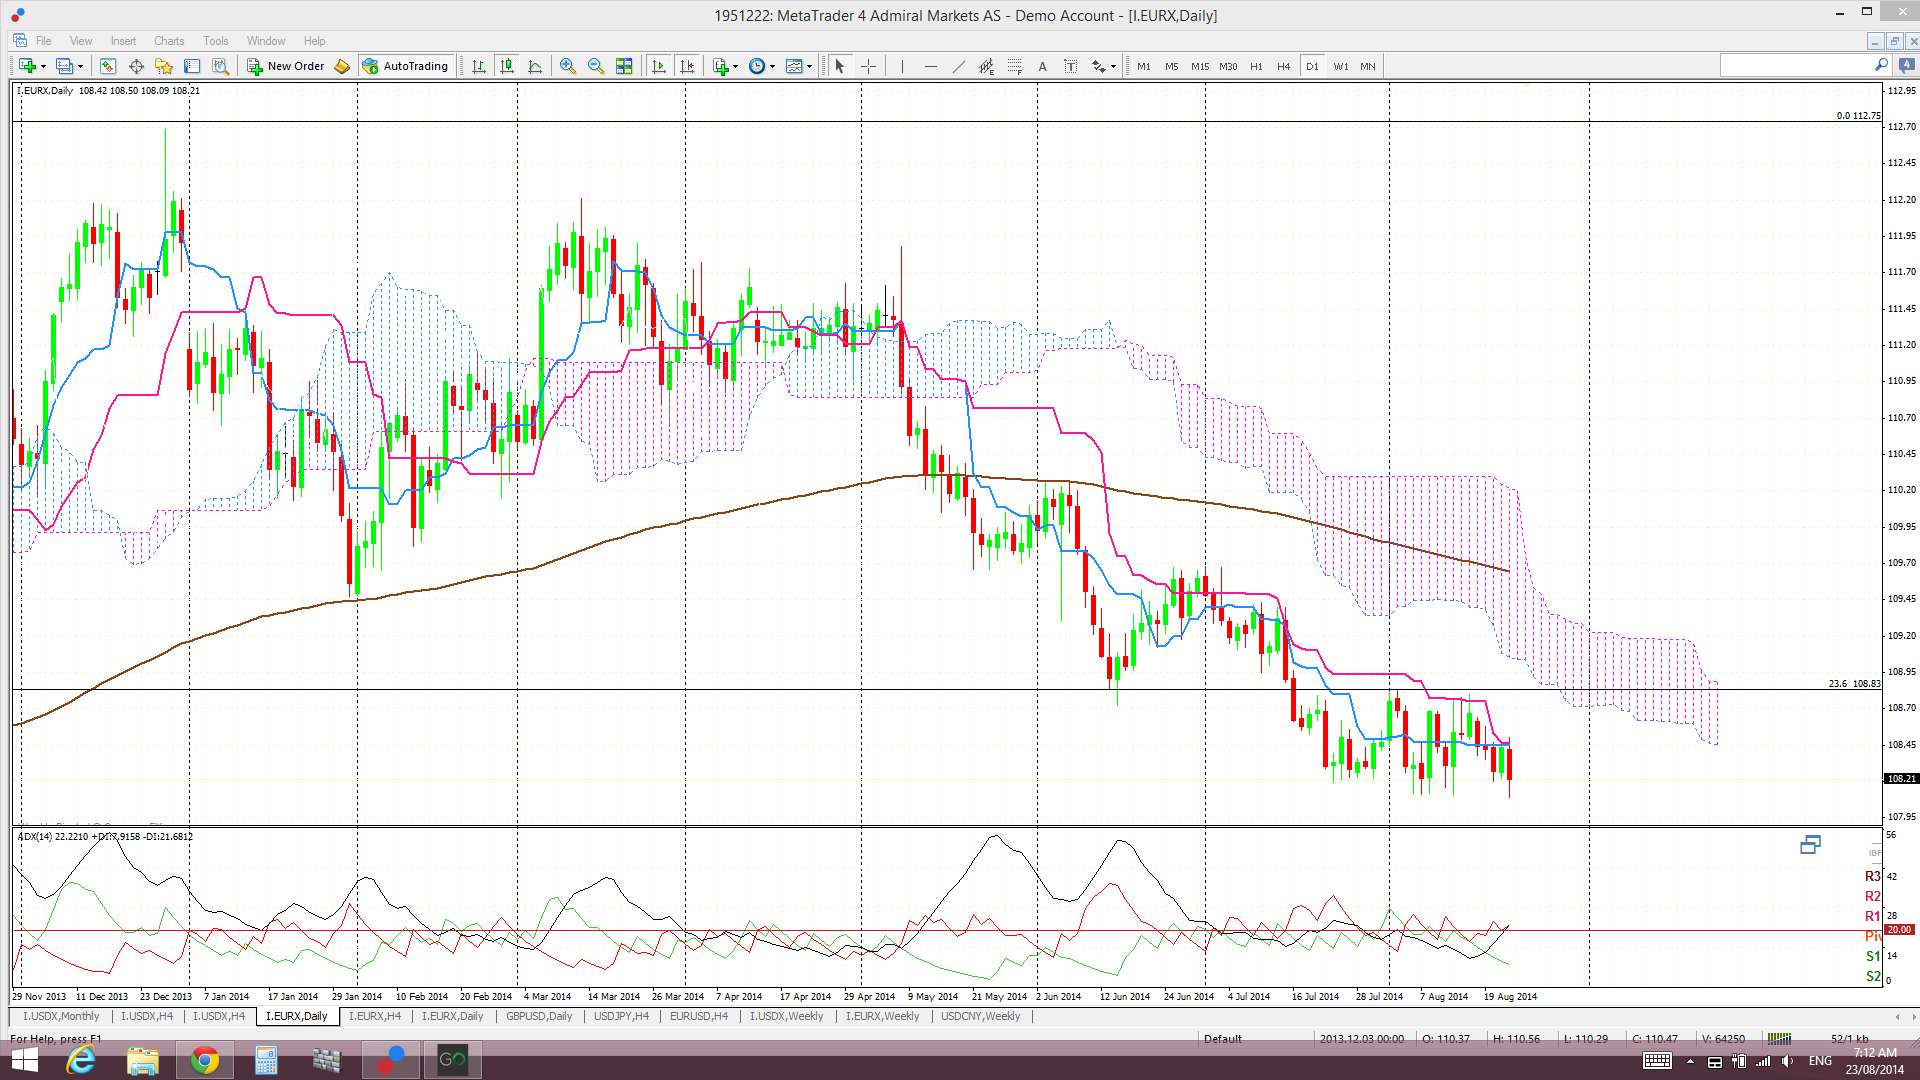
Daily: Price chopped lower last week.
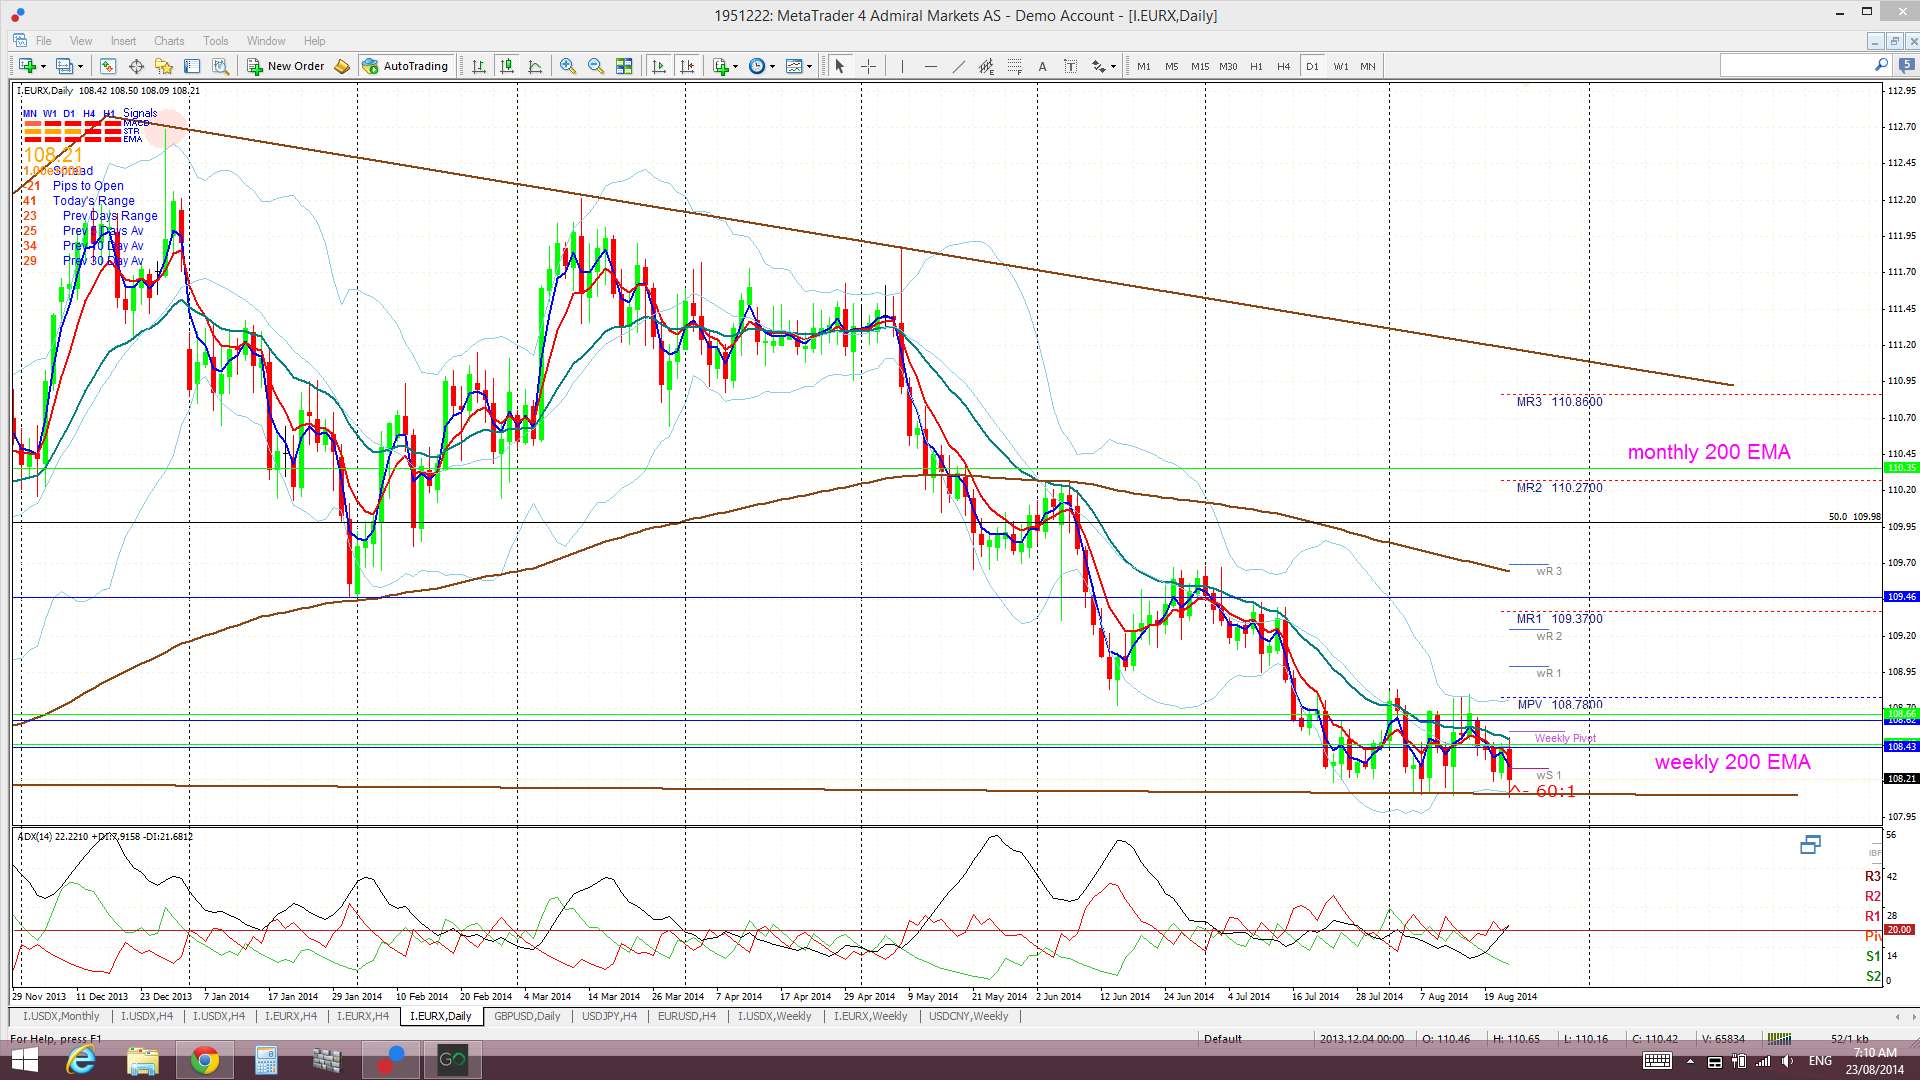
Daily Ichimoku Cloud chart: Price traded below the Cloud all week.
4 hr: Price chopped lower last week.
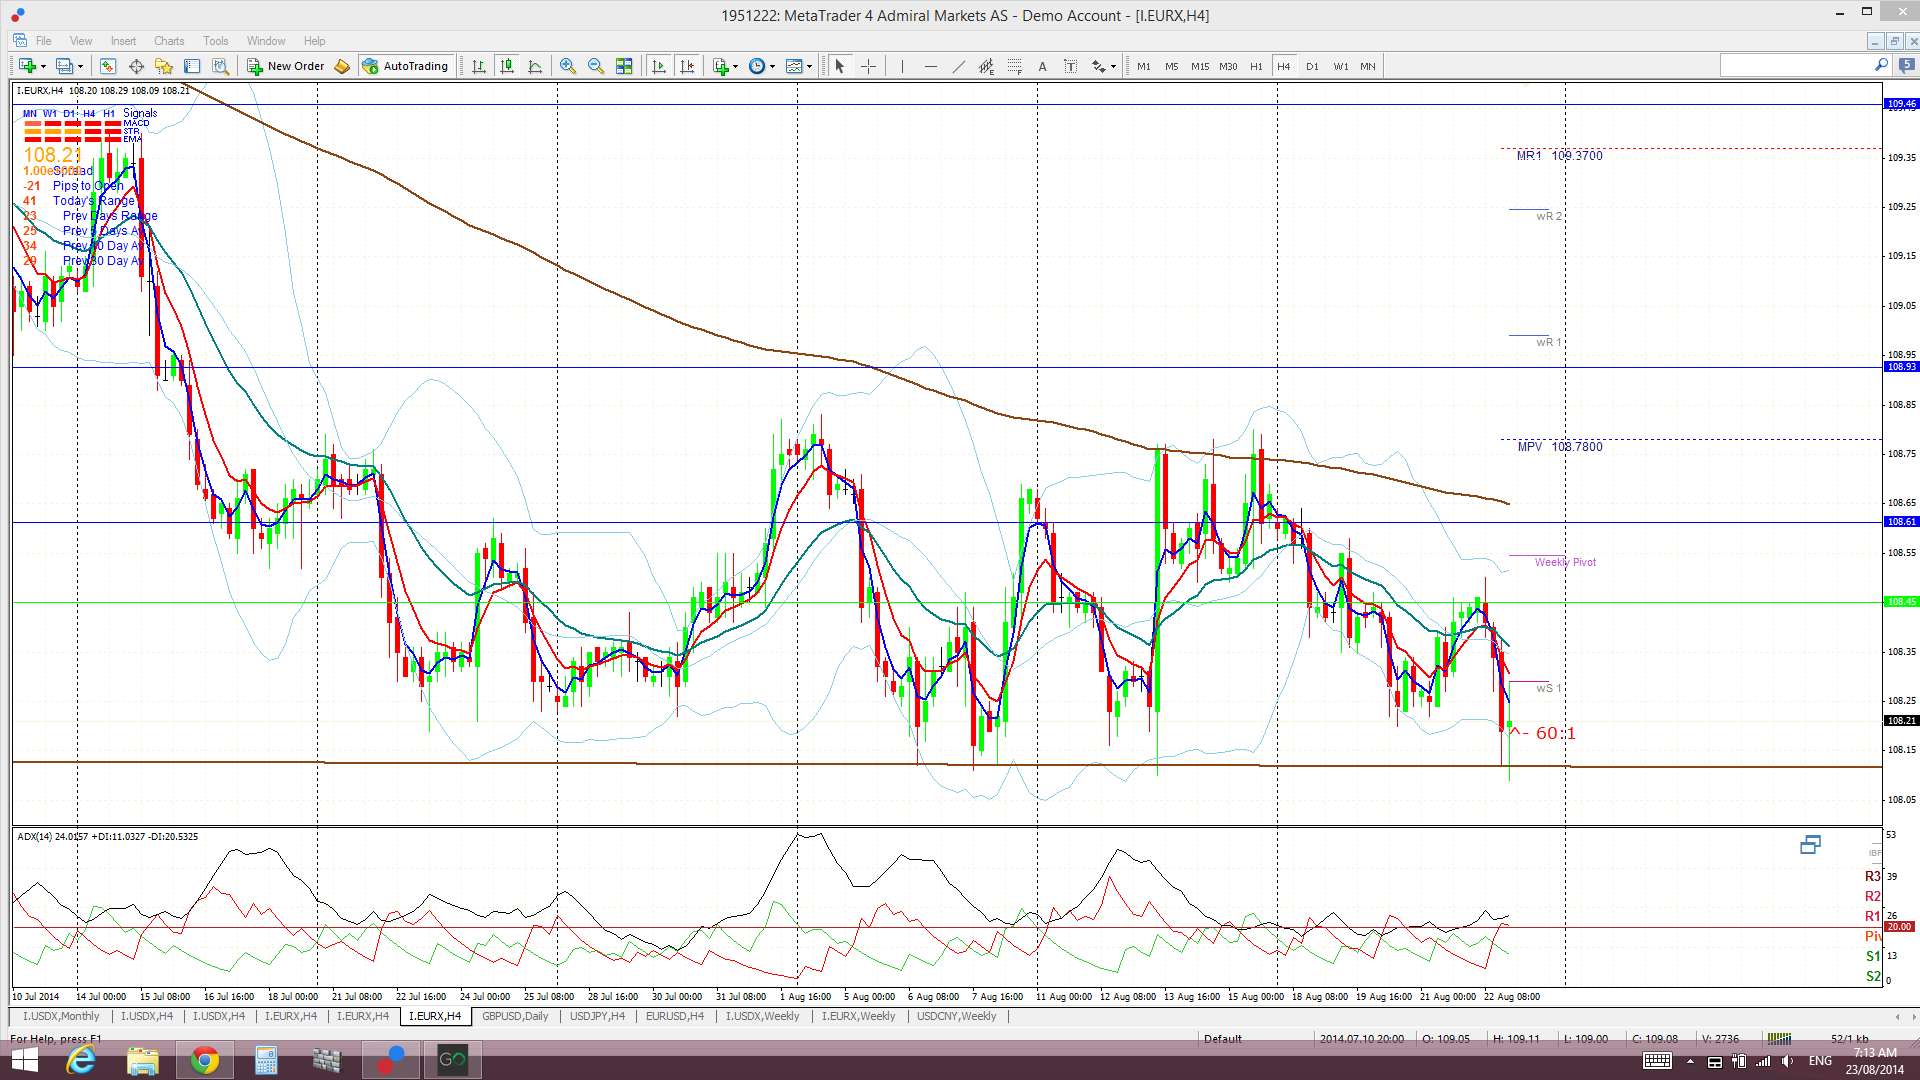
4 hr Ichimoku Cloud chart: The EURX started the week above the Cloud but slipped to finish the week below the Cloud. This chart is now aligned with the daily chart and suggests short EUR.
Comments:
I have been watching two key levels on both indices over recent weeks:
- USDX: the 81.50 resistance level. The index has now made a weekly close ABOVE this key resistance level.
- EURX: the 108.5 support area: this is the region of the weekly support trend line, the bottom of the weekly Cloud and the weekly 200 EMA. The index is now below the weekly Cloud, the weekly 200 EMA and the 108.5 level but is just above the revised weekly support trend line.
USDX: the USDX had a very bullish week and comments from FOMC and the Jackson Hole Symposium have done little to dampen appetite for US dollars. The index has made a very bullish weekly close above the 81.50 level and this marks a breakout from the 81.50 – 79 trading channel that had contained the index for the last 11 months!
The index is now sitting just below the 82.50 level and this is the next key level to watch. The 82.50 level is also the 61.8% fib of the last major swing move being the 2010-2011 bear move. The 61.8% fib levels are key Fibonacci levels as they are often regarded as the demarcation point for a trend change. That is, a close and hold above the 61.8% fib level can often signal a change in overall trend. In this case, a close and hold above the 82.50 level could signal further bullish continuation for the USDX. The monthly chart shows that the next two main resistance levels after this 61.8% fib, apart from the usual psychological half and whole numbers, would be the monthly 200 EMA and then the 78.6% fib near the 85 level.
The other point to note is that the USDX is now trading above the Ichimoku Cloud on the hourly, 4hr, daily, weekly and monthly time charts. Whilst this is quite bullish the index is trading well above the 4hr and daily Cloud and so some pullback, in mean reversion mode, would not be out of order. Thus, I still would not be surprised to see this index test the 81.50 level again even if there is to be bullish continuation. This was a major resistance level for the index and major levels often tend to be tested before any continuation and so traders need to be wary of this possibility.
EURX: the EURX closed lower for the week. The index has closed below the weekly Cloud, the 108.5 level and the weekly 200 EMA. It is only just above the recently revised weekly support trend line but looks vulnerable. The divergence between the performance of the Eurozone and US economies only seems to be widening and this may continue to put pressure on the EURX. A break and hold below the revised weekly trend line might signal the start of steeper falls by way of a ‘last line of defense’ type of breakdown.
NB: I am away for the week and updates with be brief and less frequent.
Note: The analysis provided above is based purely on technical analysis of the current chart set ups. As always, Fundamental-style events, by way of any Ukraine, Euro zone or Middle East events and/or news announcements, continue to be unpredictable triggers for price movement on the indices. These events will always have the potential to undermine any technical analysis.
The post USD rally continues: FX Indices Review for 25/08/14 appeared first on www.forextell.com.