Last week: It was a better week for my trend trading TC system as the USDX finally broke free from the potential ‘Double Top’ region and the resulting trade signals all fared pretty well: E/U= flat (this short signal was just a bit too early), E/J= 150 (still open) and U/J = 70 and then another one U/J= spiked to 130 (still open) and Kiwi= 120 (still open).
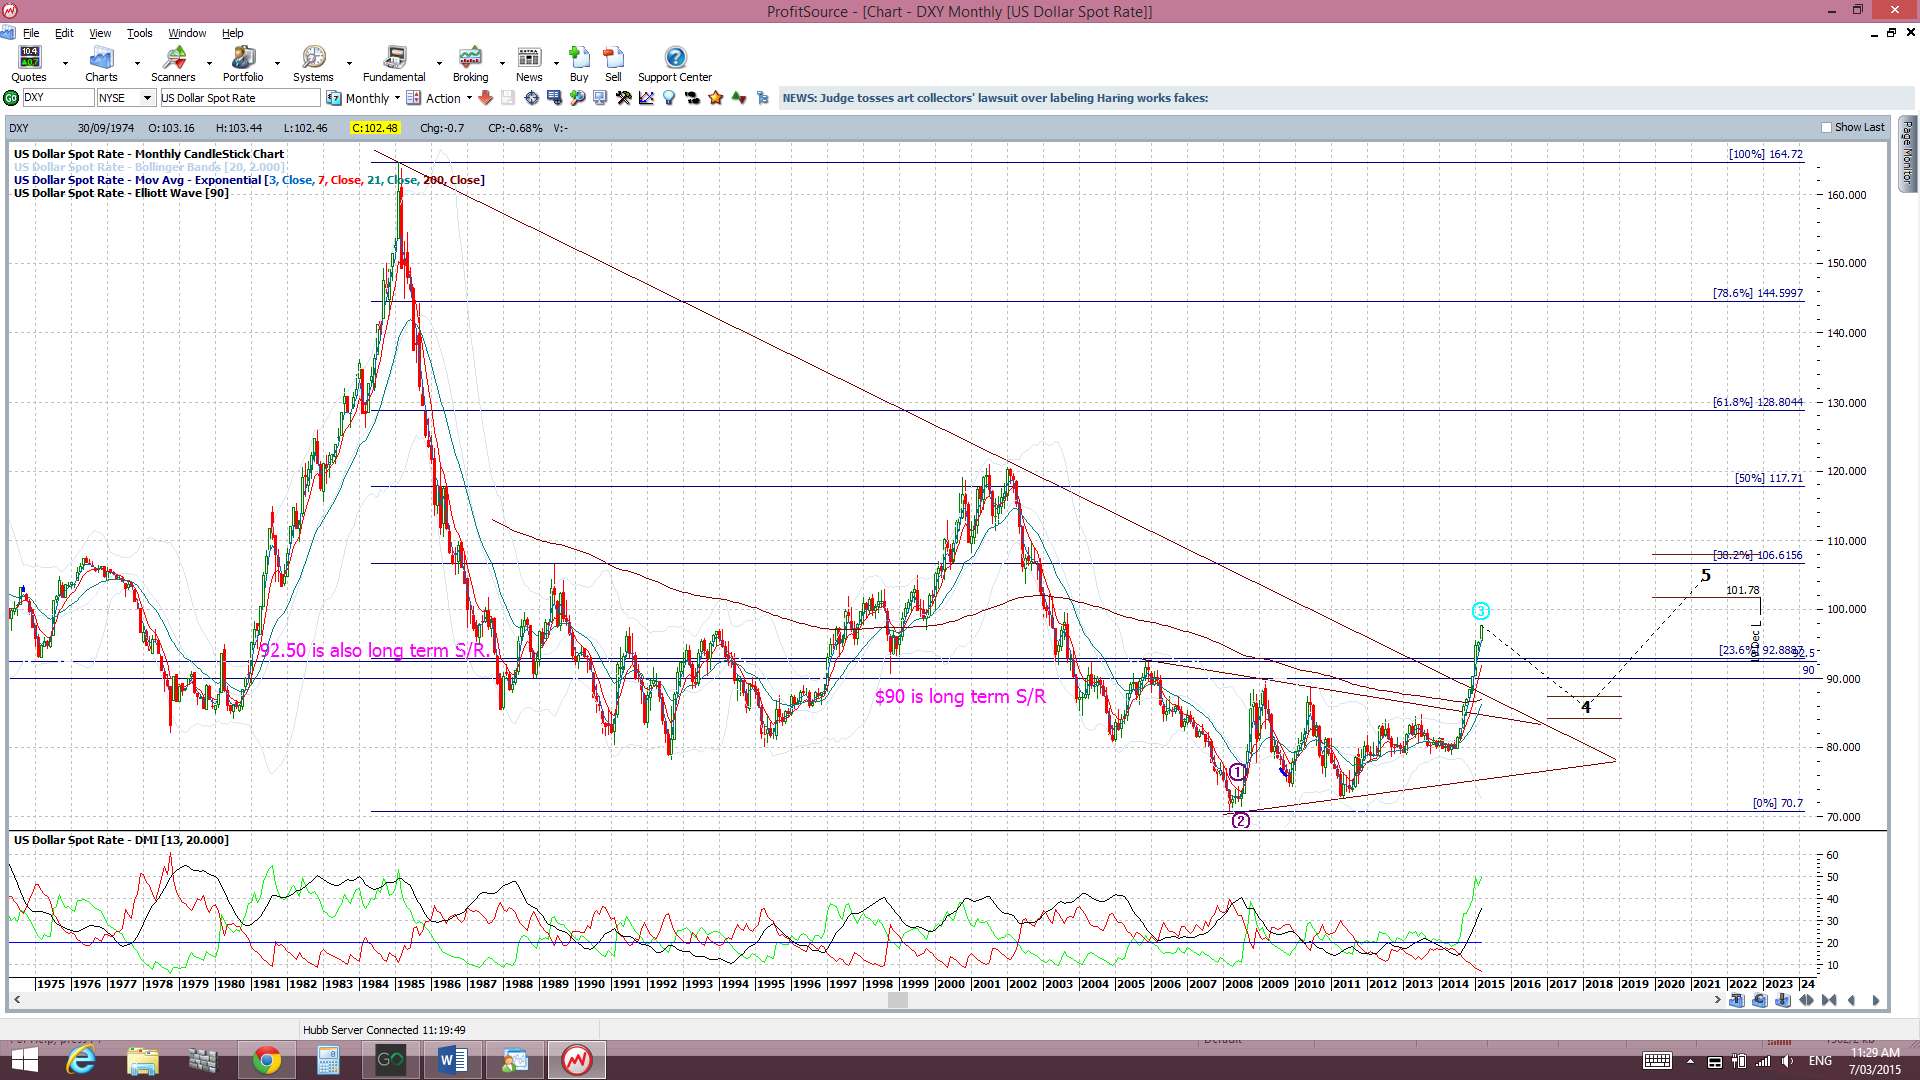
I had been saying for the last five weeks that trend trading would remain choppy until the FX Indices break free from their recent trading ranges. That is exactly what we have seen! The FX indices manage to break out from their respective triangle patterns the week before last and, last week, the USD finally decided between the ‘Bull Flag’ and ‘Double Top’ with the ‘Bull Flag’ winning out. The USD looks to have plenty of room to run higher too as the monthly chart below reveals. A strengthening USD will have consequences for many trading instruments and this has already been seen on the EUR/USD, GBP/USD, USD/JPY, Silver and Gold. The big questions now include…how much follow through will be seen on these instruments AND which currency pairs might be next to buckle? A review of the FX Indices can be found through the following link.
USD Index monthly chart: (click to enlarge)
This week:
There are three pieces of important Chinese data and the first of these is released on Sunday. Watch for impact from these items on the AUD and NZD pairs.
AUD/USD: This pair held up fairly well last week despite the stronger USD. There are two clear S/R levels in play on the A/U 4hr chart and these will be worth monitoring, especially with the release of Chinese data items.
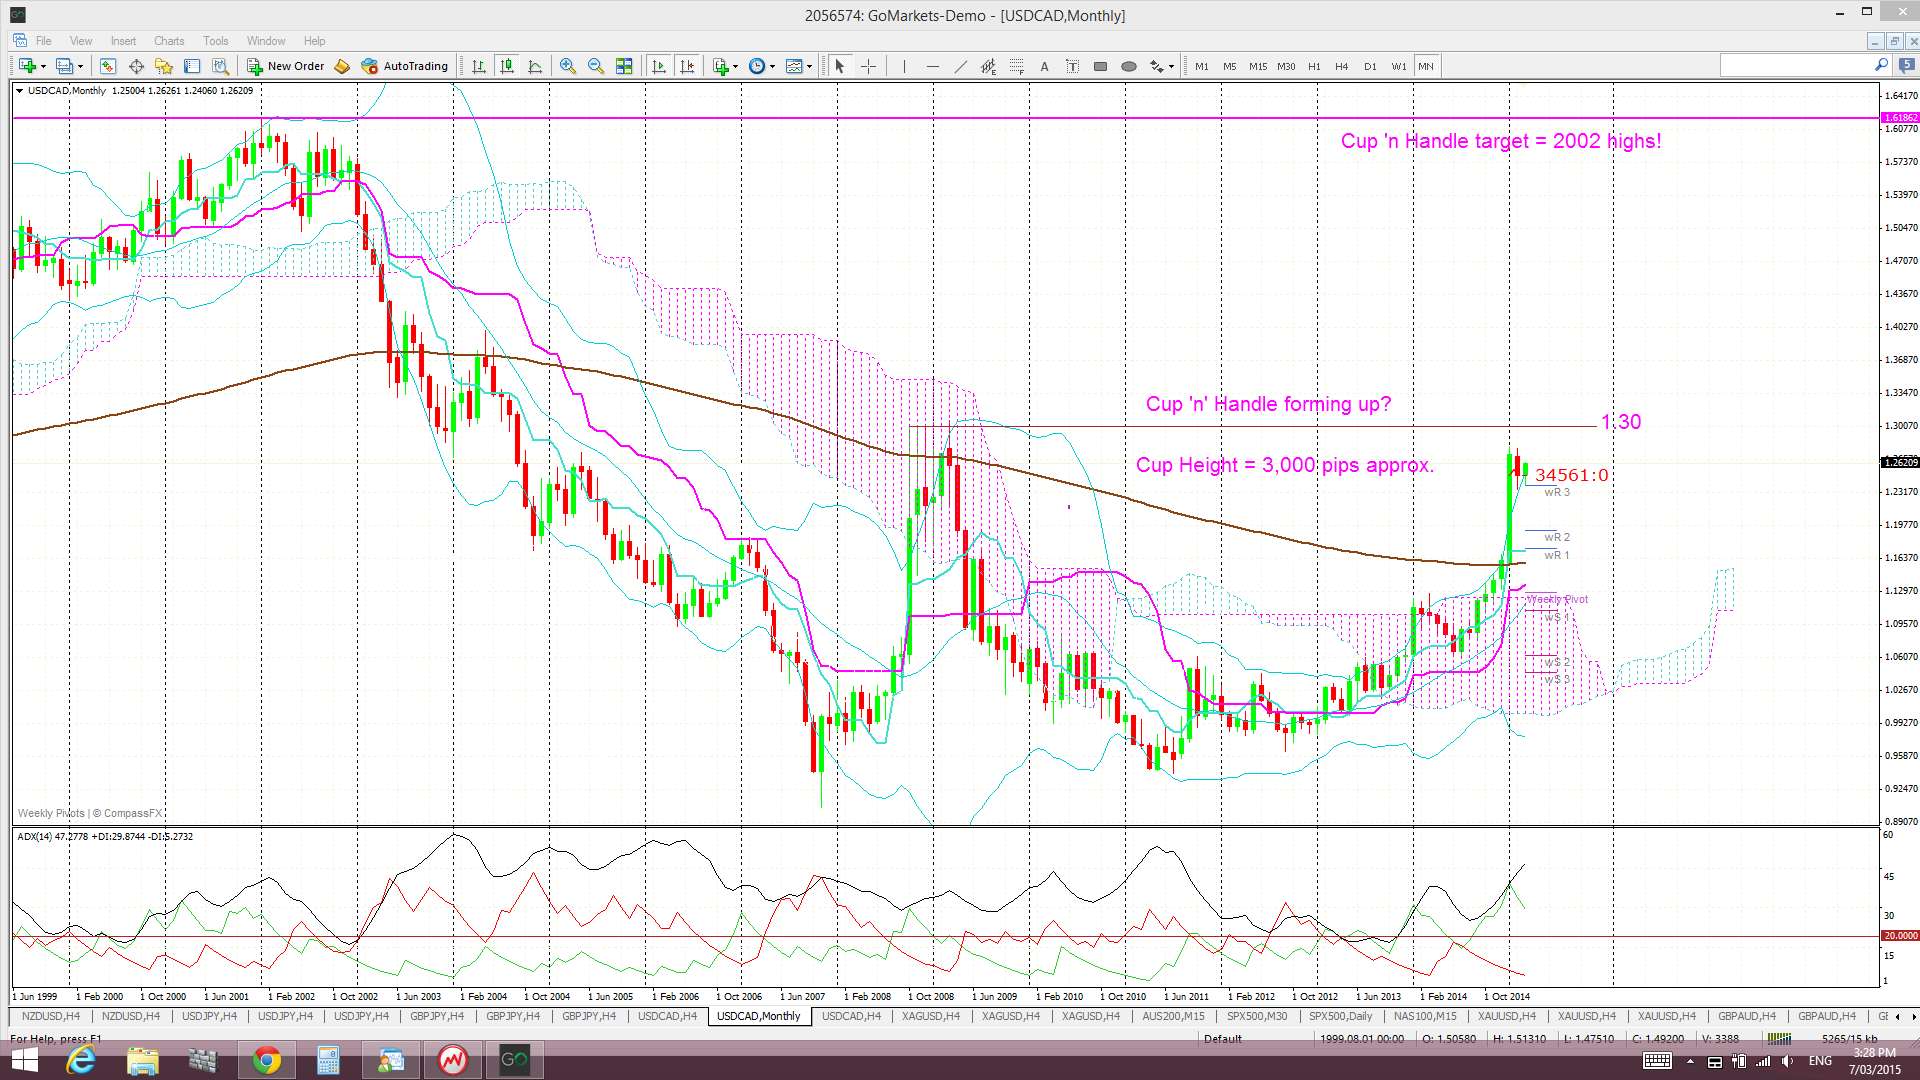
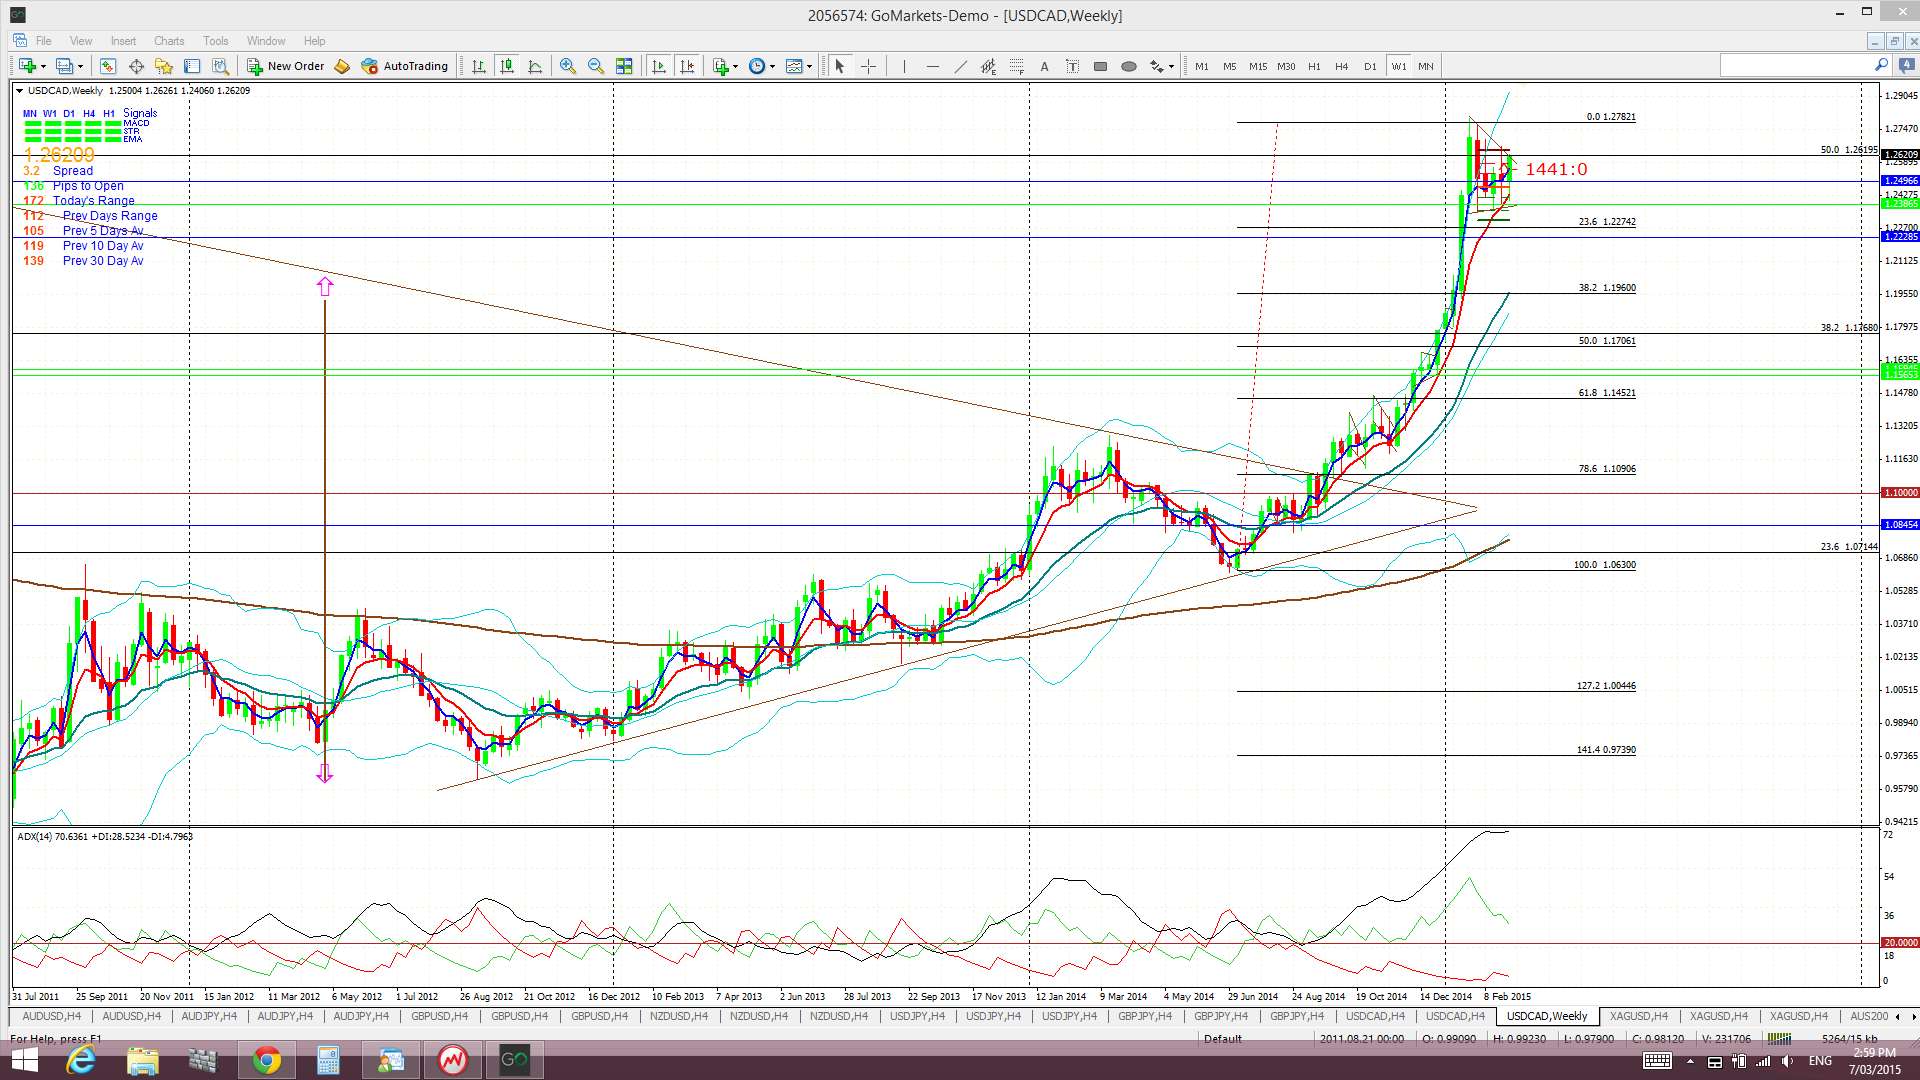
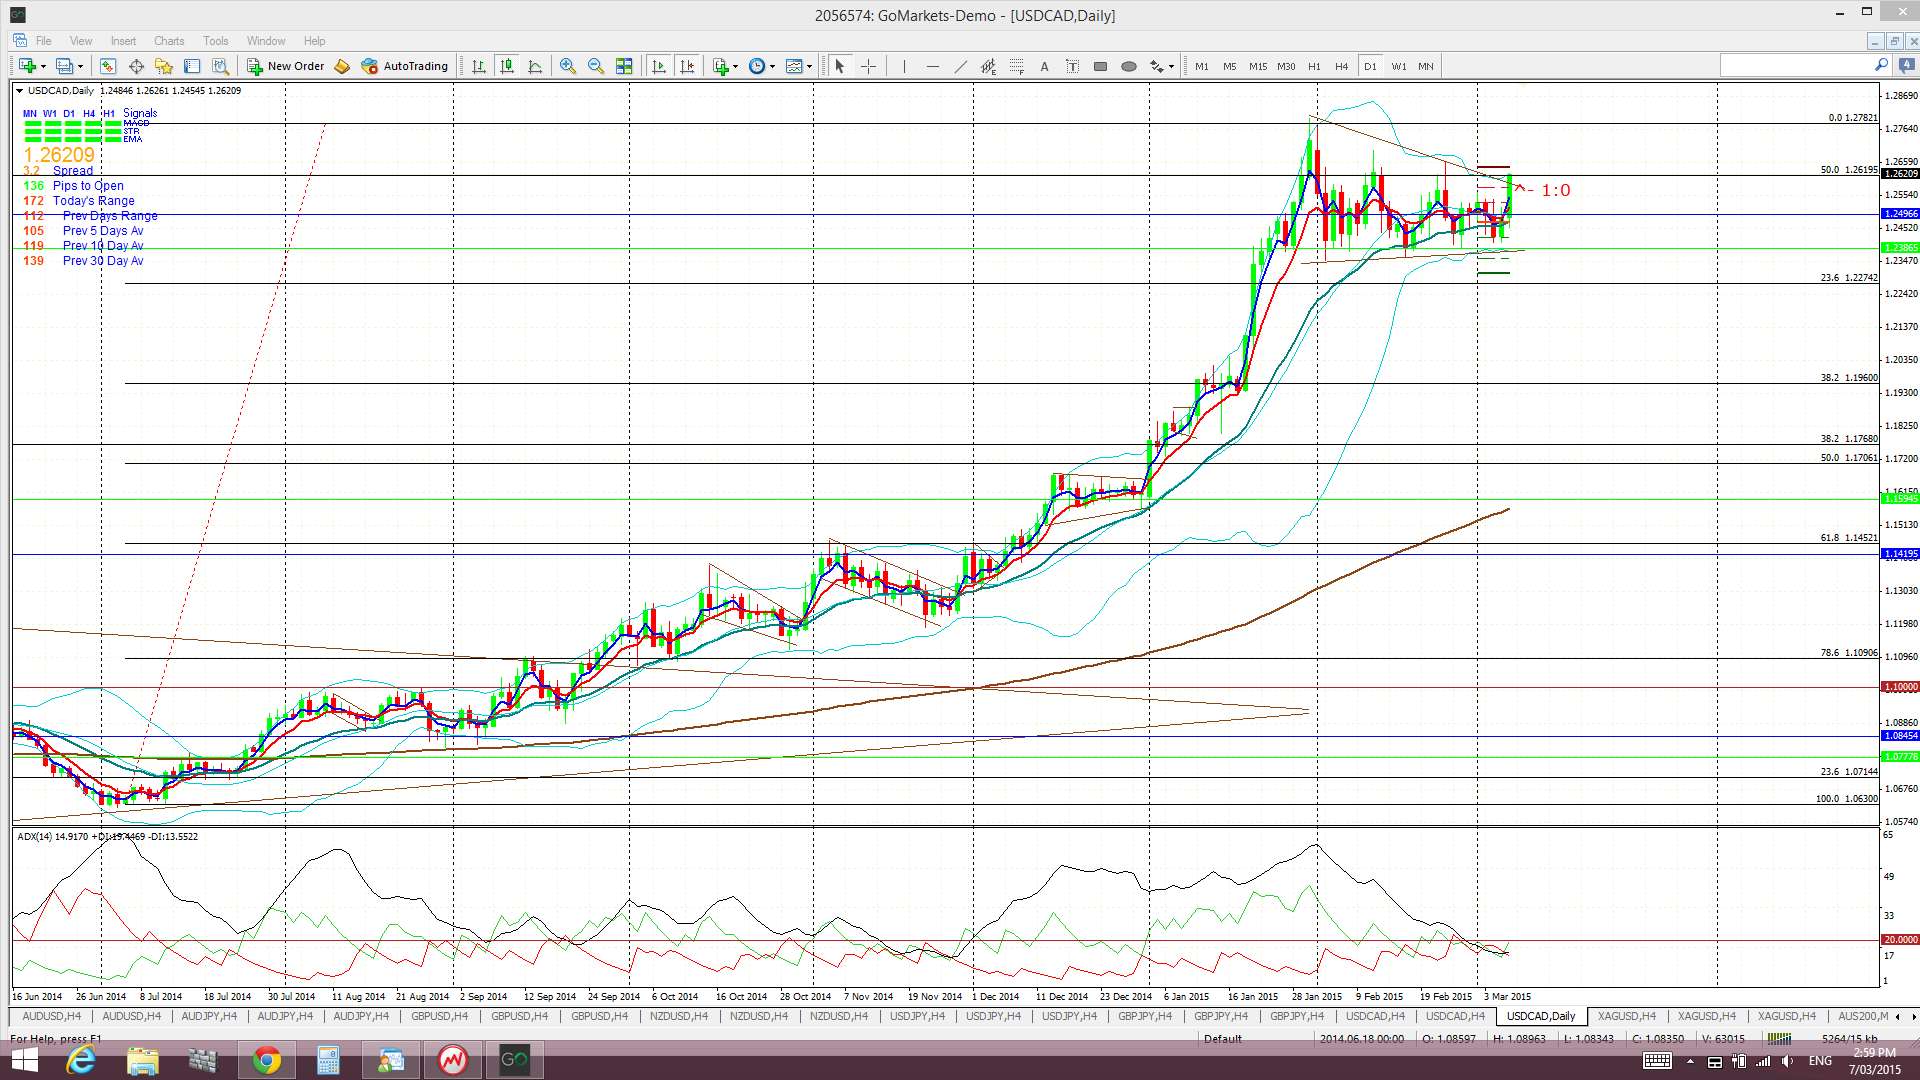
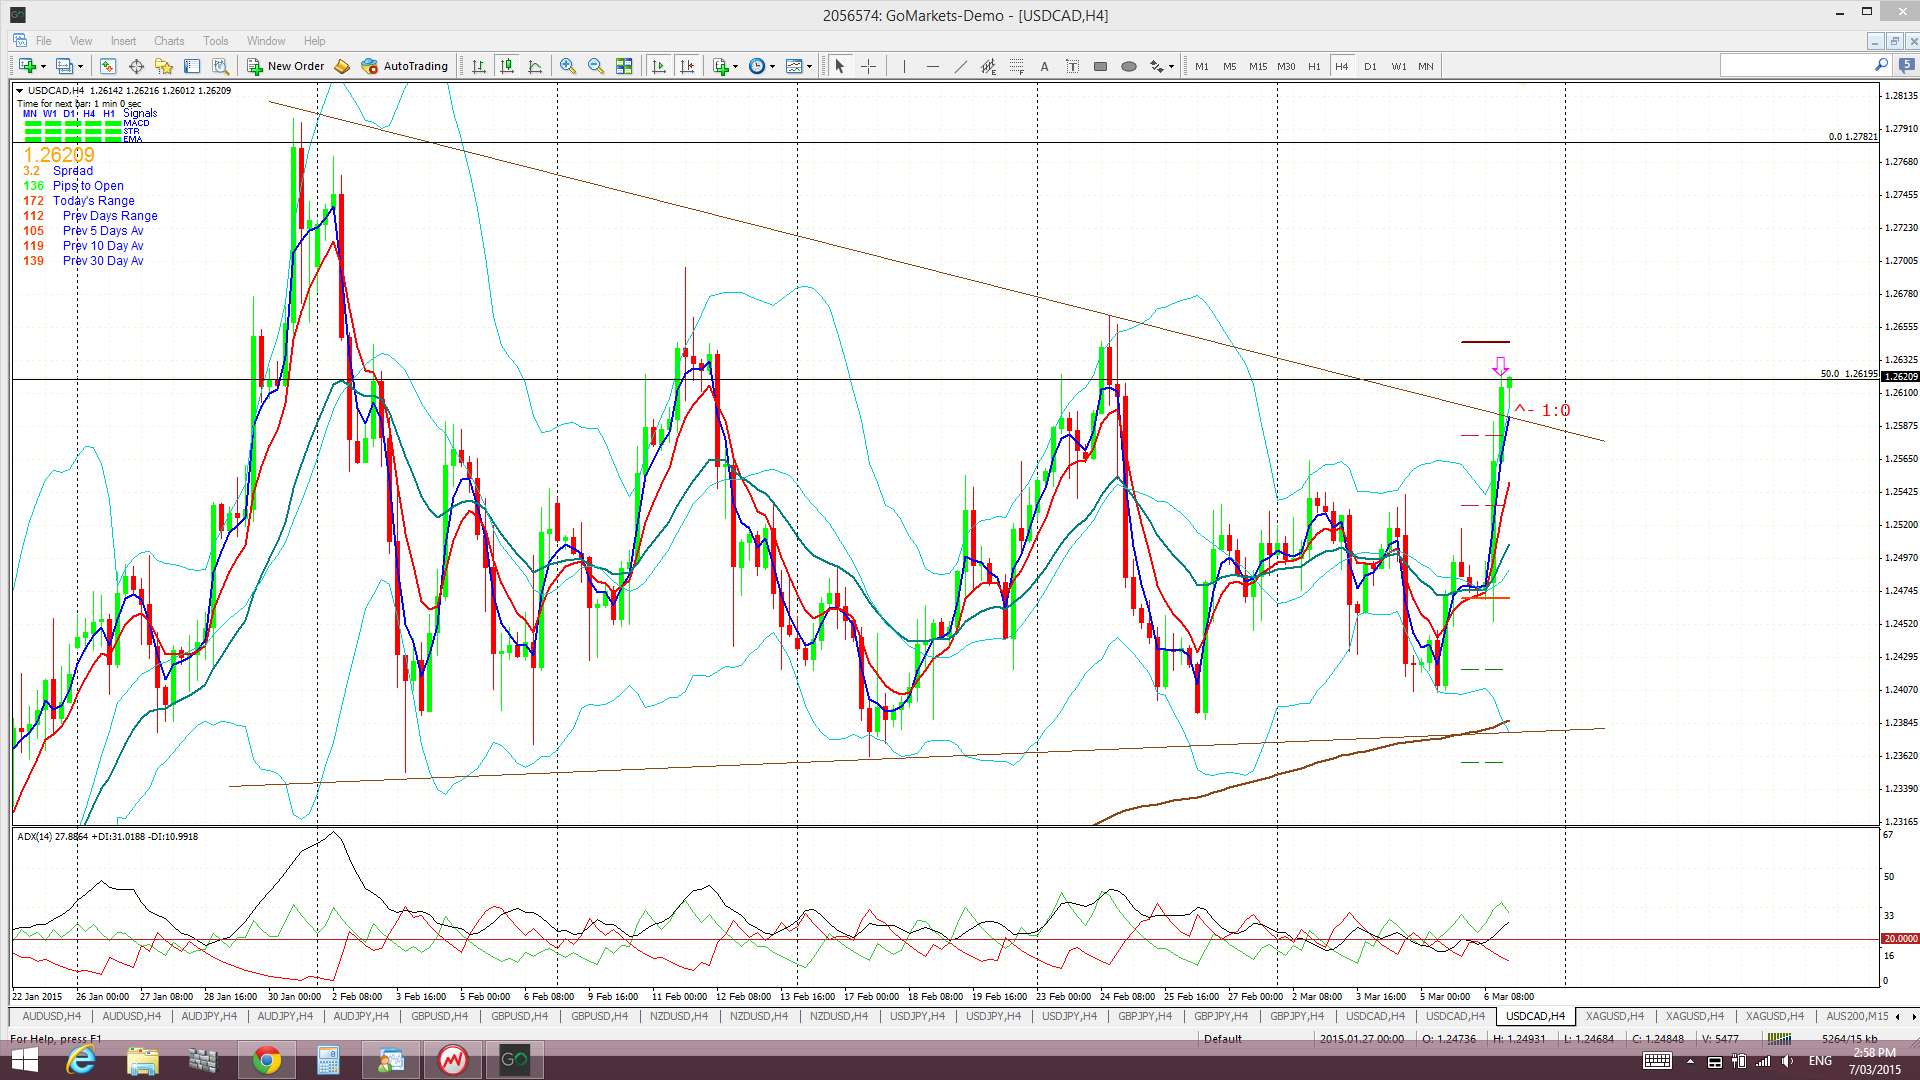
USD/CAD: a new bullish Cup ‘n’ Handle seems to be forming up and, if so, could be worth over 3,000 pips!
USD/JPY: another bullish Cup ‘n’ Handle seems to be forming up here too, just as one almost completes. The new pattern could be worth around 4,800 pips!
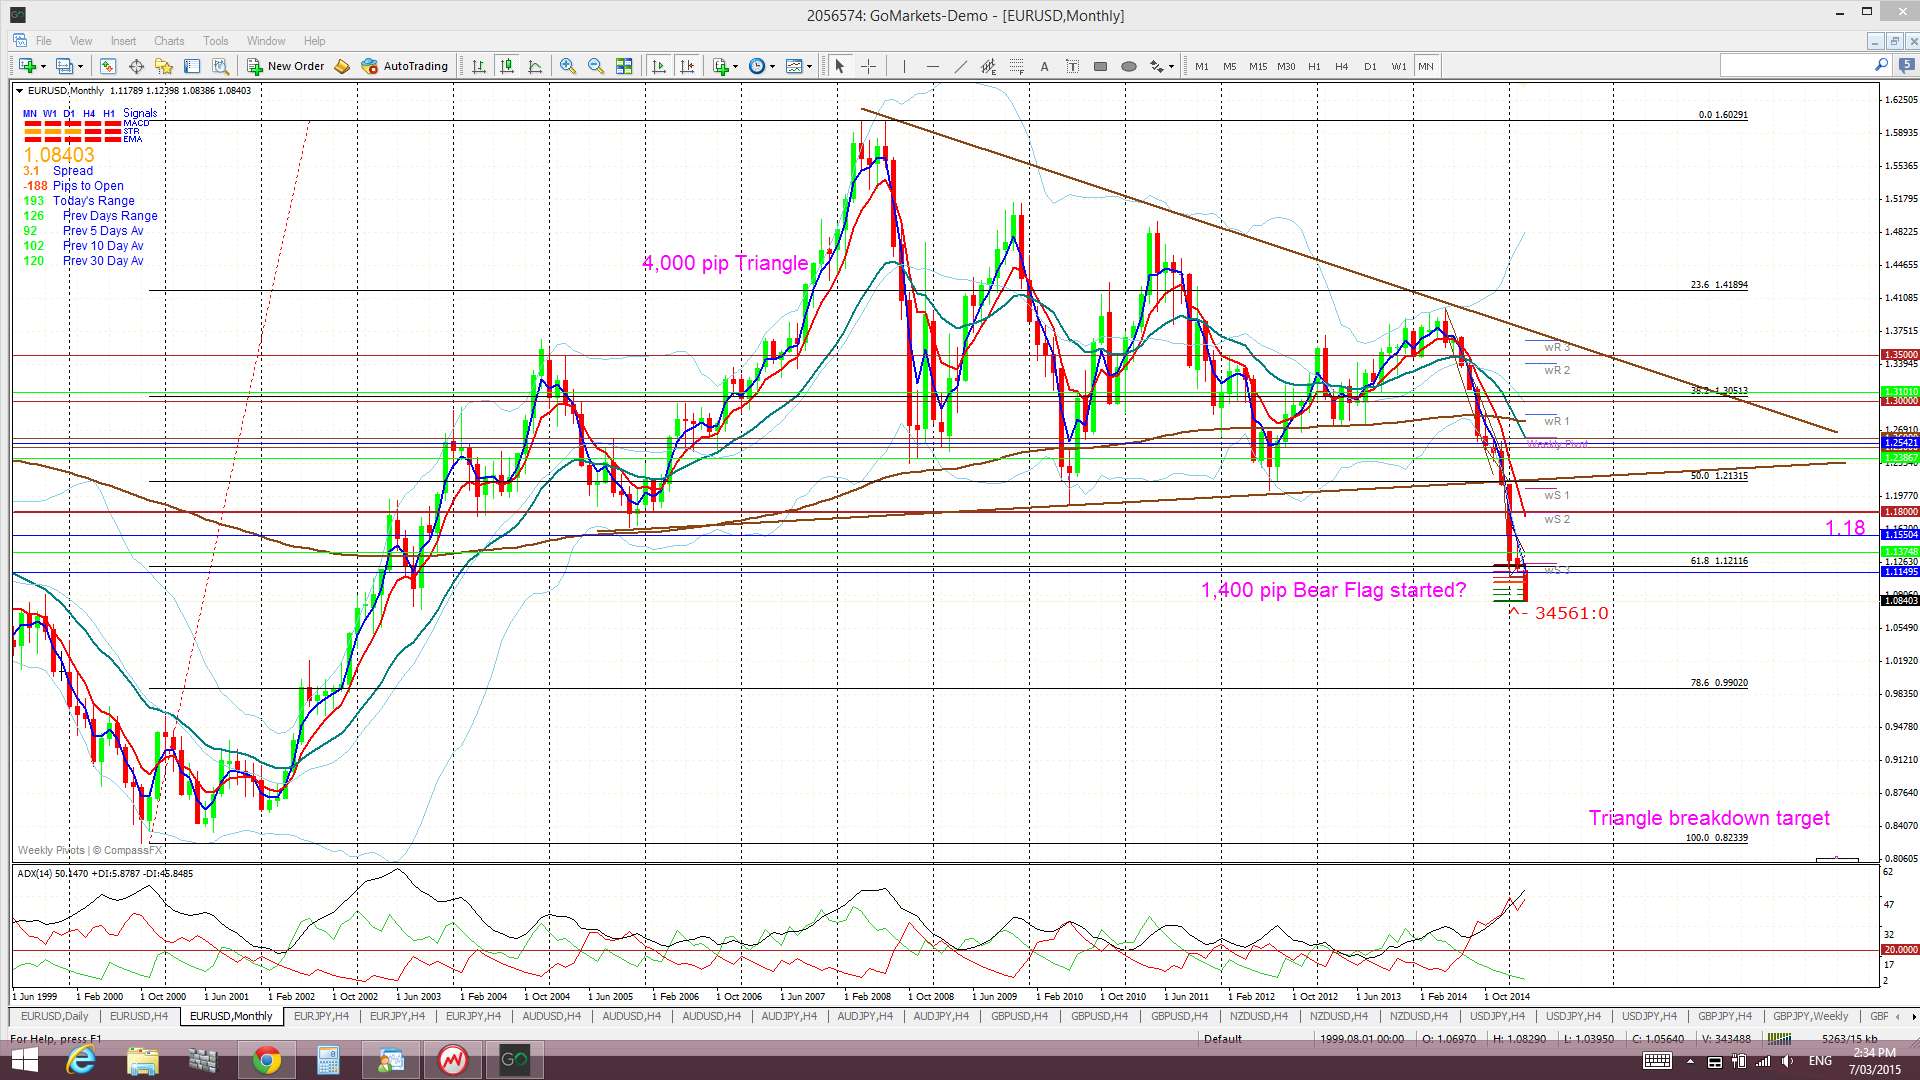
EUR/USD: this pair has held below the 61.8% Fib level on the monthly chart’s last major swing high move and parity is down near the next major level of 78.6%. This now seems an obvious next target.
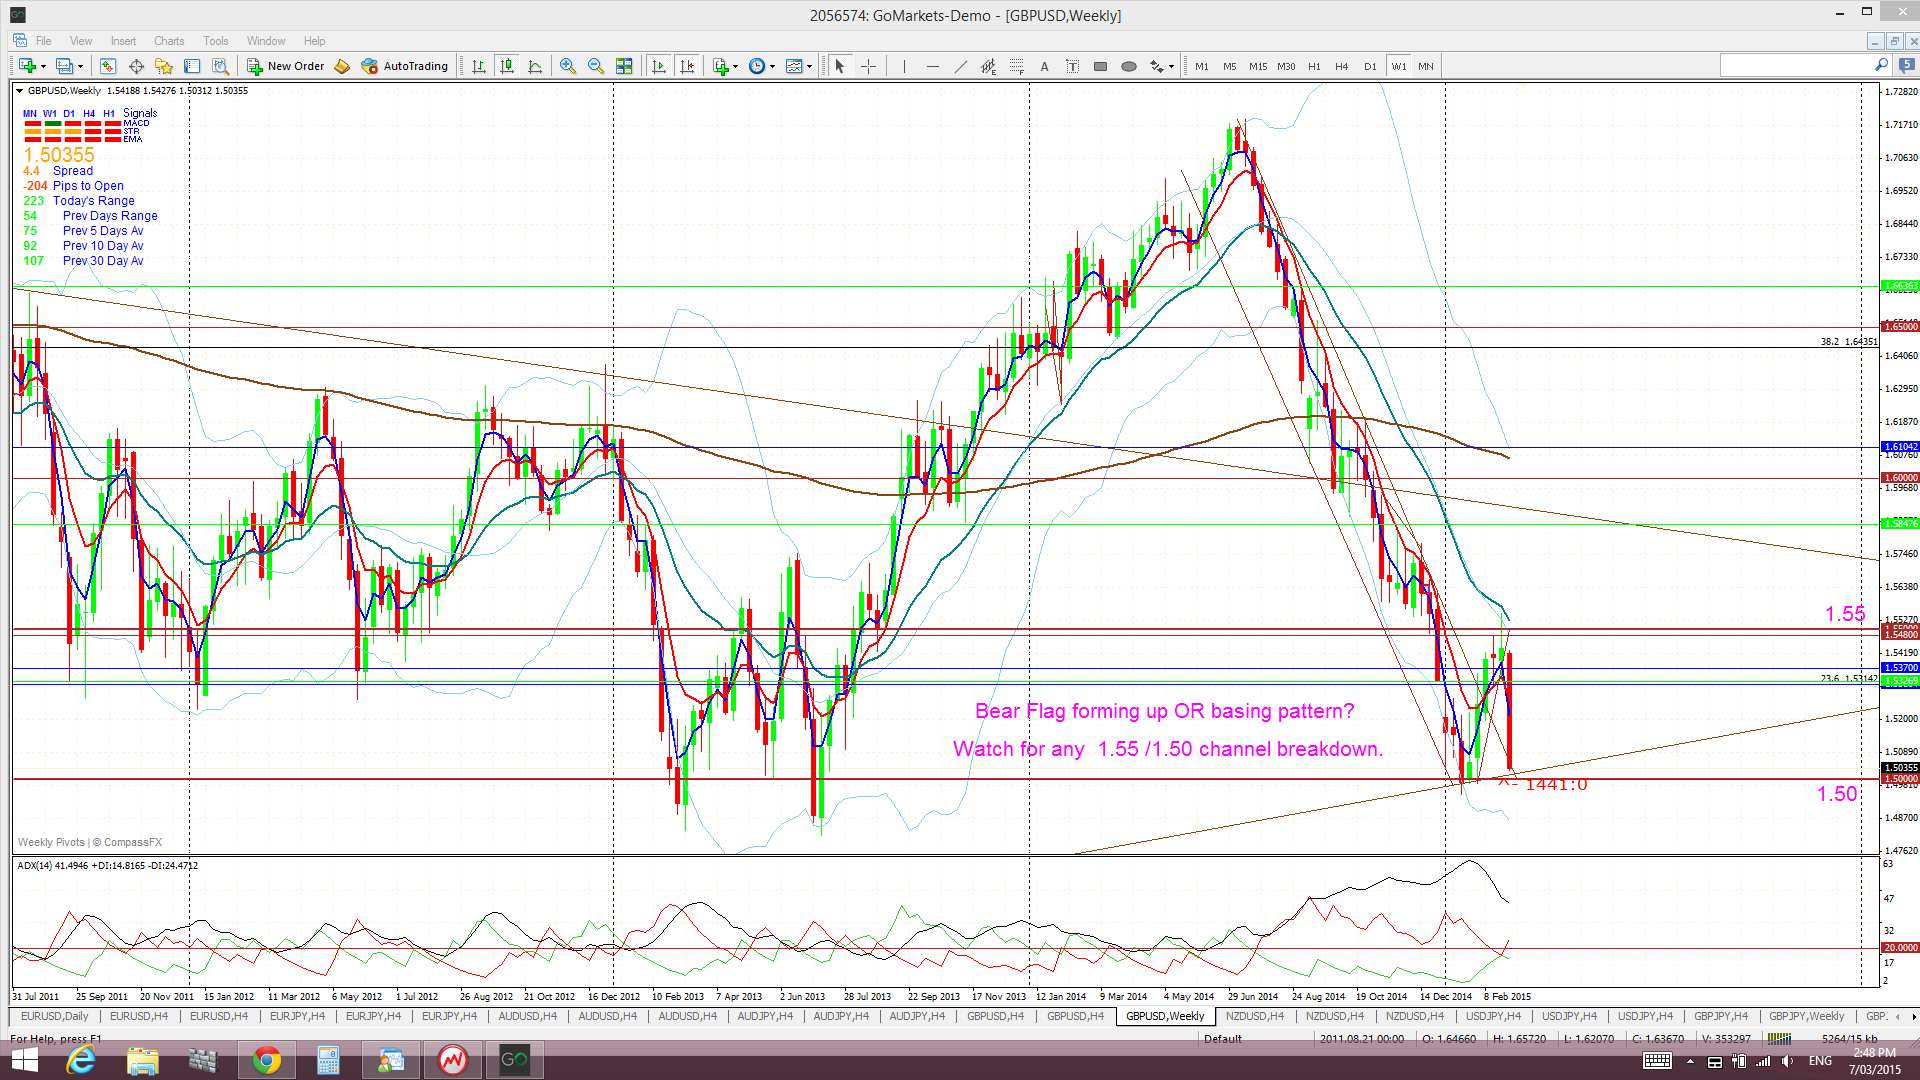
GBP/USD: this could be forming up with a 1,700+ pip Bear Flag on the weekly chart that would take price back to the Dec 2008 lows.
Silver and Gold: both of these commodities were punished with NFP on Friday and are now heading down towards major S/R levels. Any break and hold below these support levels could see both charting new depths and printing lows not seen in a long time.
Events in the Ukraine and the Middle East, as well as with Greek Debt talks, continue to have the potential to undermine any developing ‘risk’ appetite and need to be monitored.
Stocks and broader market sentiment:
US Stocks had a bearish week with the S&P500, DJIA, NASDAQ and Russell 2000 all printing bearish weekly candles. Friday’s NFP result has worried traders & investors that US interest rates might soon be on the rise. It was clearly a case of ‘Good news being Bad news’ but fear and greed have always trumped logic!
I have stated previously that I am looking for the NASDAQ to test its triangle breakout region of 4,800 before any possible continuation and price is still well above this level. Any break and hold back below 4,800 on the NASDAQ could be a short term game changer though and, if that evolves, I’ll be watching for the S&P500 to pullback to test its daily and monthly support trend lines and, finally, the triangle breakout region of 1,600.
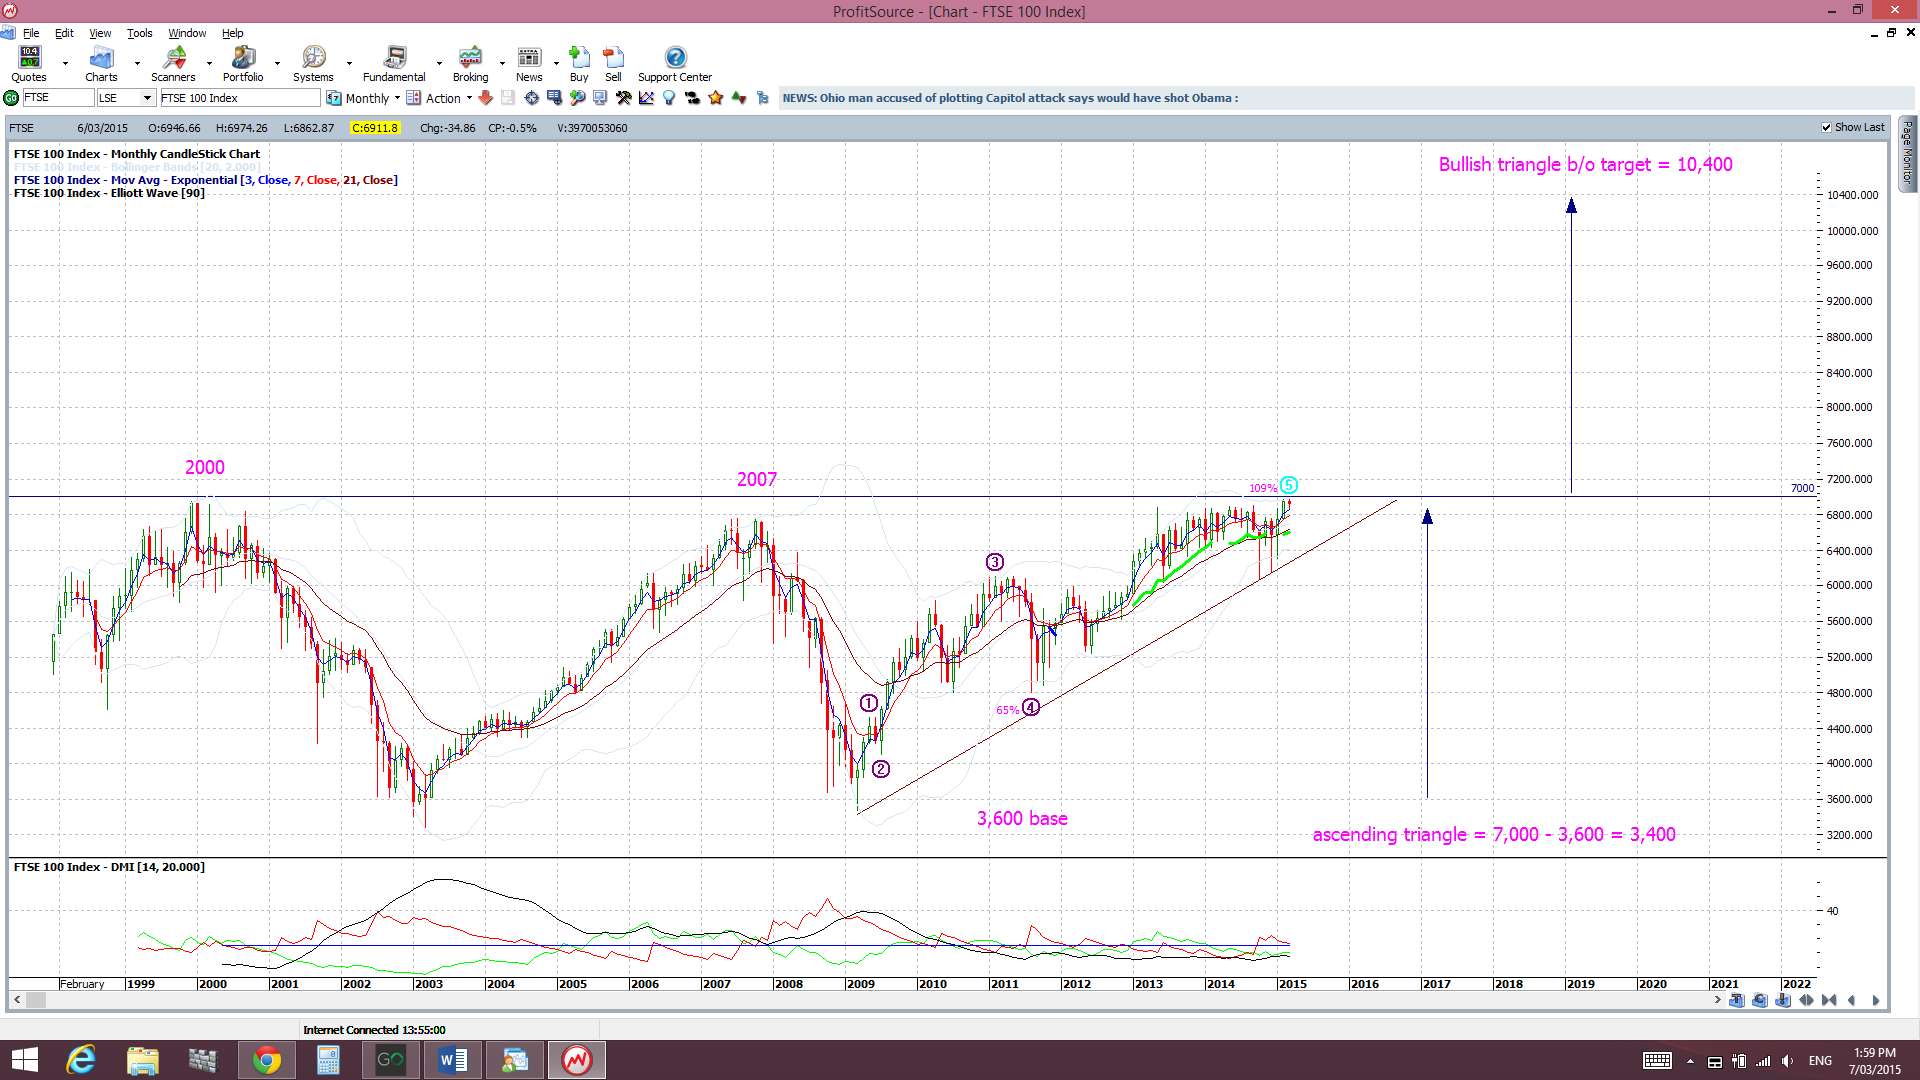
I am still watching London’s FTSE-100 for any breakout above the key 7,000 region:
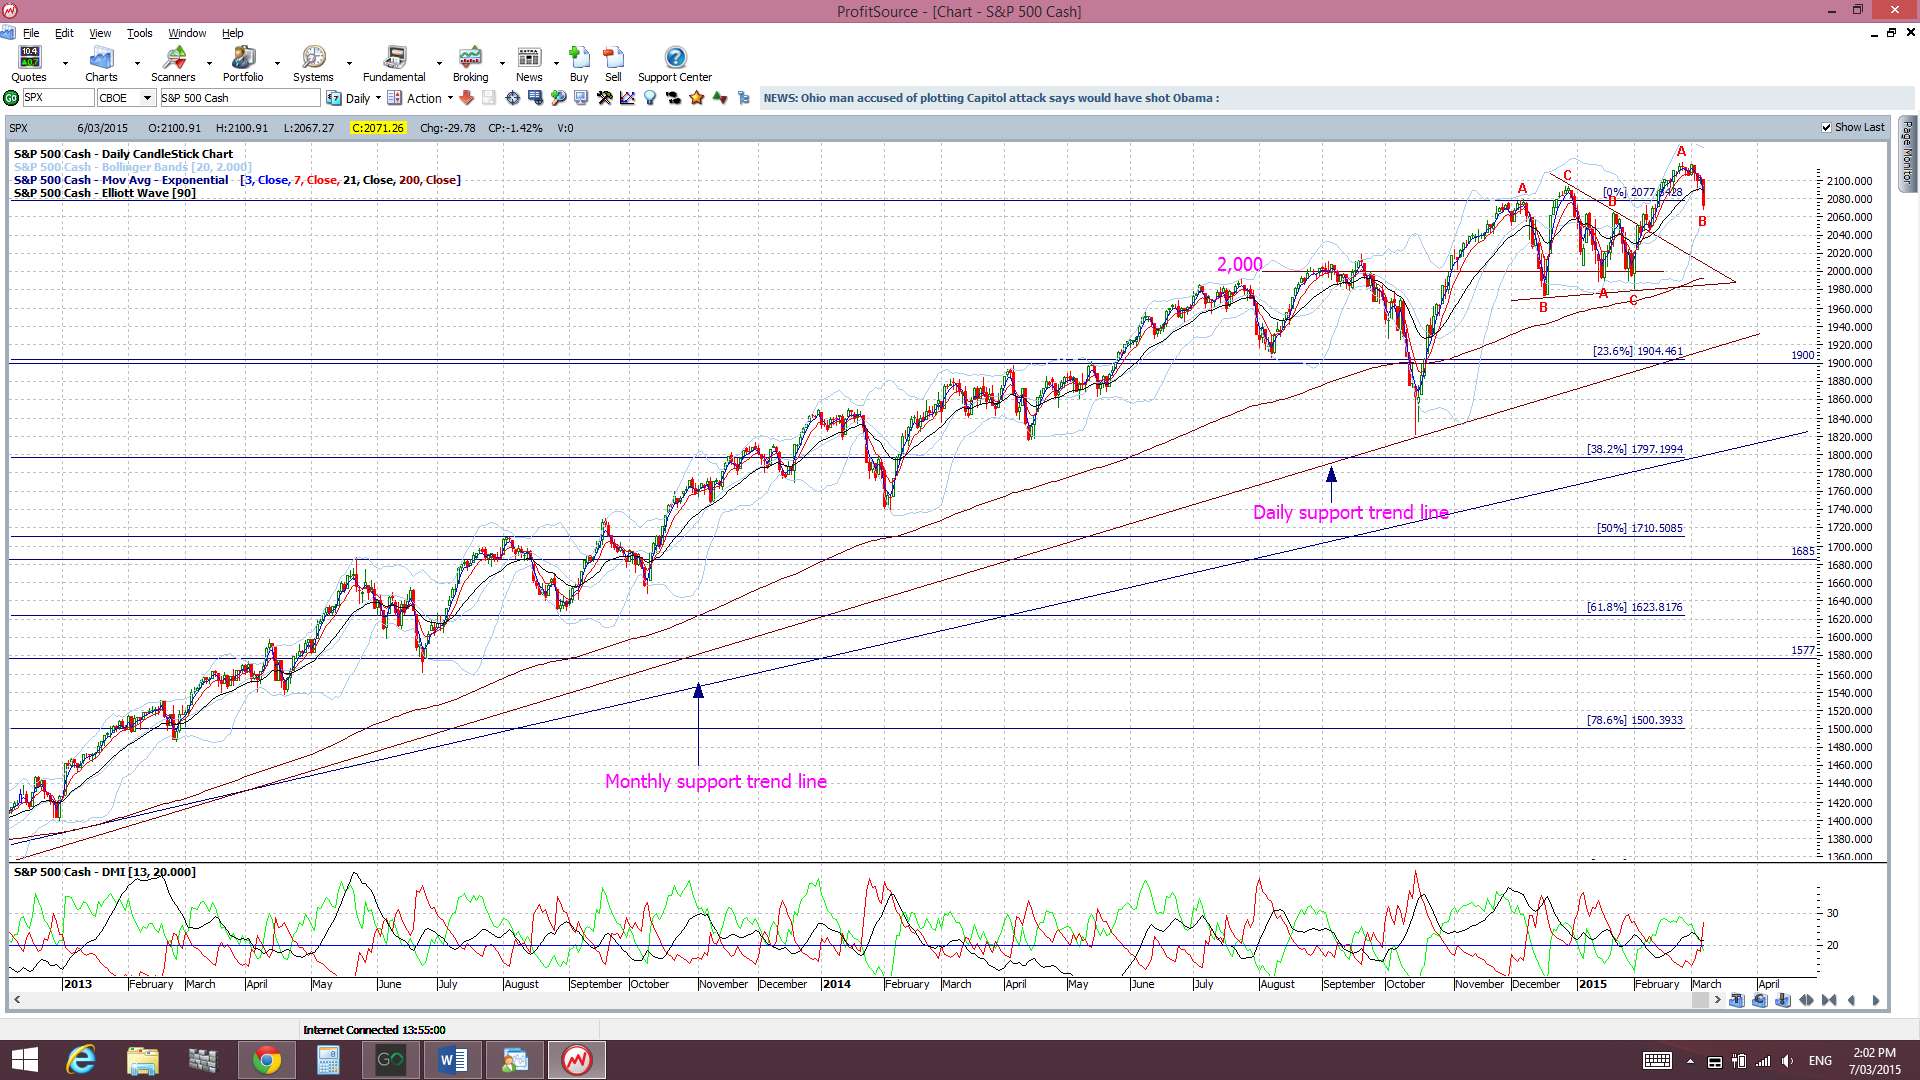
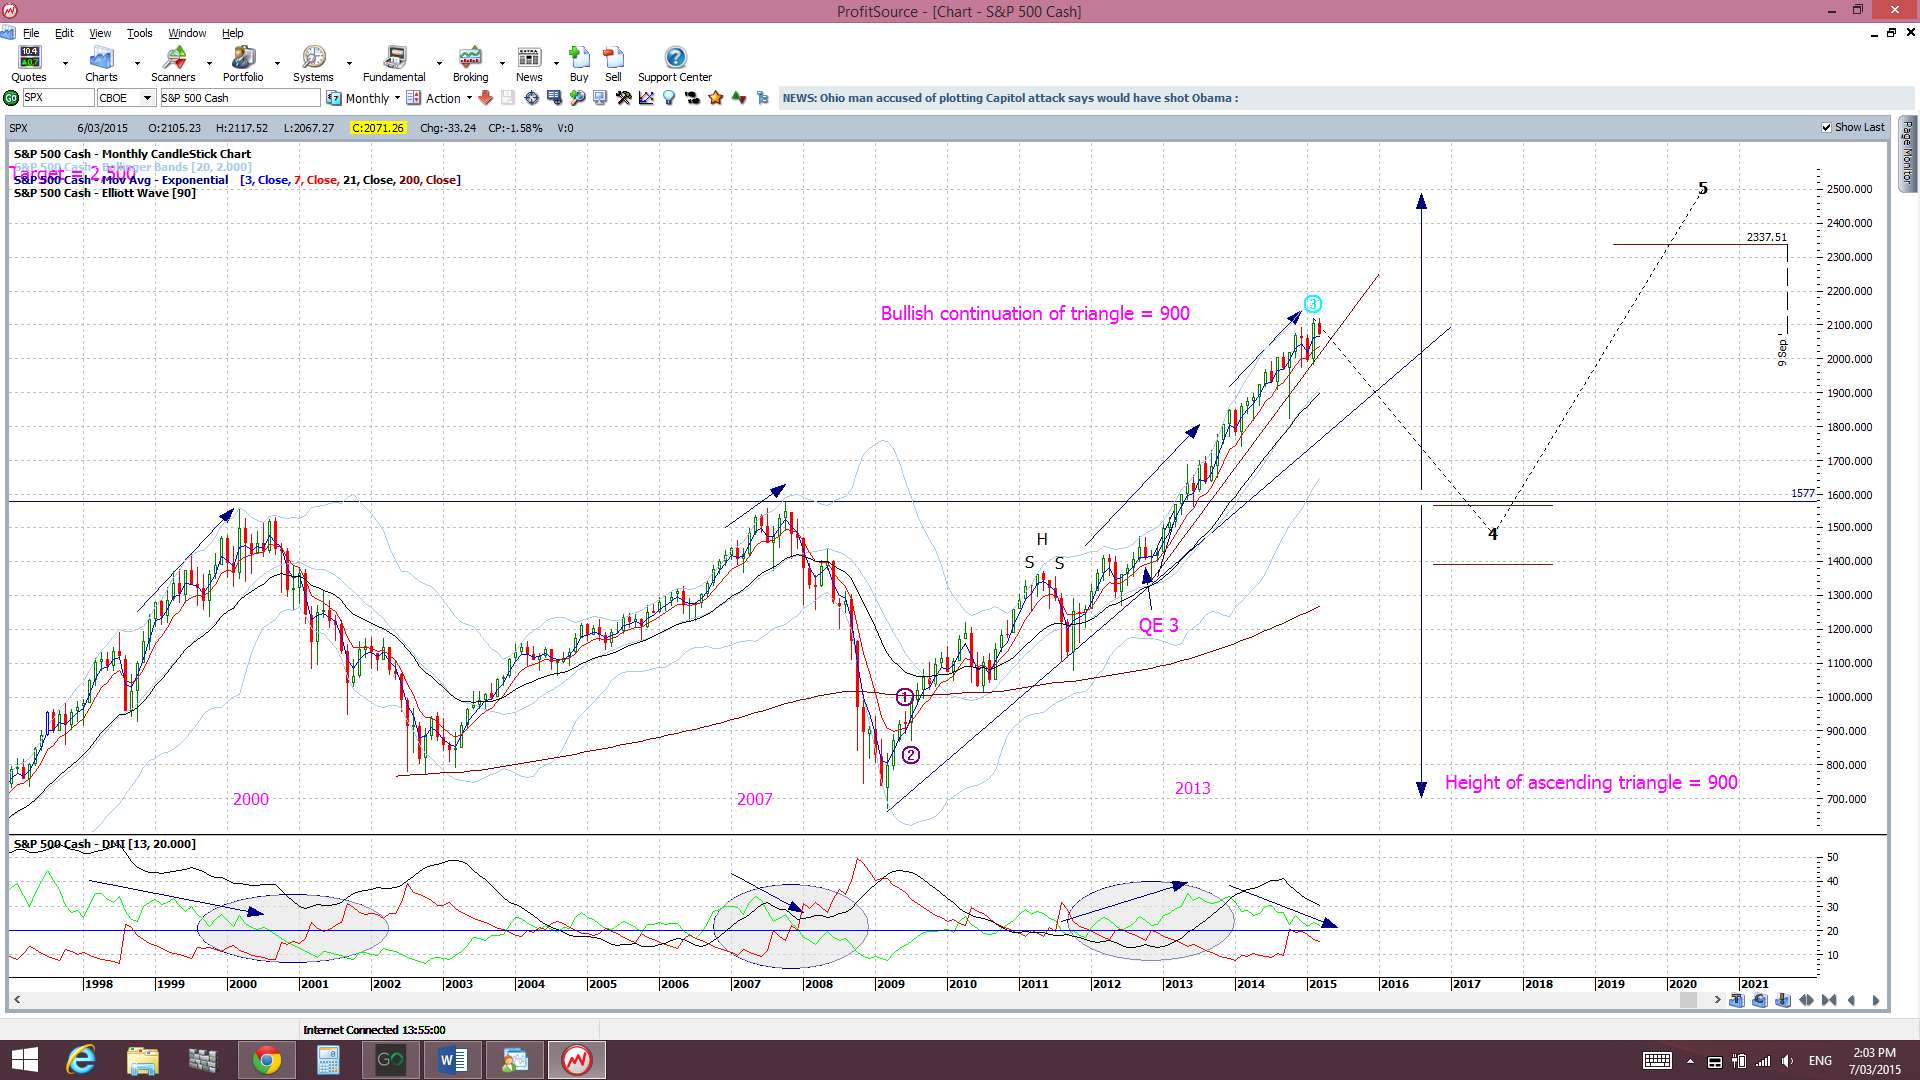
The S&P500 is still navigating new highs above 2000 but the chance of a deeper pullback cannot be ruled out. There has not been any real deep pull back since the break up through the 1,577, 1,600, 1,700 and 1,800 levels and the major break of the 1,577 level was only tested once.
Thus, with all of this, I continue to watch out for further clues as to any new momentum move, long or short though! In particular I’m looking out for:
S&P500 daily chart: The index is still trading above the psychological 2,000 level and above the daily trend line.
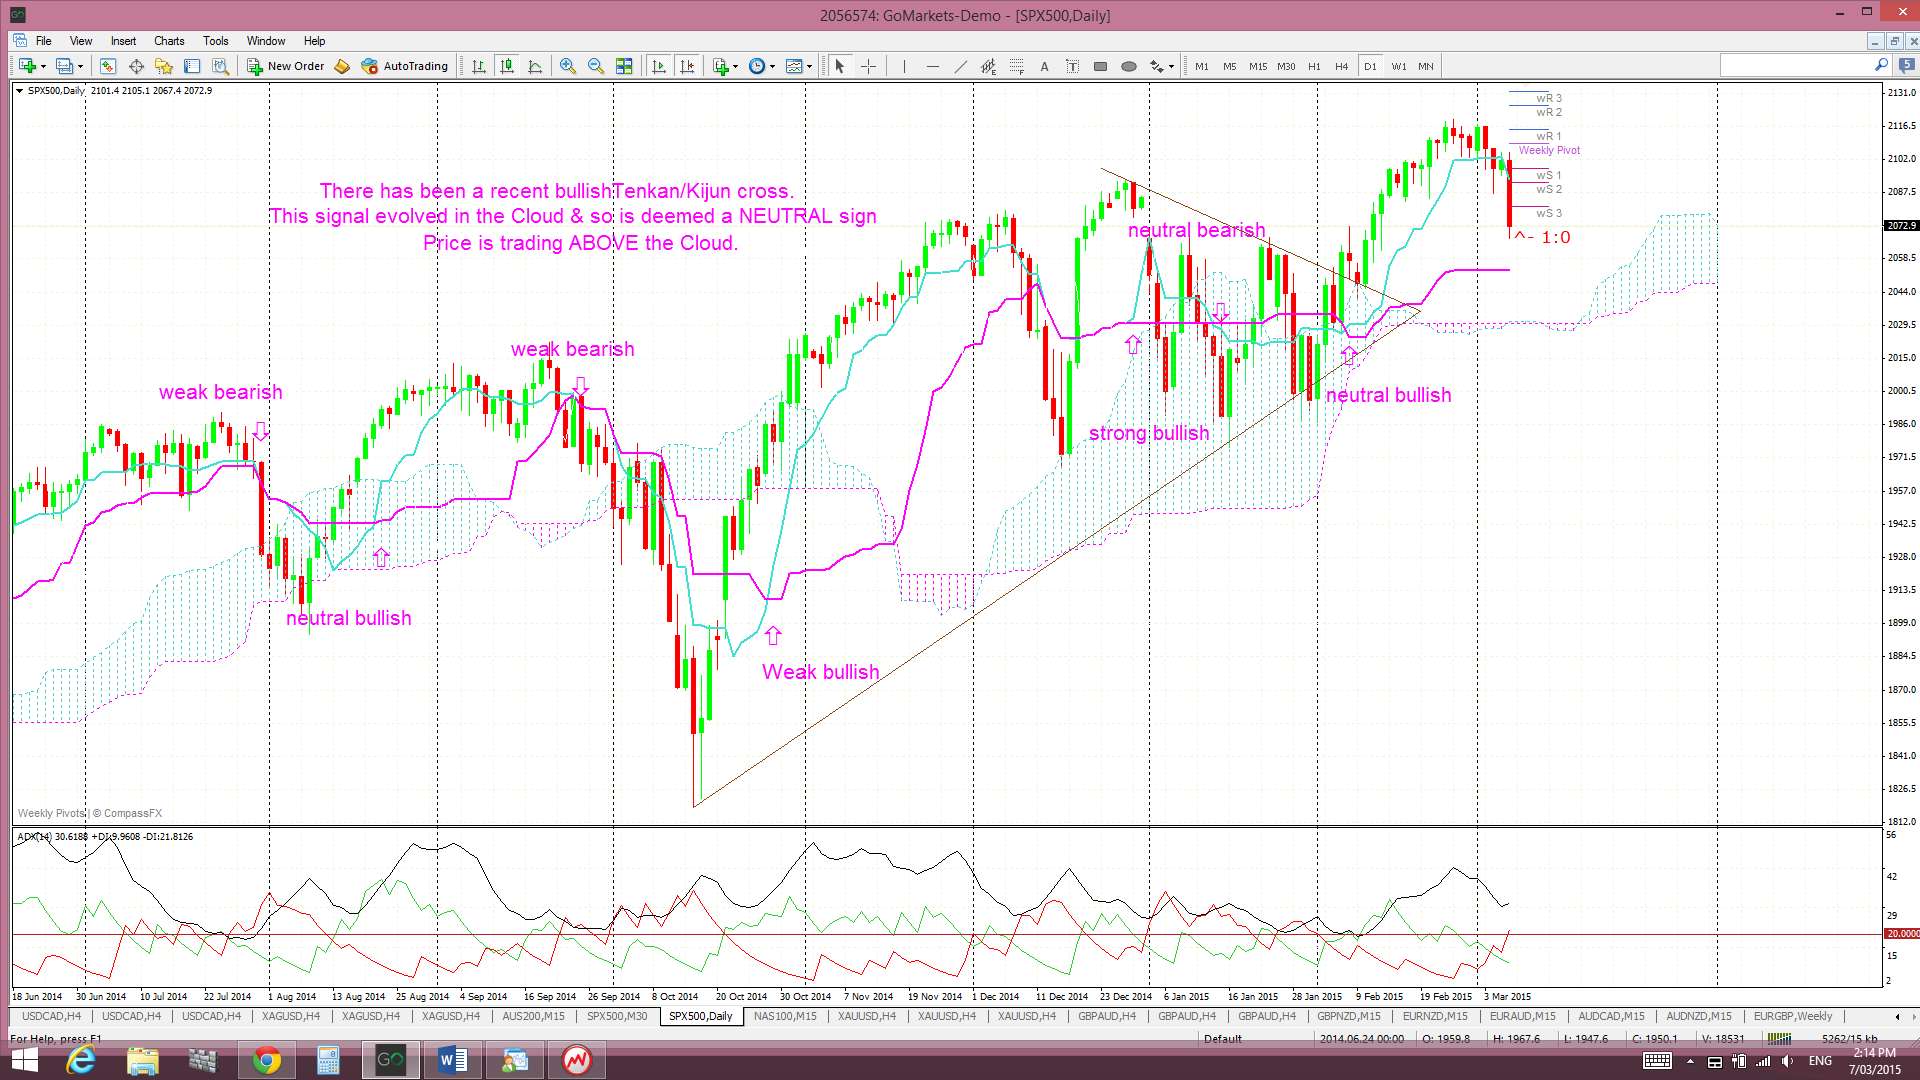
Ichimoku S&P500 chart: a clear cross of the blue Tenkan-sen line below the pink Kijun-sen line. There has been a recent bullish Tenkan/Kijun signal and index is still trading above the Cloud.
S&P500 monthly chart: a break of the monthly support trend line (see monthly chart). The monthly trend line remains intact. A break of this support level would suggest to me of a more severe pull back or correction.
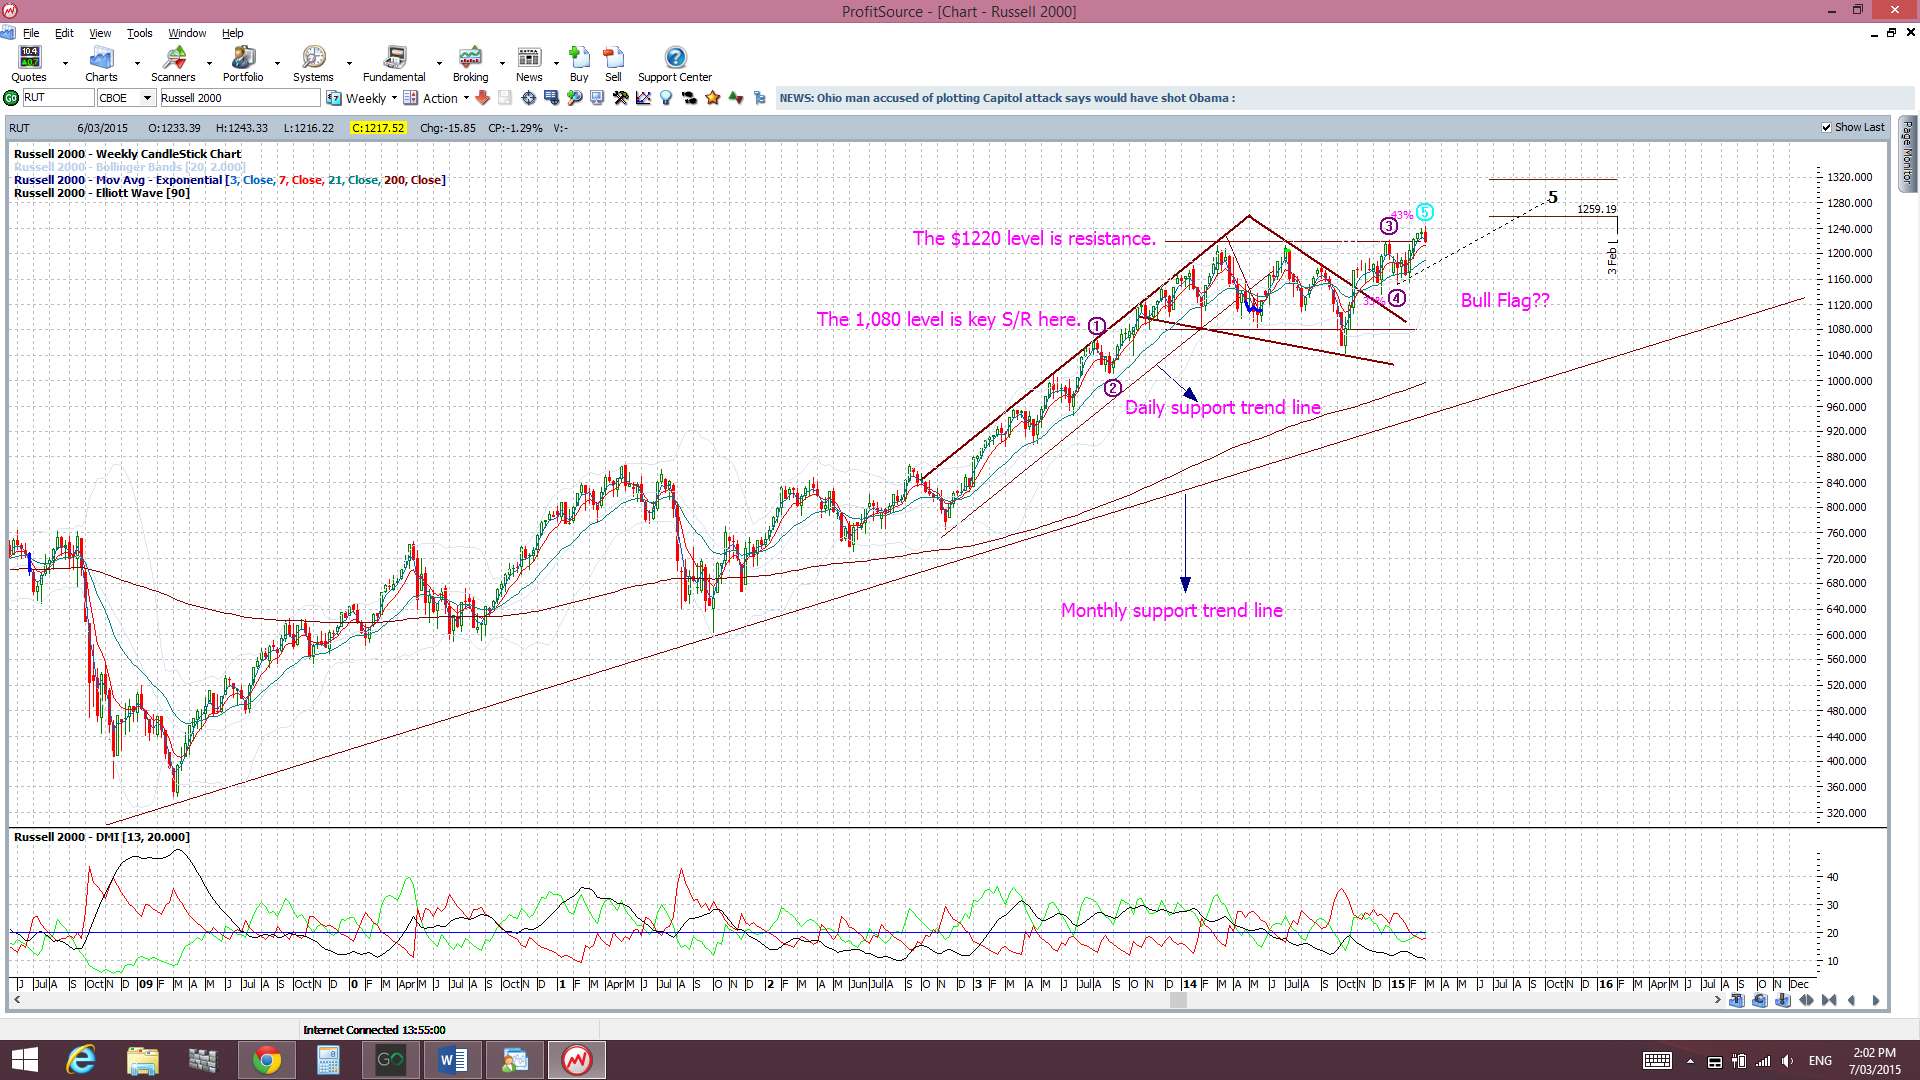
Russell 2000 Index: this small caps index is a bit of a US market ‘bellwether’ but has dipped back below the key 1,220 level. The Bull Flag still seems to be holding up though:
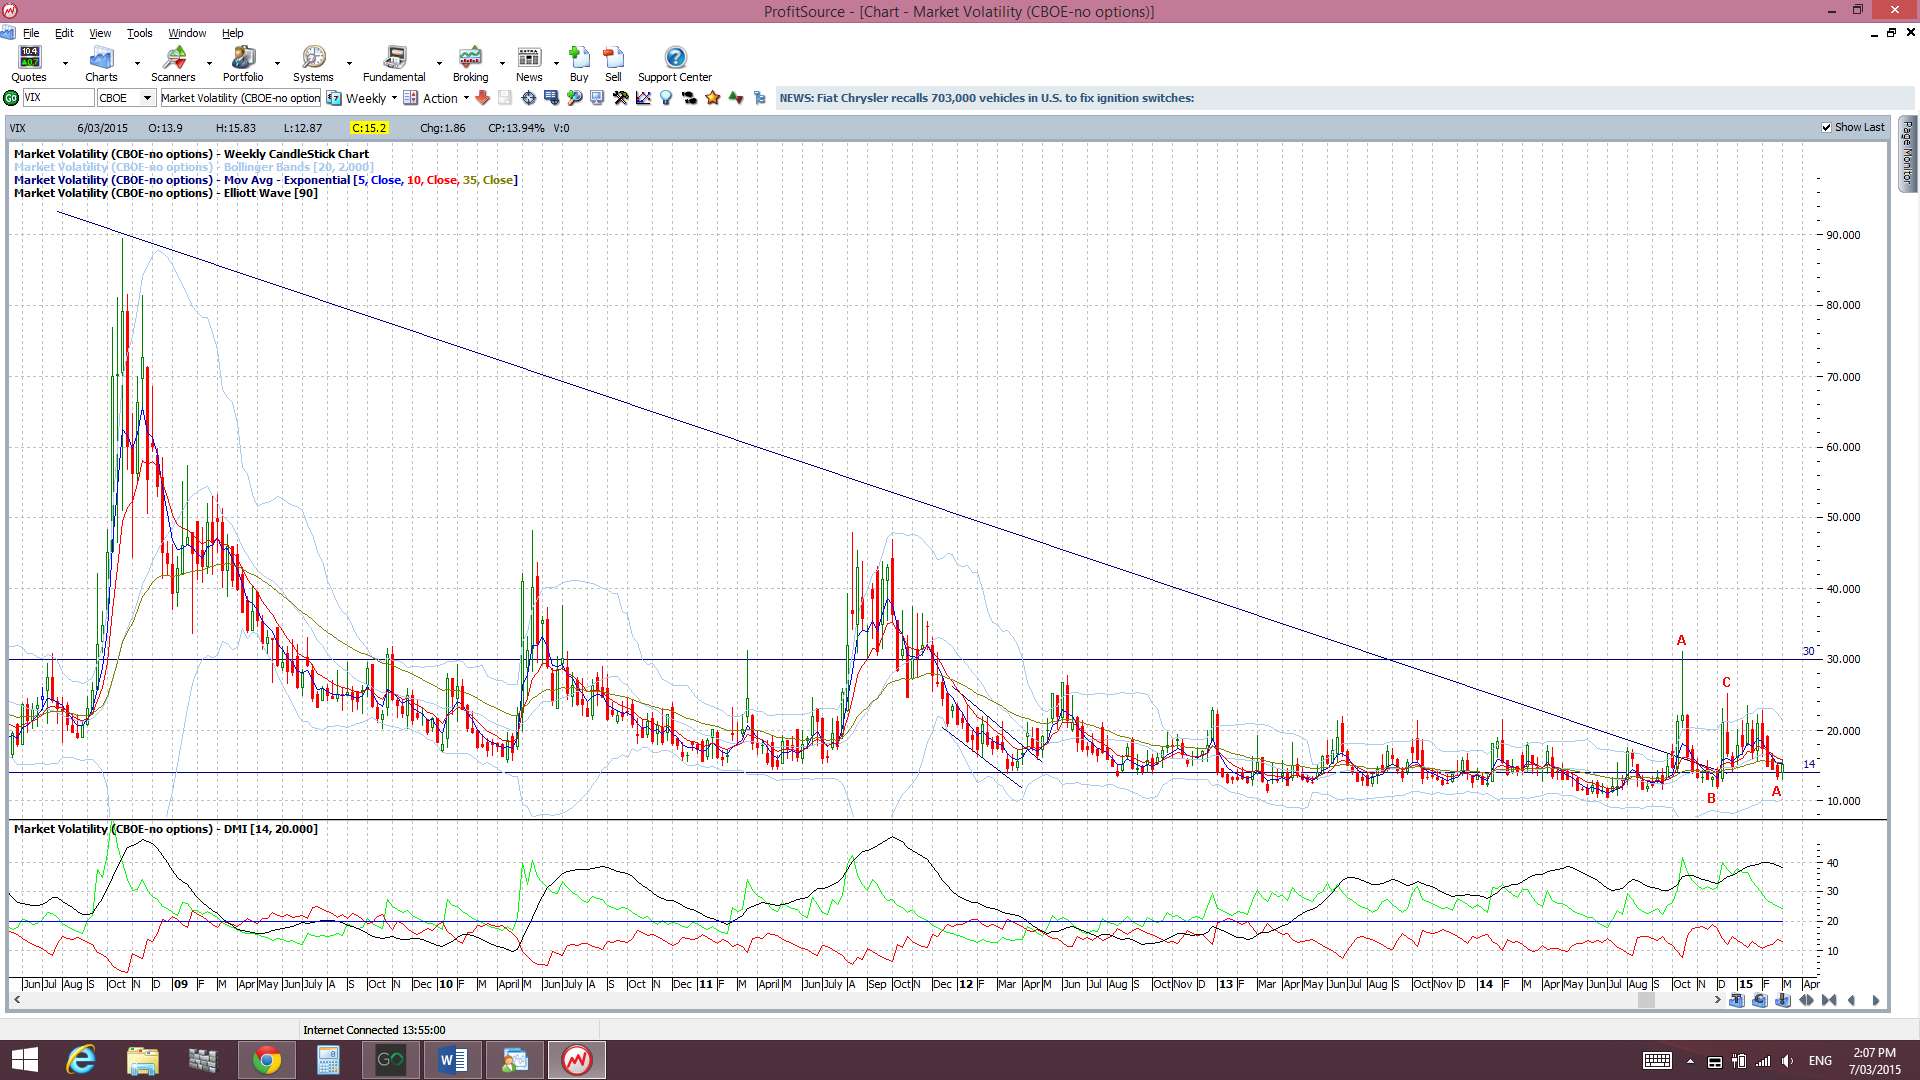
VIX Index: The ‘Fear’ index is still trading below 20 despite the stock carnage on Friday!
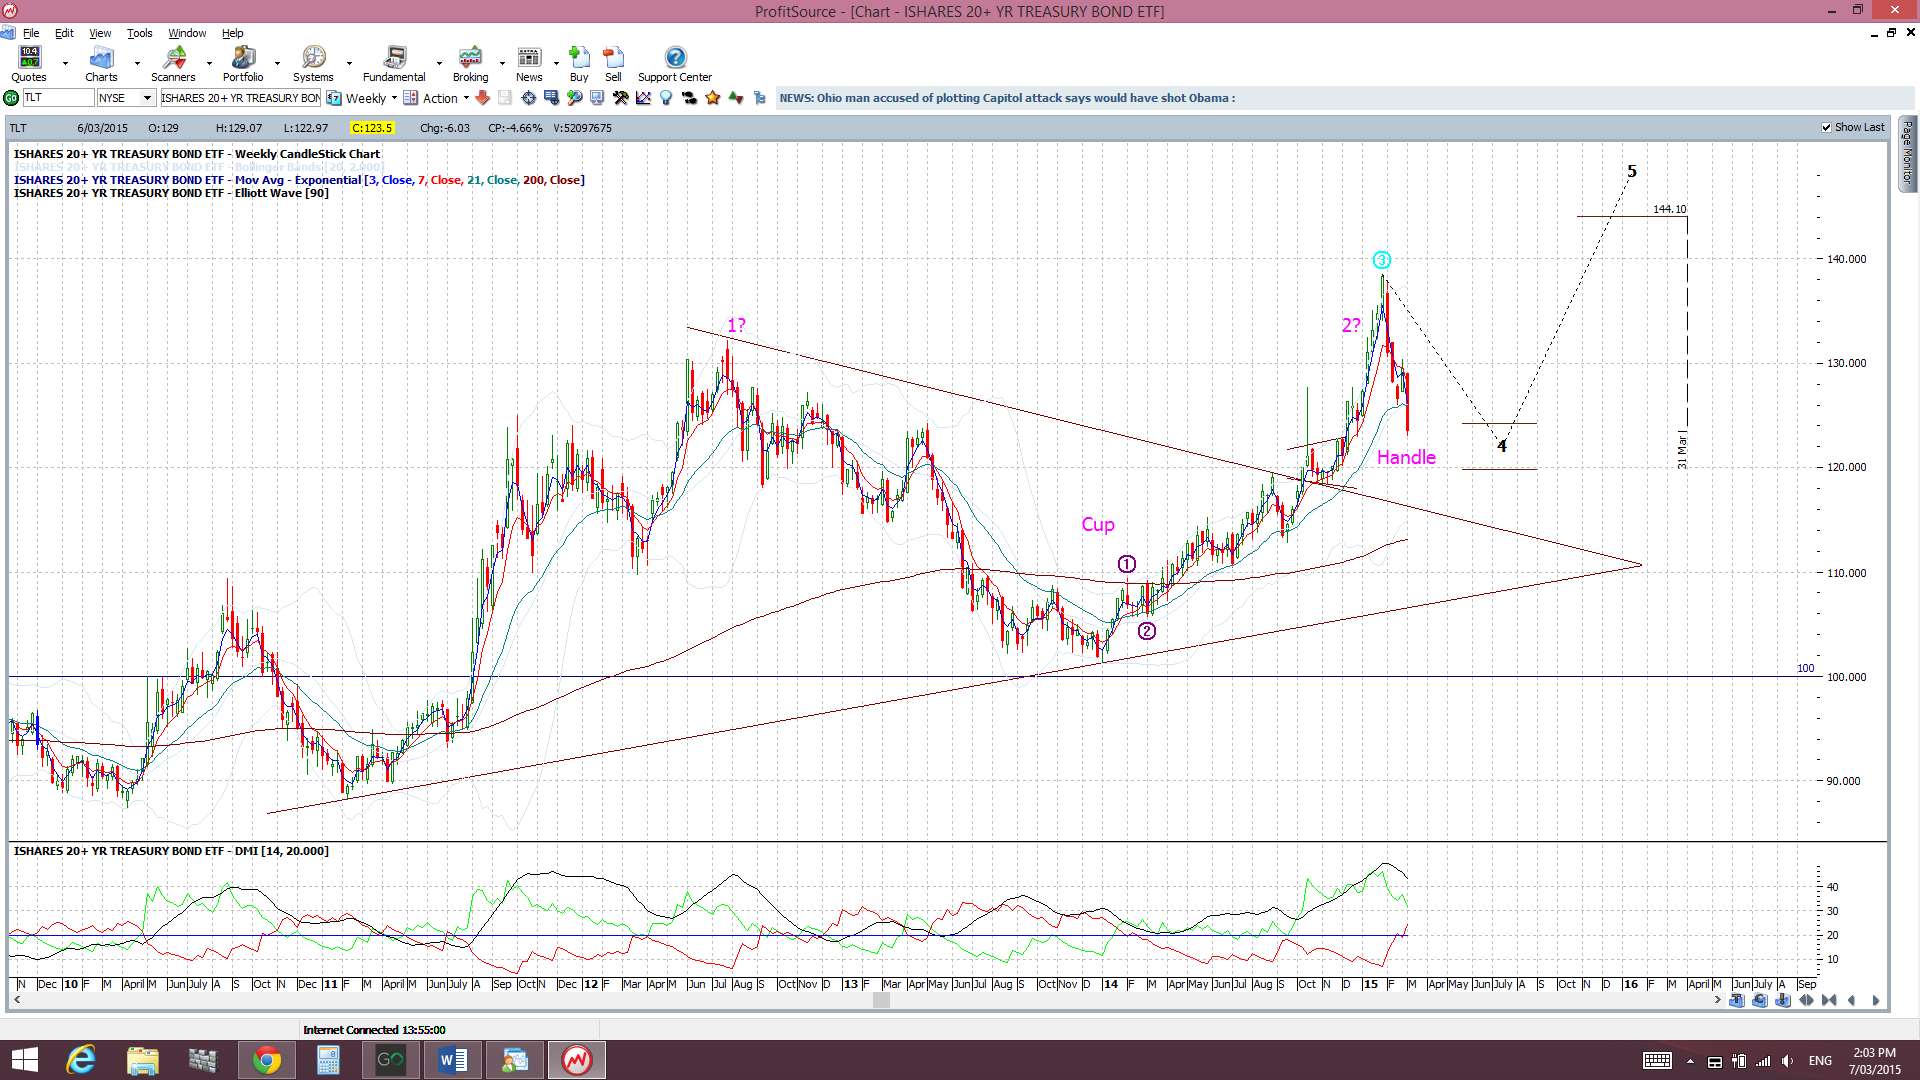
Bonds: The bond ETF has continued with its bearish run. Bonds trade inversely to the US$ and Treasury Yields and the latter two have rallied with NFP.
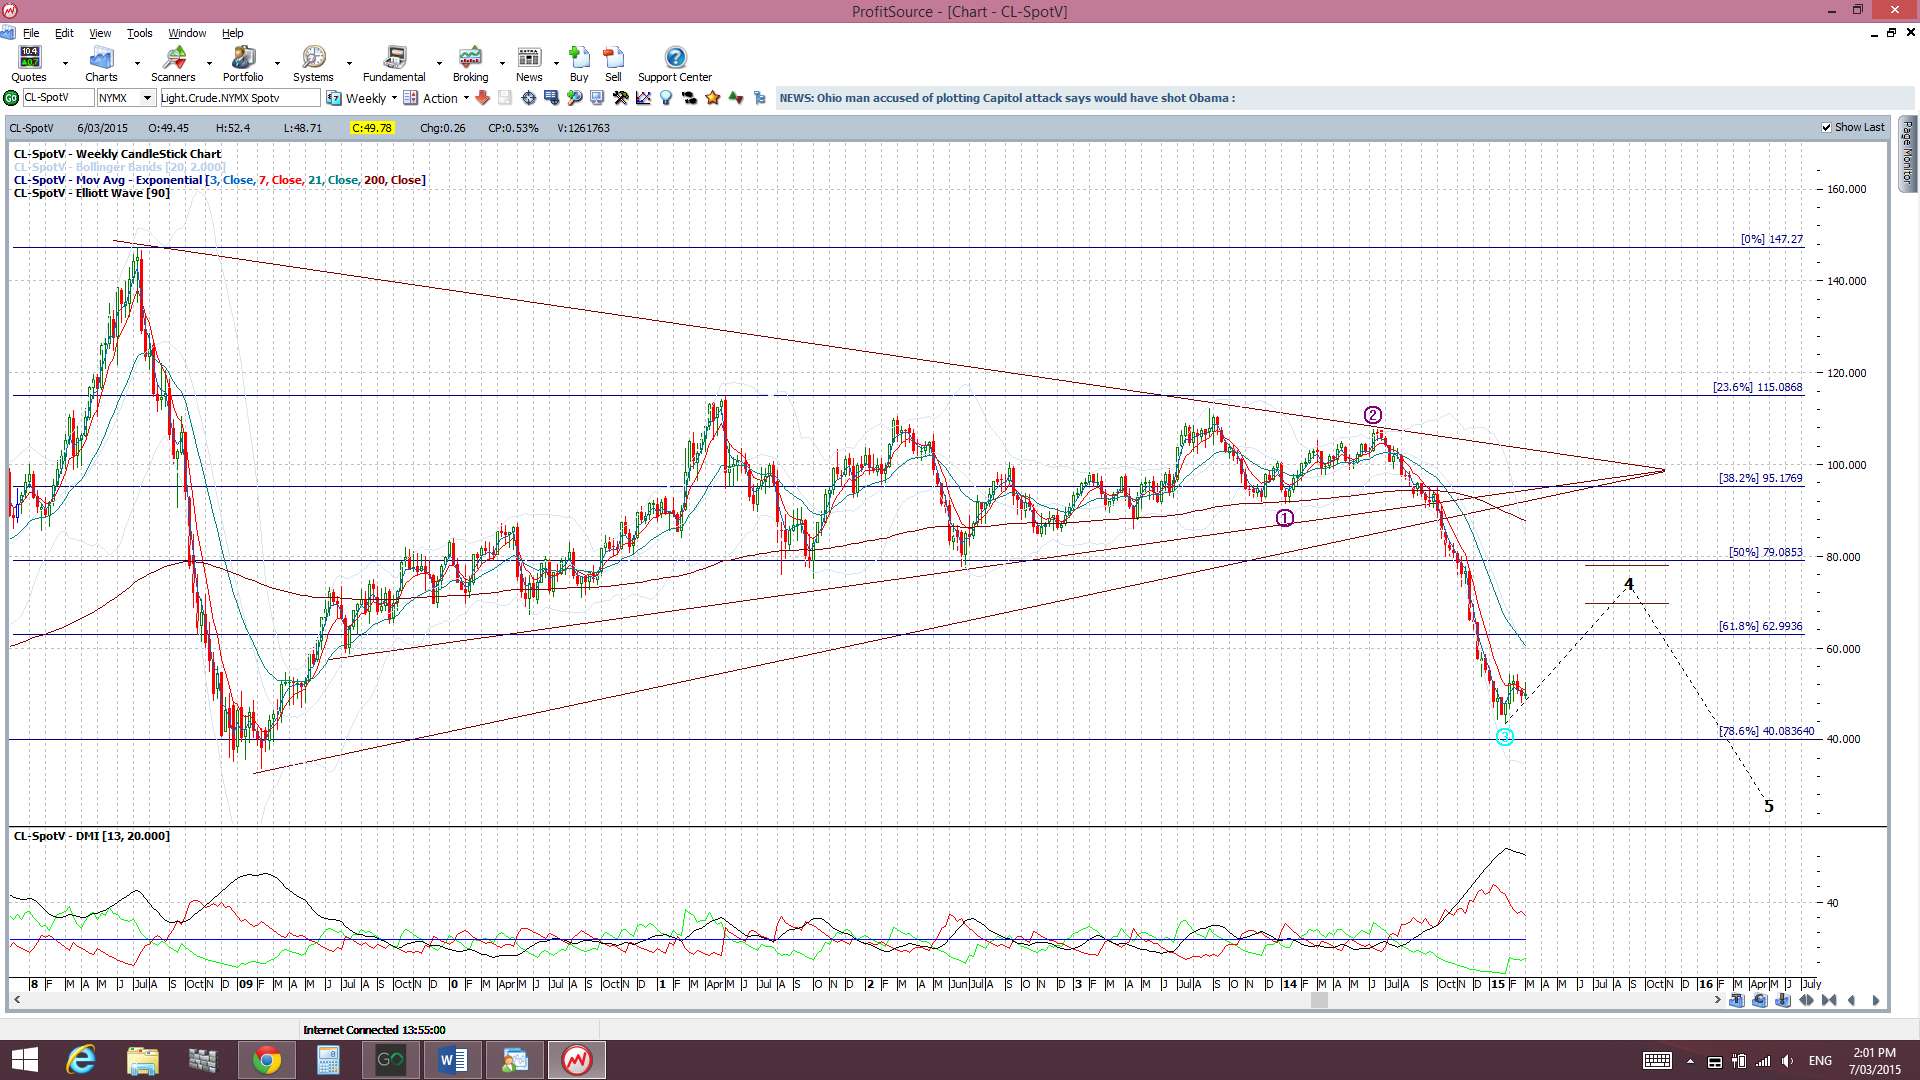
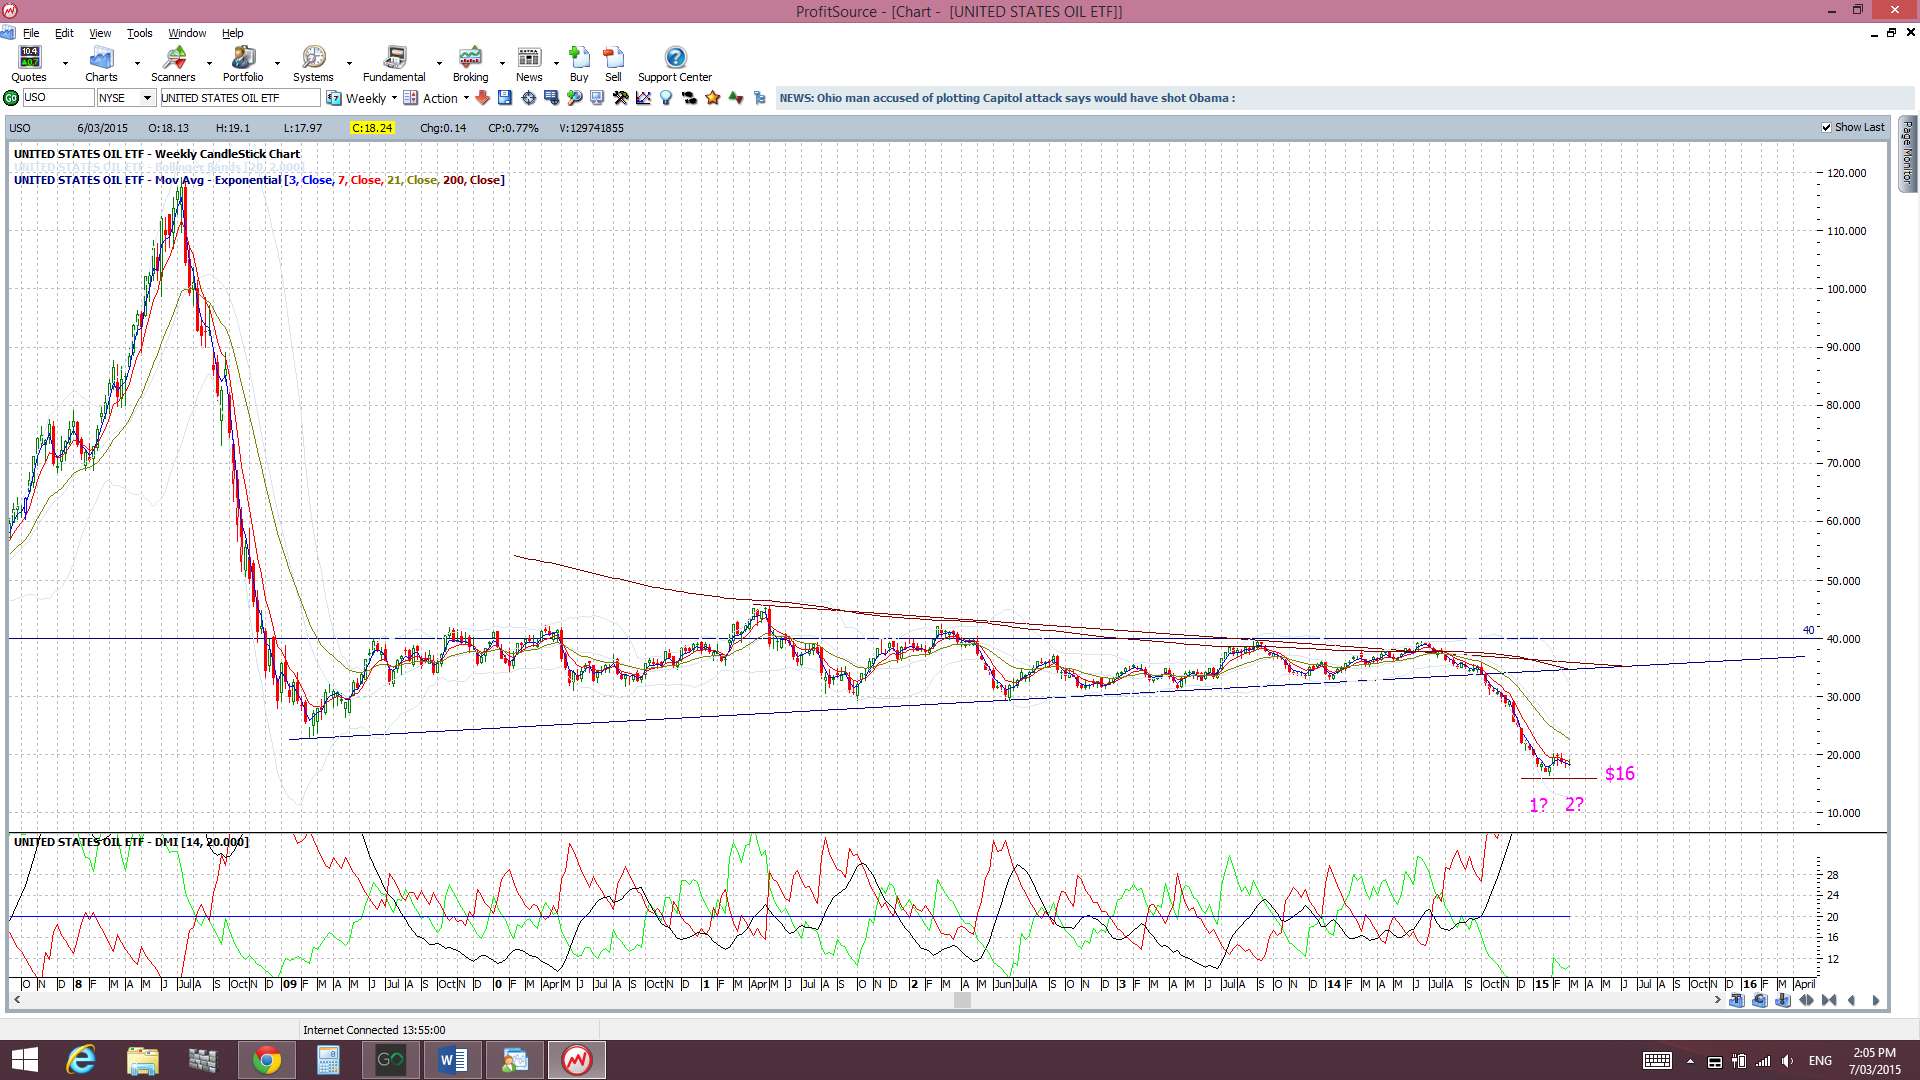
Oil: Oil, surprisingly given the USD rally, printed a bullish albeit Doji candle last week and is still above $40 support. Note the Oil ETF, USO. The $16 level could provide some ‘Double Bottom’ support but a break and hold below this would suggest bearish continuation. It’s a level worth watching though.
Trading Calendar Items to watch out for:
- Sun 8th: CNY Trade Balance. USD & CAD Daylight Saving Time shift.
- Mon 9th: EUR Eurogroup Meetings.
- Tue 10th: AUD NAB Business Confidence. CNY CPI. EUR ECOFIN meetings.
- Wed 11th: CNY Industrial Production. GBP Manufacturing Production.
- Thurs 12th: NZD RBNZ Monetary Policy, Statement & Press Conference. AUD Unemployment Rate. USD Retail Sales & Unemployment data.
- Fri 13th: CAD Unemployment rate. USD PPI & Prelim UoM Consumer Sentiment.
Forex:
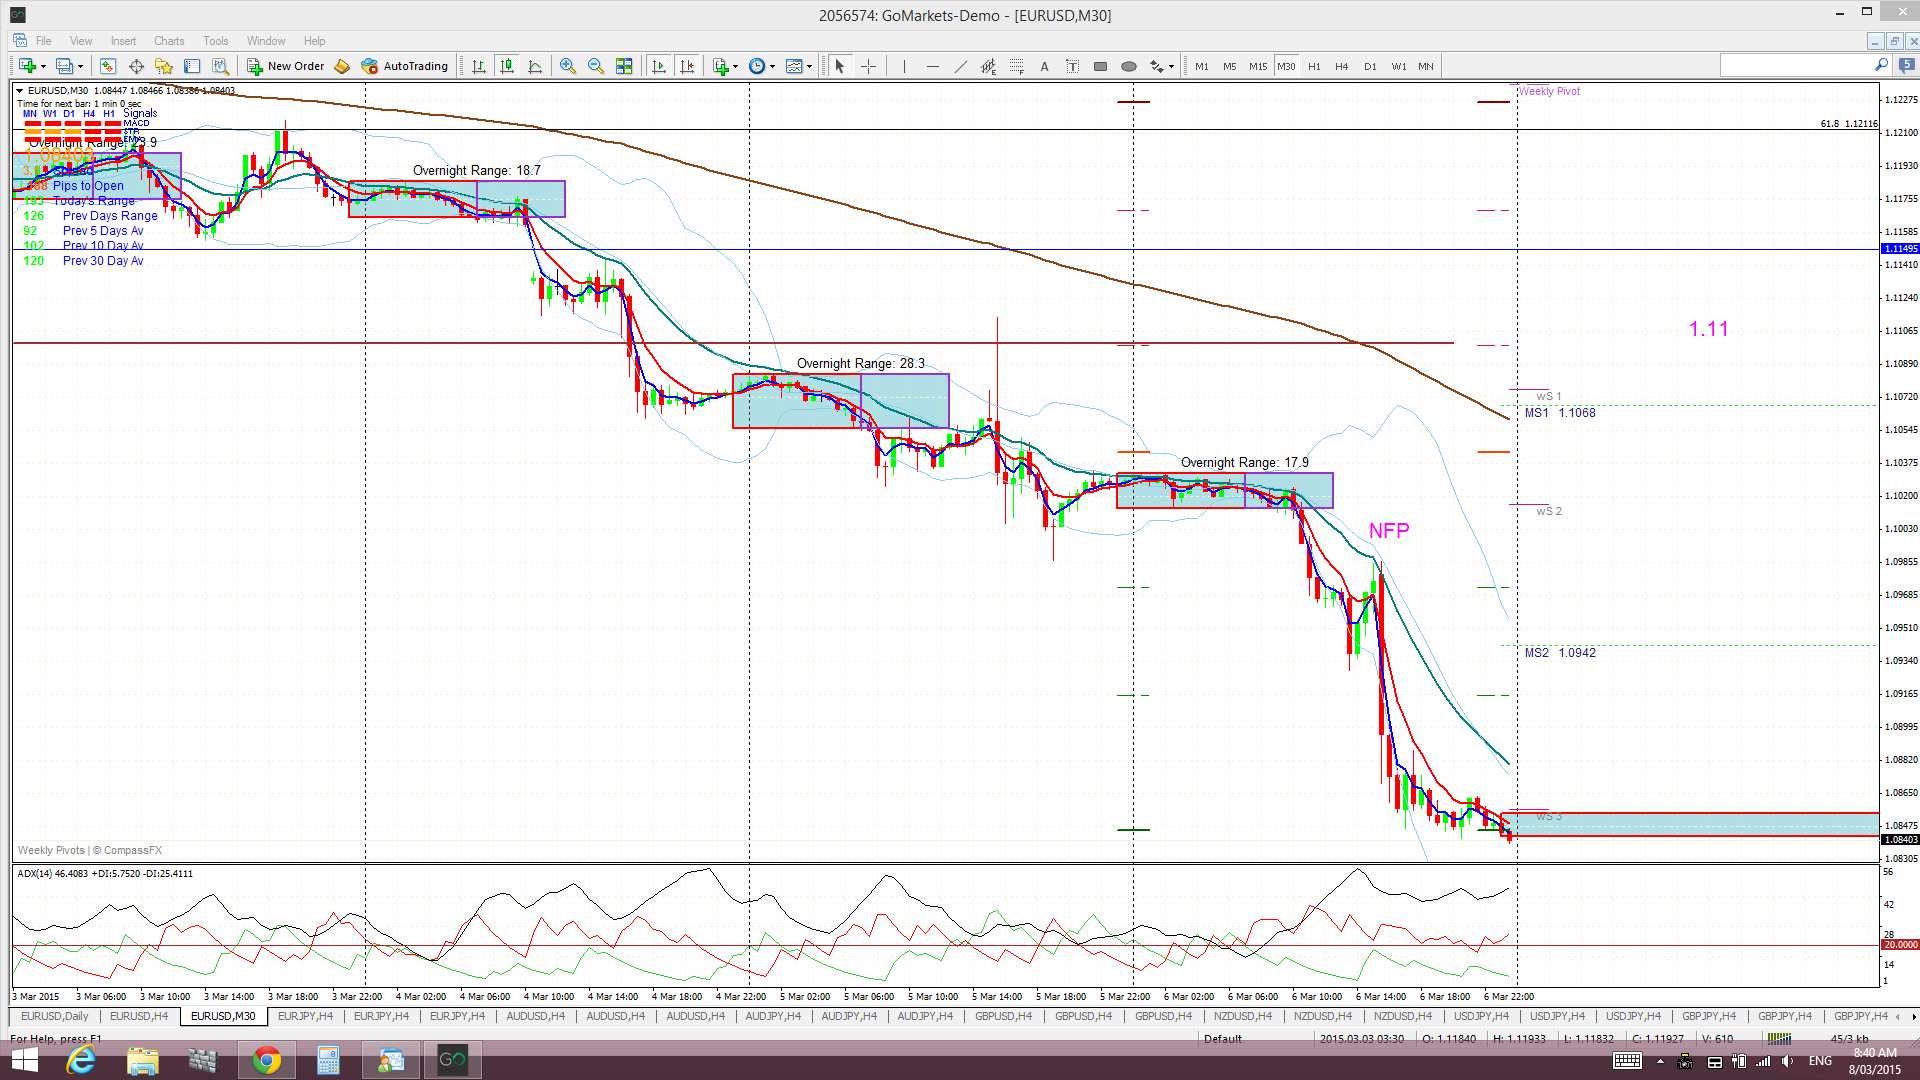
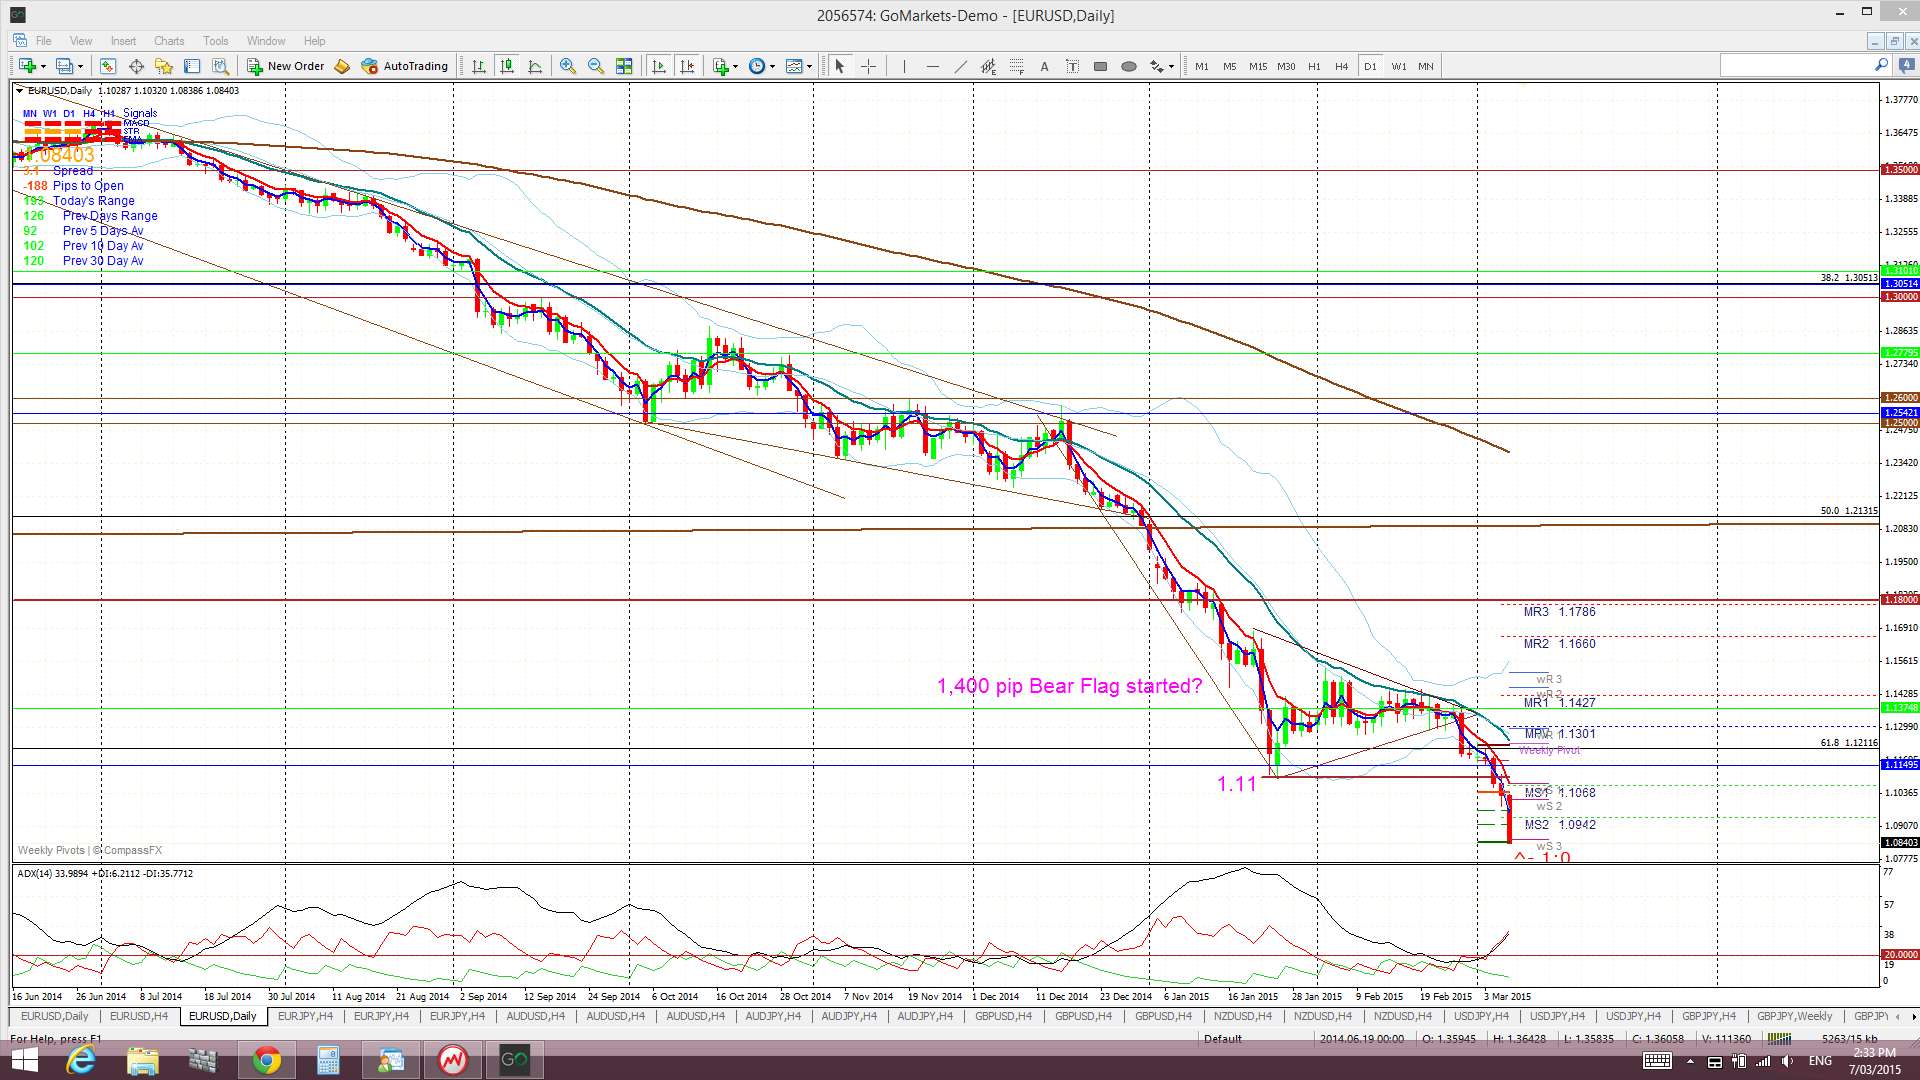
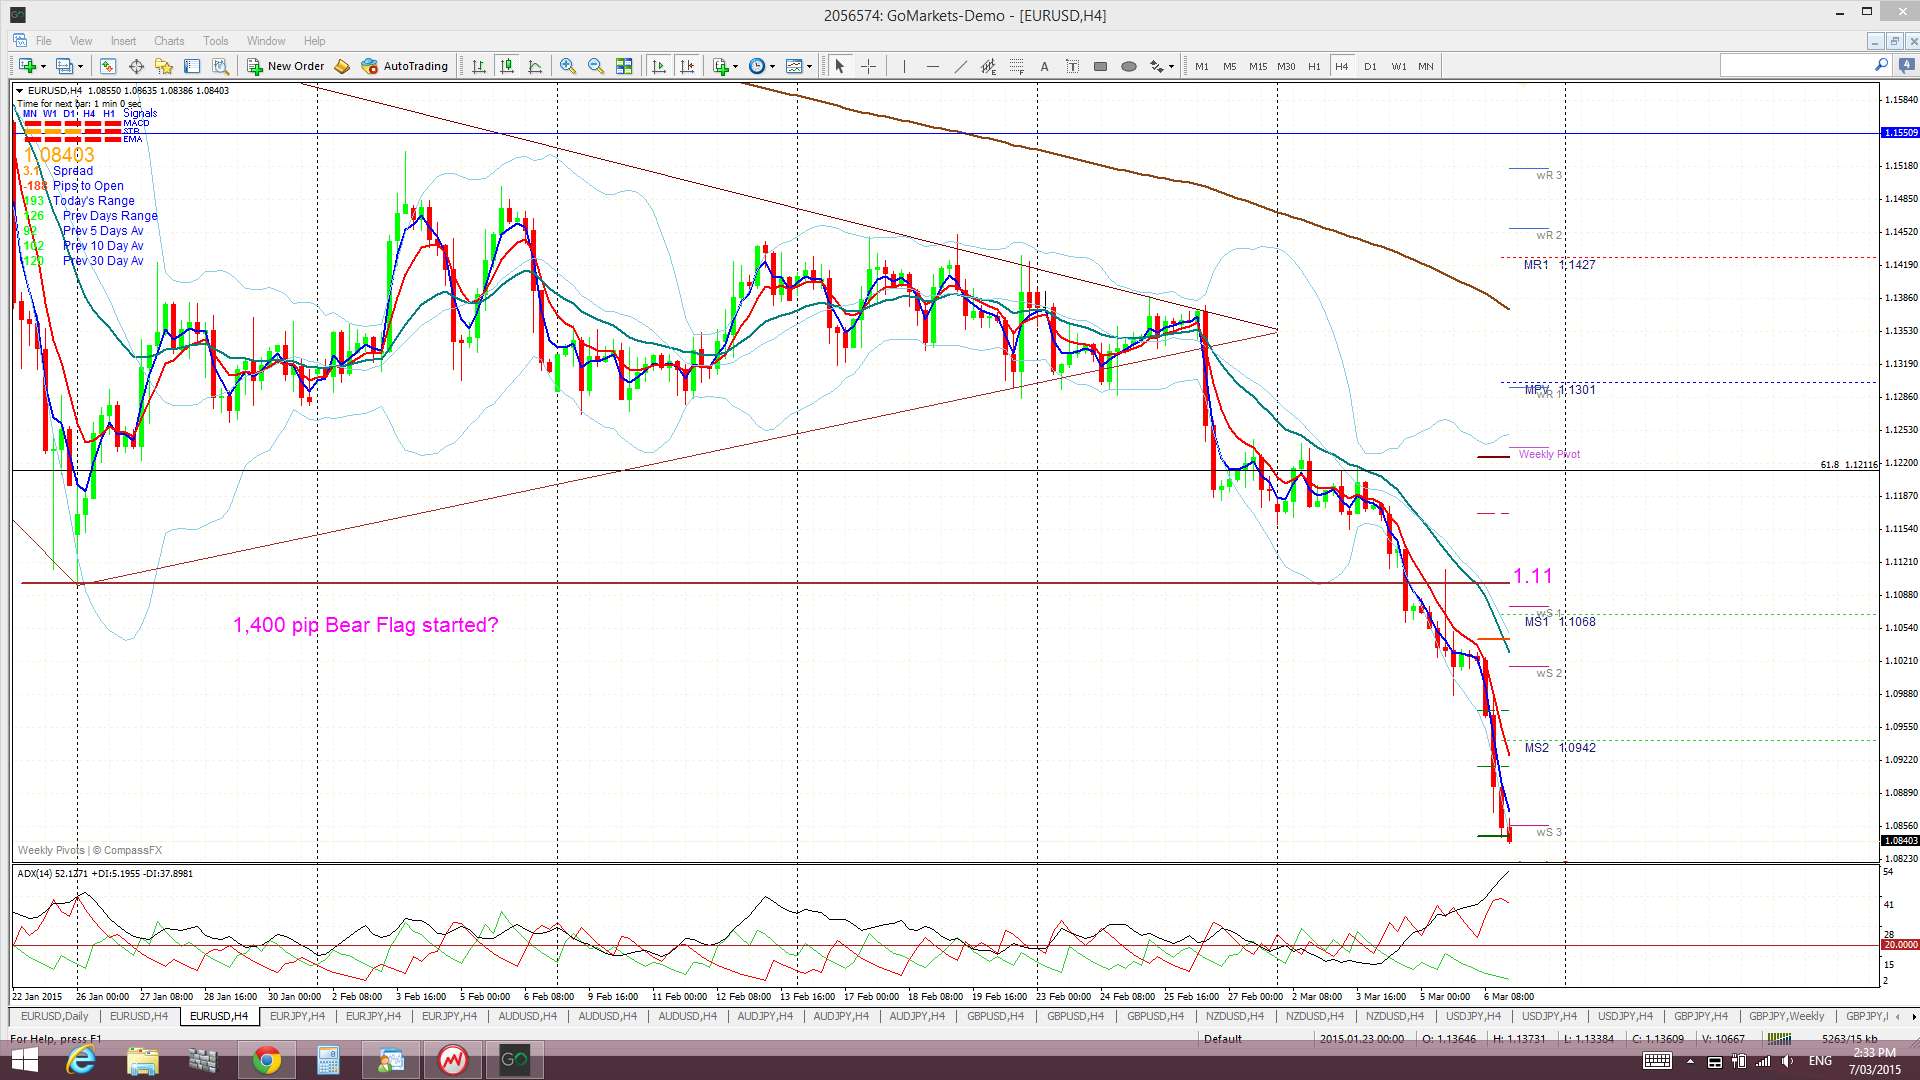
E/U: The E/U continued lower following the previous week’s triangle breakdown and it then also fell below recent 1.11 ‘Double Bottom’ support. US data, culminating with upbeat NFP on Friday, kept pressure on the E/U for the latter half of the week and the pain doesn’t look like letting up anytime soon. The following 30 min chart shows how this pair reacted to NFP on Friday:
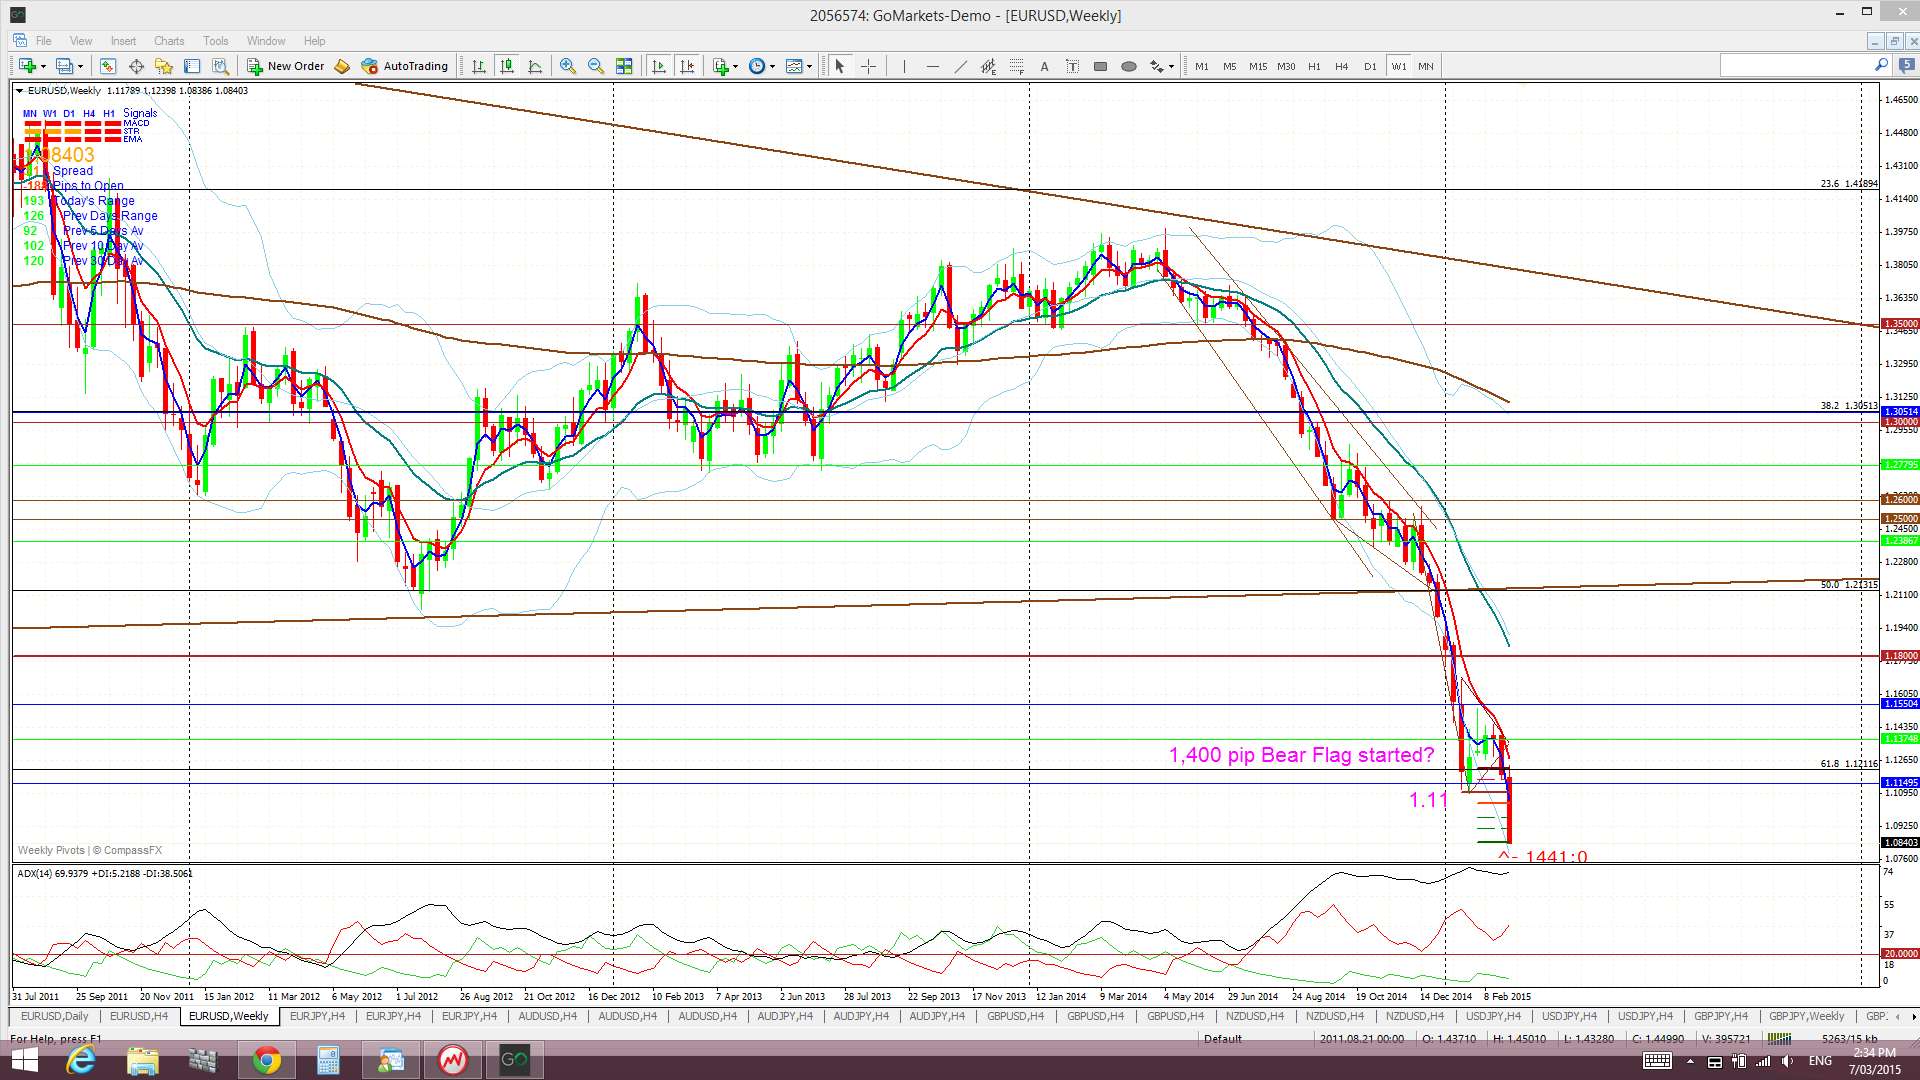
There are two bearish patterns in play on the E/U: a 4,000 pip bearish descending triangle breakdown on the monthly chart and a 1,400 pip Bear Flag on the daily chart. Both of these are outlined below.
Bear Flag on the daily chart: The recently broken triangle pattern on the 4hr chart had been giving the higher time frame charts a ‘Bear Flag’ appearance which now looks like it has evolved. The bullish breakout on the USDX is supporting this Bear Flag move on the E/U. The ‘Flagpole’ of this Bear Flag is about 1,400 pips and this would suggest a similar move lower. This bearish move is a sub-set within the larger monthly-chart descending triangle breakdown.
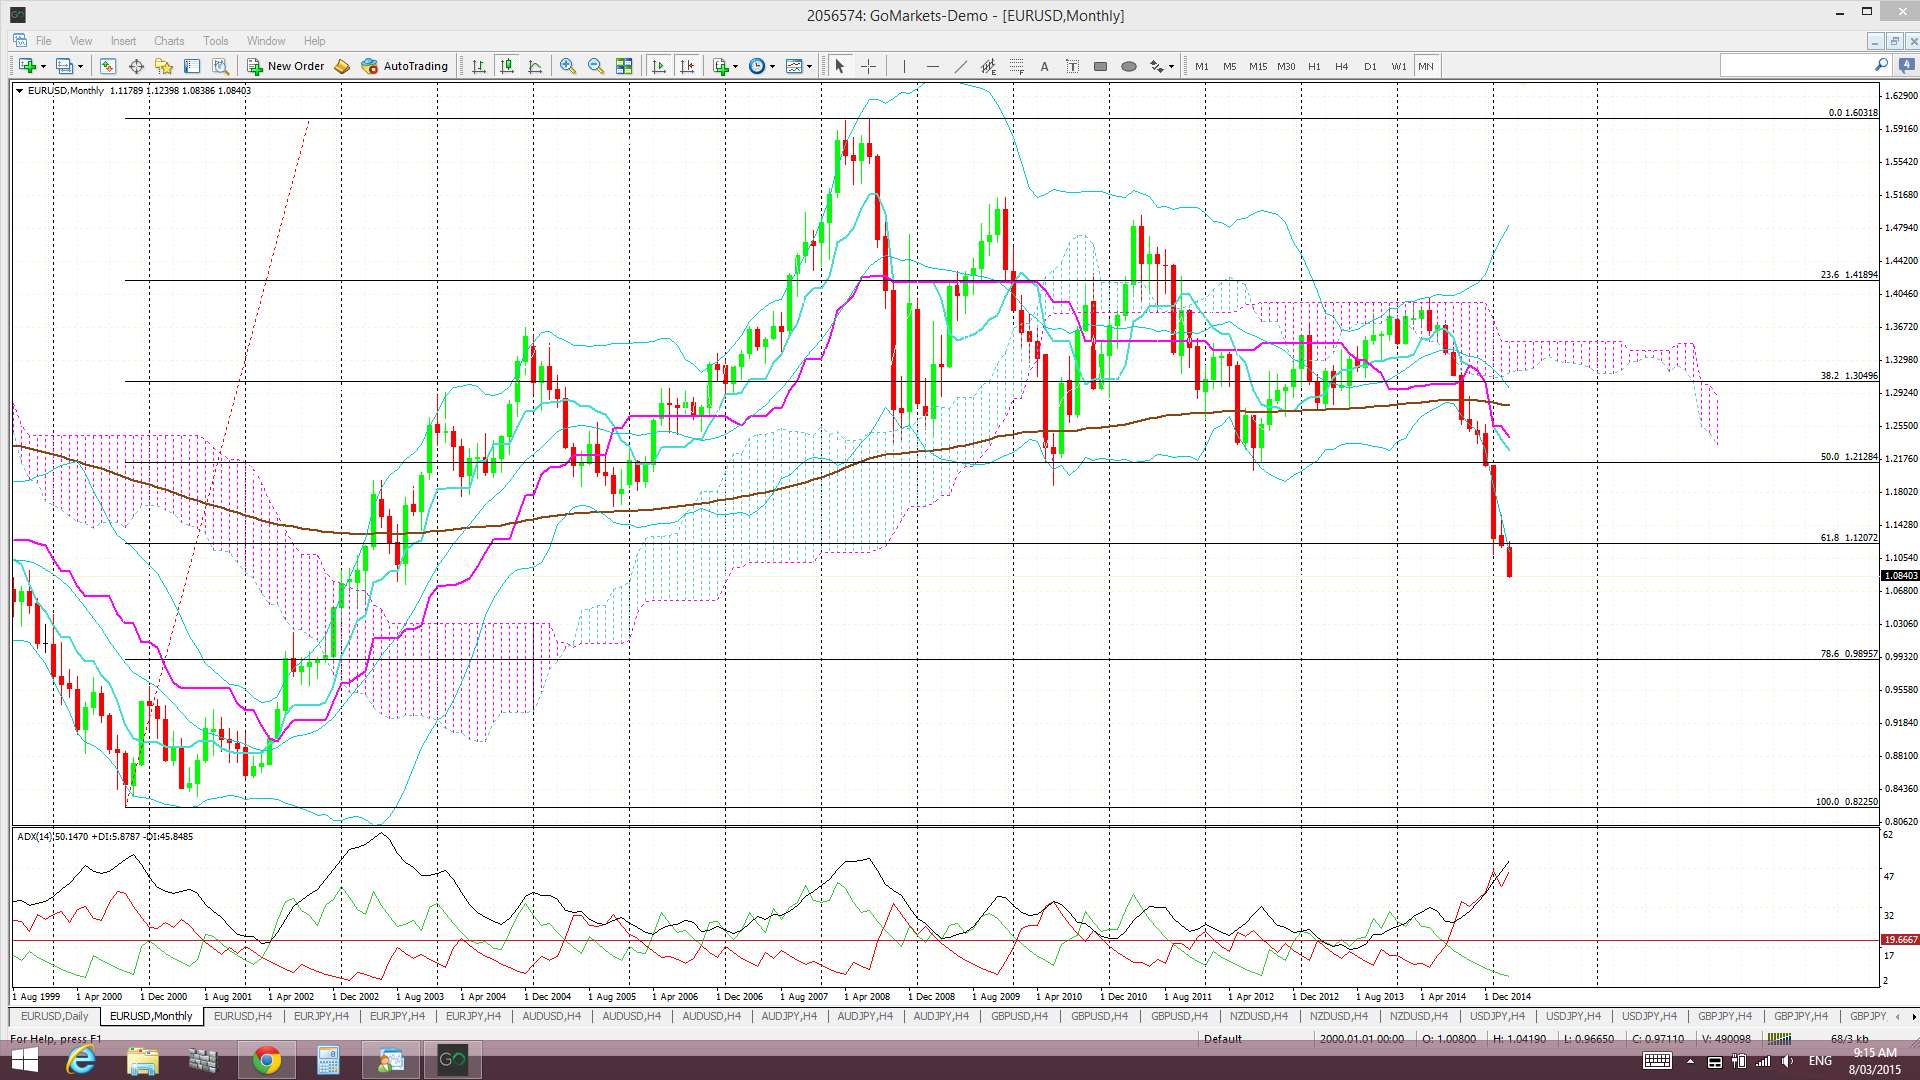
Descending triangle on the monthly chart: the descending triangle pattern is a bearish continuation pattern and has a base at around the 1.18 level. The height of this triangle is about 4,000 pips. Technical theory would suggest that any bearish breakdown of this triangle below 1.18 might see a similar move. It is worth noting that this would bring the E/U down near 0.80 and to levels not seen since 2000/2001! The monthly chart shows how critical this 1.18 level is for the E/U. The January monthly candle closed below this key level and I will be looking for a test of 1.18 before further possible bearish continuation. I’m beginning to wonder if we will see this ‘test’ though.
The psychological ‘parity’ level is very close to the next major Fib support at 78.6%. One would now have to expect price action to at least test this region before possibly trying to form a base:
Price is still trading below the Ichimoku Cloud on the 4hr, daily, weekly and monthly charts which is bearish.
The weekly candle closed as another large bearish candle.
- I’m watching for any new TC signal.
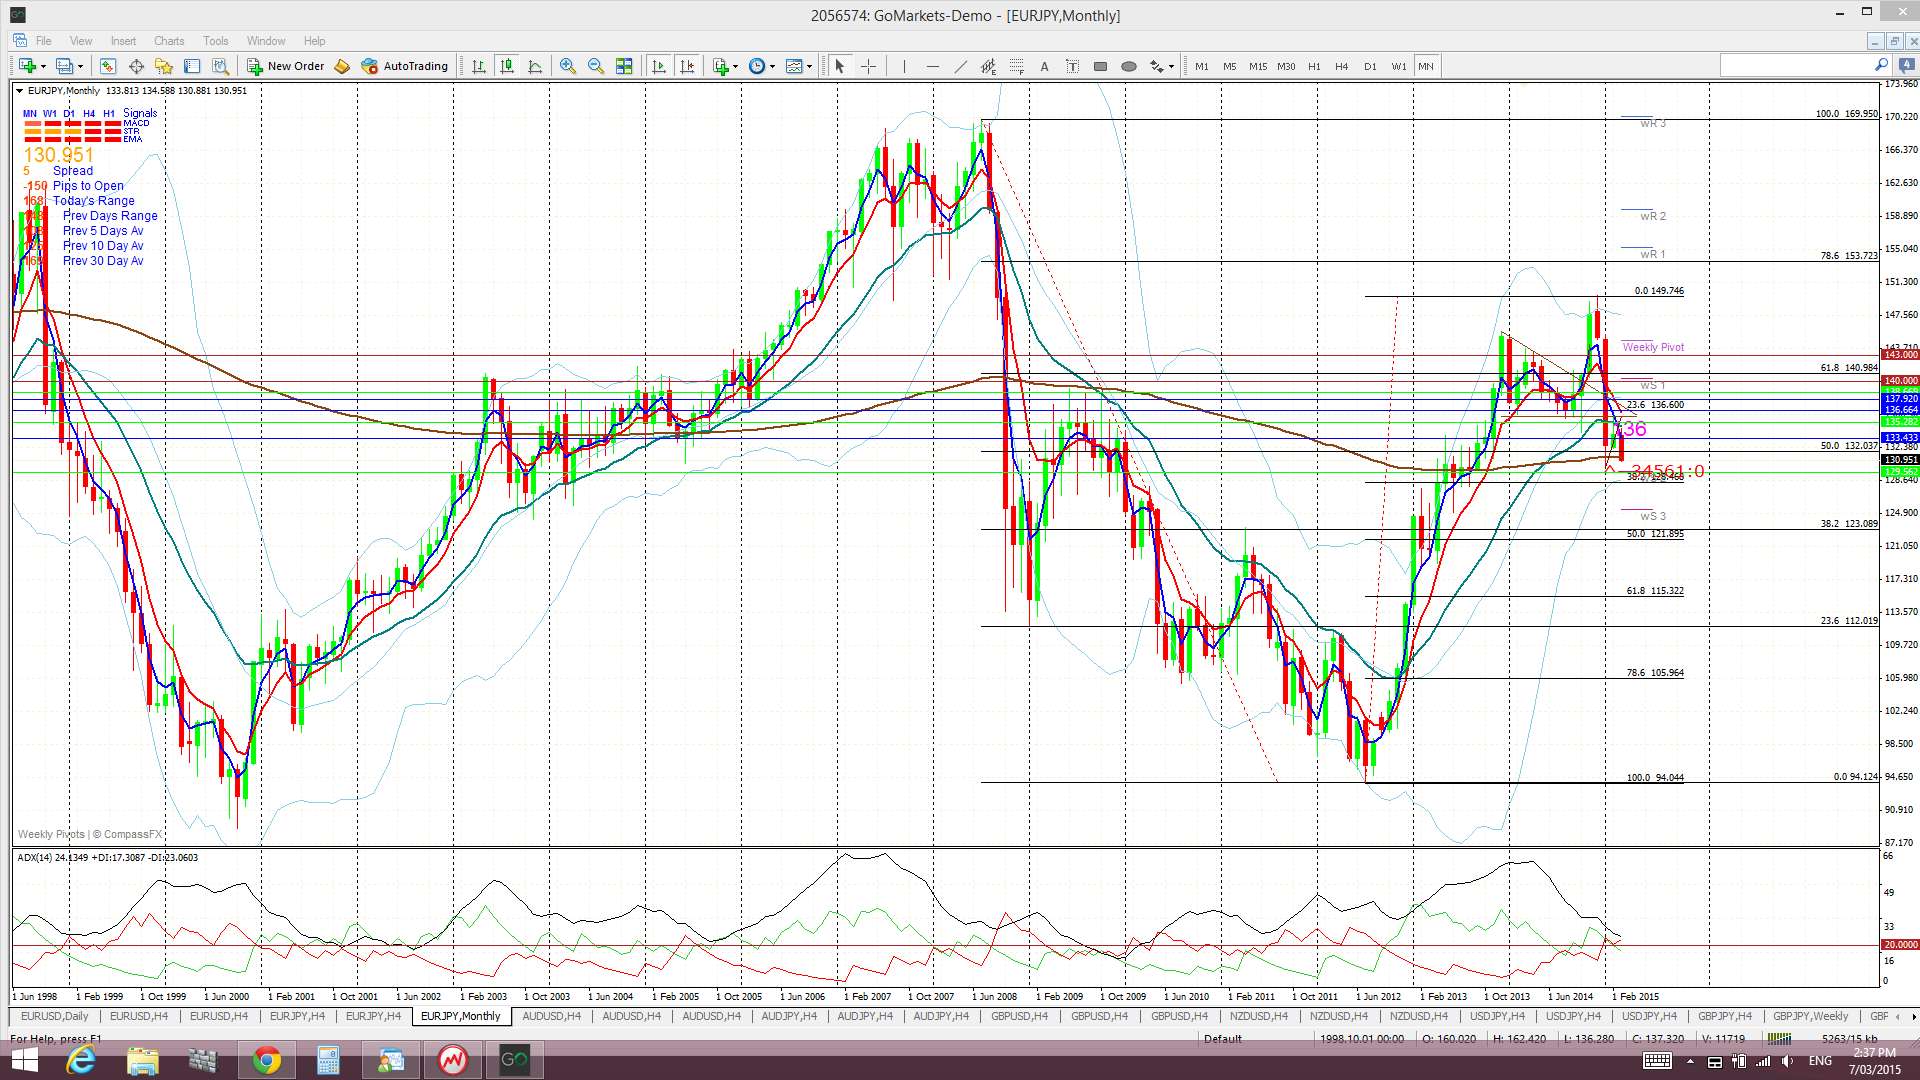
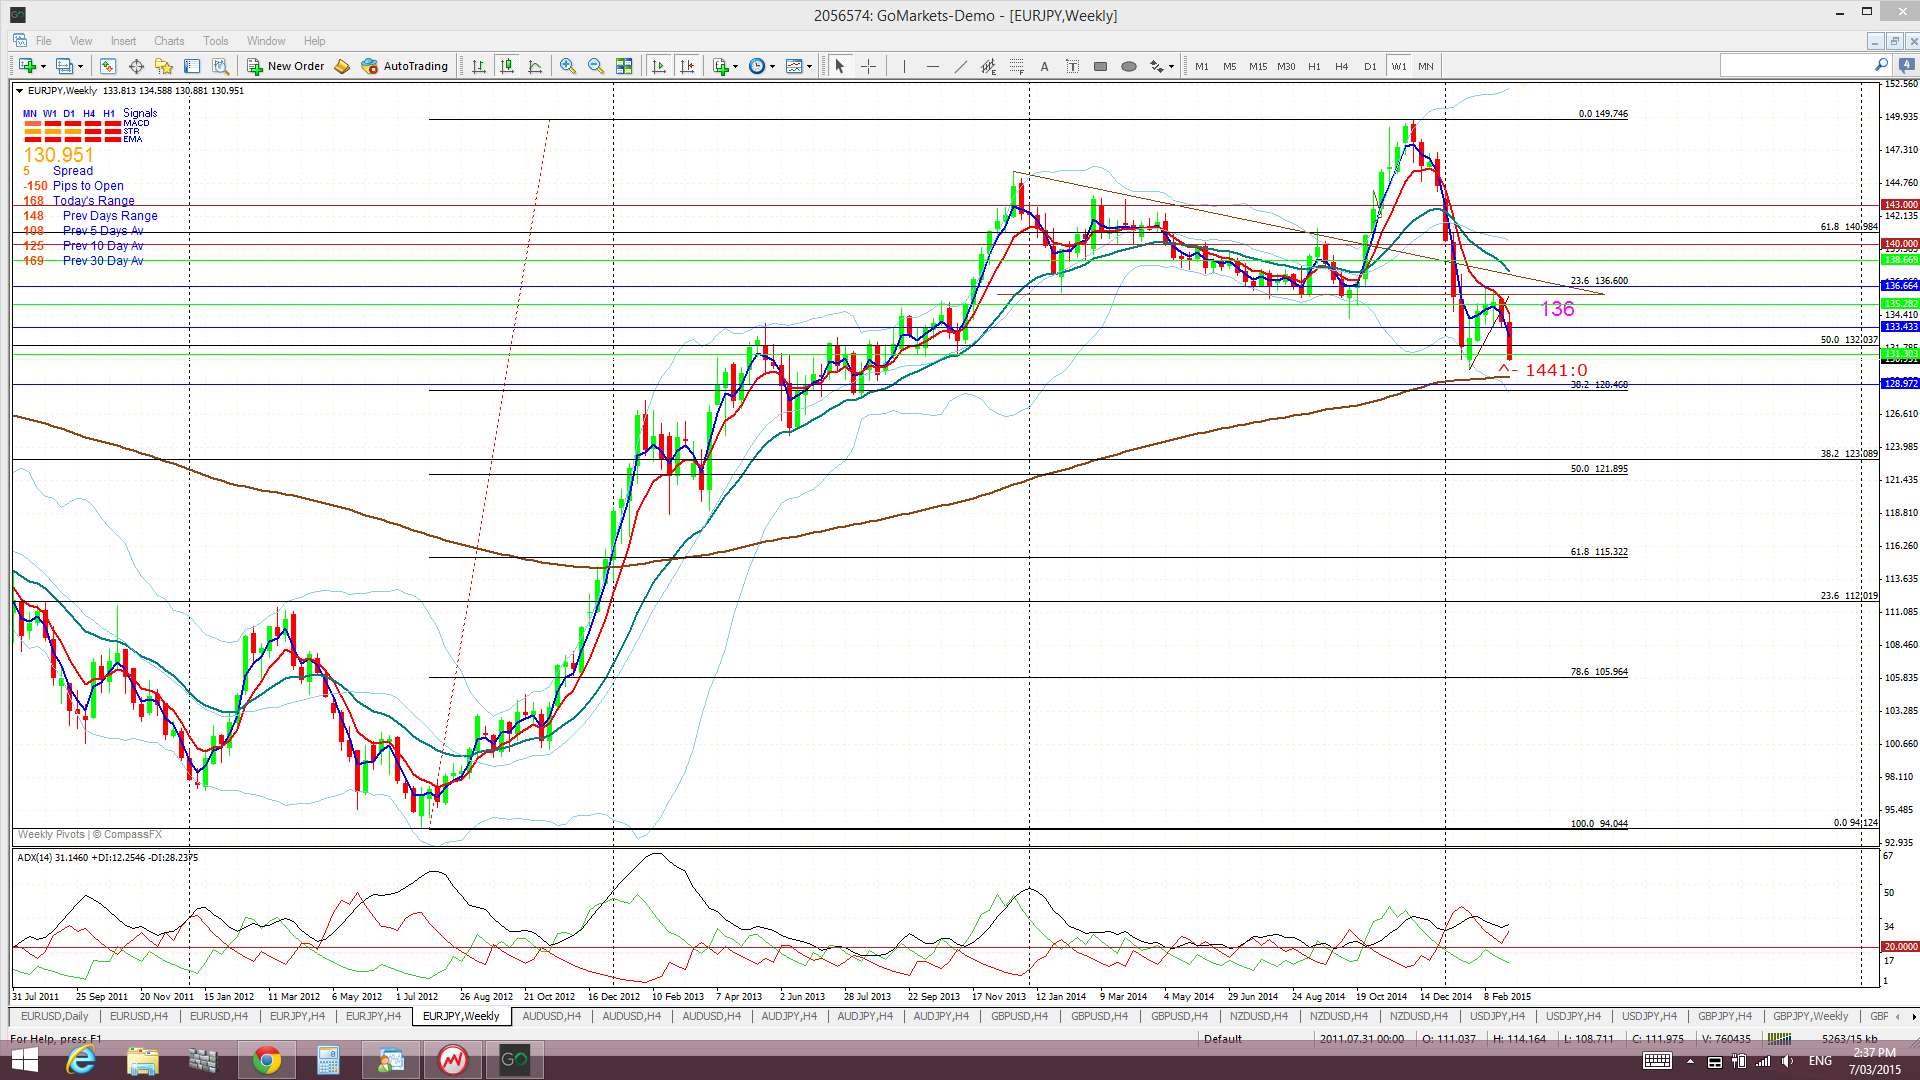
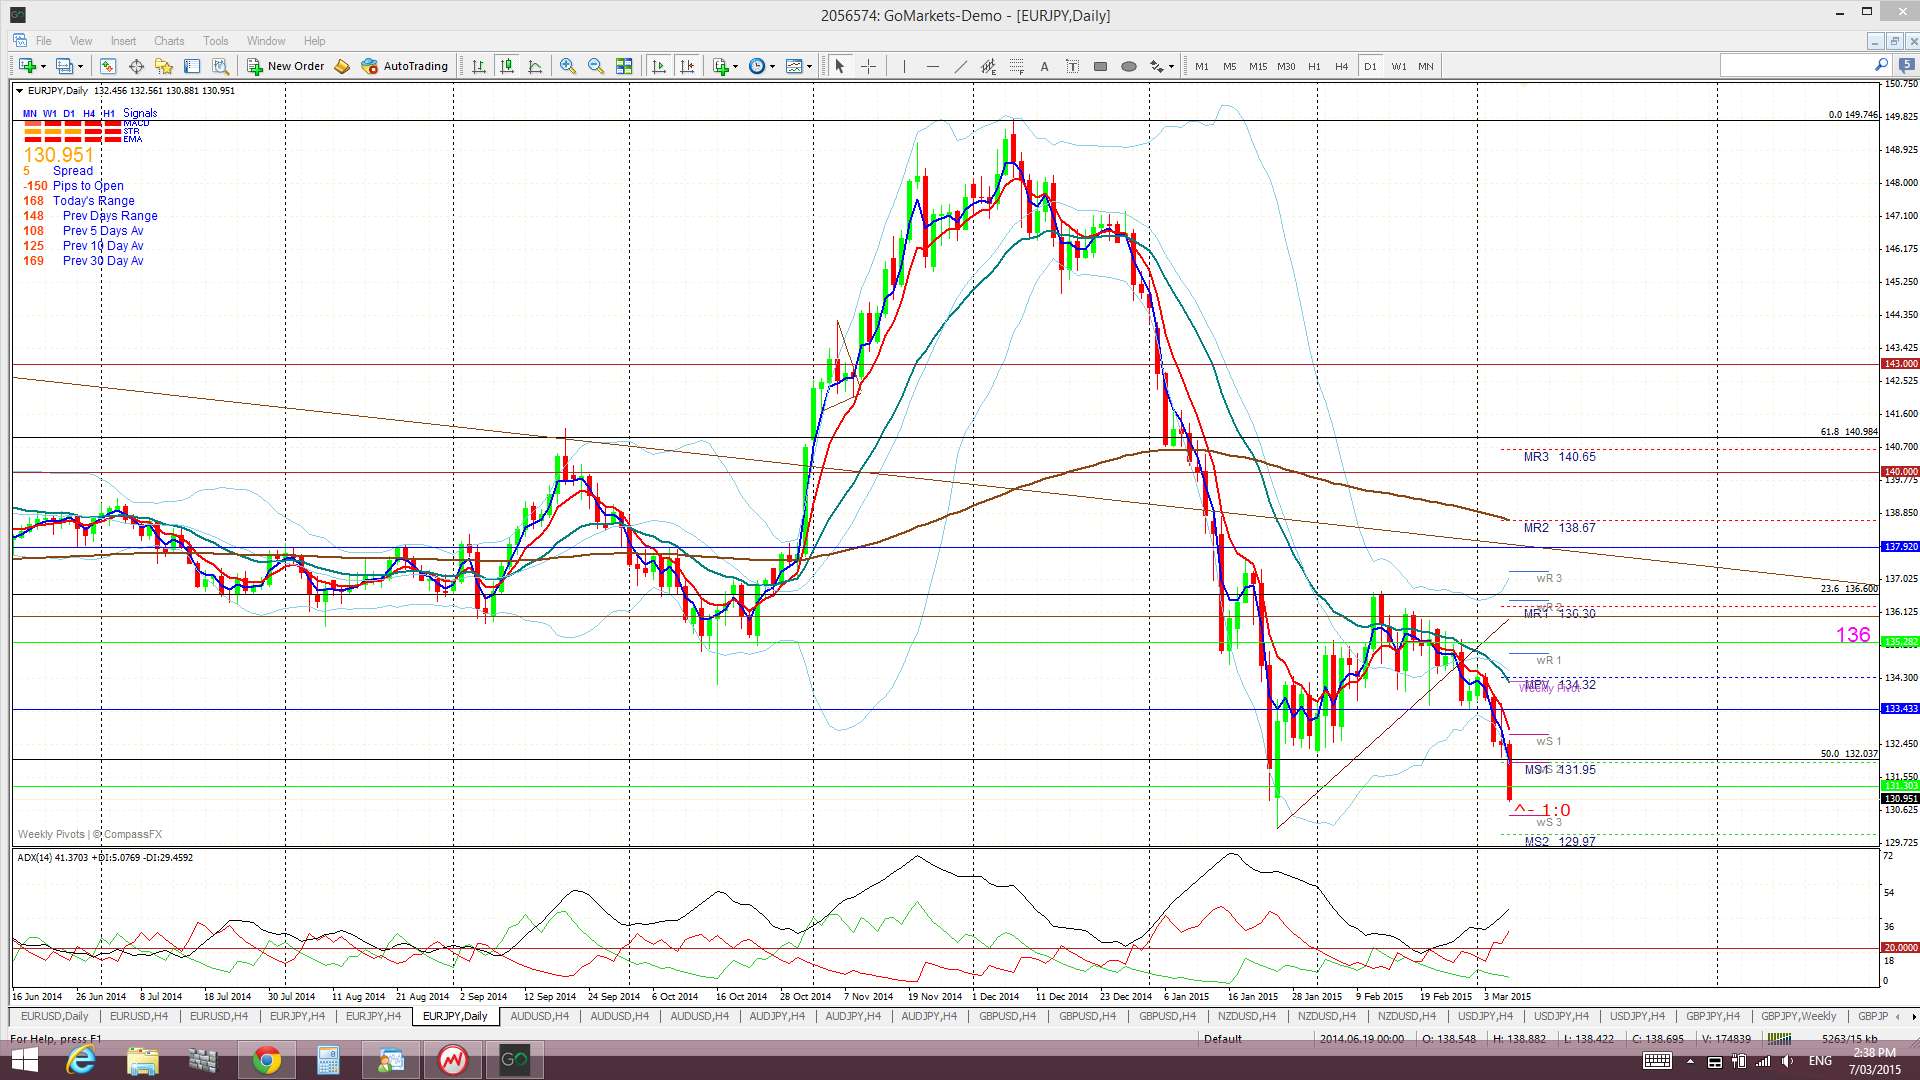
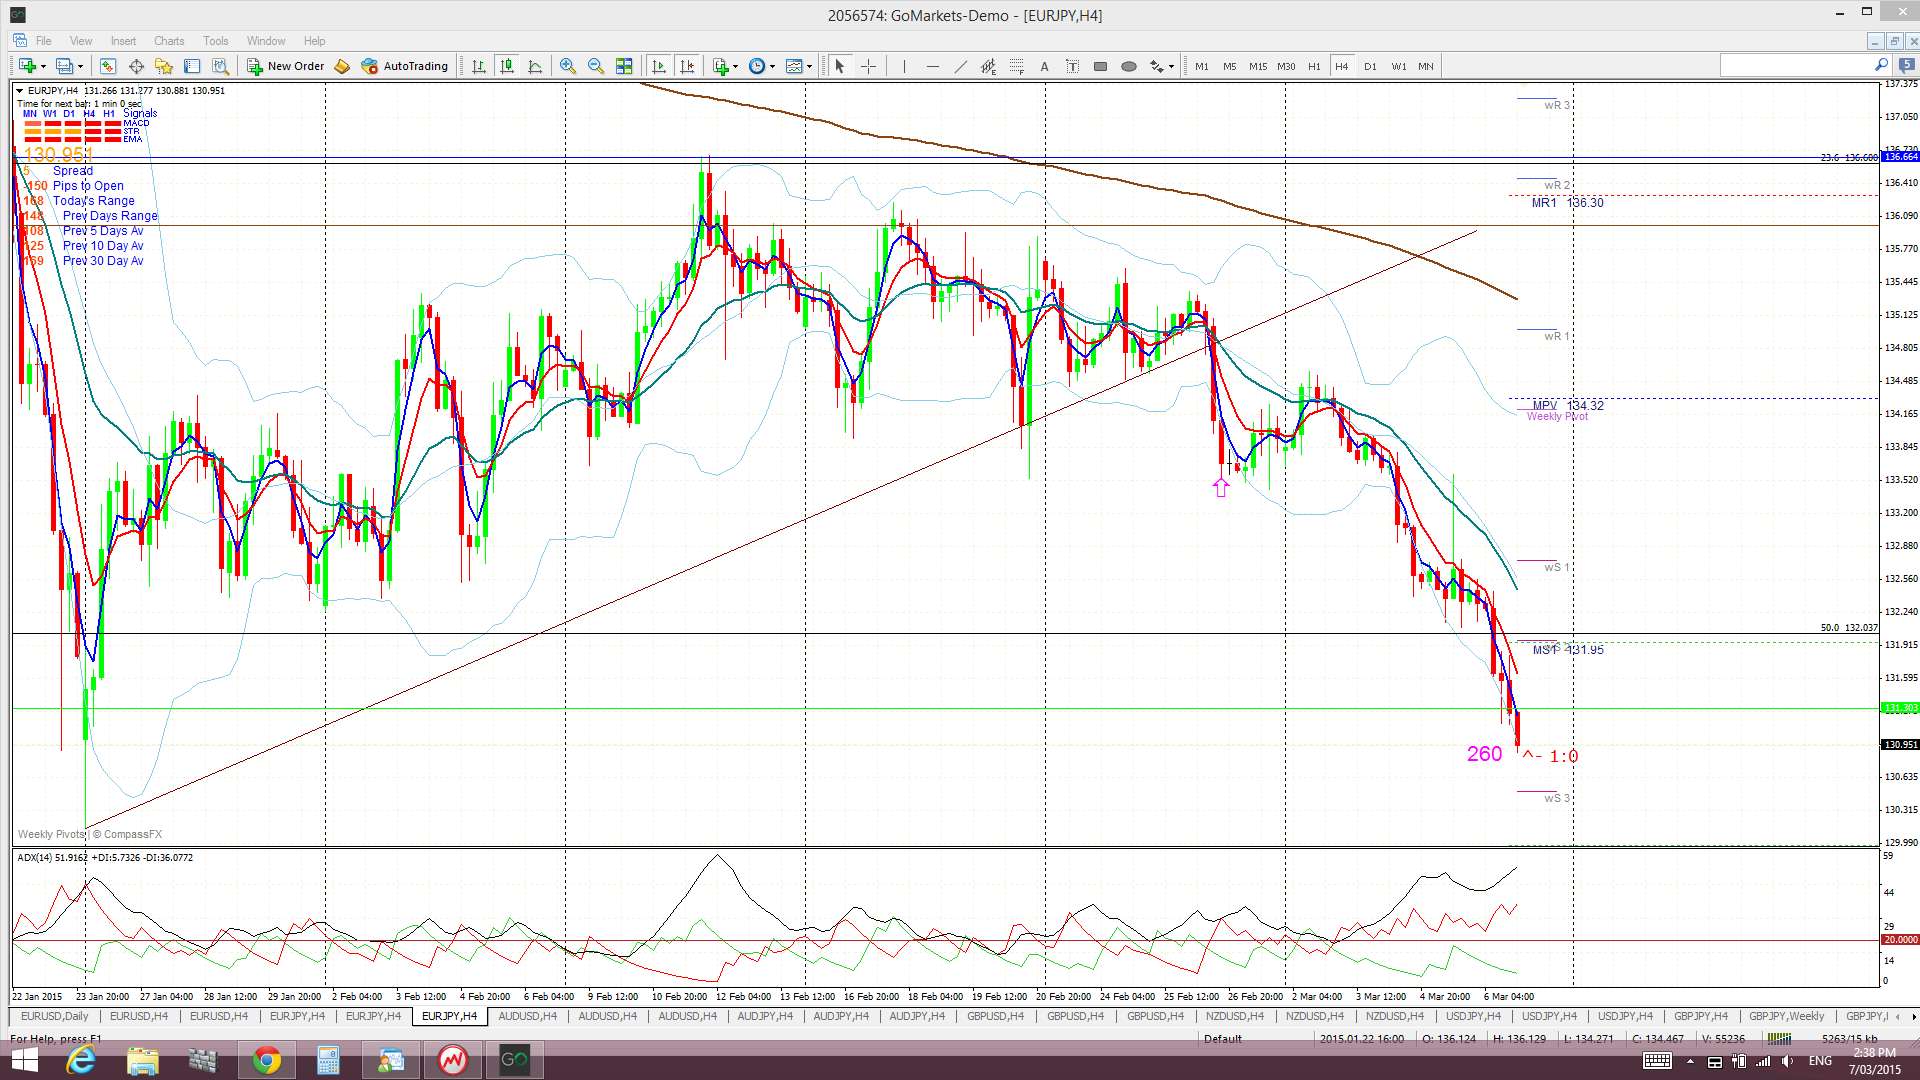
E/J: The E/J continued lower following the previous week’s breakdown below a support trend line. This move had triggered a new TC signal and this is still open.
Price is still trading below the Cloud on the 4hr, daily and weekly charts but above on the monthly chart.
The weekly candle closed as a large bearish candle and this follows on from last week’s bearish engulfing candle.
- There is an open TC signal on this pair.
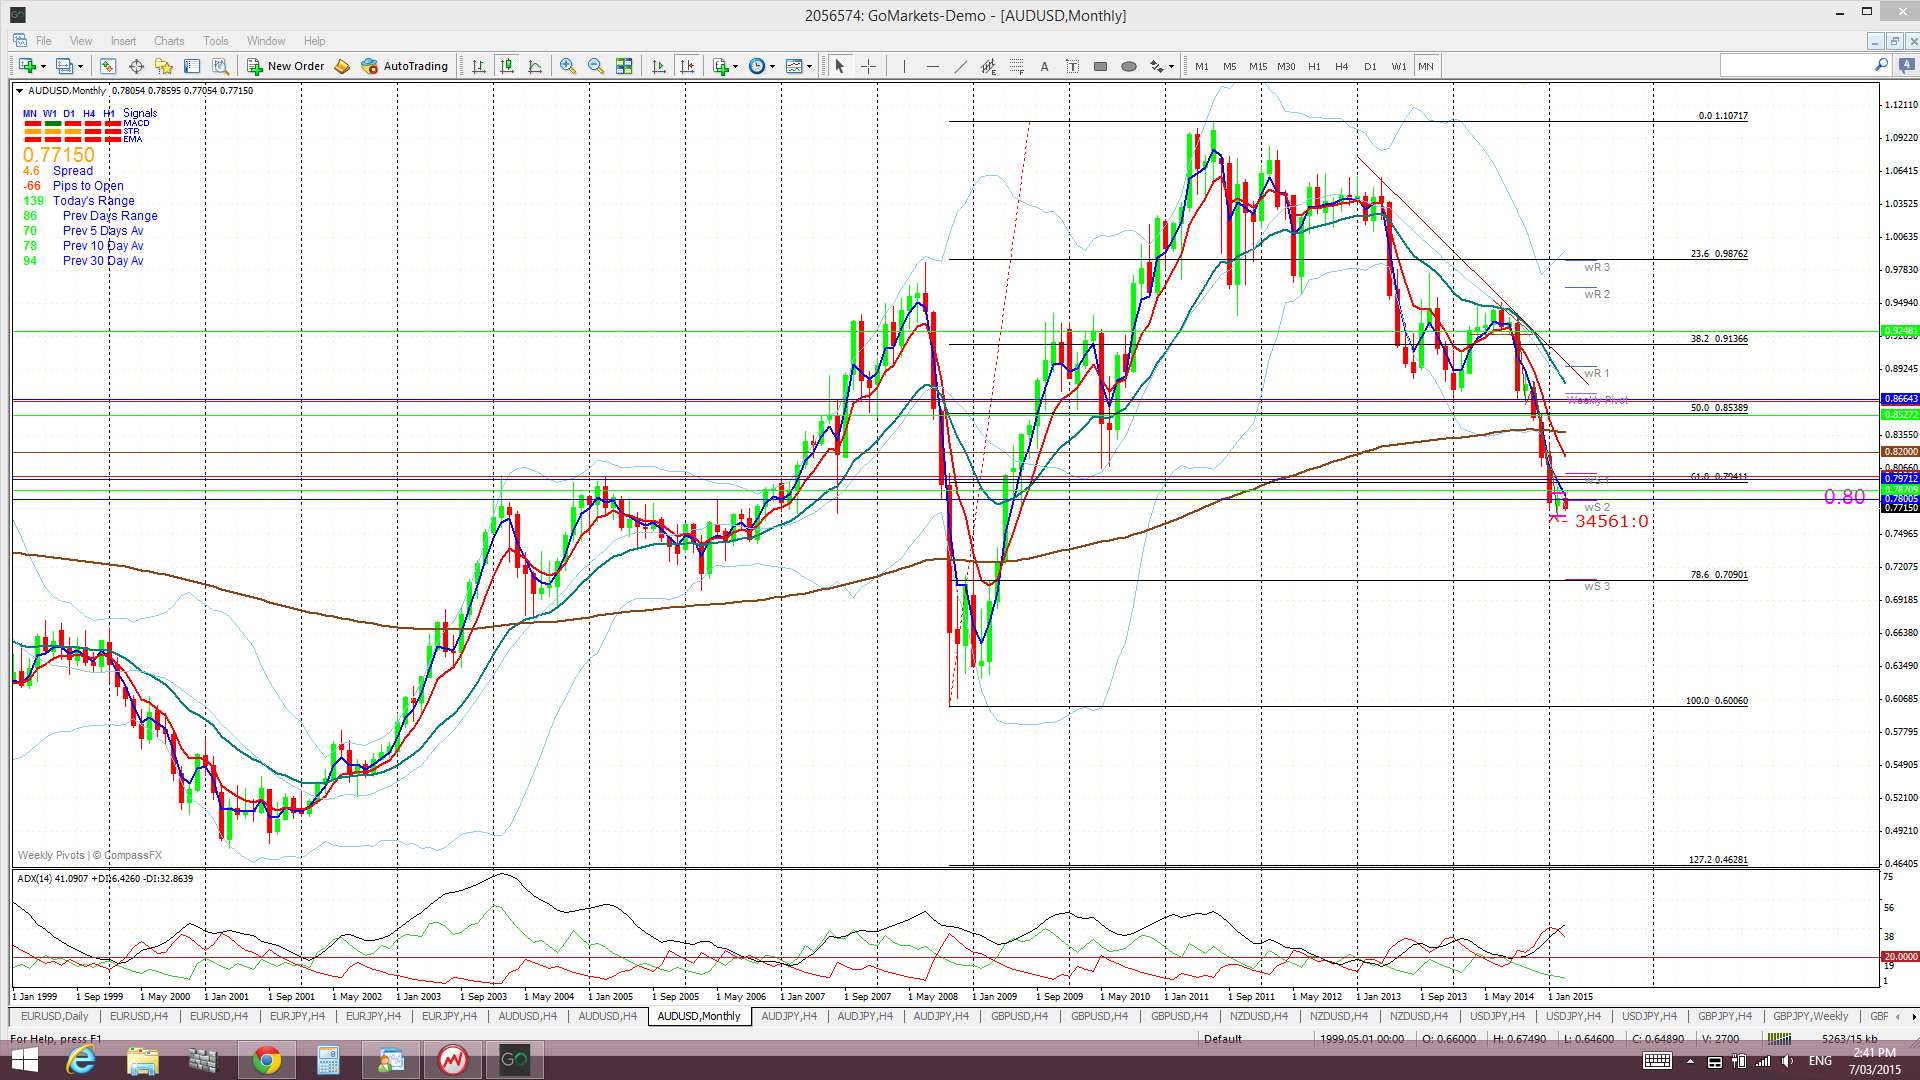
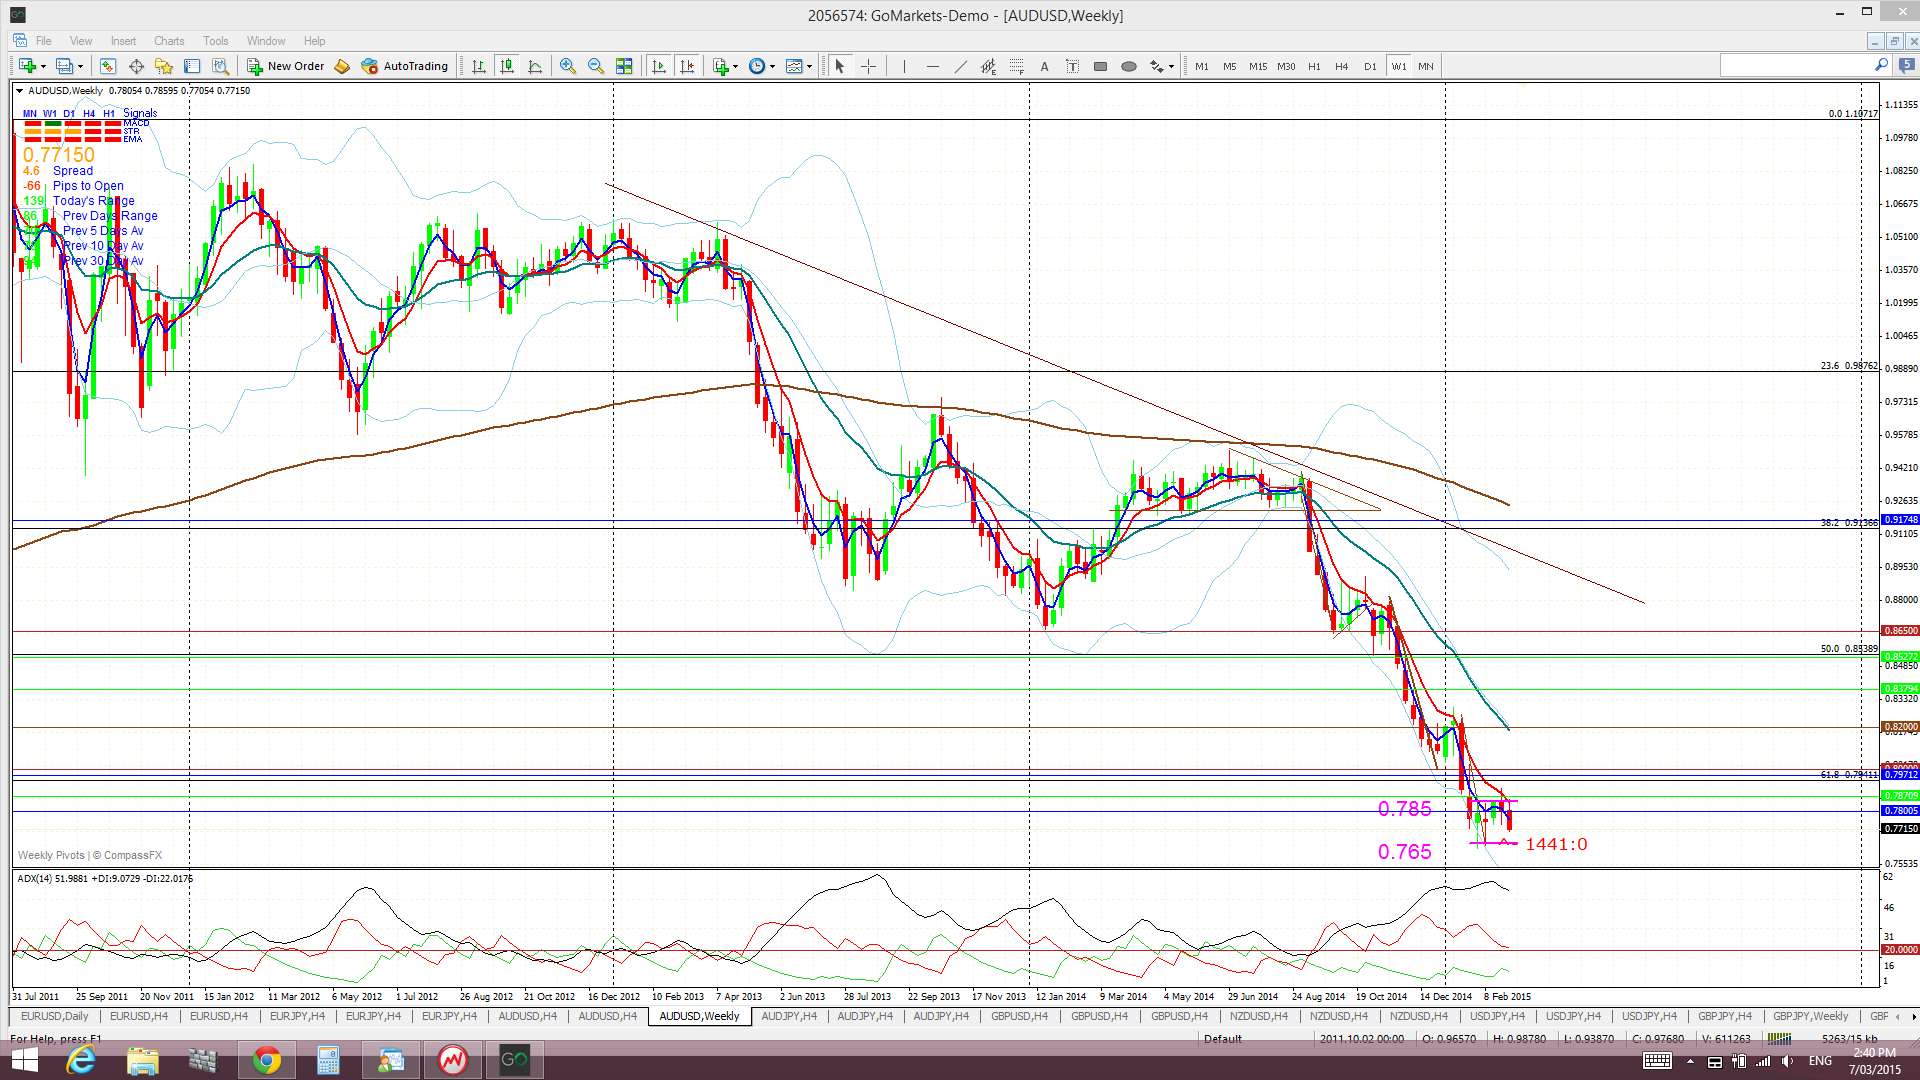
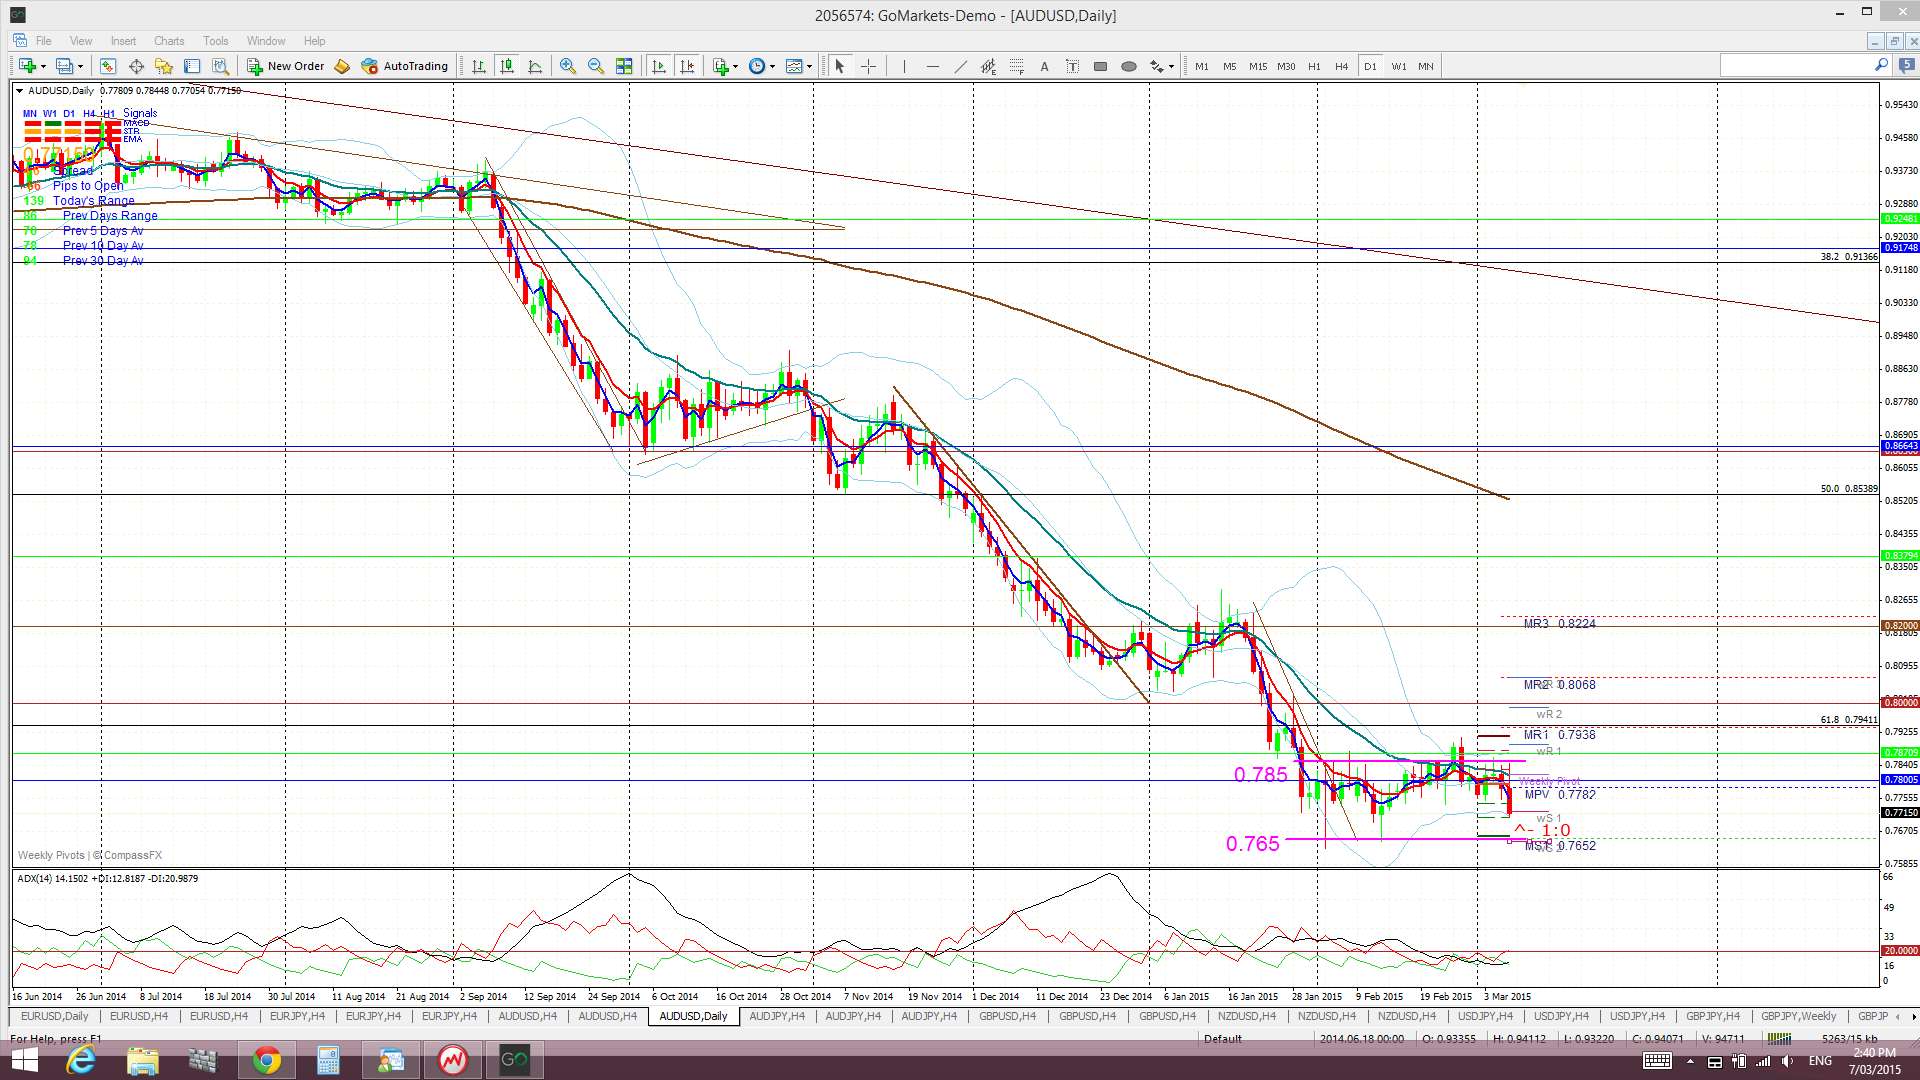
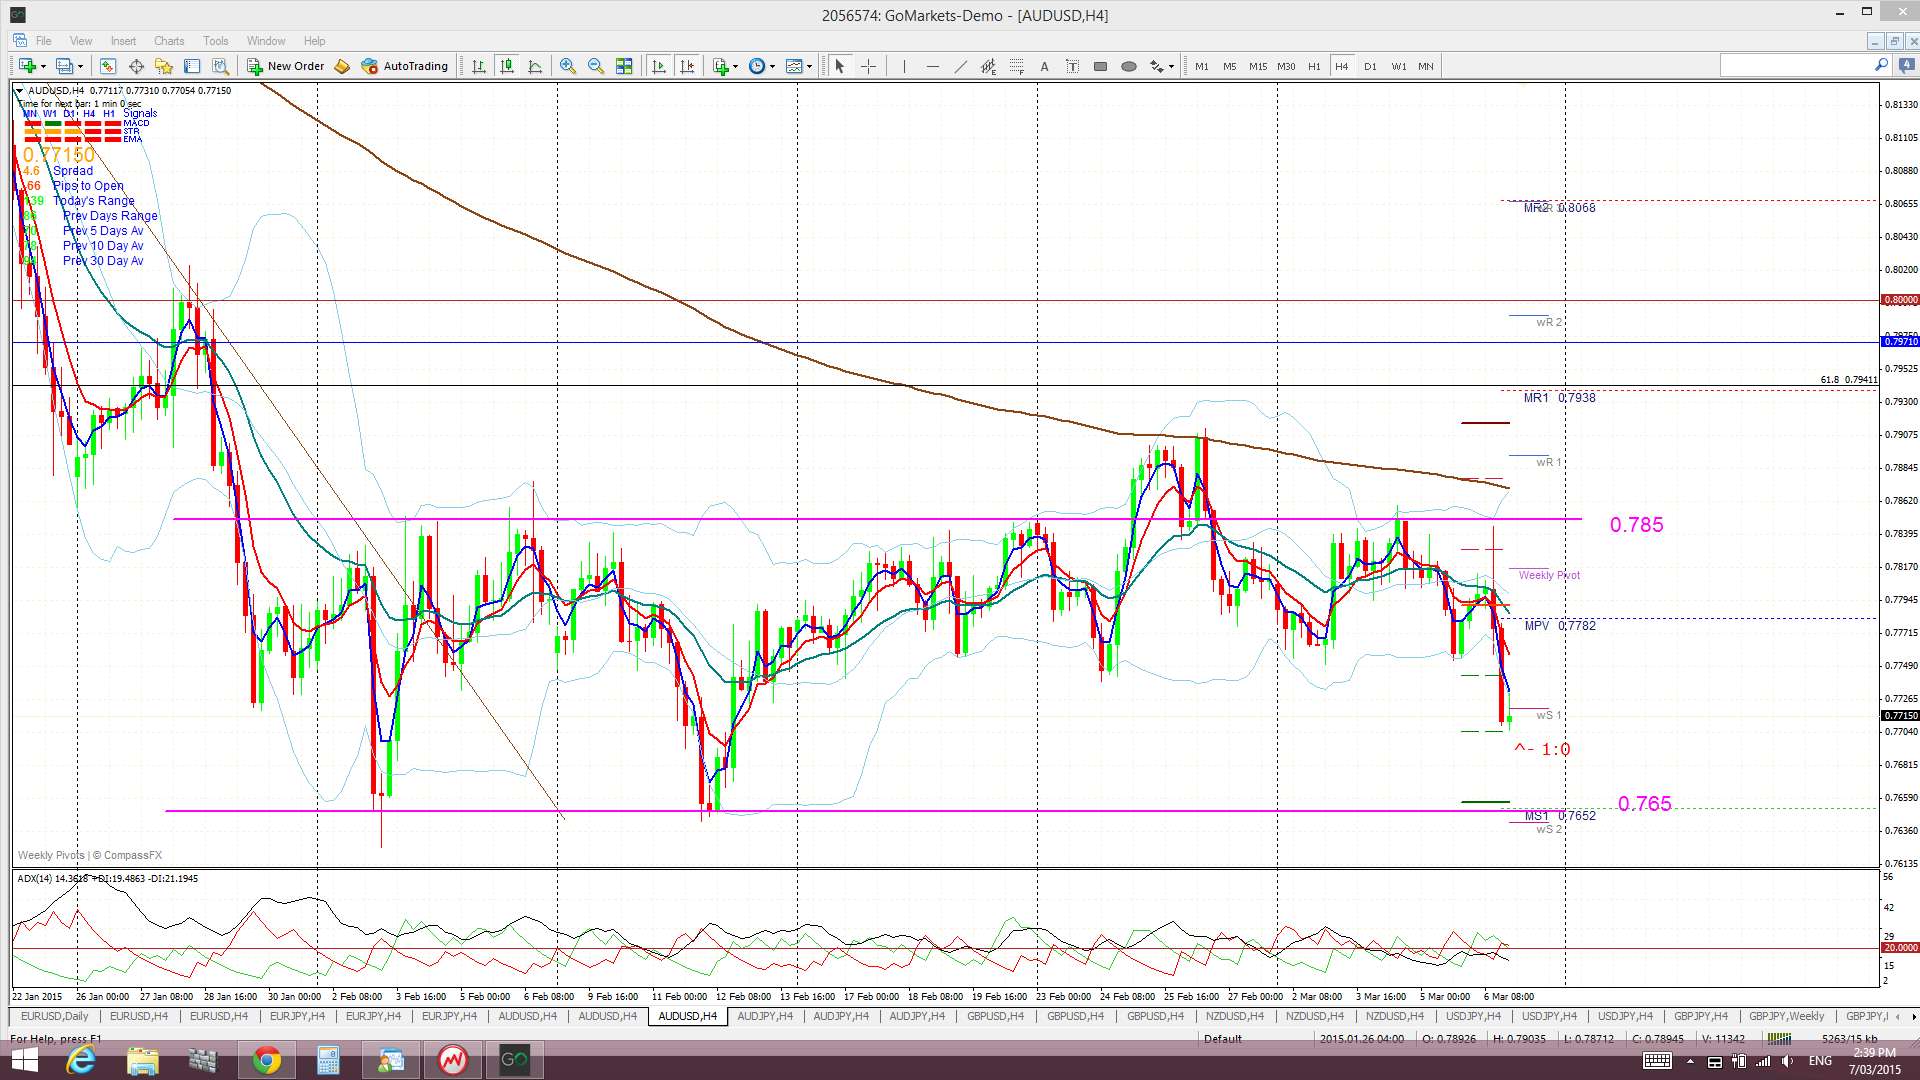
A/U: The A/U continued chopping under the 0.785 level last week. I was surprised by the lack of bearish activity on this pair given the amount of USD strength see throughout the latter part of last week. 0.785 remains as resistance above recent price action and 0.765 seems to be shaping up as support so these two levels will be in focus next week.
Bear Flag? The break and hold below this 0.80 support suggests the start of a possible new 700 pip Bear Flag. It is no surprise that 0.80 had offered some decent support for the A/U as this was the region of the 61.8% fib from the 2008-2011 bull run and the 50% fib of the 2001-2011 bull run. The break and hold below 0.80 support suggests a trip lower and possibly down to the 70 region where the next layers of fib support kick in. This move only gave about 350 pips before price started consolidating into this recent 0.785/0.765 channel.
As previously noted: A number of commentators are now claiming that the A/U may have bottomed here and to look for continued signs of reversal. I’ll be keeping an open mind here BUT, when you look at the monthly chart below, price still seems to be in a bit of ‘no-man’s land’. Had this recent bounce and consolidation come off one of the noted fib levels I’d be more on board to support a pullback. The recent consolidation action between 0.785 and 0.765 would support this view however BUT a strengthening USD and weaker commodity prices may make it hard for the AUD to remain strong.
Price is now trading below the Cloud on the 4hr, daily, weekly and monthly charts which is bearish.
The weekly candle closed as a bearish candle
- I’m watching for any new TC signal on this pair and the 0.785 & 0.765 levels.
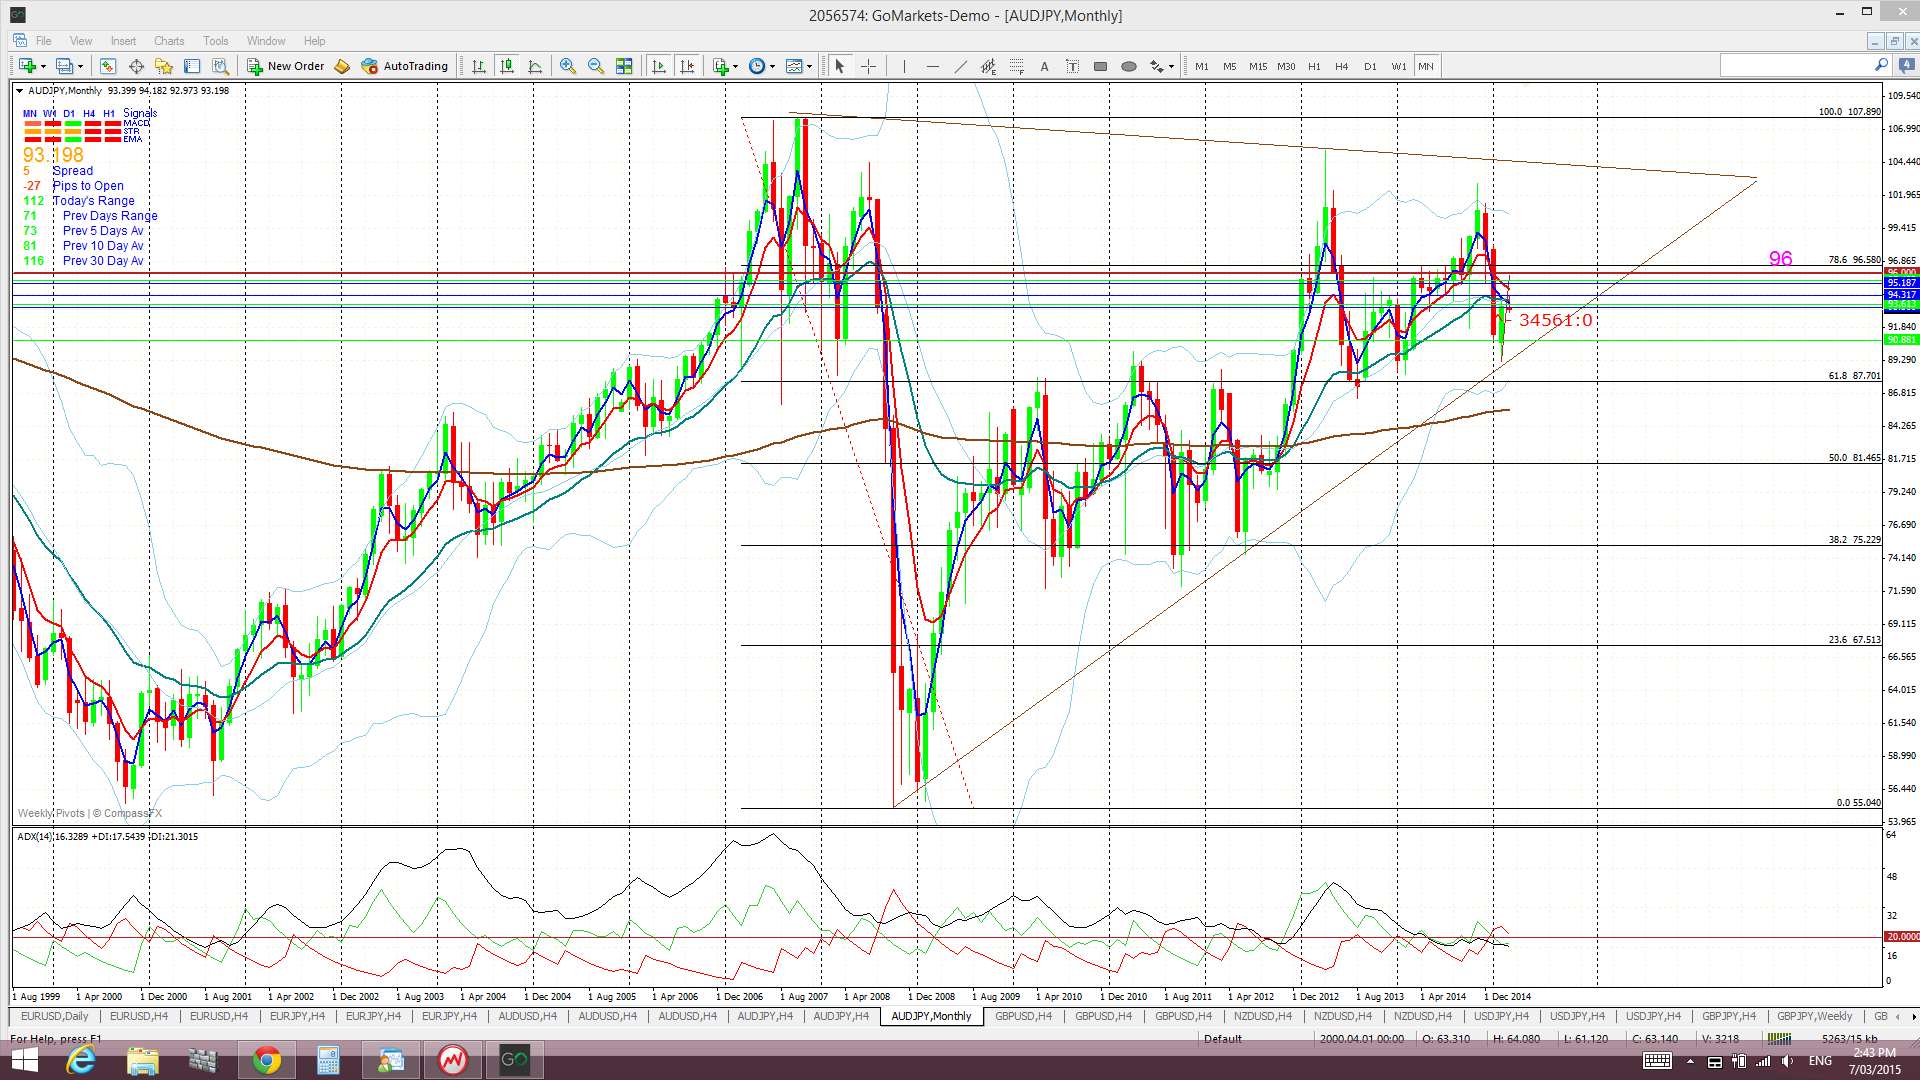
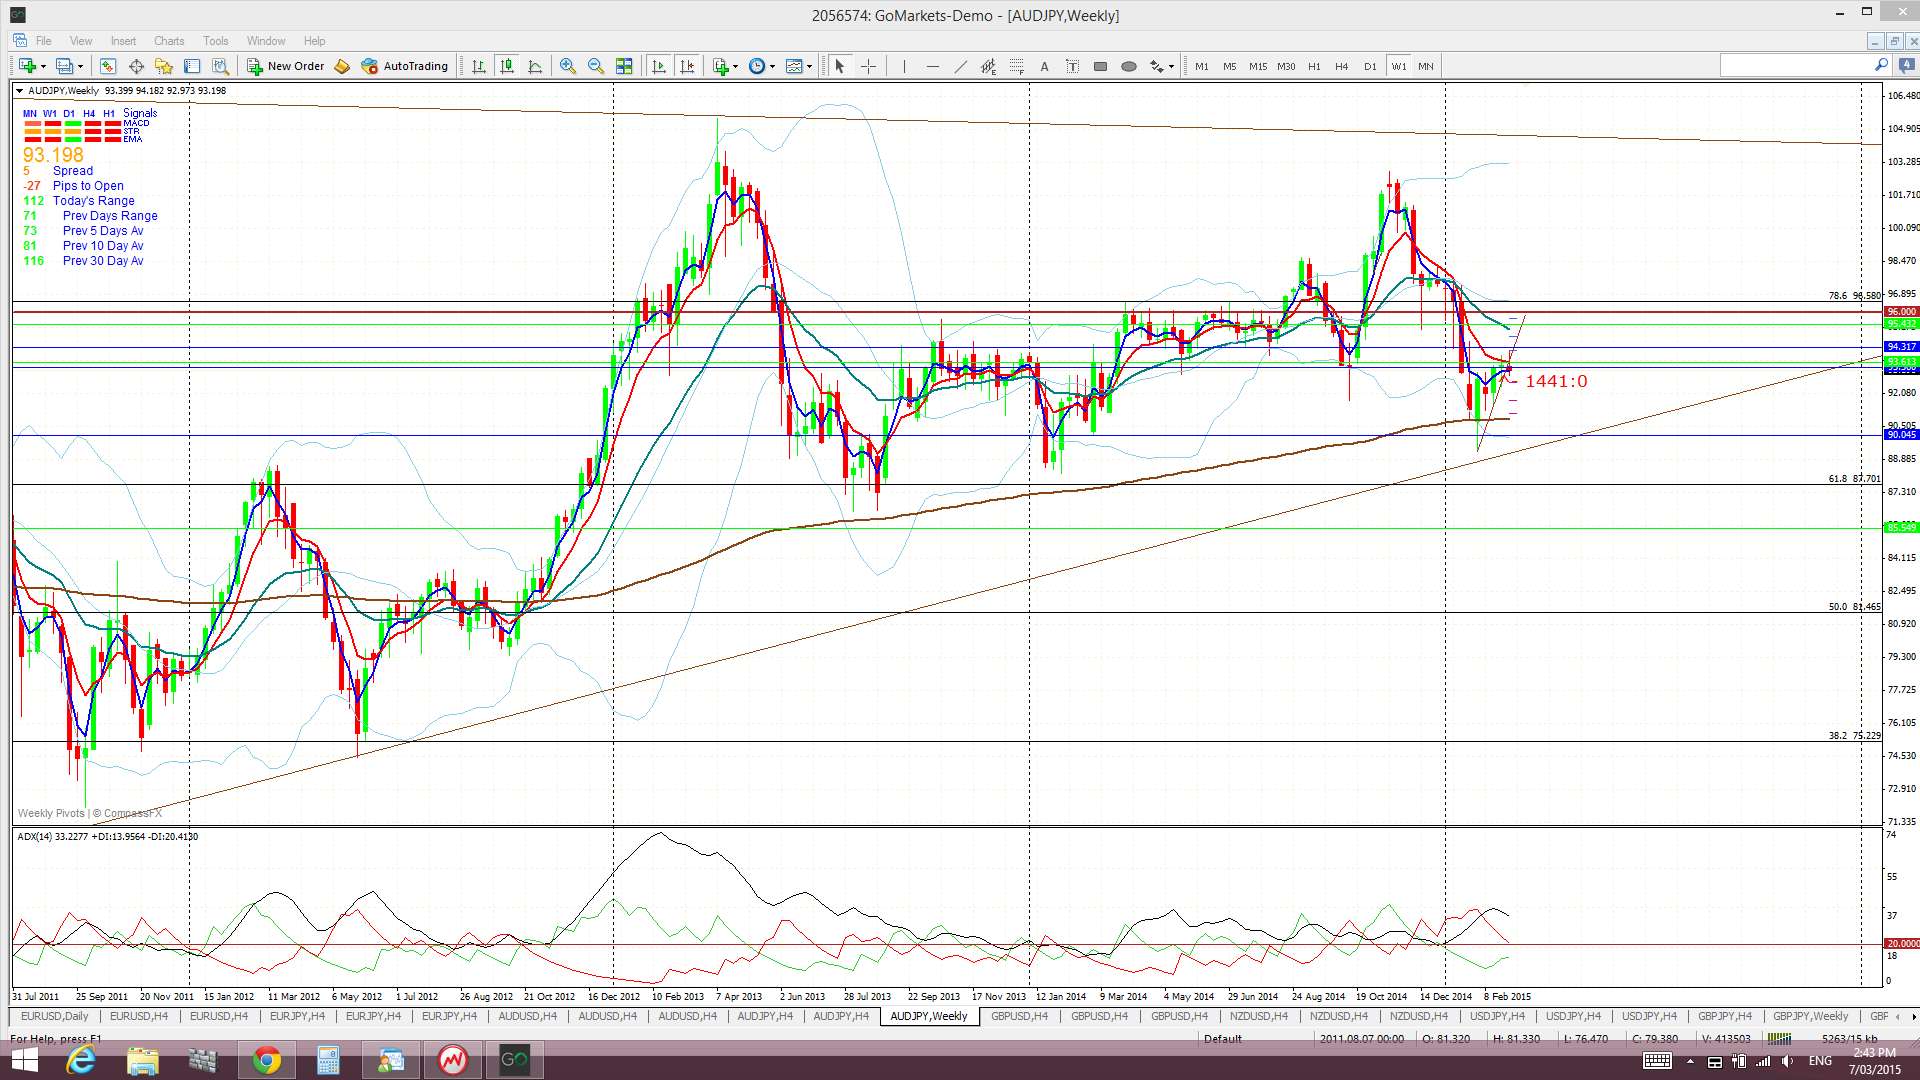
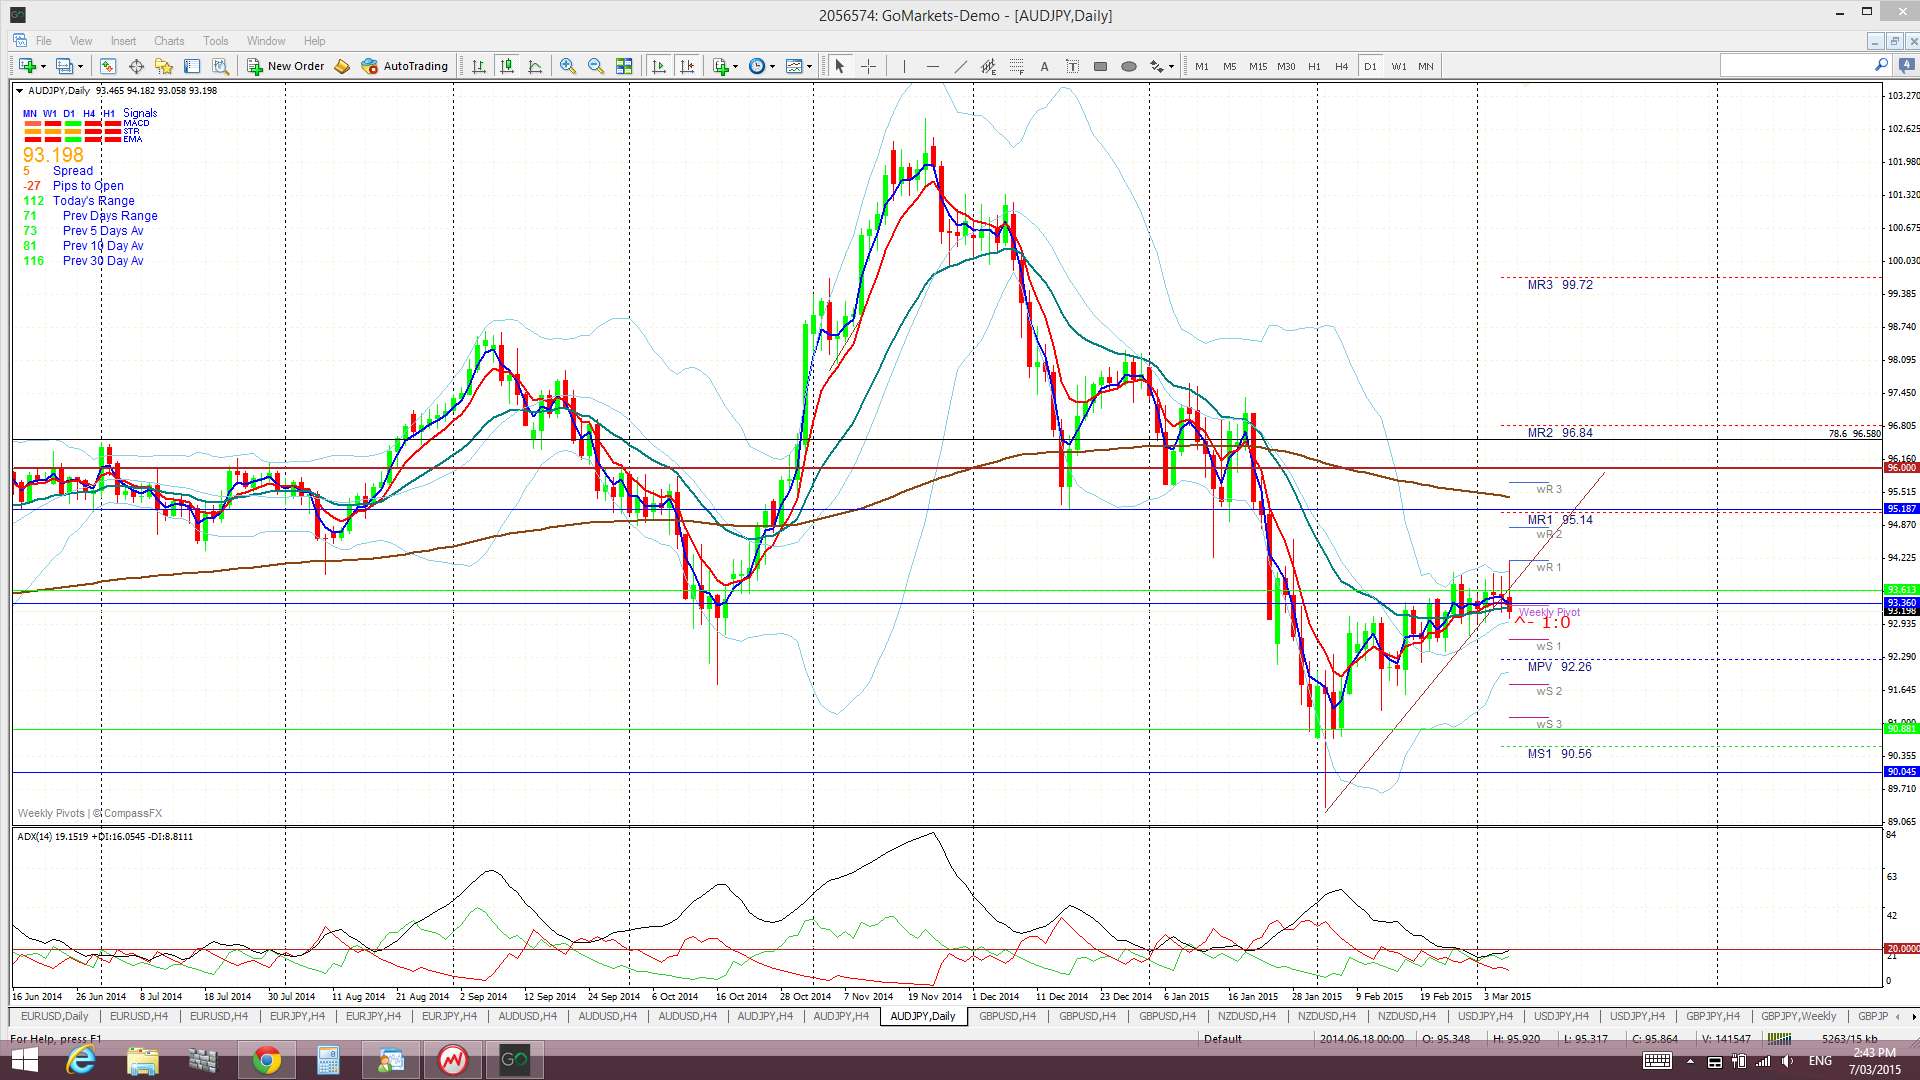
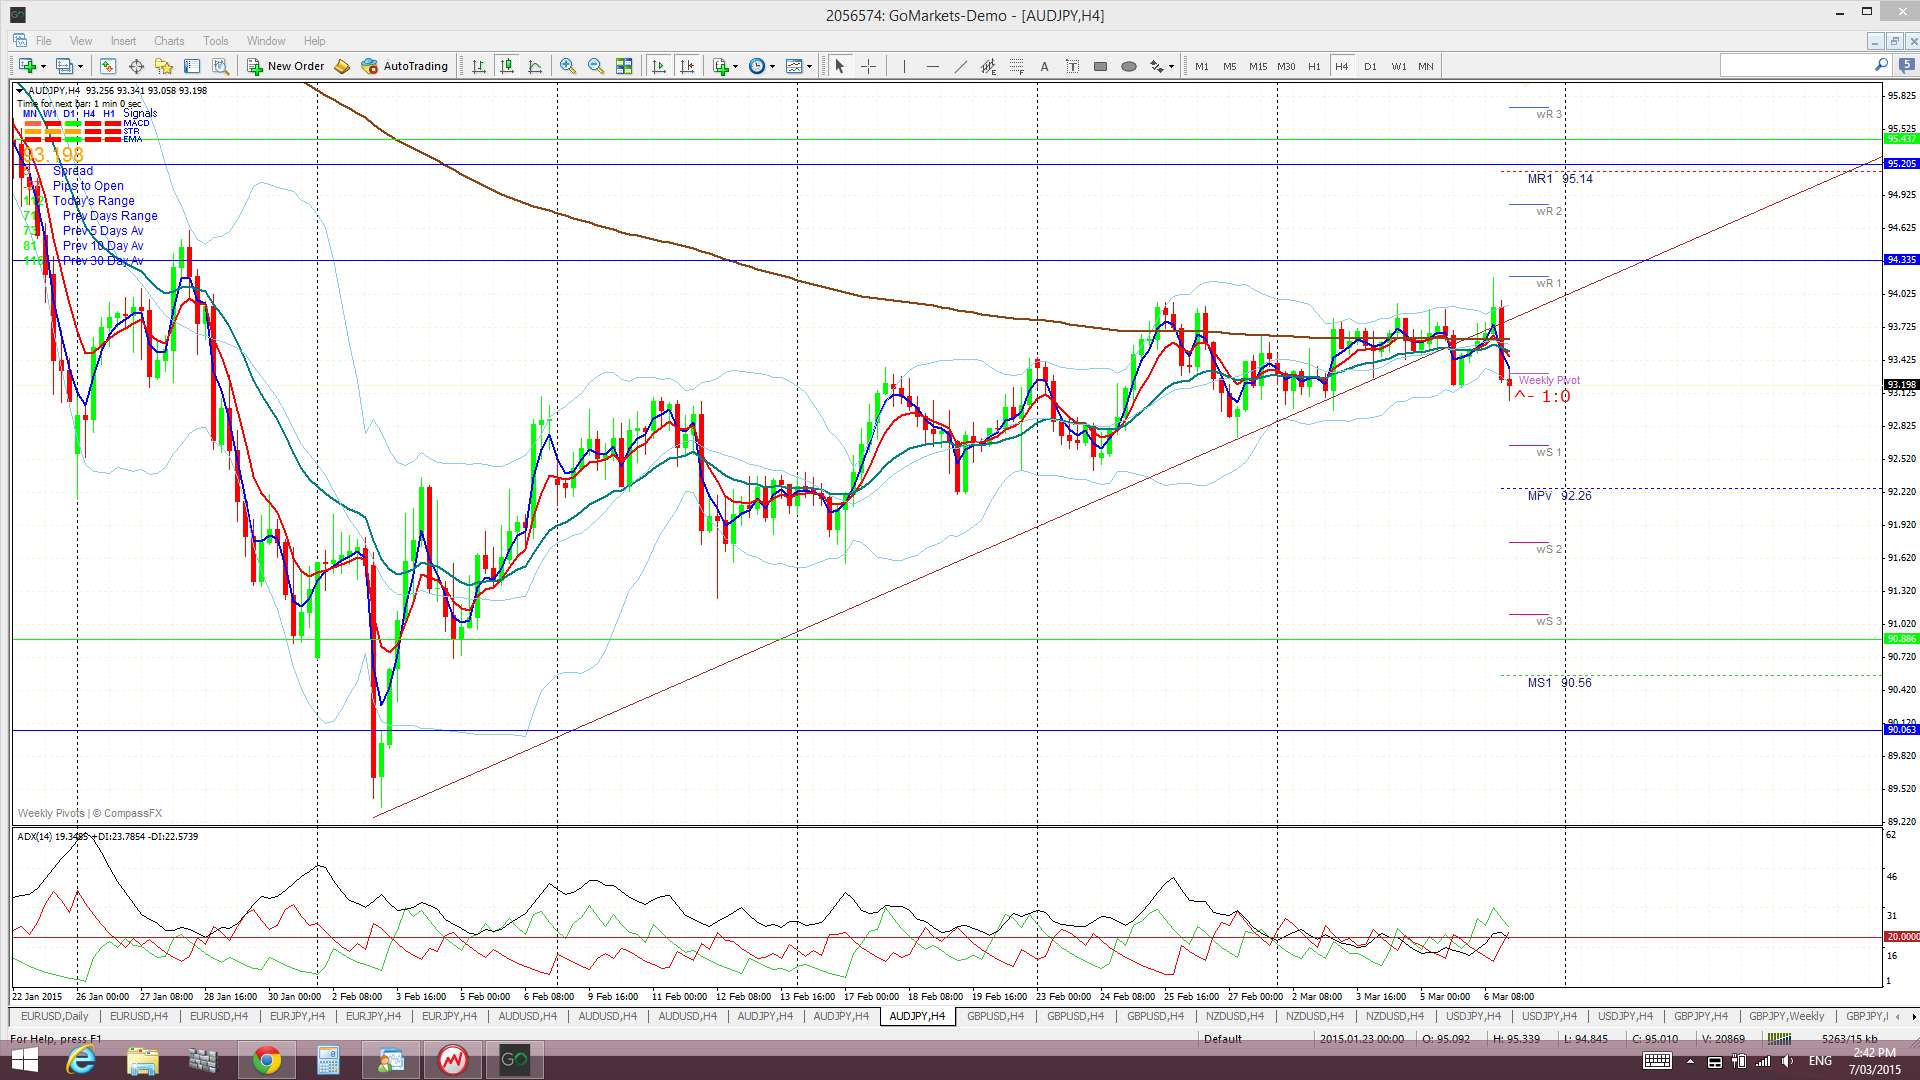
A/J: The A/J has continued to chop under the 96 level as it has done for the last five weeks now. This pair broke down below a recent support trend line but this move hasn’t triggered any new TC signal as yet.
Price is now trading in the Cloud on the 4hr chart, below on the daily and weekly chart but above the Cloud on the monthly chart.
The weekly candle closed as a small bearish candle with a long upper shadow.
- I’m watching for any new TC signal on this pair and the support trend line.
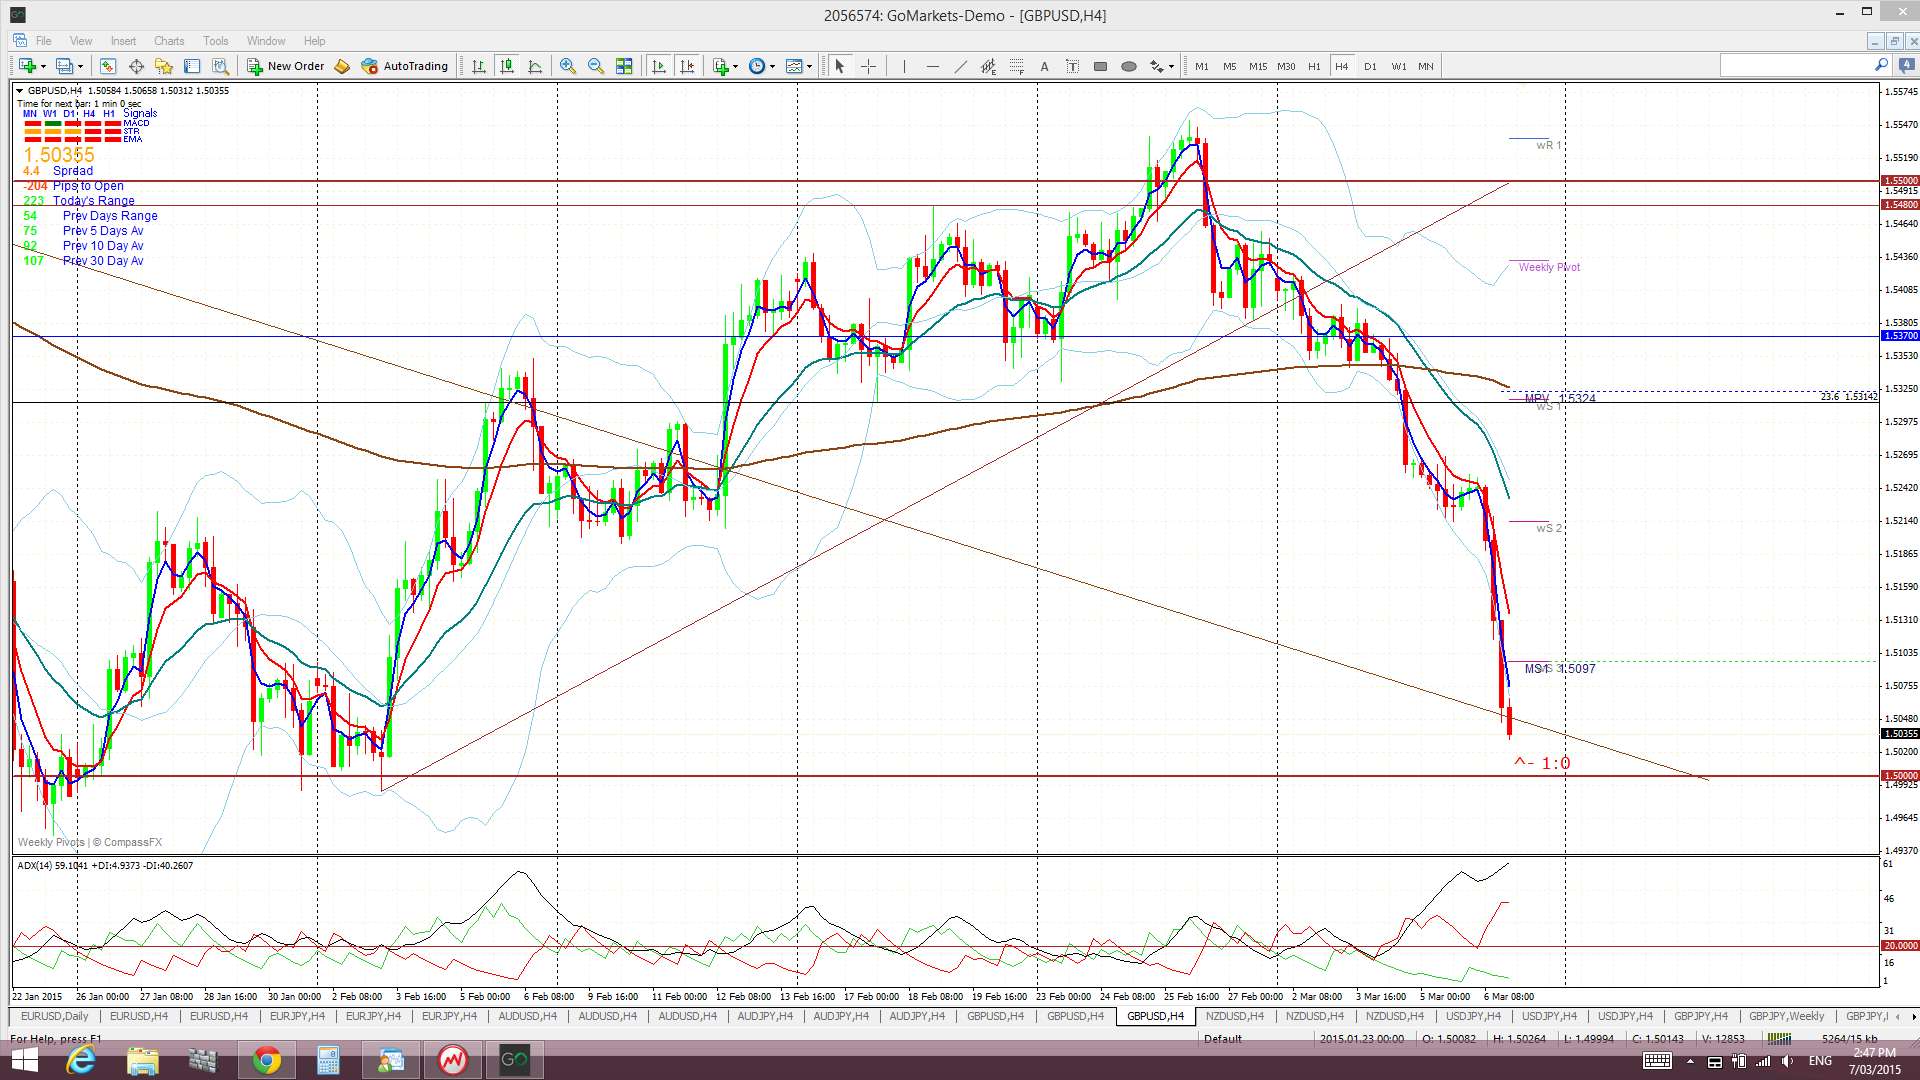
G/U: The Cable chopped lower last week and broke down below a recent support trend. Whilst this move was a bit messy and didn’t trigger a new TC signal the trend line break alone gave over 350 pips. This pair didn’t like NFP Friday either as the following 30 min chart reveals:
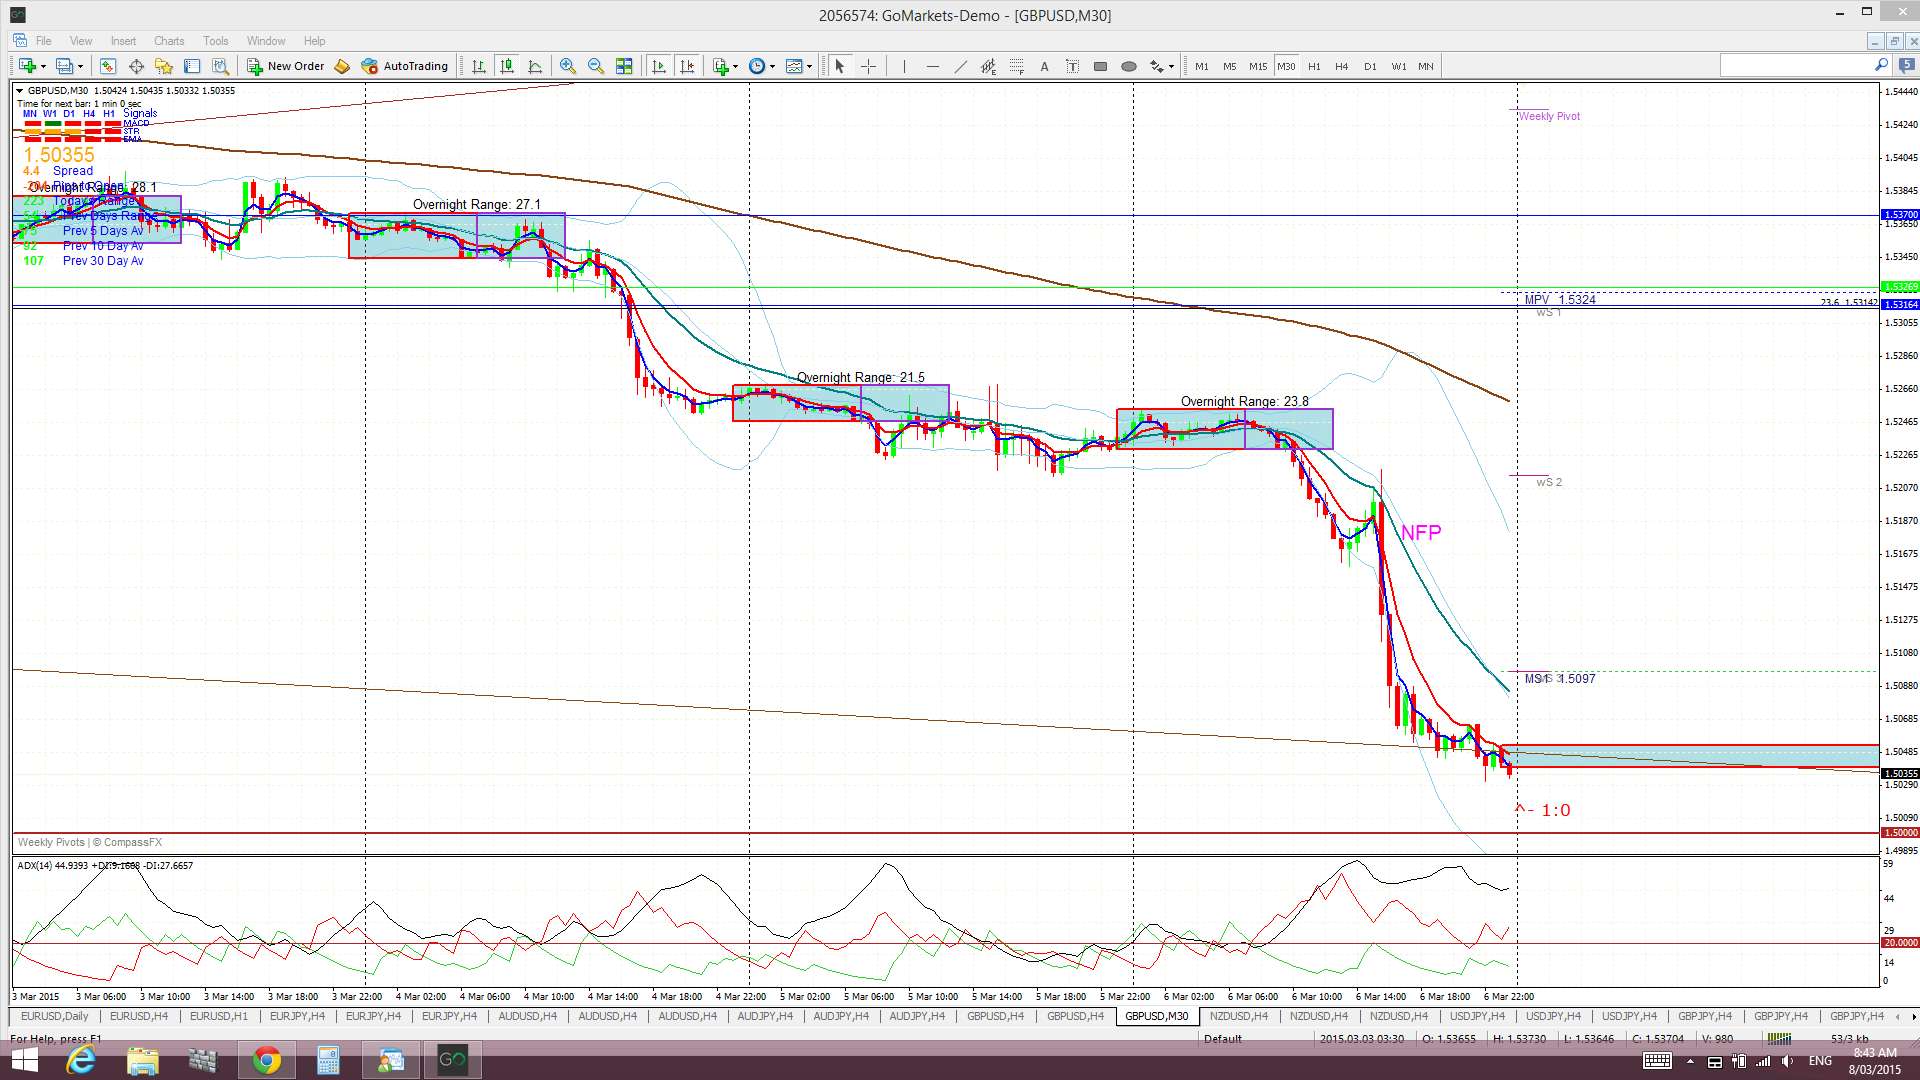
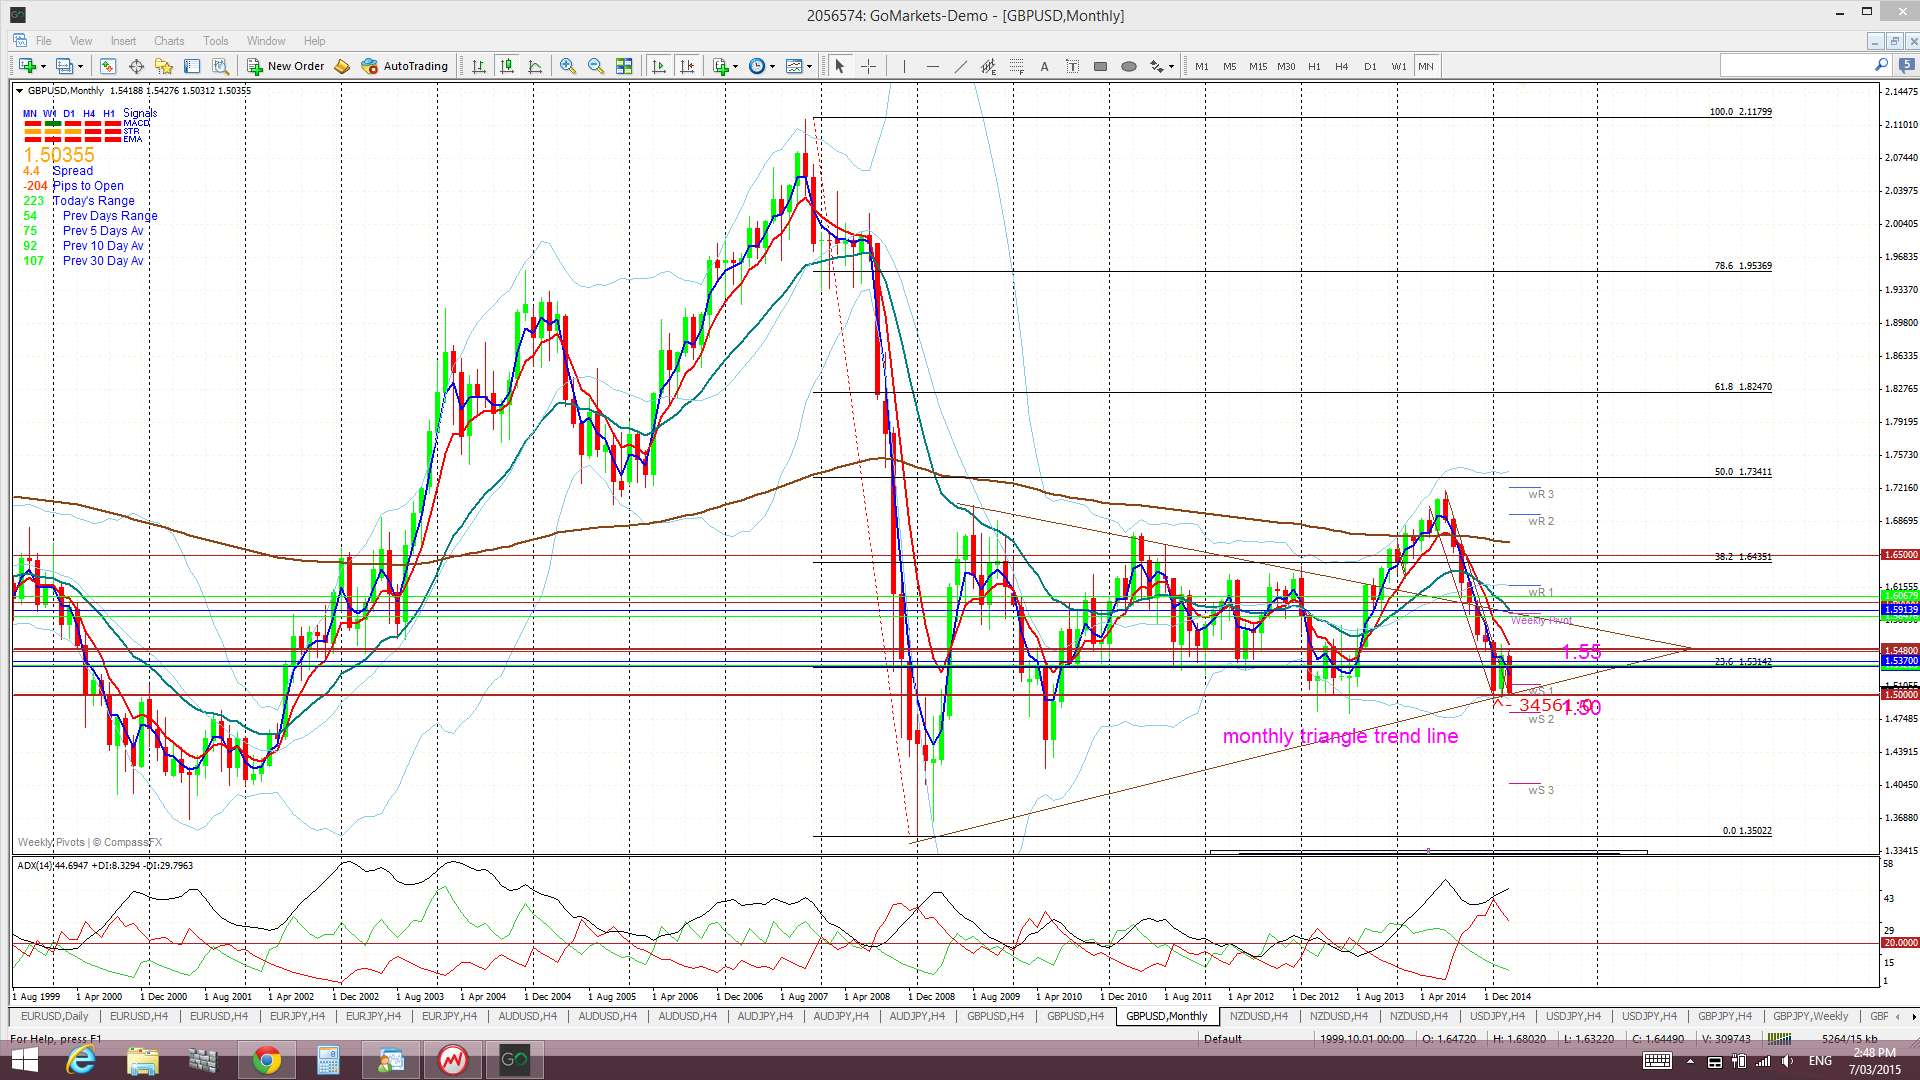
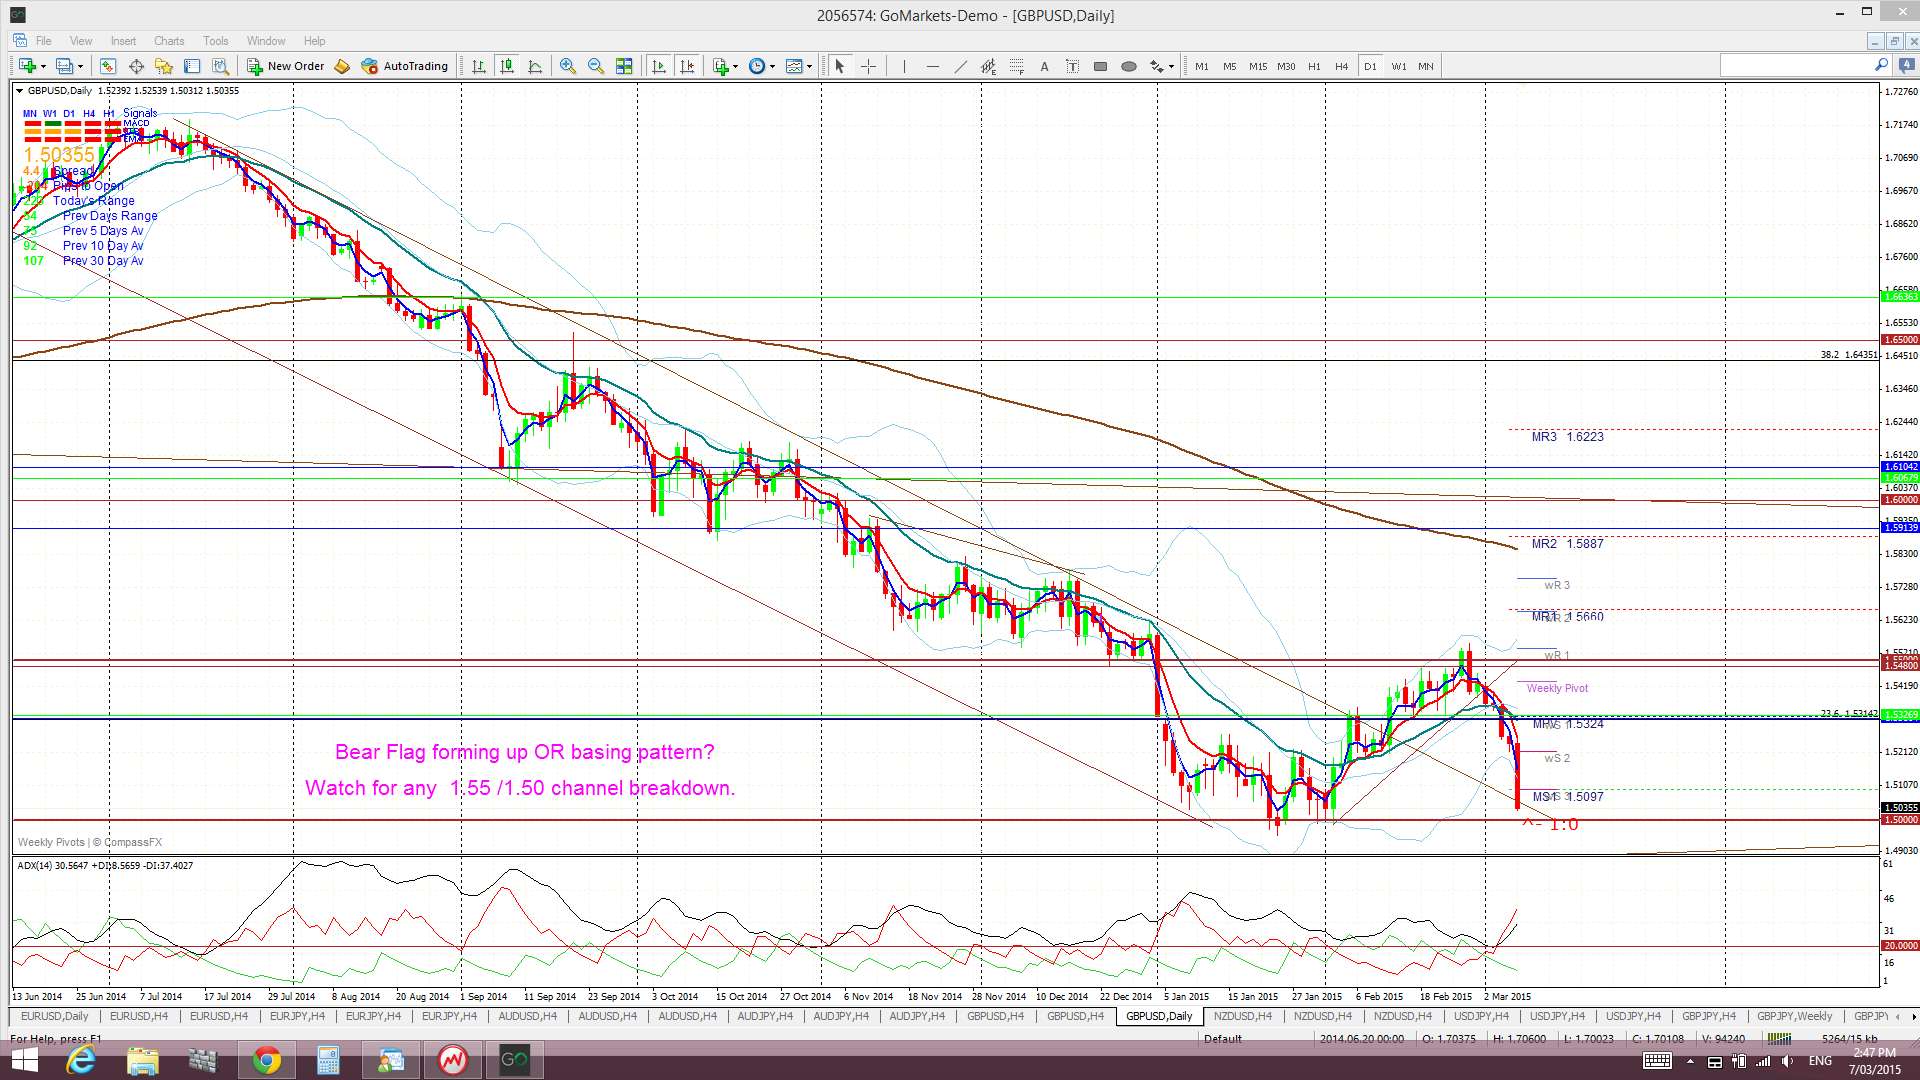
Bear Flag on the weekly chart? Price action is now back down near the major S/R level of 1.50 level again and this has brought the potential weekly chart ‘Bear Flag’ into greater focus. A break and hold below 1.50 would support this bearish pattern. This 1.50 may offer some decent support though as, apart from being horizontal support, it is also the region of the monthly triangle trend line. Any break and hold below 1.50 though would support this bearish pattern. The ‘Flag Pole’ is about 1,700 pips in length and would suggest a similar move below the 1.50 break.The interesting feature here is that a 1,700 pip move or so would bring price down near the December 2008 lows and set up one almighty ‘Double Bottom! Scary stuff for GBP bulls for sure!
Price is now trading below the Cloud on the 4hr, daily, weekly and monthly charts.
The weekly candle closed as a large bearish candle.
- I’m watching for any new TC signal on this pair and the 1.50 level.
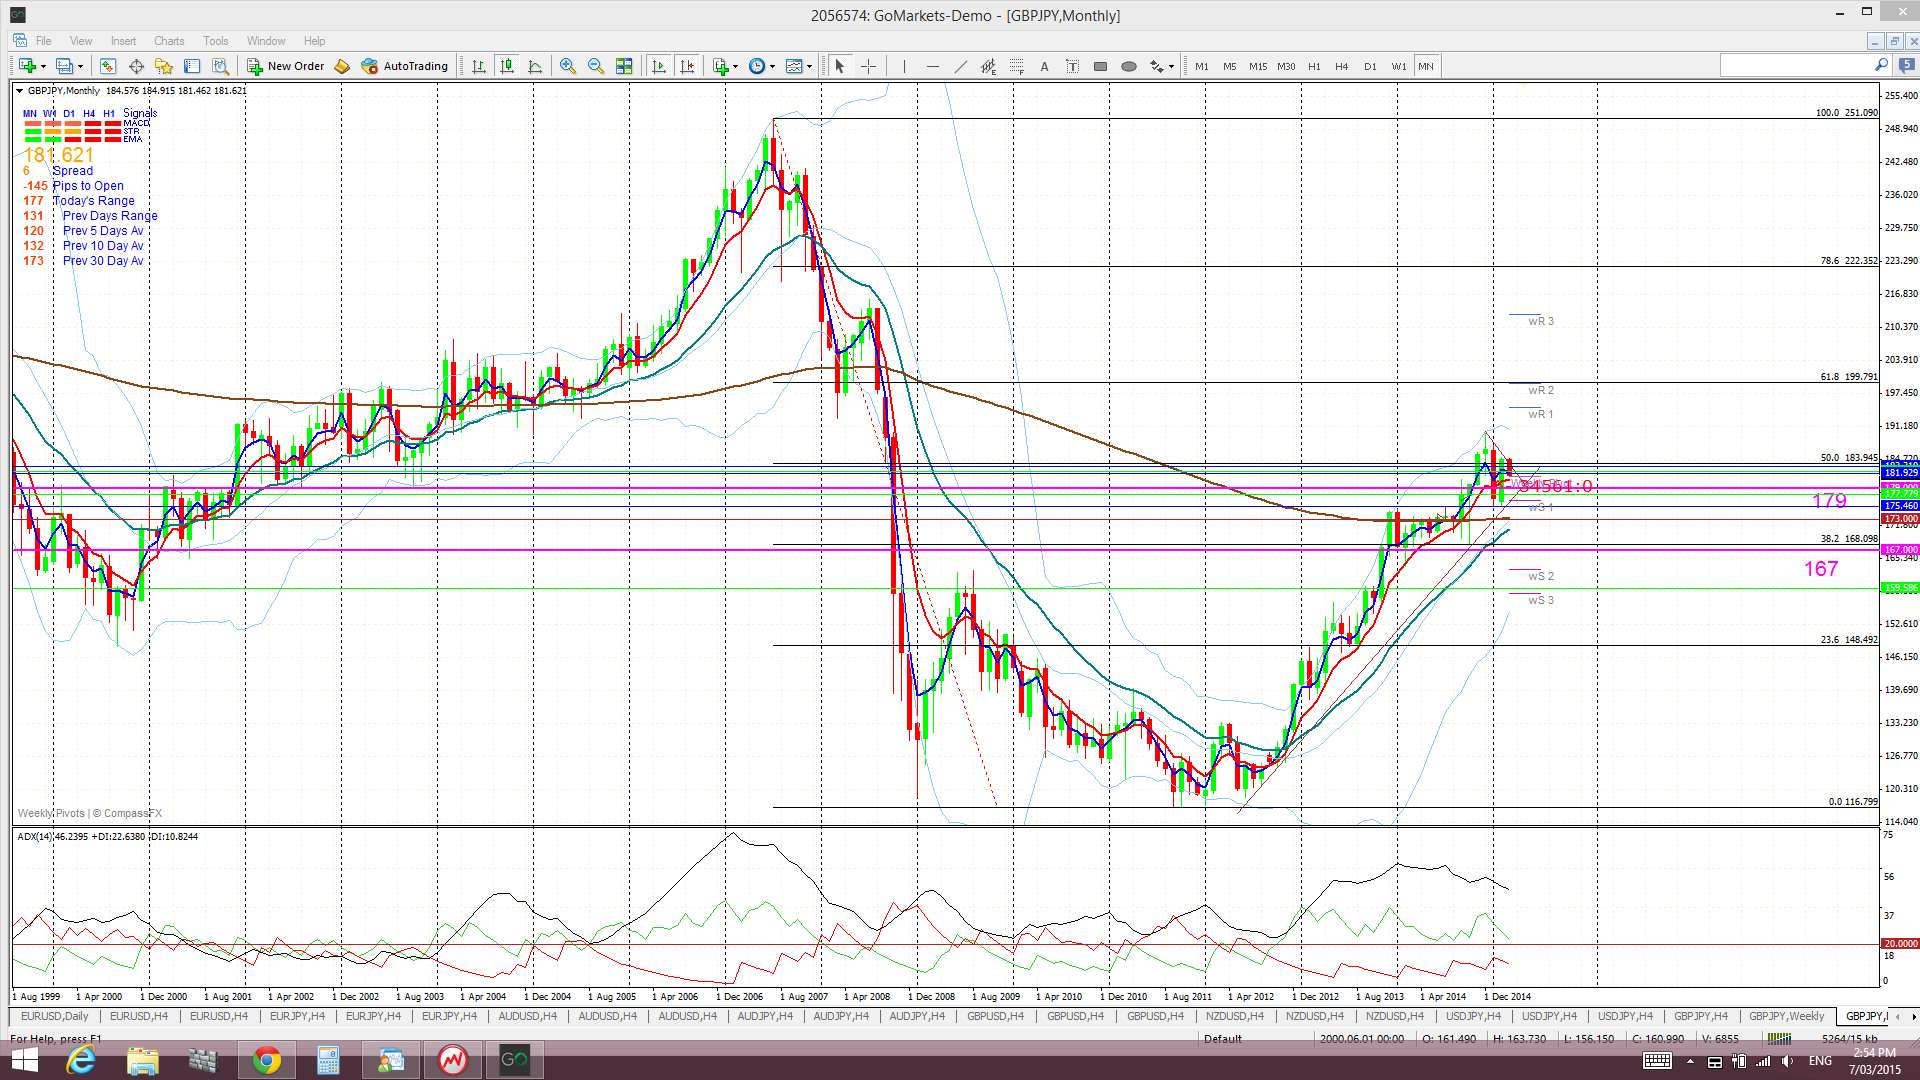
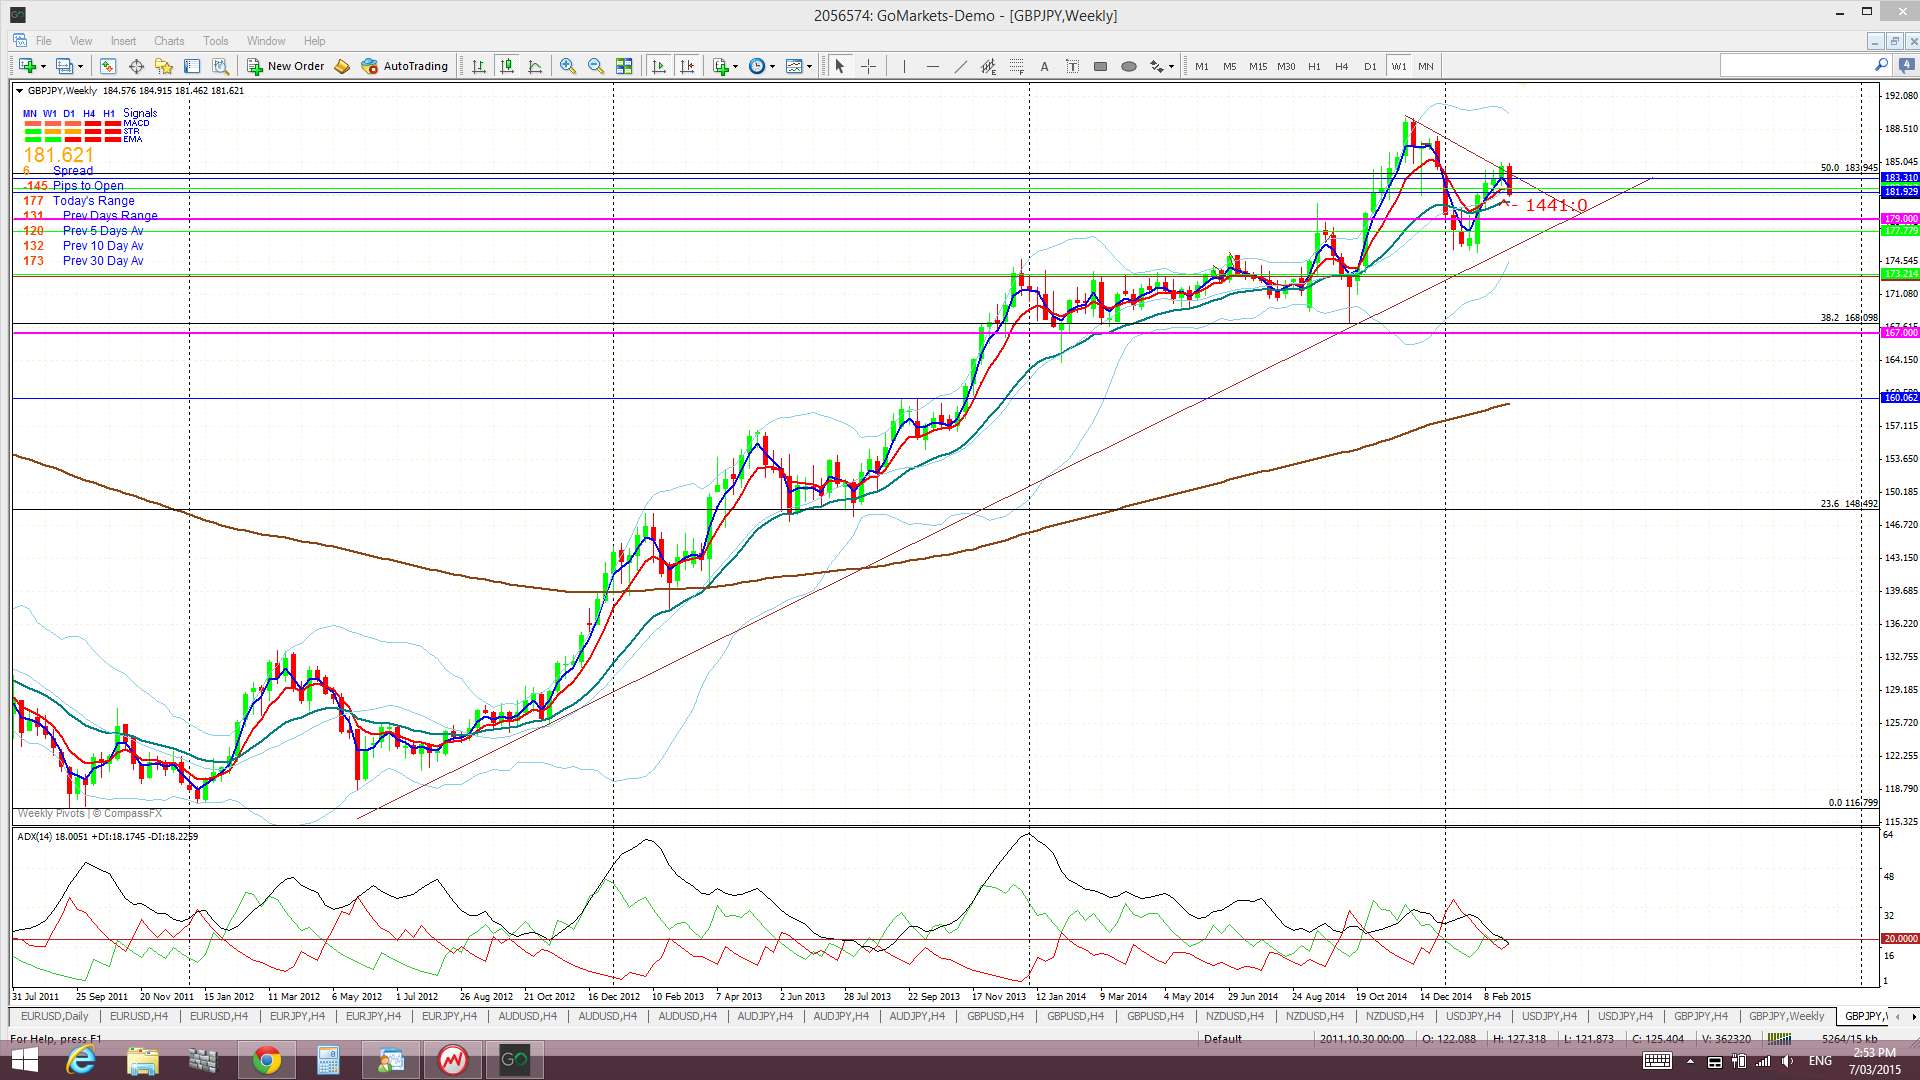
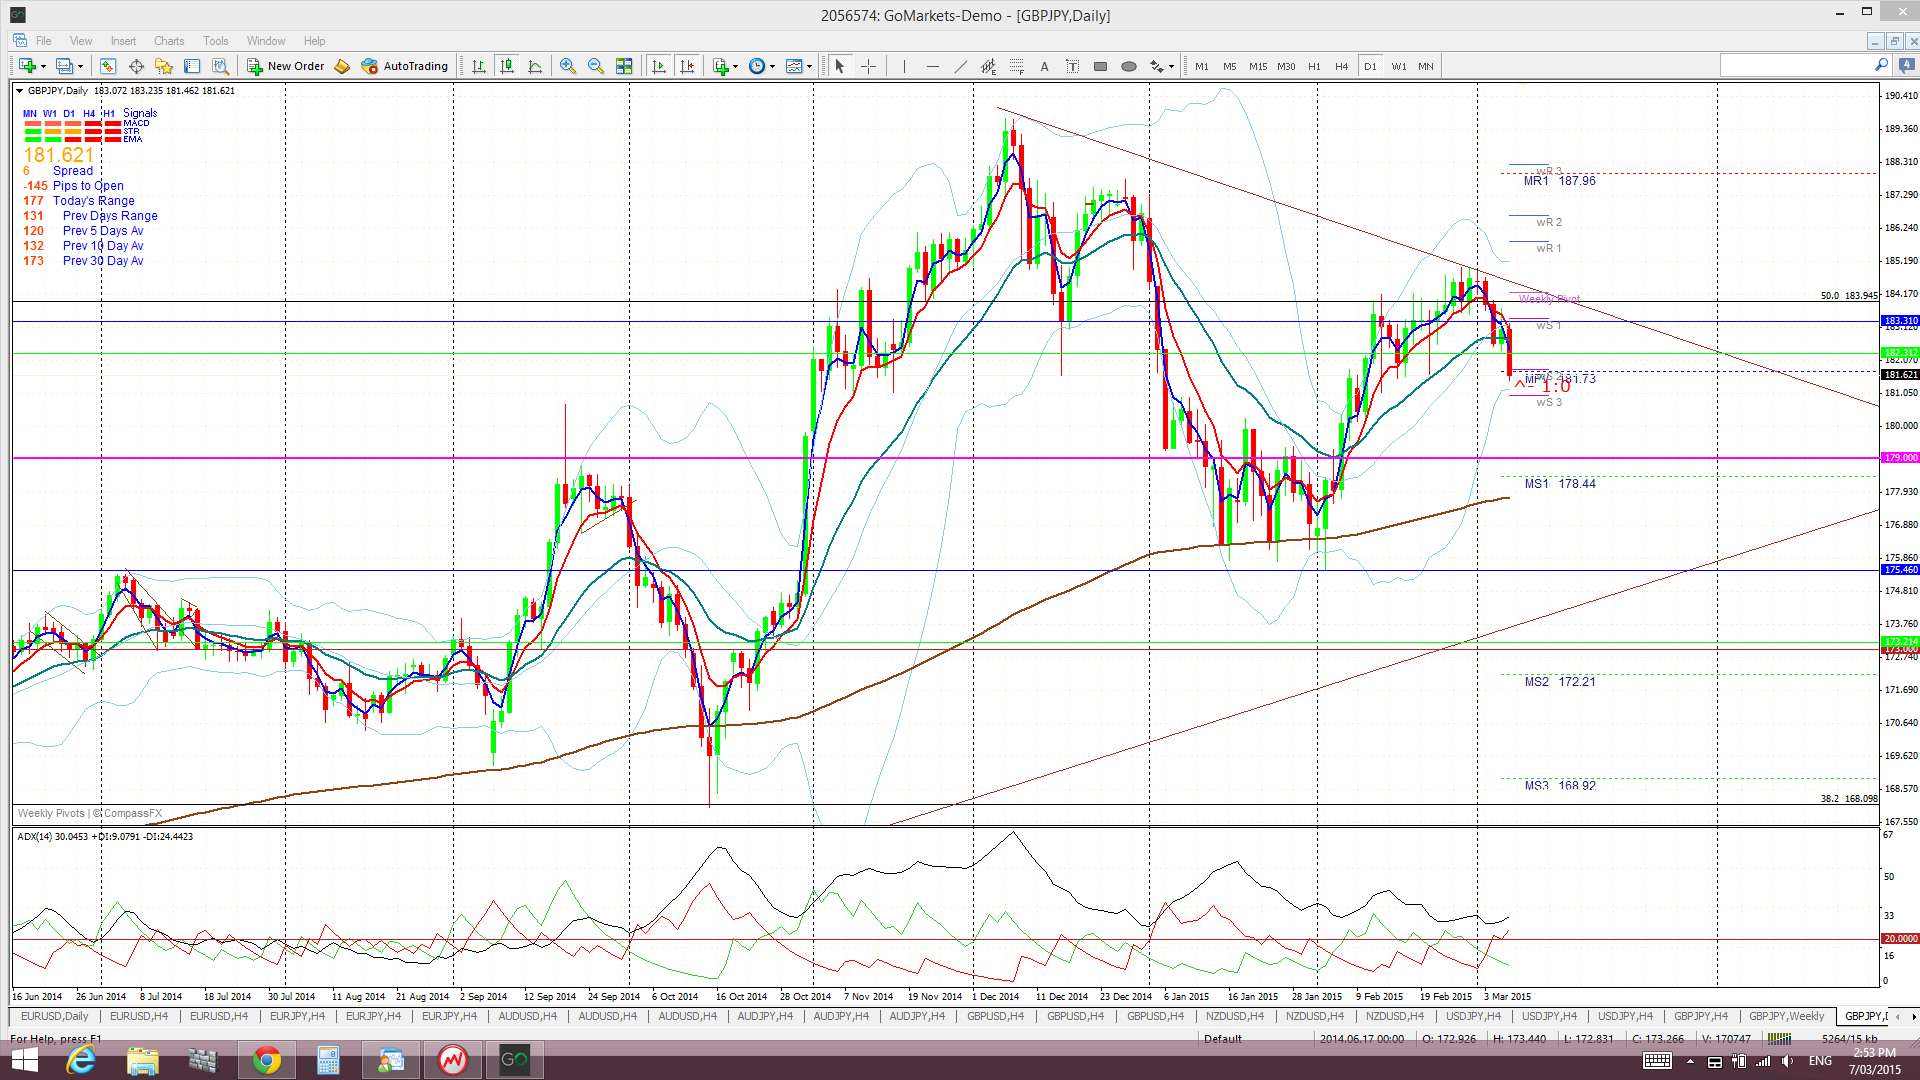
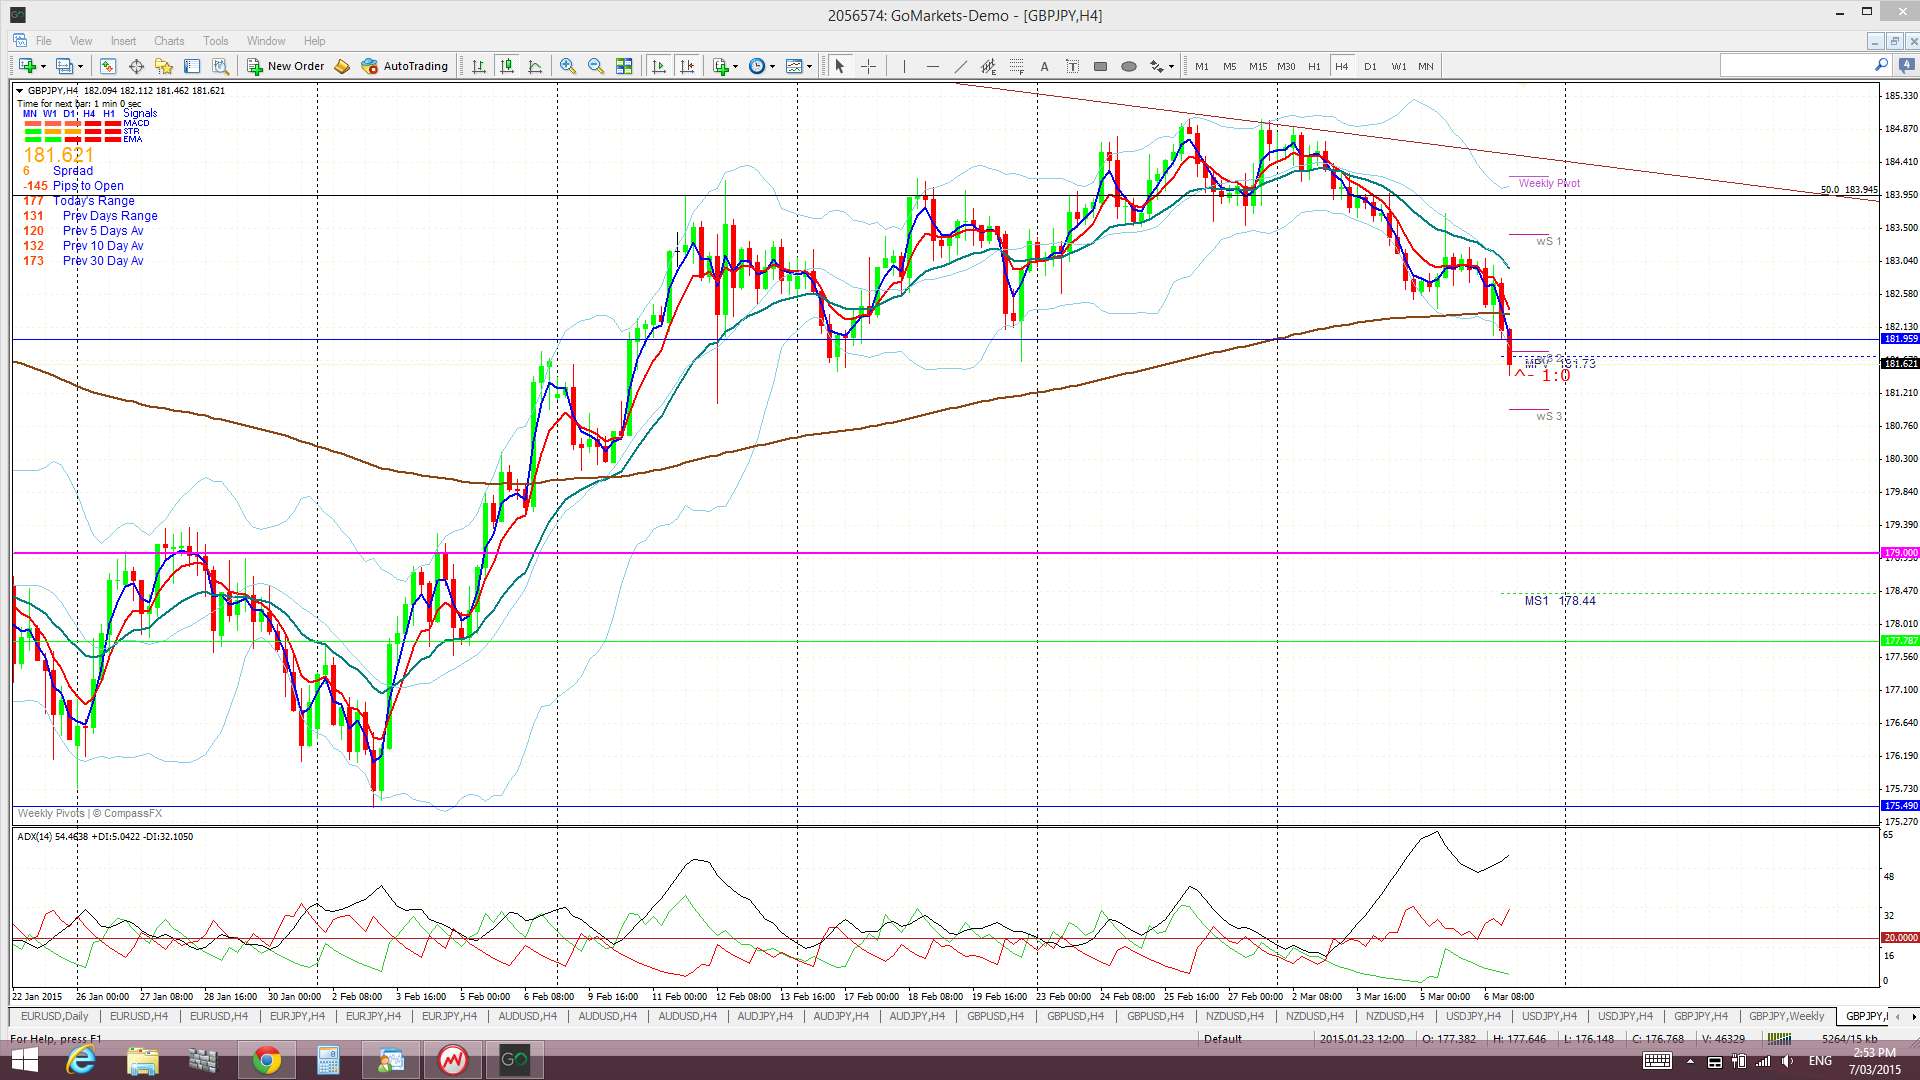
GBP/JPY: The GBP/JPY chopped lower last week and the daily chart triangle trend line has been adjusted to reflect this new resistance. Price action remained choppy here though as it had been navigating the major 50% Fib level from the 2007-2012 bear move.
Two key S/R levels on the G/J chart: The monthly chart shows a band of choppy congested activity across the chart. This band is defined by rather strong S/R levels at 179 and 167. The 179 level seems to be a key demarcation level and a close and hold above this would suggest bullish continuation. The key 173 level lies midway between these two S/R levels. Targets for any bullish continuation include the 61.8% fib near 200 and the 78.6% fib near 222.
Price is trading below the Ichimoku Cloud on the 4hr chart, in the Cloud on the daily chart but above the Cloud on the weekly and monthly charts which is a bearish shift.
The weekly candle closed as a bearish, almost ‘engulfing’ candle.
- I’m watching for any new TC signal on this pair and the triangle trend lines.
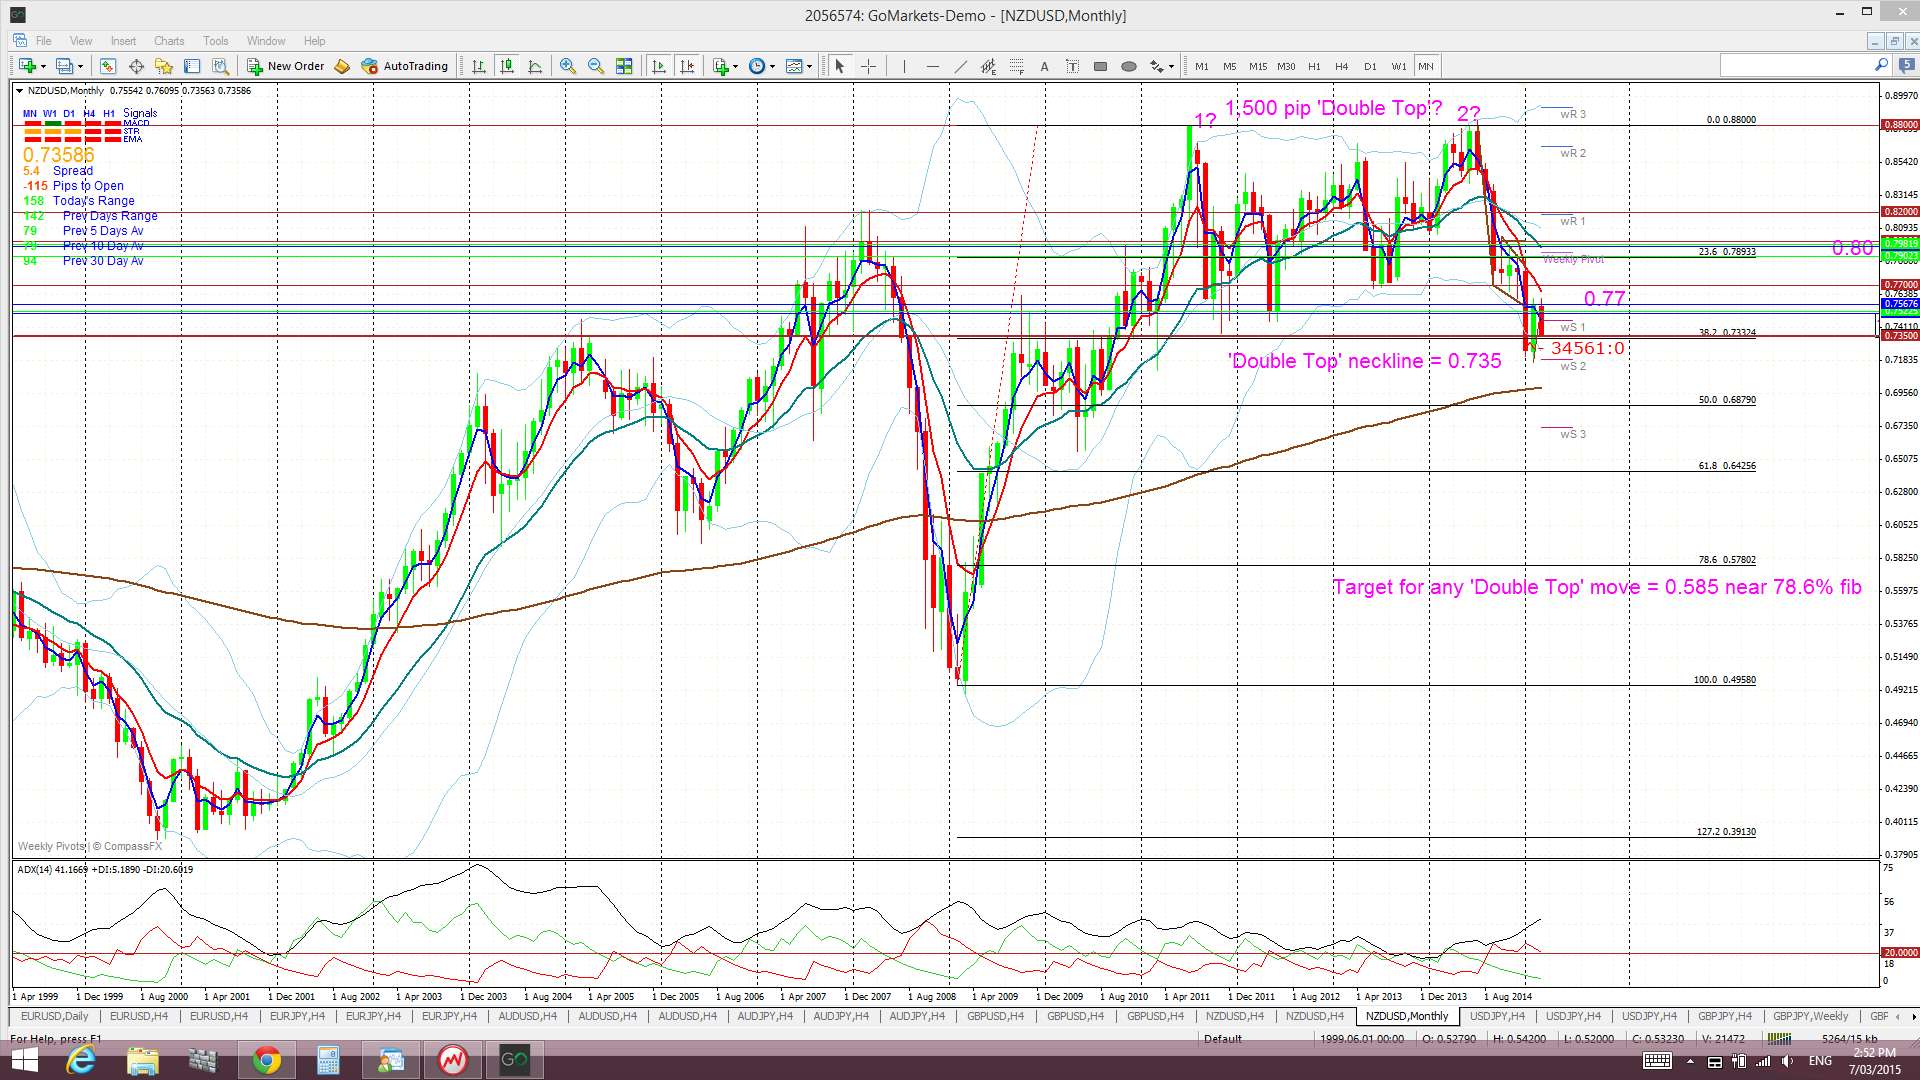
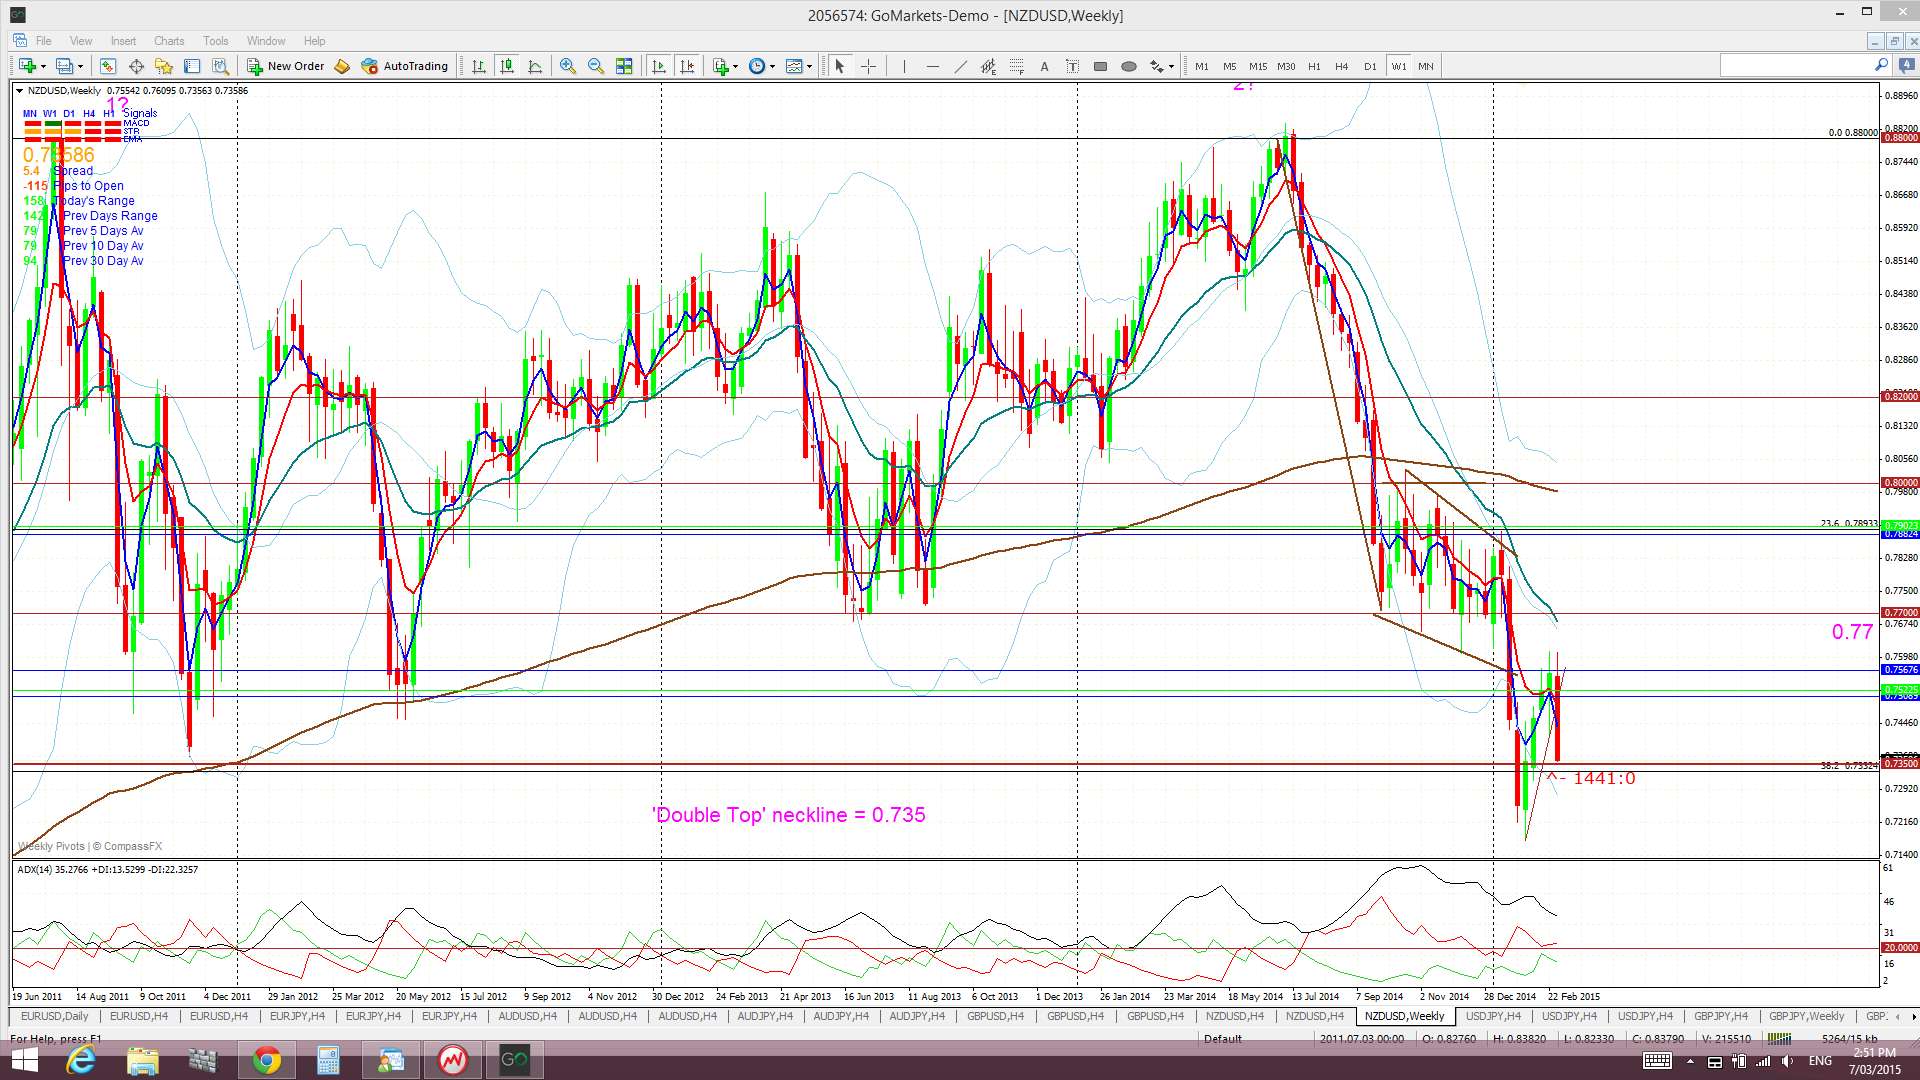
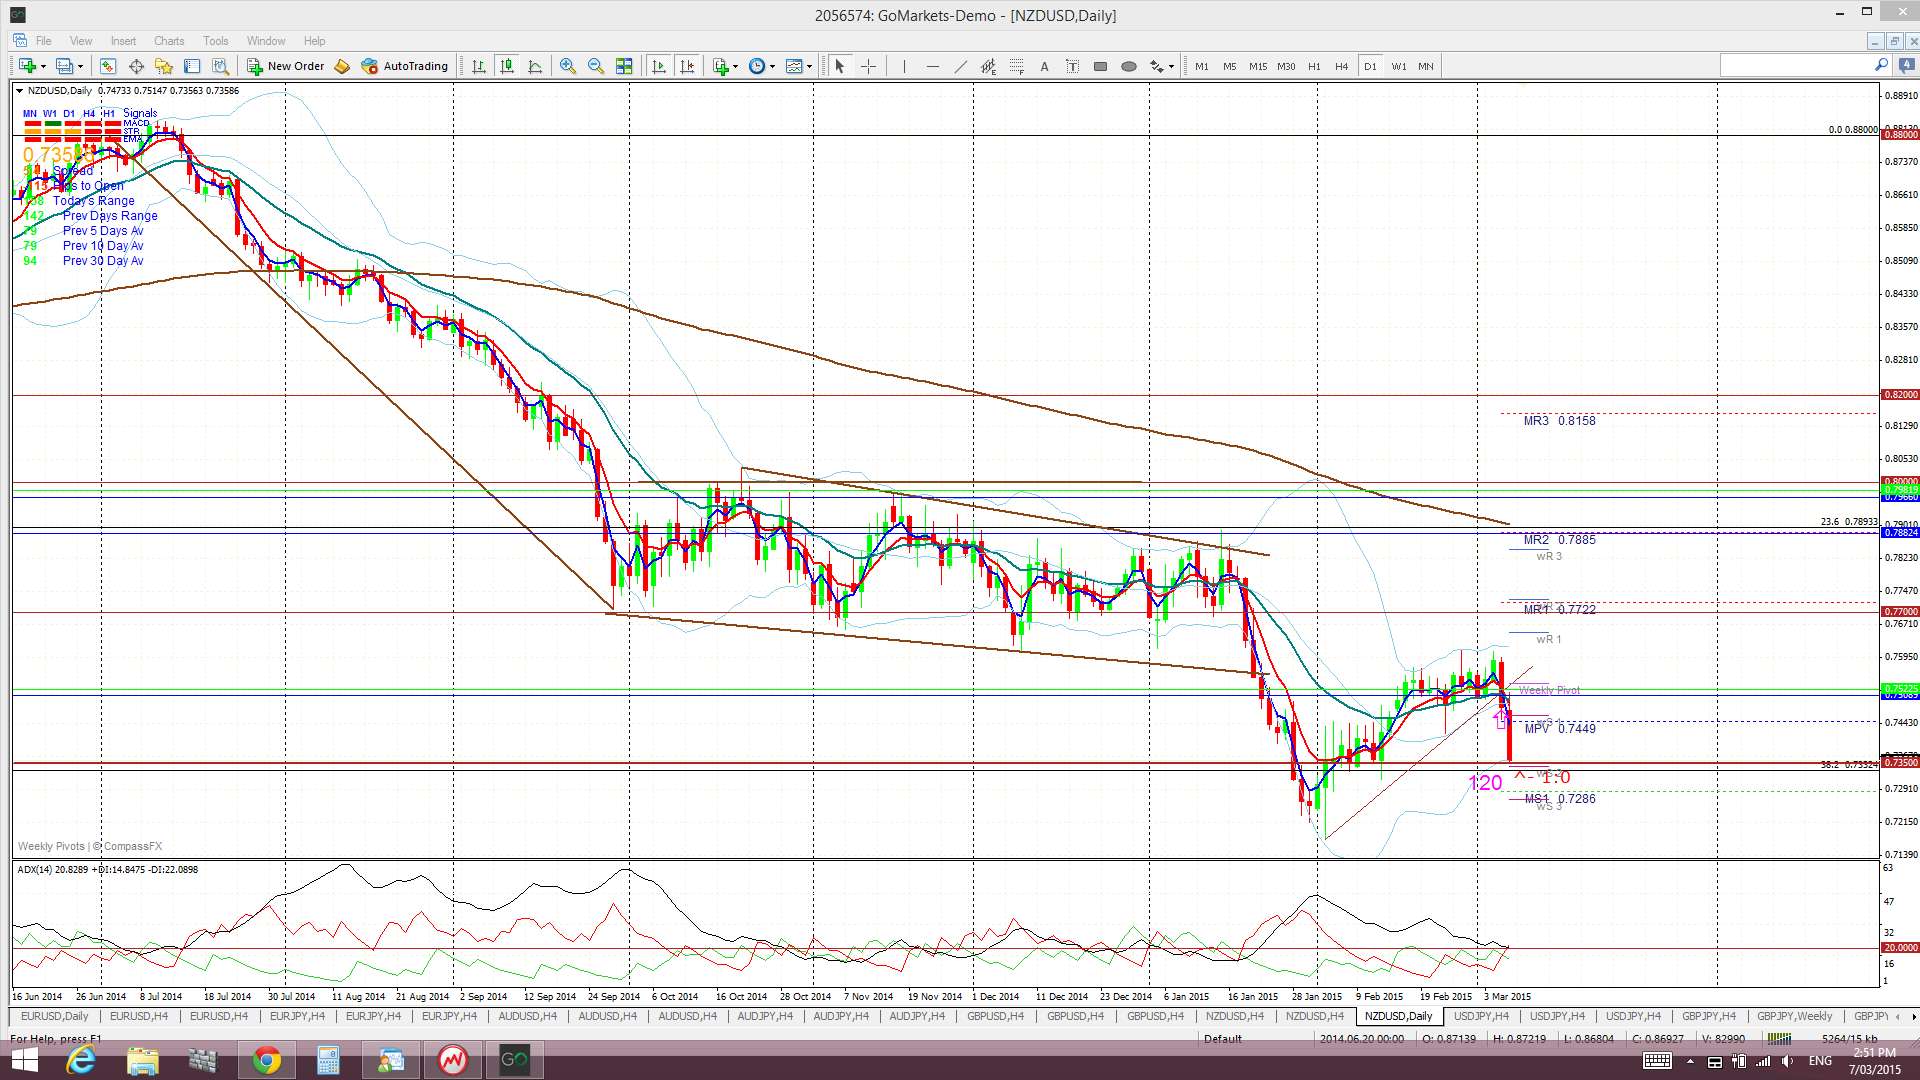
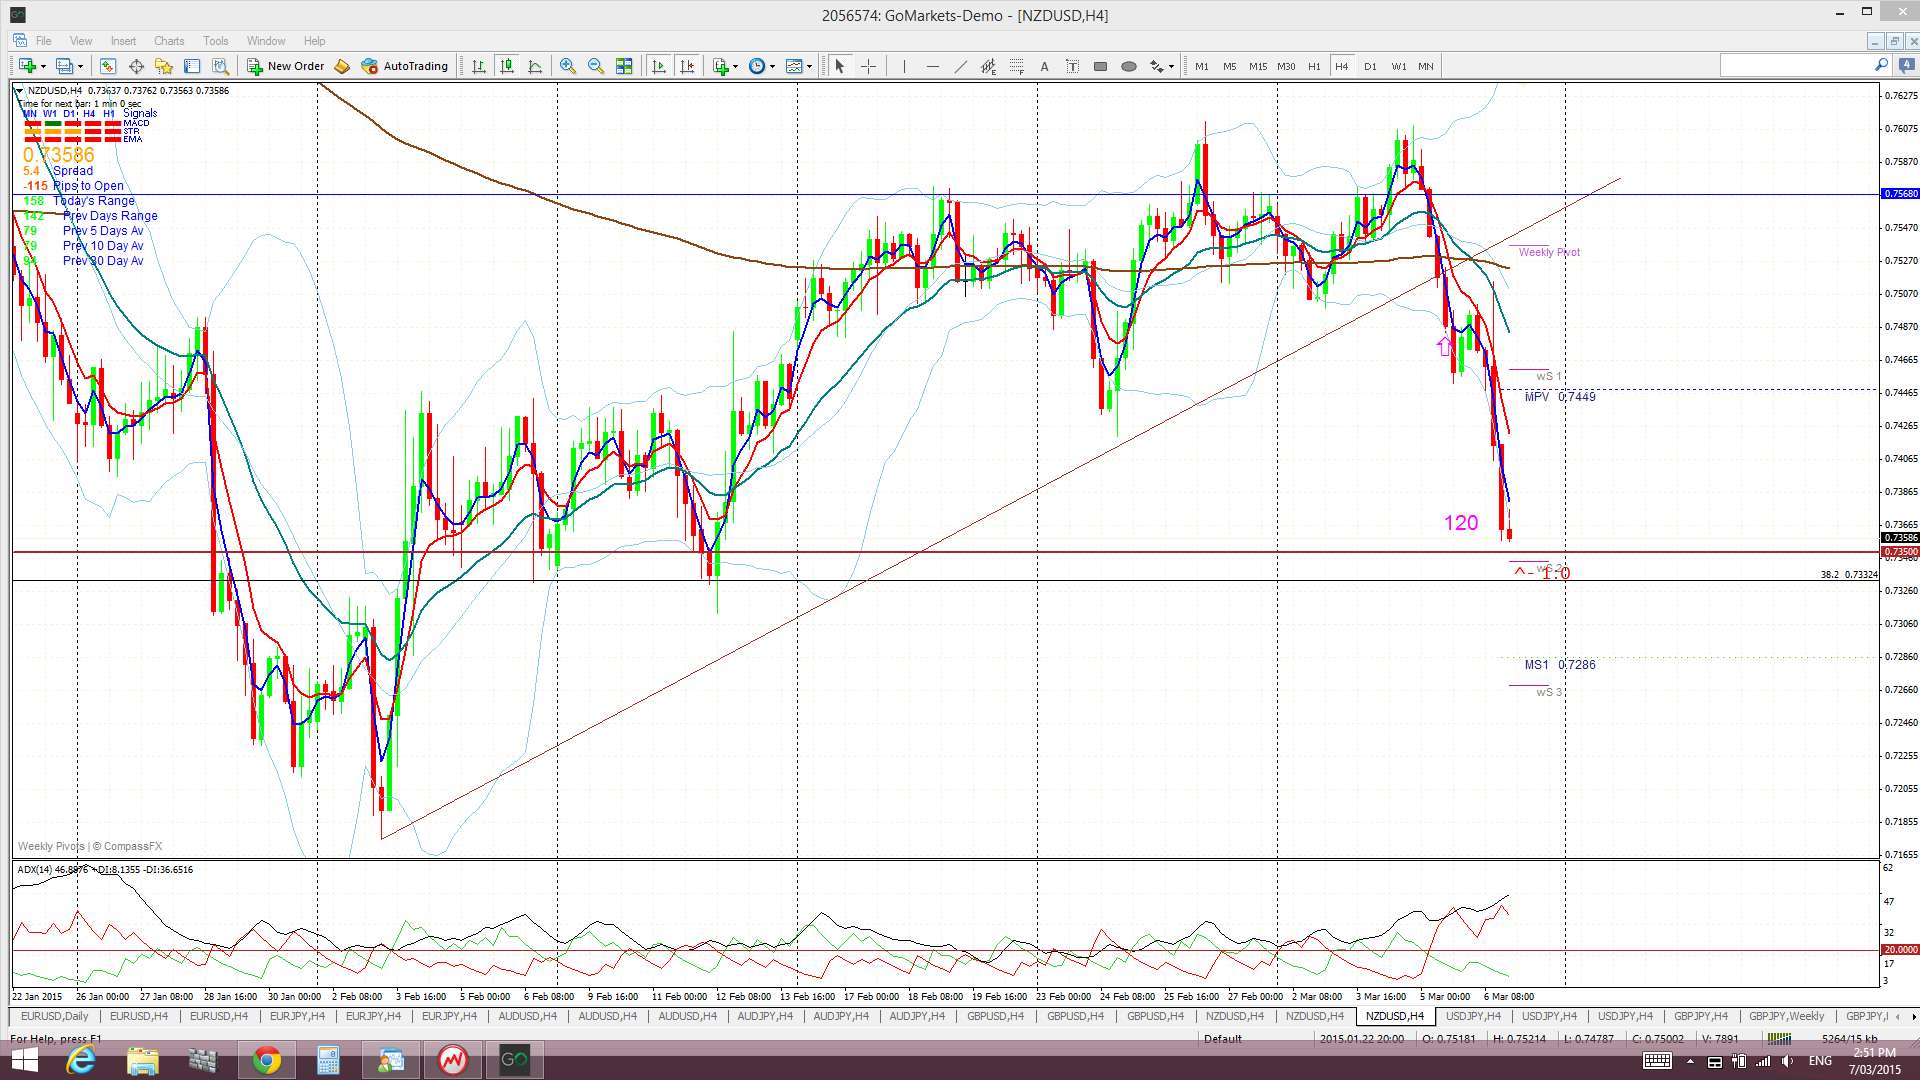
Kiwi: NZD/USD: The Kiwi chopped up and down last week but eventually broke below a recent support trend line and, in doing so, triggered a new TC signal that has given up to 120 pips. I was not surprised to see that price stalled at the end of the week near the key 0.735 level. This is a major S/R level and the ‘neck line’ of a potential monthly-chart bearish ‘Double Top’ region, as described below. This 0.735 will be the level to watch next week.
‘Double Top’ breakdown on Monthly chart? The monthly chart reveals a possible ‘Double Top’ pattern with a neck line at 0.735. The monthly candle close below this level for January suggested a possible 2,000 pip bearish follow through move as this is the height of the ‘Double Top’ BUT there does not seem to be a hold below this key level JUST YET. This may still well evolve, especially if the USD index regains its bullish mojo but any reversal on the USD index could see the Kiwi continue to bounce up off this major support.
Fib levels shows other possible targets for any bearish continuation below 0.77 as being the:
- 38.6% fib near 73.5.
- 50% fib near 70 and the monthly 200 EMA.
- 61.8% fib near 0.65.
Price is now trading below the Ichimoku Cloud on the 4hr, daily and weekly charts but in the middle of the Cloud on the monthly chart.
The weekly candle closed as a large bearish candle.
- There is an open TC signal on this pair.
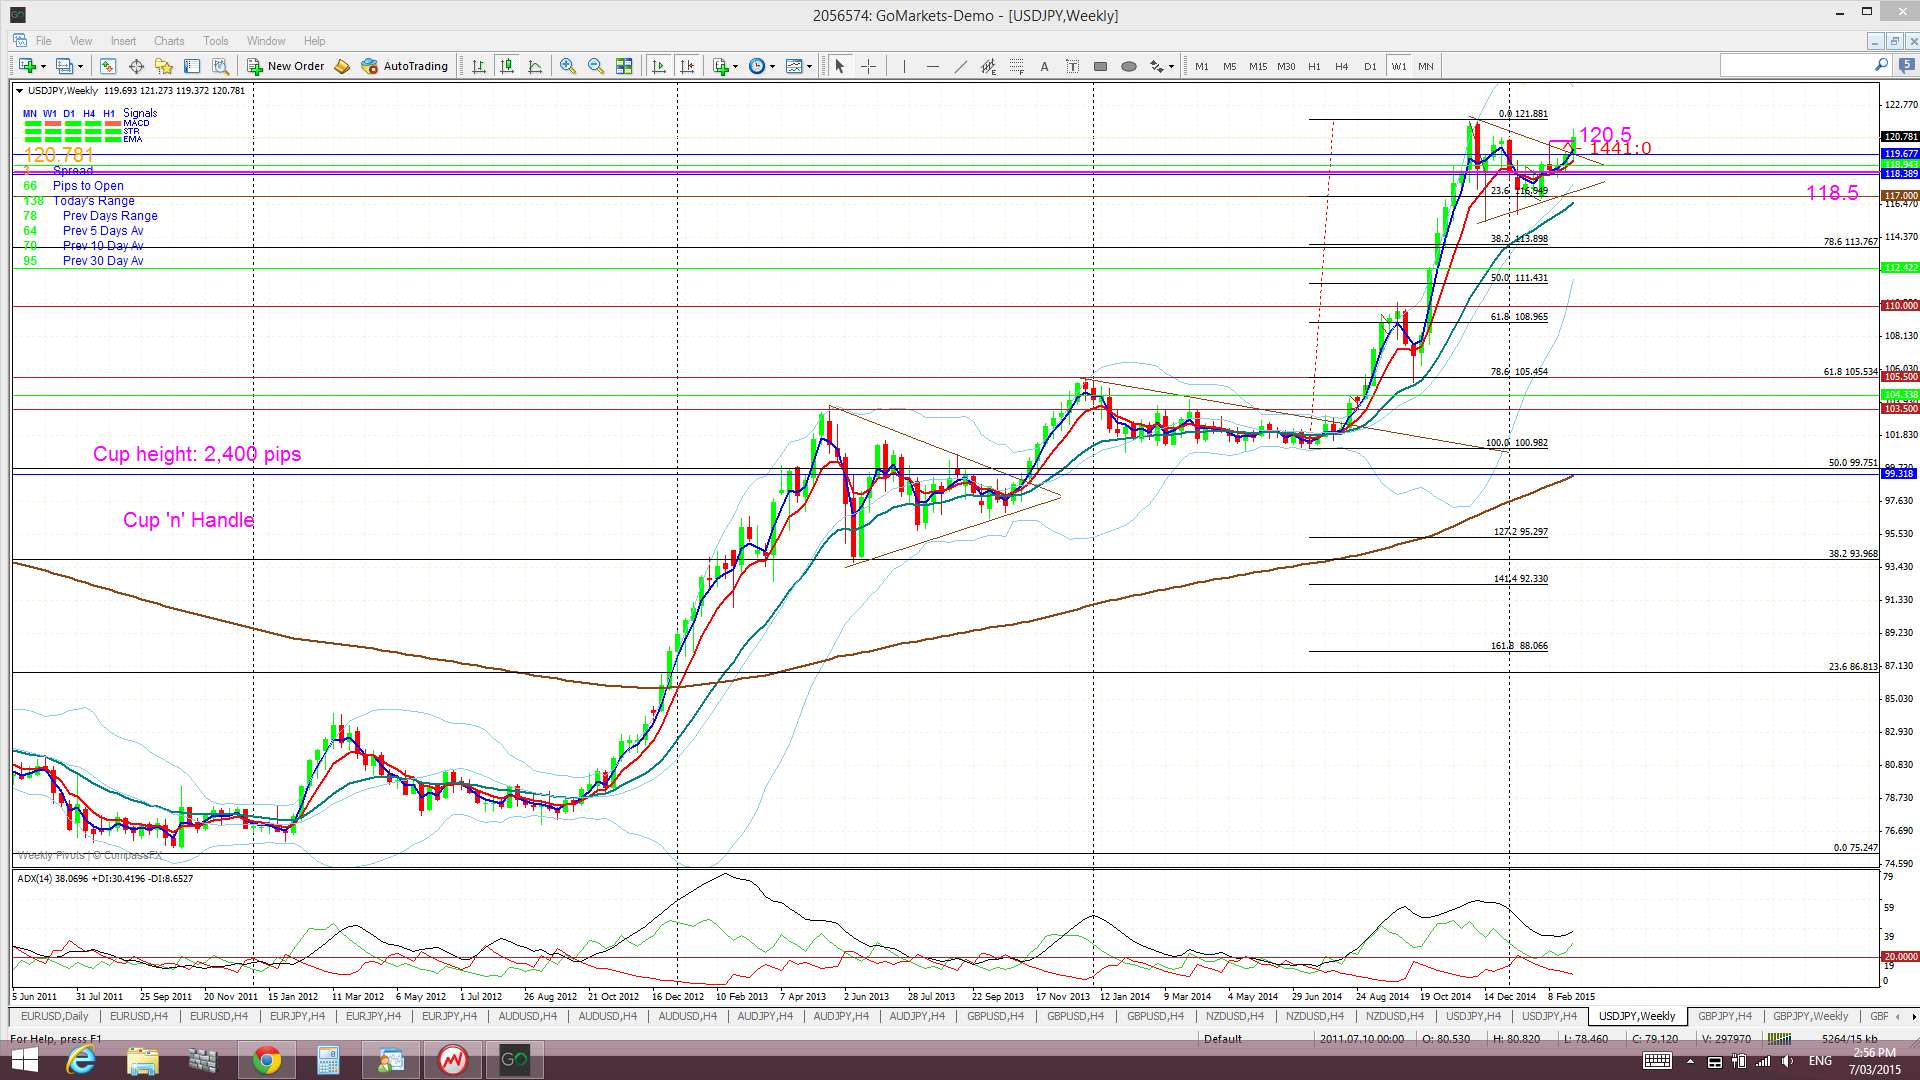
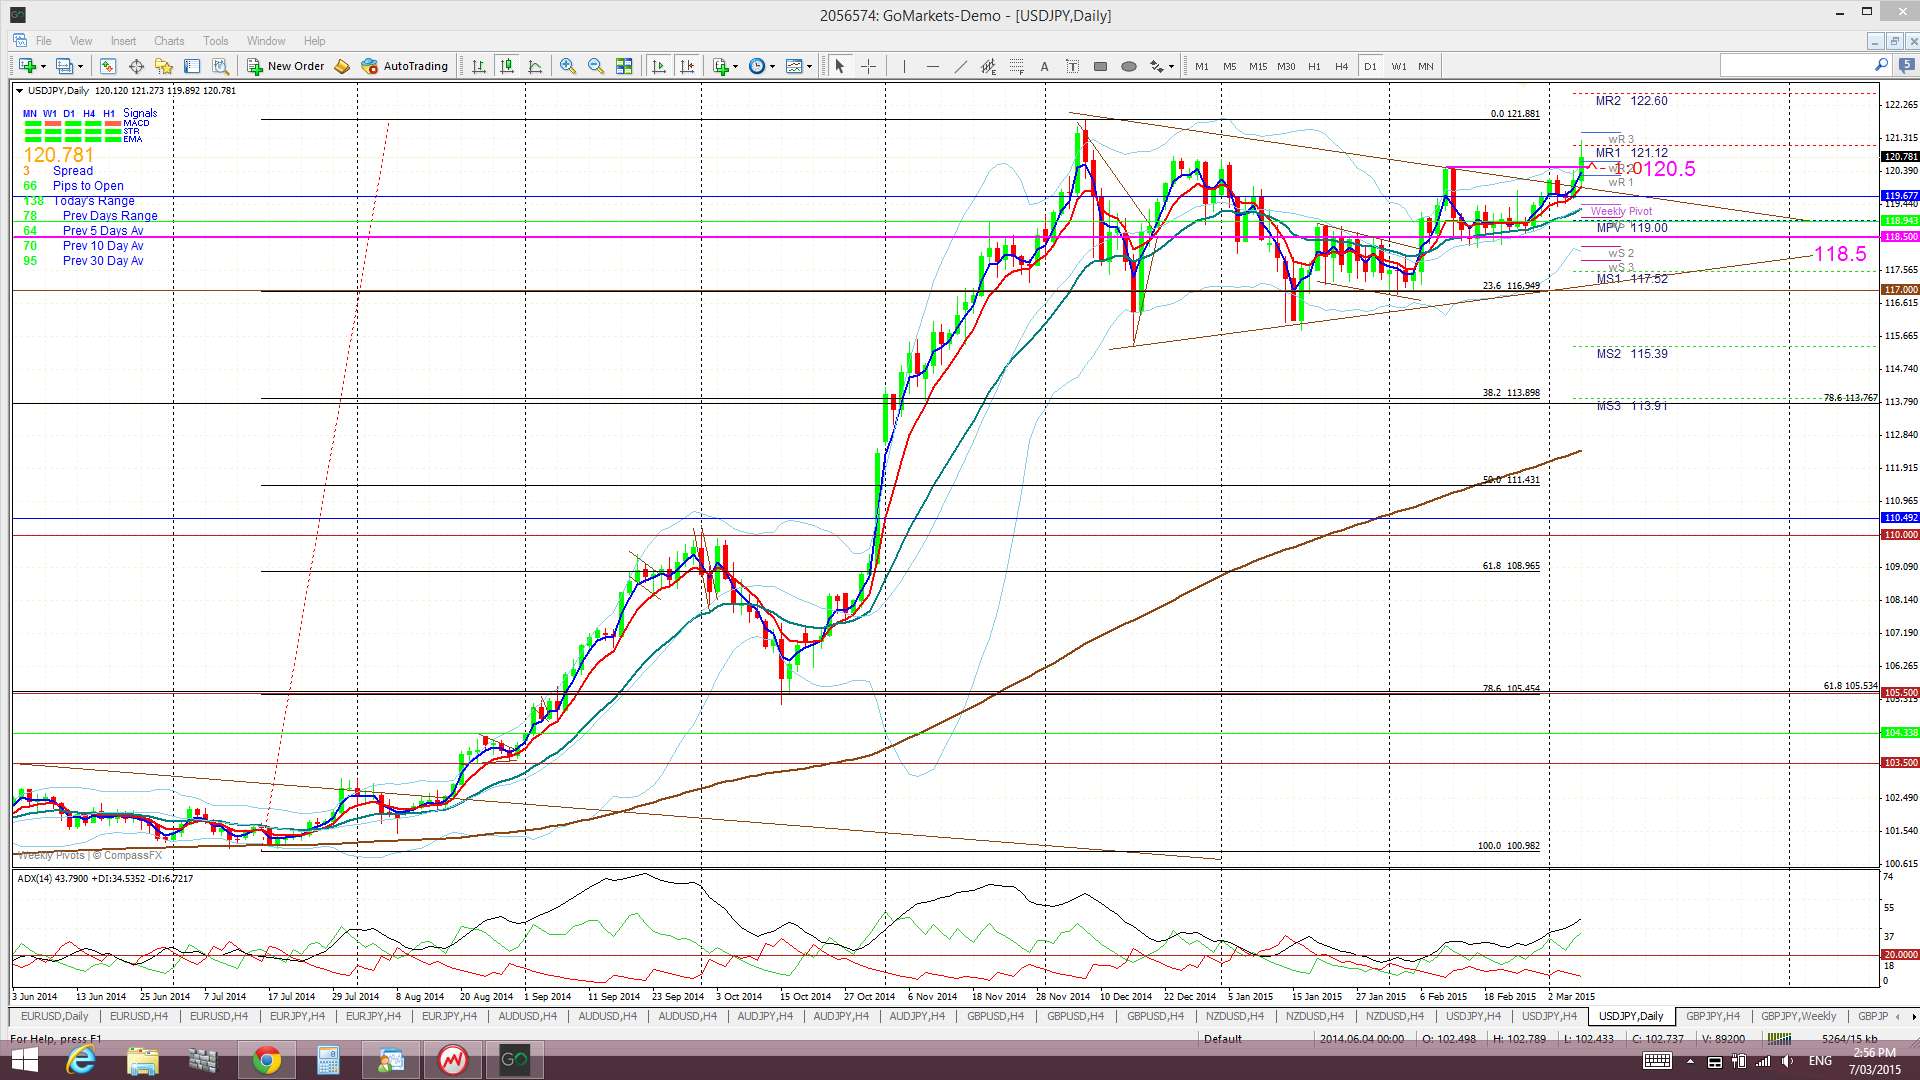
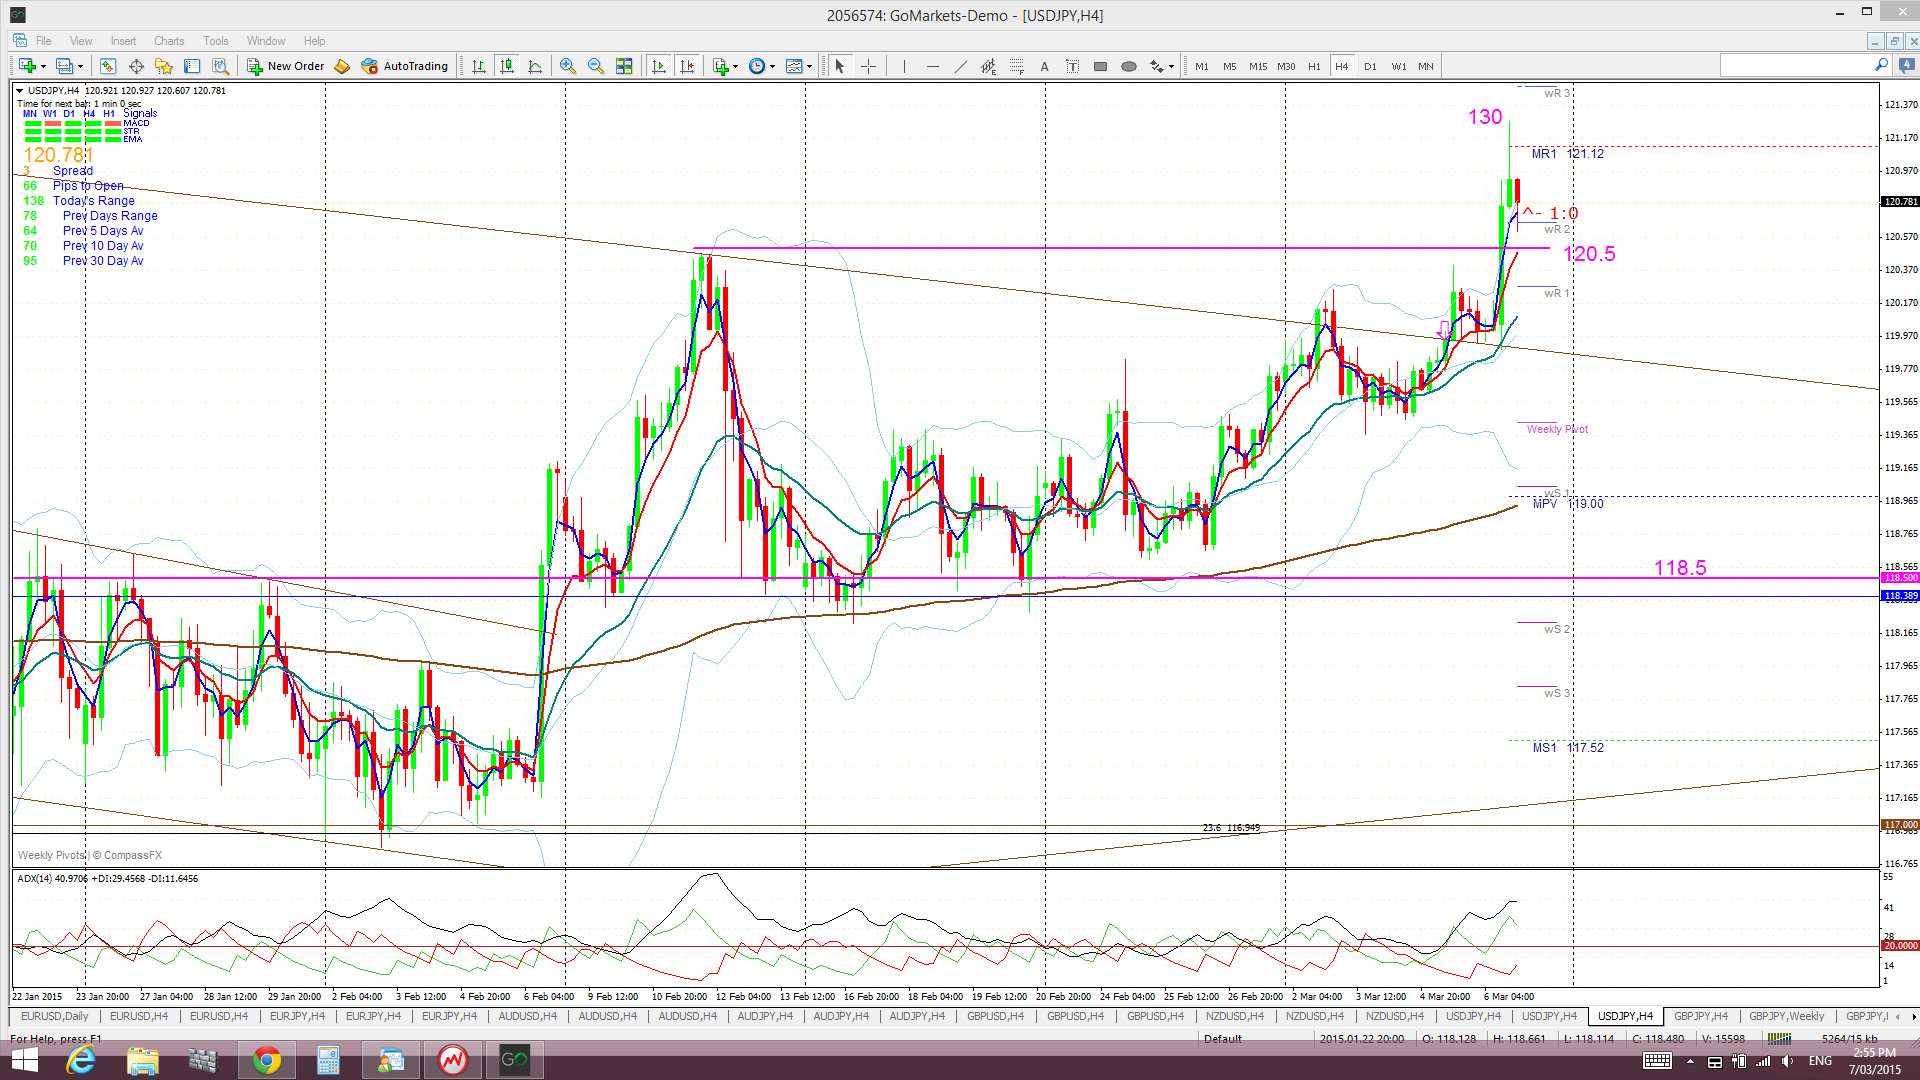
The Yen: U/J: The U/J chopped higher last week and made two attempts to break up and out from the daily chart’s triangle pattern. The second rally on Thursday was successful and this move also triggered a new TC signal that has given up to 130 pips. This signal was helped by the spike activity with Friday’s NFP result.
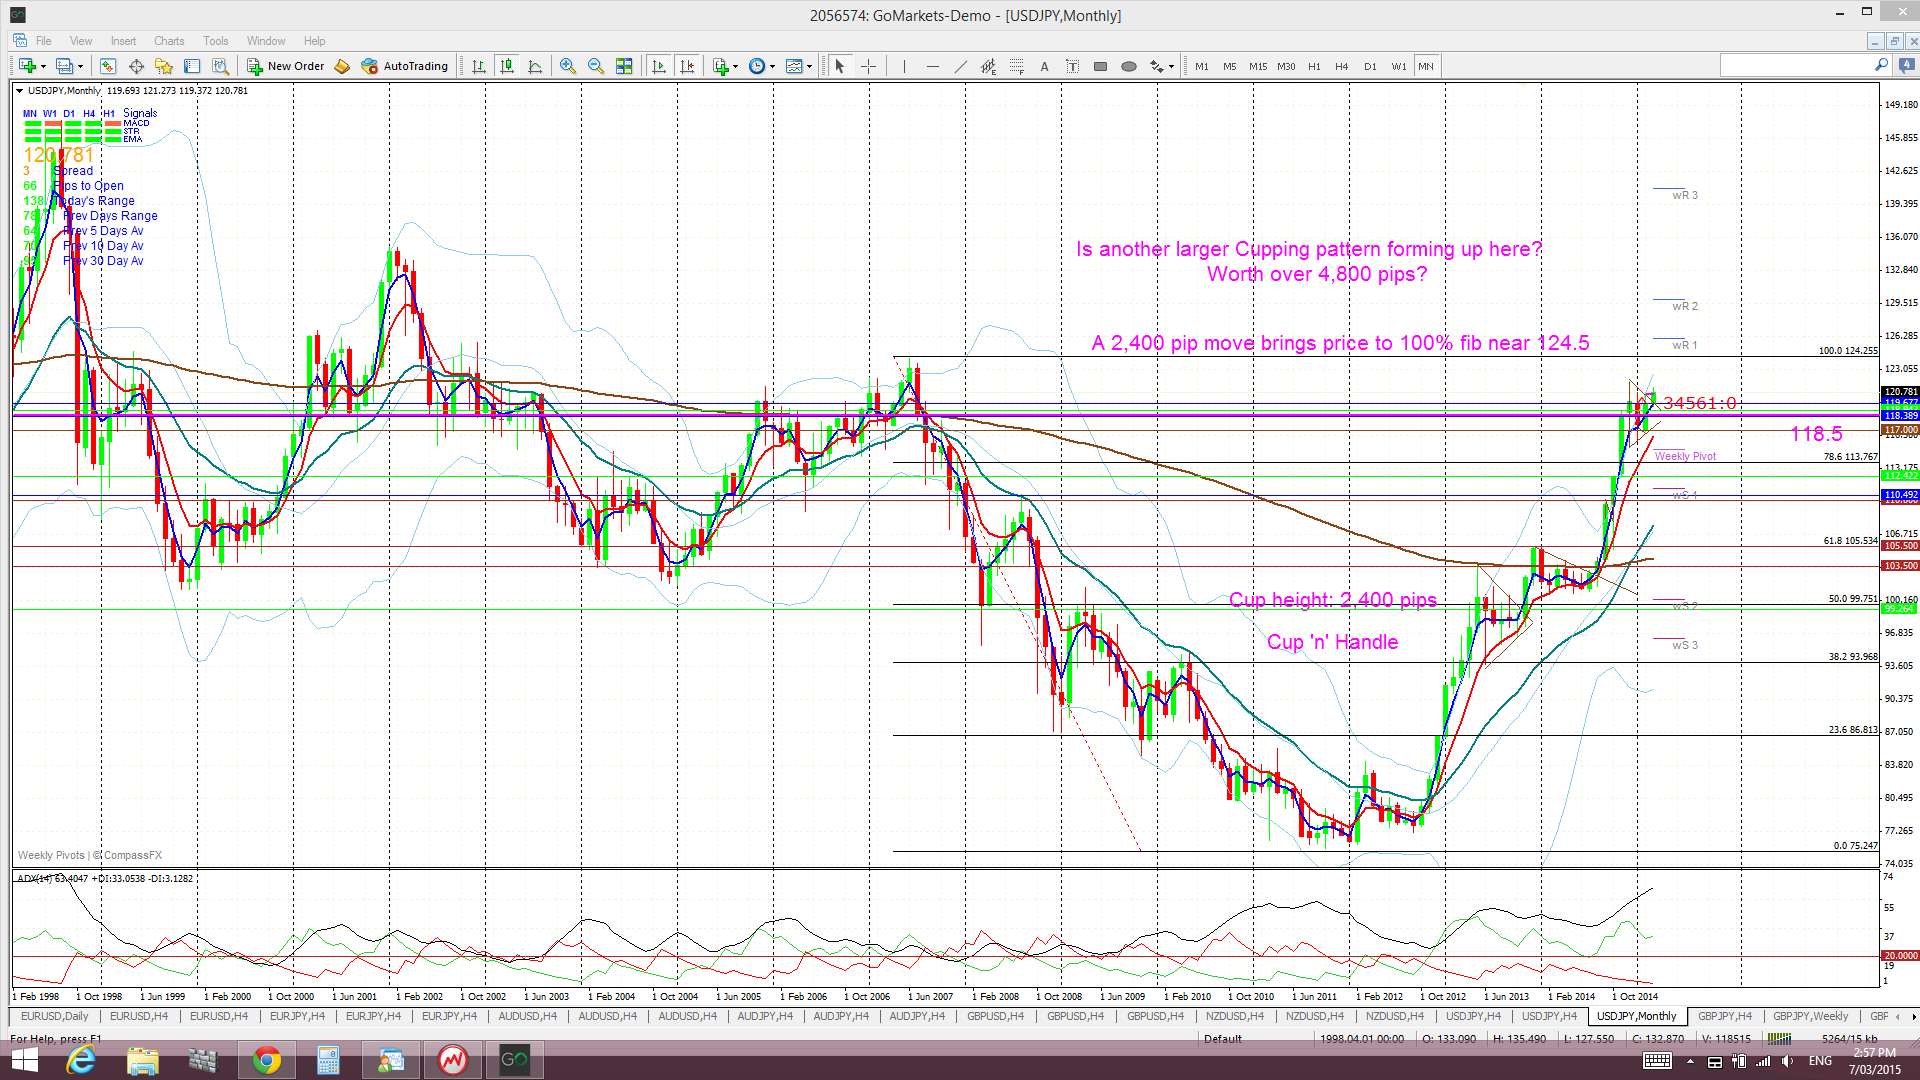
This recent triangle breakout may now complete the monthly chart’s major Cup ‘n Handle pattern. This bullish pattern has already given 2,100 pips of a possible 2,400 pips but the most interesting feature now is the next chart pattern forming up on the monthly chart. The completion of this Cup ‘n’ Handle pattern seems to supporting the formation of a larger Cup ‘n’ Handle pattern that would be worth about 4,800 pips! I wrote a separate article about this during the week and this can be found through the following link.
Price is still trading above the Cloud on the 4hr, daily, weekly and monthly charts which is bullish. November 2013 was the first monthly candle close above the Ichimoku Cloud since mid-2007 and the bullish hold above the monthly Cloud continues to be noteworthy.
The weekly candle closed as another bullish candle and has broken up and out of the recent triangle pattern and above a recent ‘Double Top’ at 120.50.
Weekly Chart Bullish Cup’ n’ Handle pattern: The theory behind these patterns is that the height of the ‘Cup’ pattern is equivalent to the expected bullish move from the ‘handle’ breakout. The height of the Cup for the U/J weekly chart is around 2,400 pips. The interesting point here is that a 2,400 pip bullish move up from the ‘Handle’ would put price up near the 124 level. This level is the last major swing high for the U/J from back in 2007 and represents the 100% fib pullback for the move down in 2007 to the lows of 2012. This pattern has given up to 2,100 pips of the 2,400 pip target! Watch for another, larger Cup ‘n Handle forming up on the monthly chart worth a possible 4,800 pips though!
- There is an open TC signal on this pair.
USD/CAD: The USD/CAD continued consolidating sideways within a 4hr chart wedge, as it had done for the last five weeks, until Friday. Weaker CAD data and stellar NFP data combined to lift this pair and trigger a wedge breakout and a new TC signal.
Price continues holding above the monthly 200 EMA however and it is worth remembering that the last bullish monthly candle close above this level was back in February 2009, almost 6 years ago. This recent period also marks the longest bullish hold by the USD/CAD above the monthly Cloud since 2002! Note the possible bullish Cup ‘n’ Handle forming up on the monthly chart that is in addition to the bullish triangle breakout already in play:
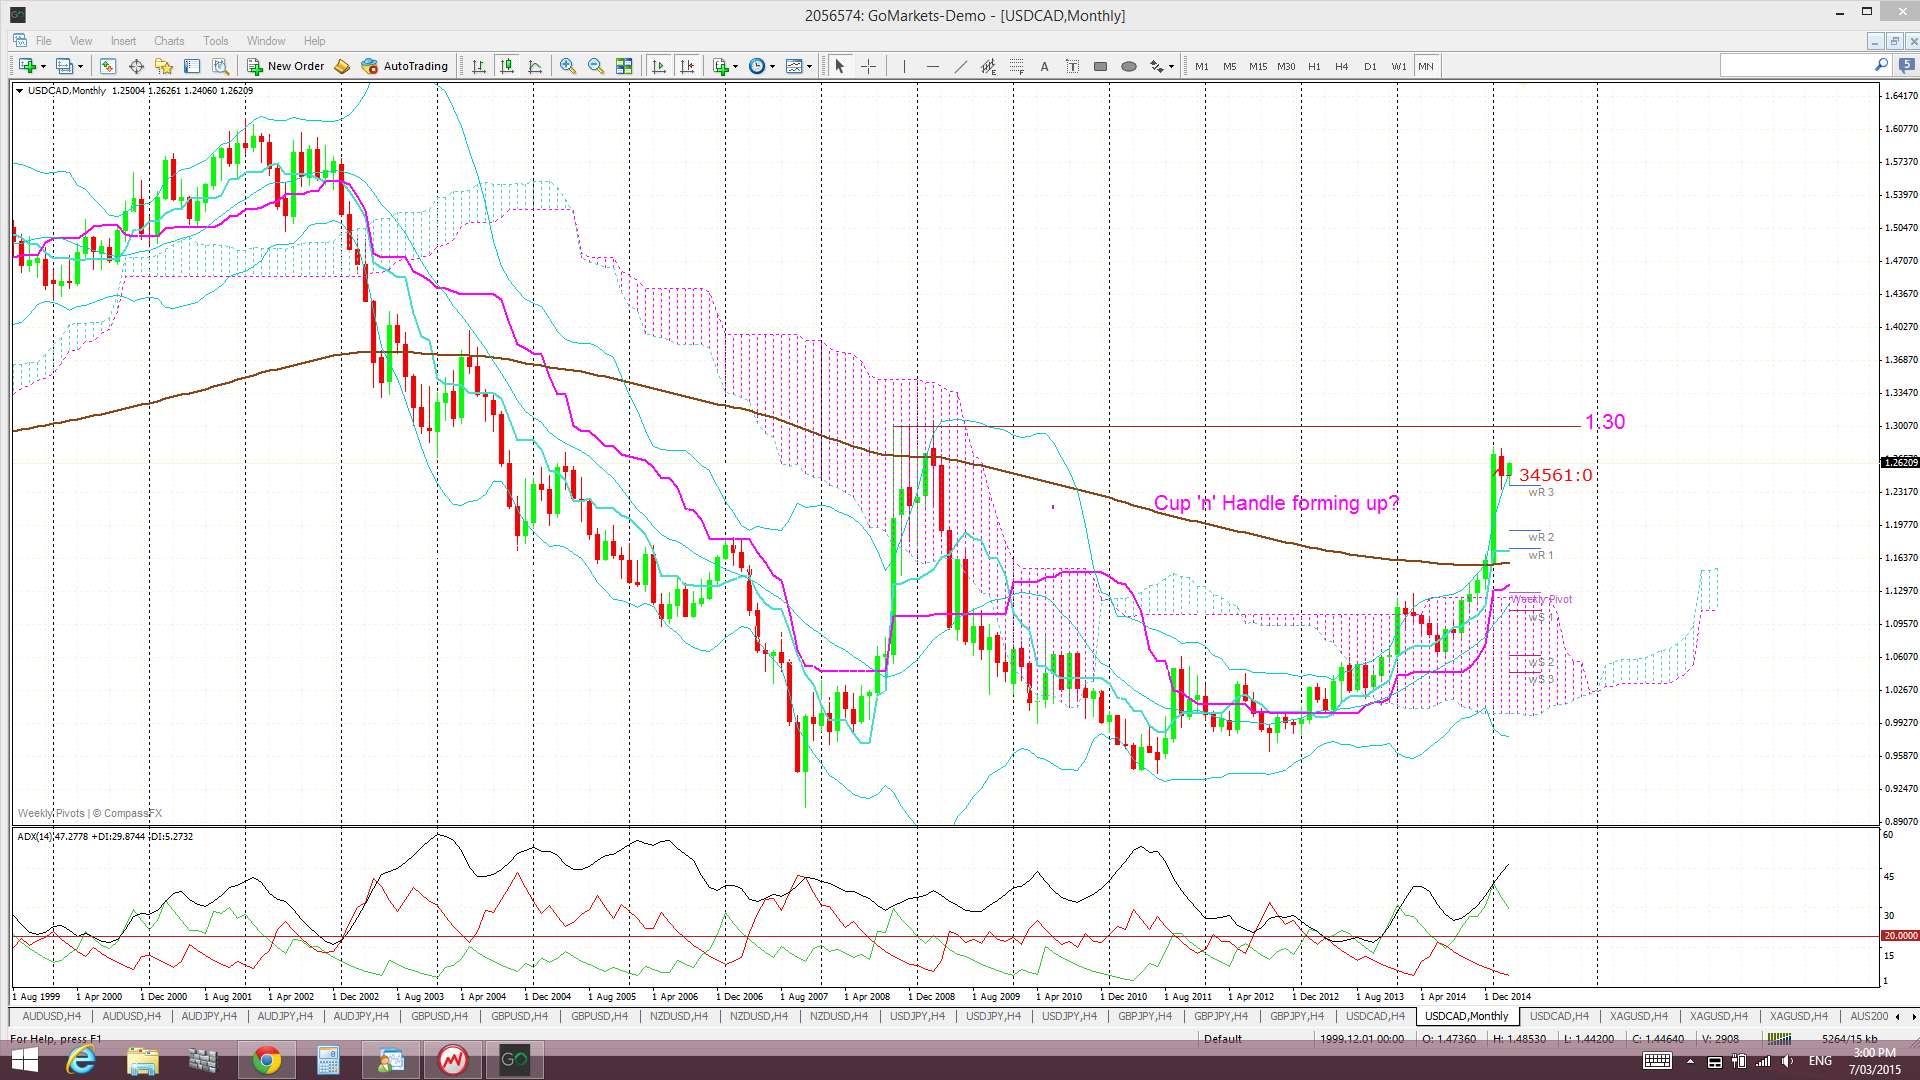
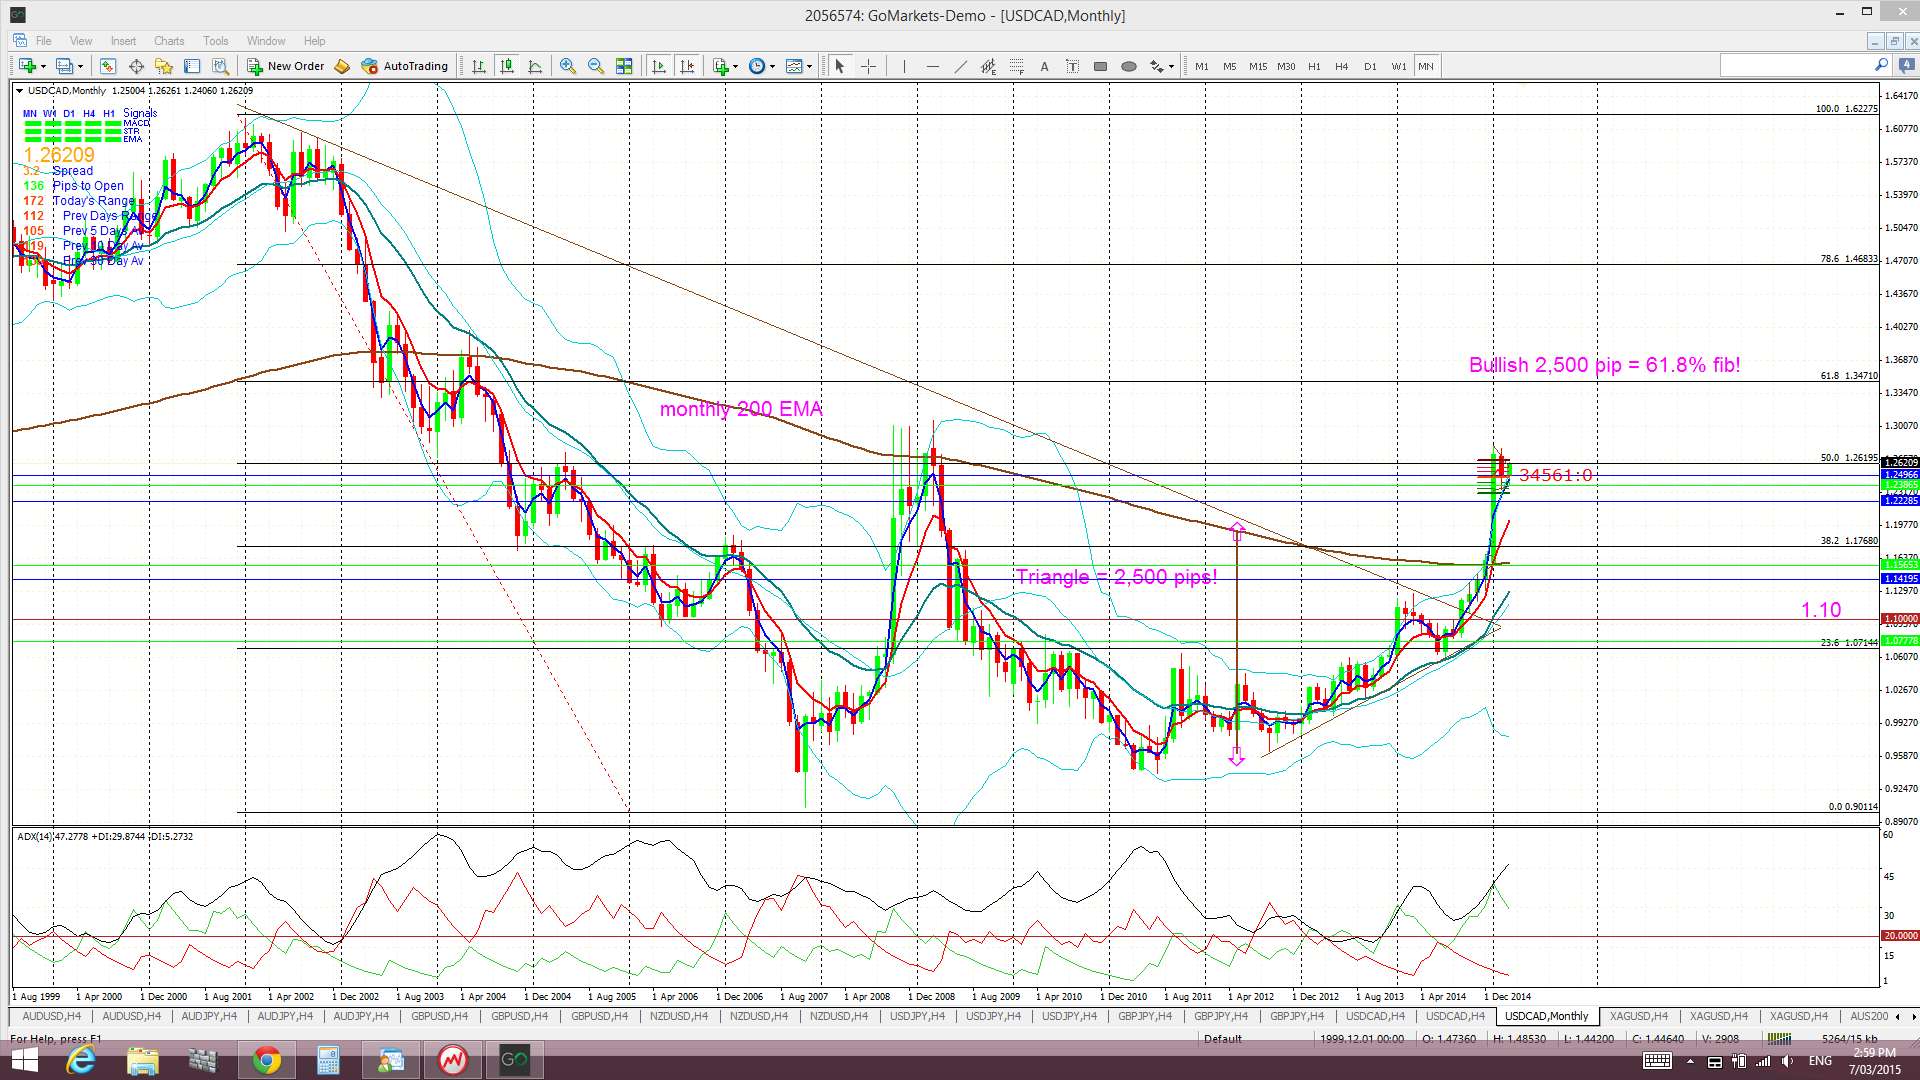
Triangle breakout target: The Loonie has already broken up and out from a major monthly chart triangle pattern that could deliver up to 2,500 pips. This 2,500 pip figure is evaluated from the height of the triangle. I have used the triangle height from the beginning of the bull trend line, as shown in the monthly chart below. The height of the triangle is around 2,500 pips and, thus, this would be the expected move from any breakout action. Extrapolating a bullish move from this triangle places price up at the 61.8% fib level. These fibs levels are popular targets in retracement moves and so this adds some confluence to this as a possible target. The bullish move has given up to 1,600 pips so far.
Monthly Chart Cup ‘n’ Handle? The monthly chart now also shows a possible bullish Cup ‘n’ Handle pattern forming up. Price may yet rally up to the $130 level before beginning any choppiness and ‘Handle’ formation but the recent choppy action could also be helping to form a ‘Handle’. This is worth keeping an eye on as the pattern would be worth about 3,000 pips if it was to evolve. The interesting point is that the target for this pattern would put price up at the previous high reached back in 2002 and this is also equal to a 100% Fib retracement of the 2002-2007 bear move. Confluence at work!
Price is now trading above the Cloud on the 4hr, daily, weekly and monthly charts which is a bullish shift.
The weekly candle closed as a bullish, almost ‘engulfing’ candle.
- There is a new TC signal on this pair.
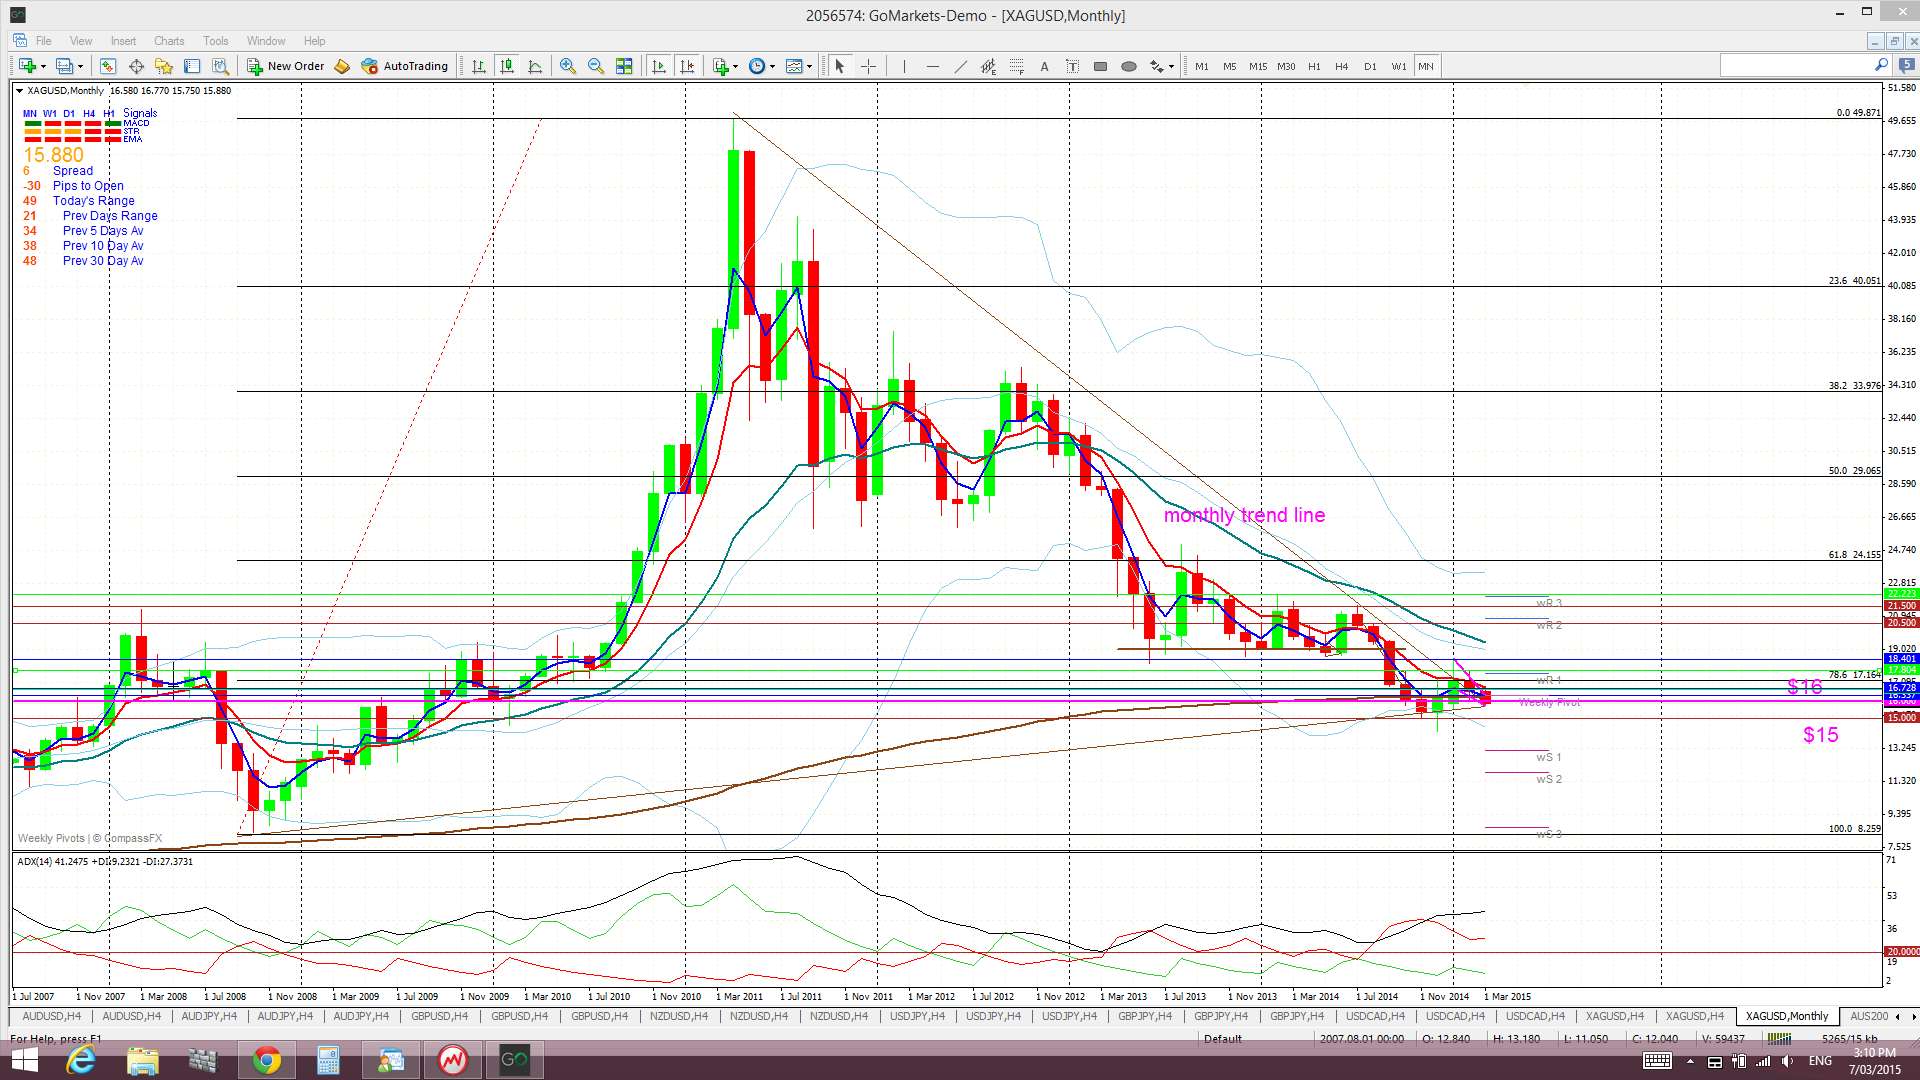
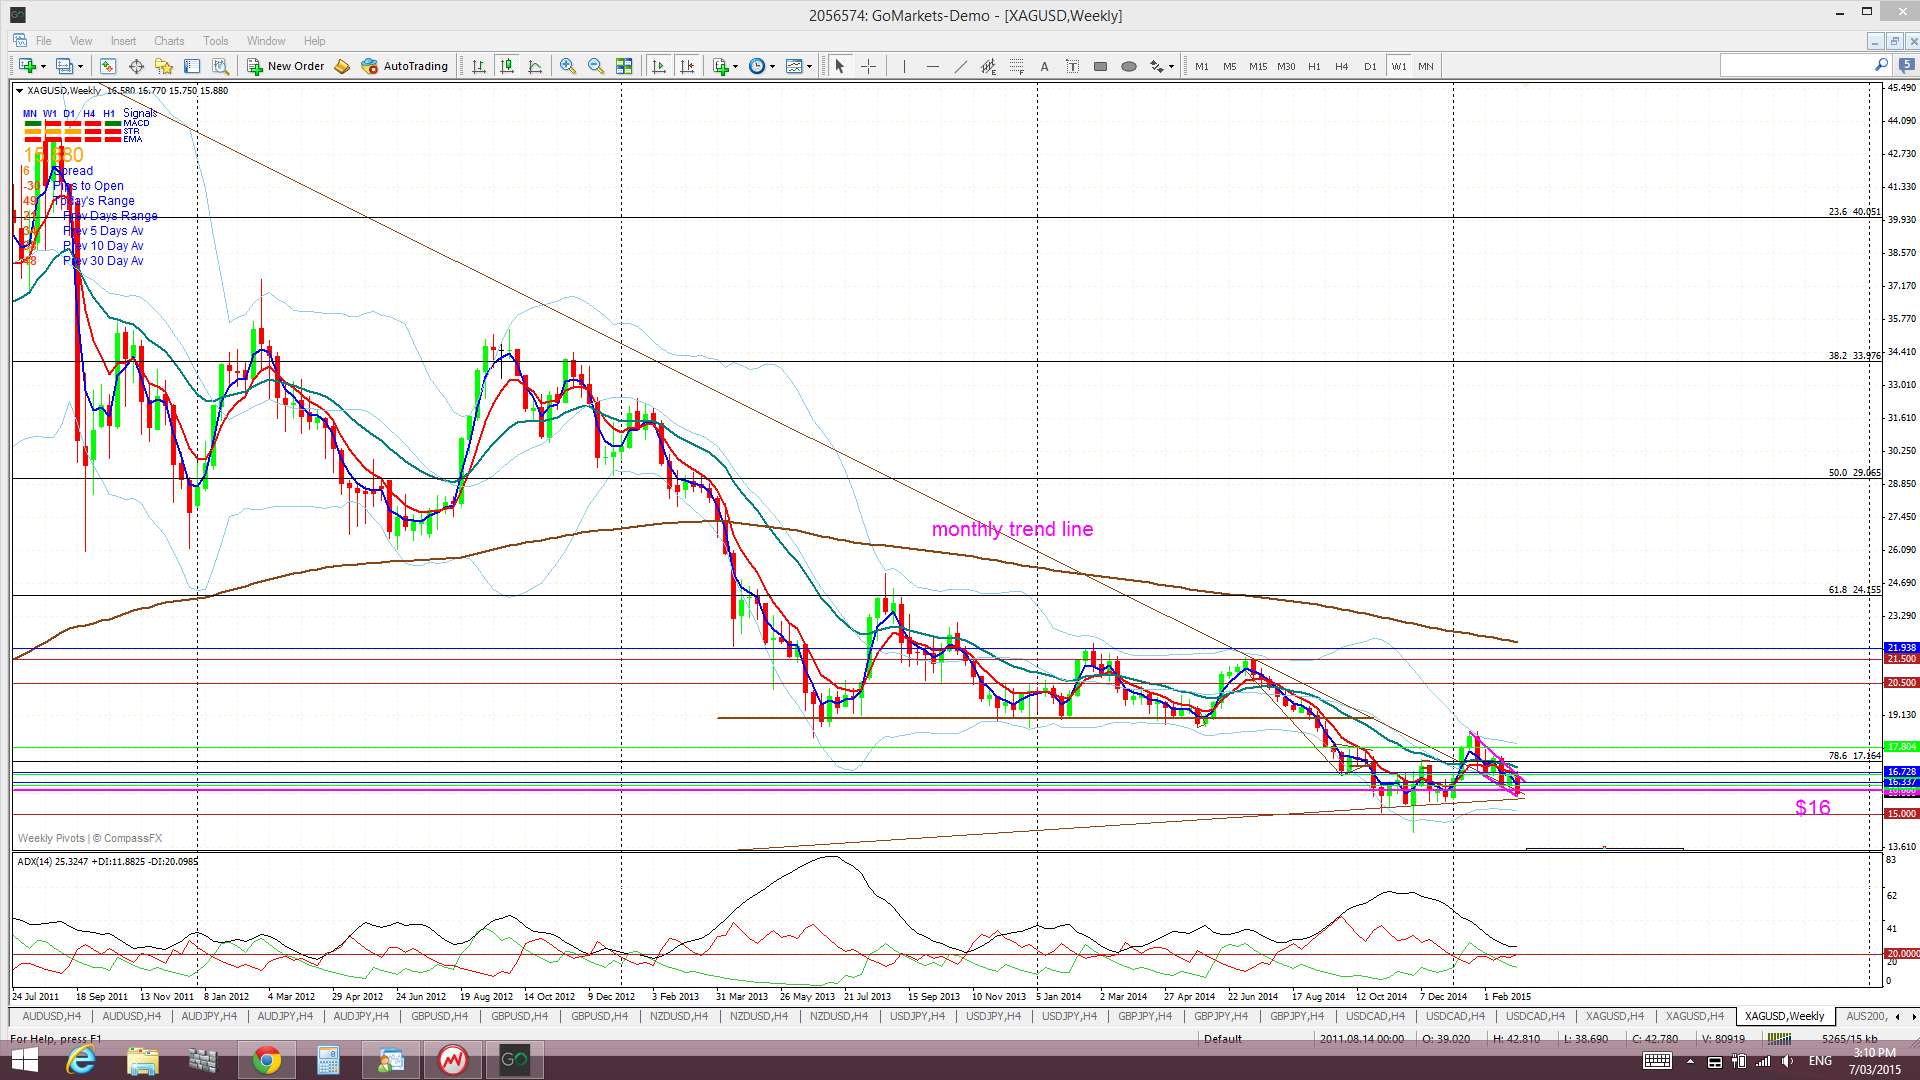
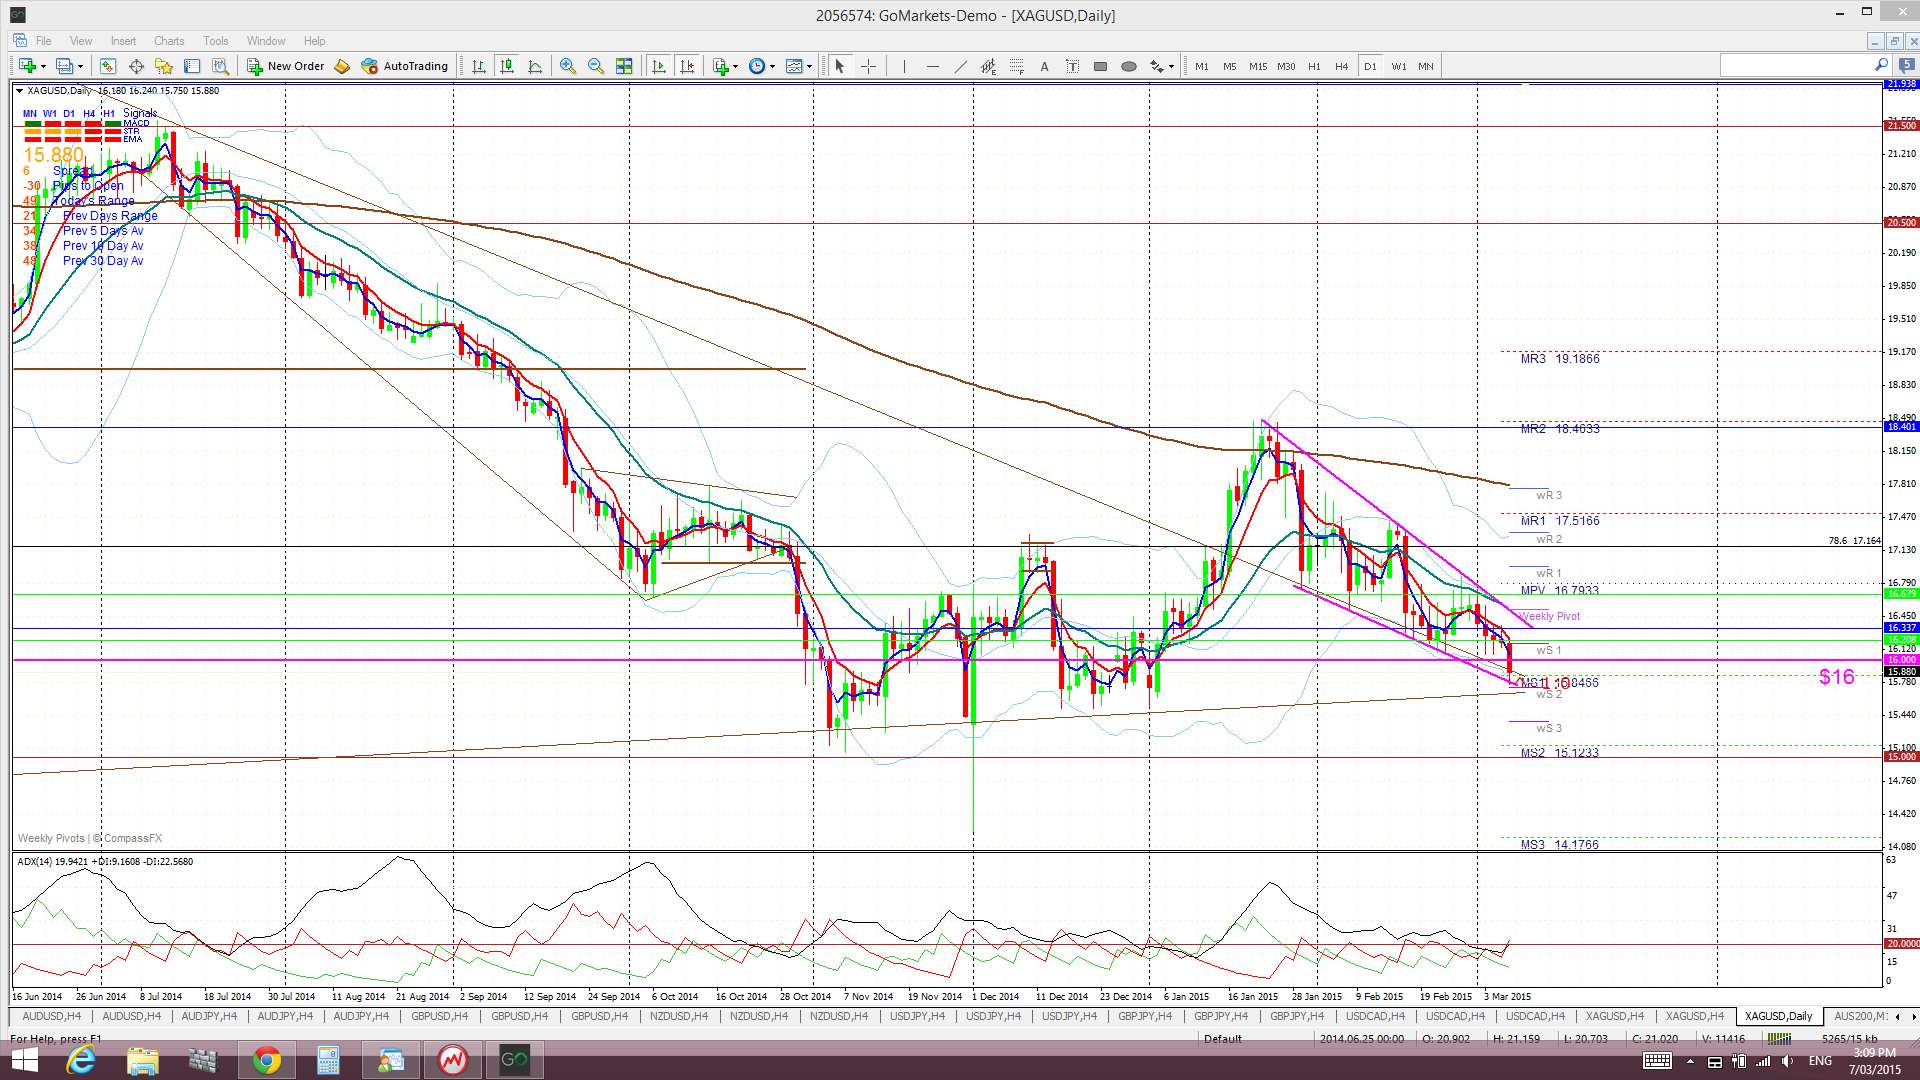
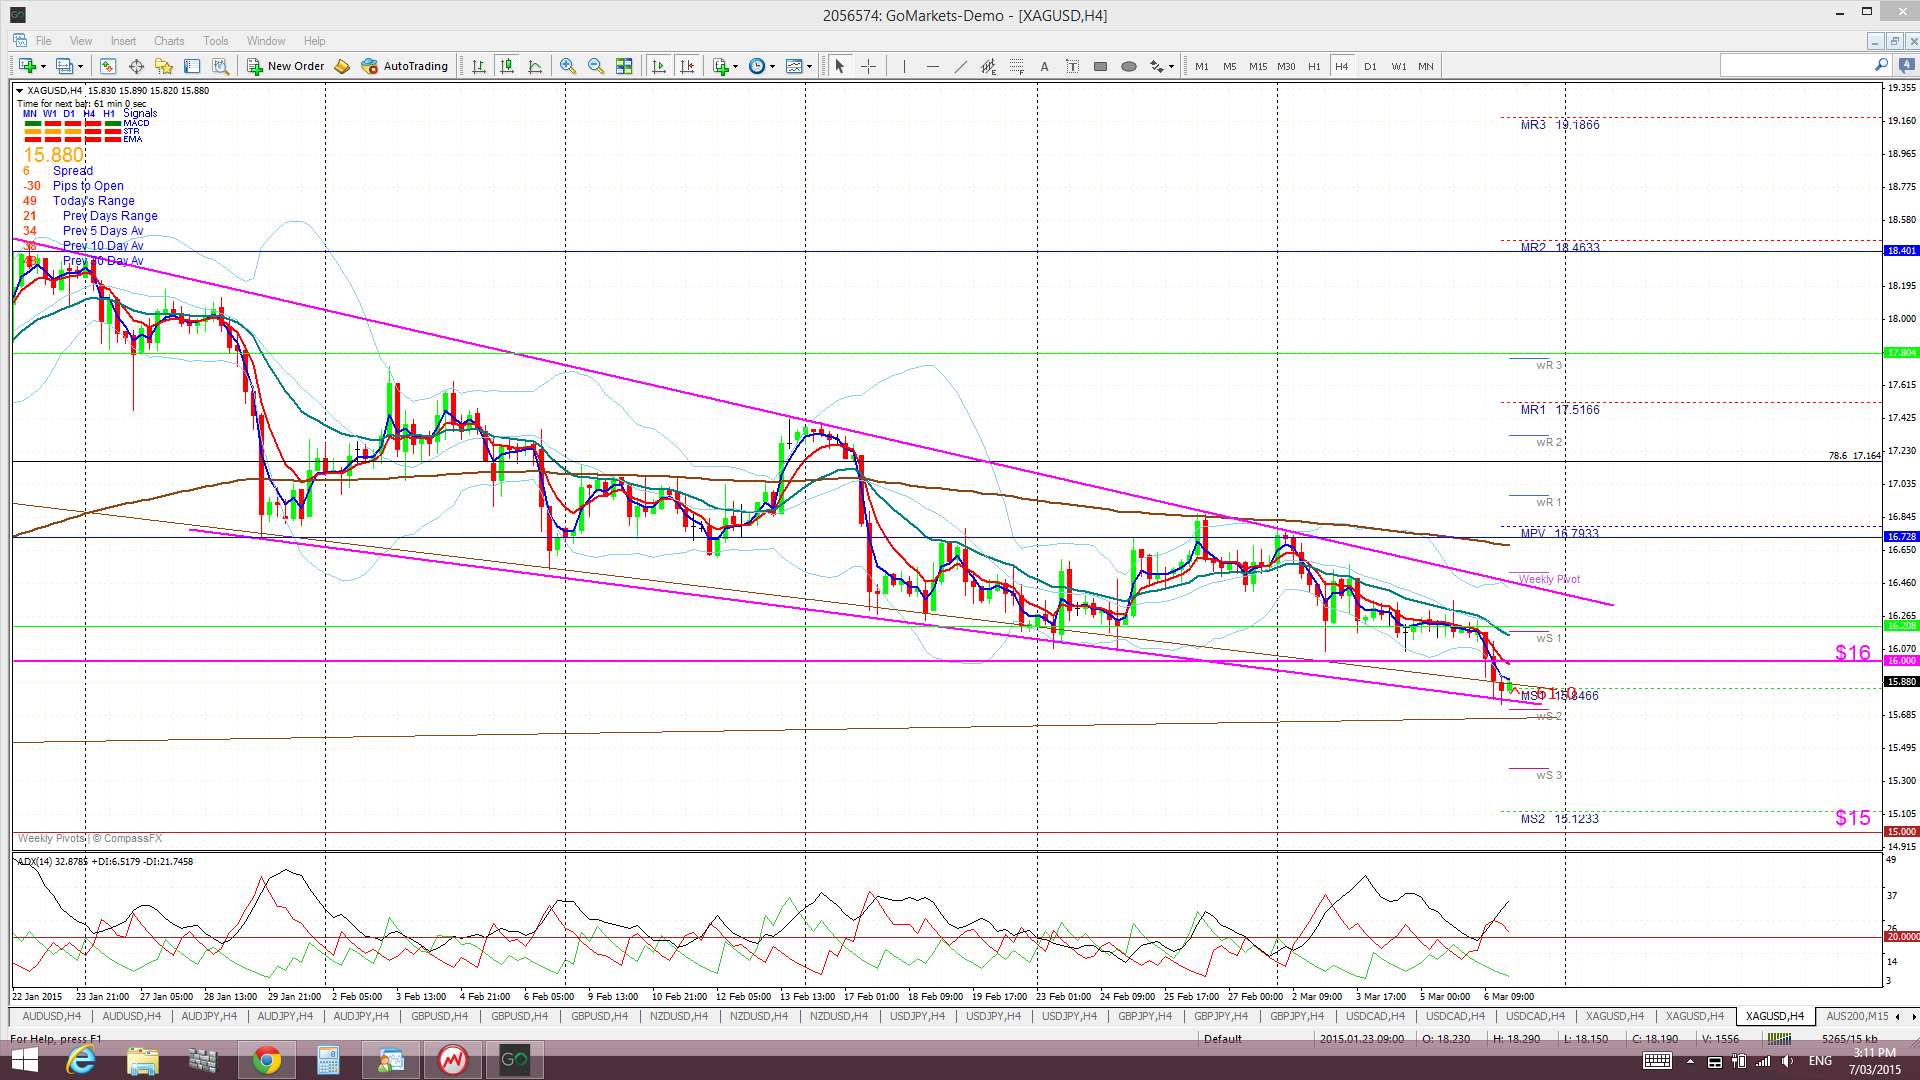
Silver: Silver chopped lower last week but continued to receive support from the descending wedge trend line, the monthly bear trend line that was broken a few weeks ago and the $16 level. That was….. until Friday!
The stellar NFP data sent the USD higher and this put pressure on both Silver and Gold. The $16 support level has given way but the recent wedge trend line has yet to buckle. Any break of this would add further confidence to SHORT traders here though and the previous S/R level of $15 would be an obvious first target.
Any break and hold below $15 would be very bearish and suggest a trip down to the 100% Fib level near $8 but the $10 level would, no doubt, offer some psychological support as well.
Silver is now trading below the Ichimoku Cloud on the 4hr, daily weekly and monthly charts which is a bearish shift.
The weekly candle closed as a bearish, almost ‘engulfing’ candle.
- I’m watching for any new TC signal, the descending wedge and monthly triangle trend lines and the $16/$15 levels.
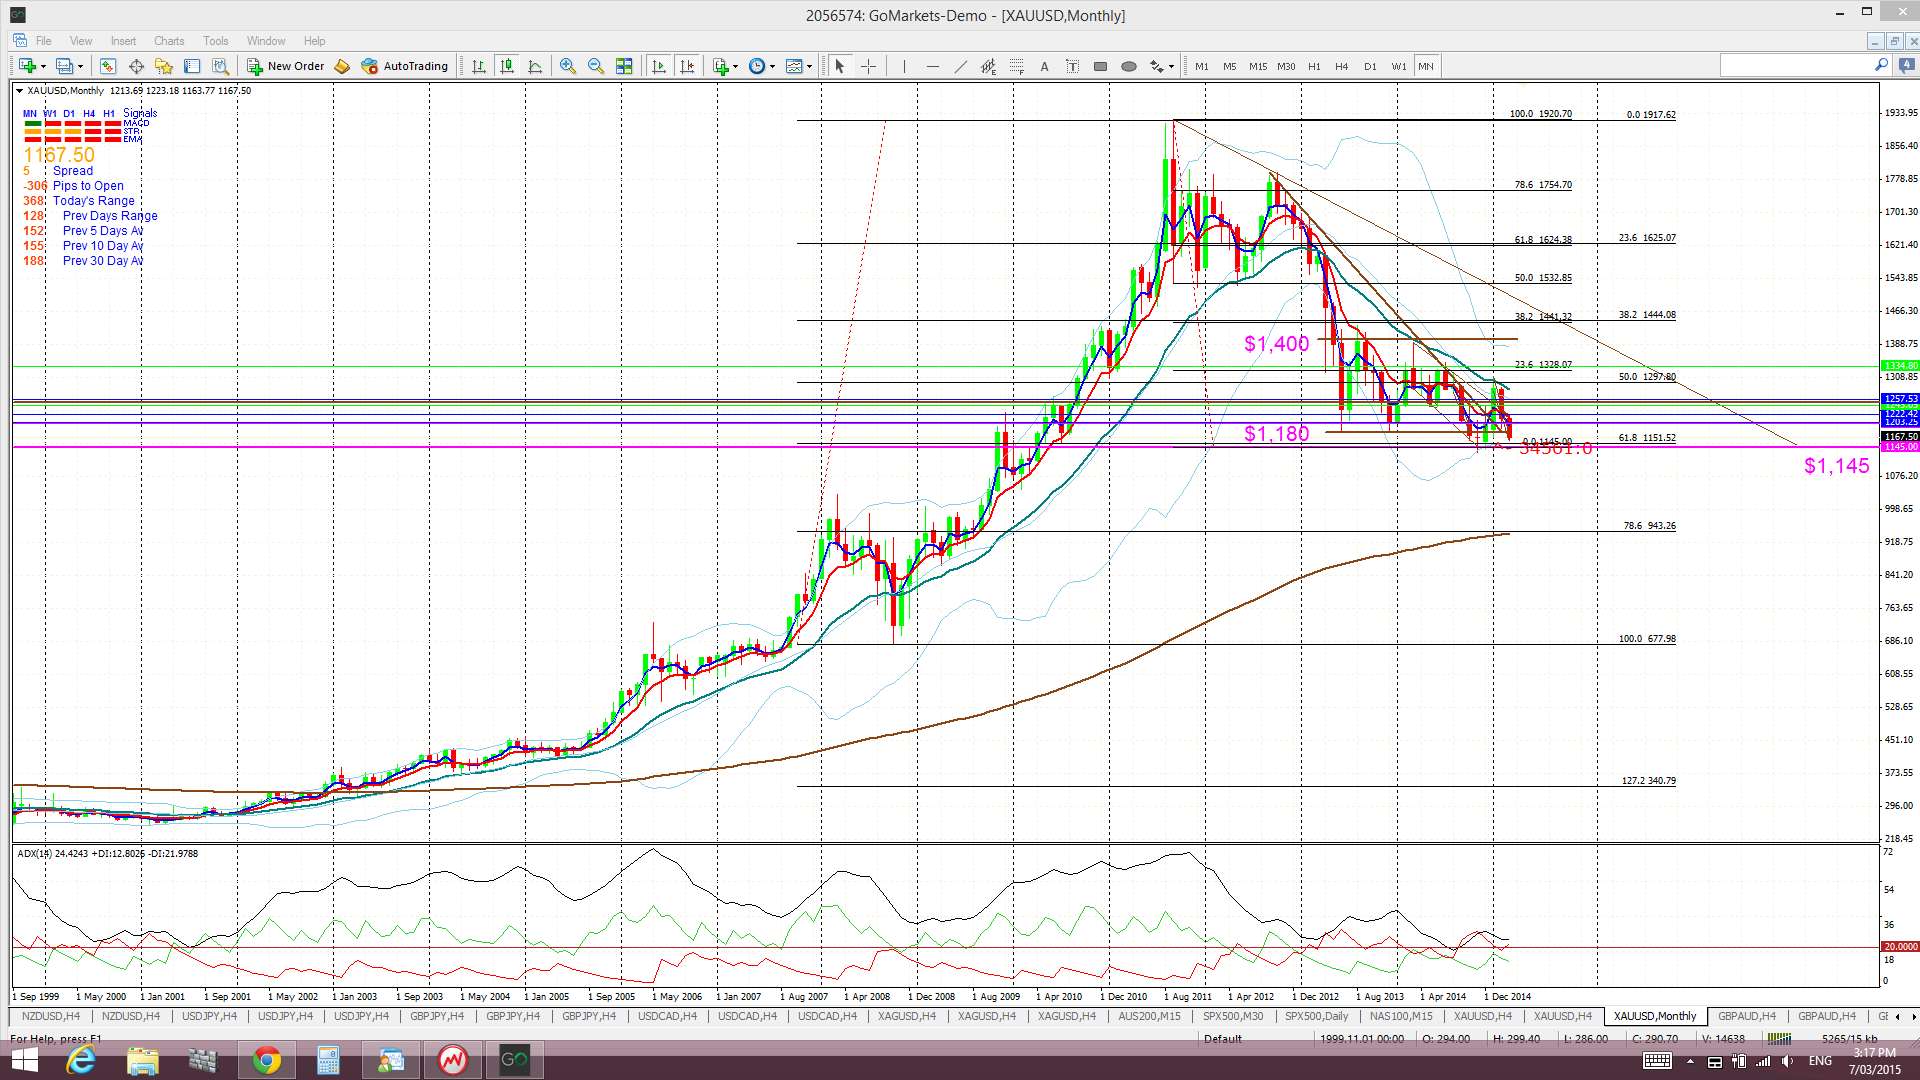
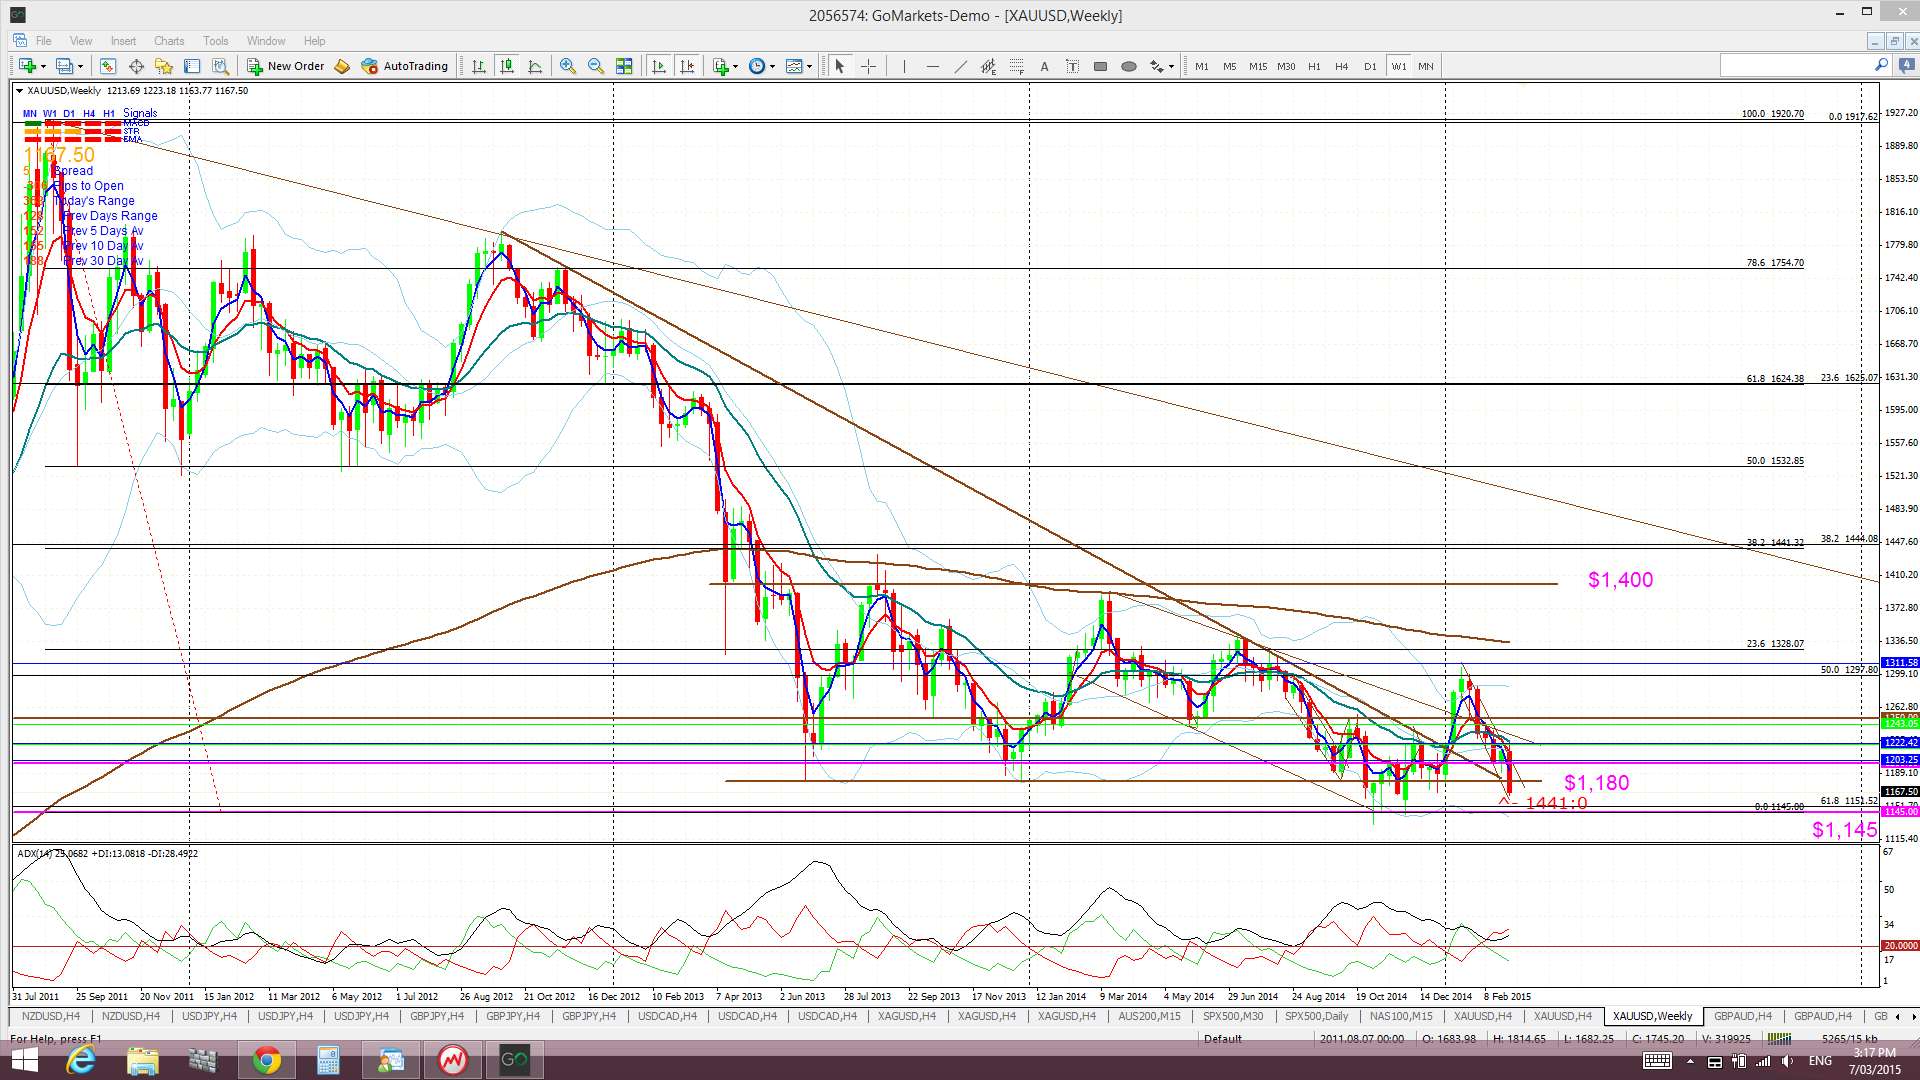
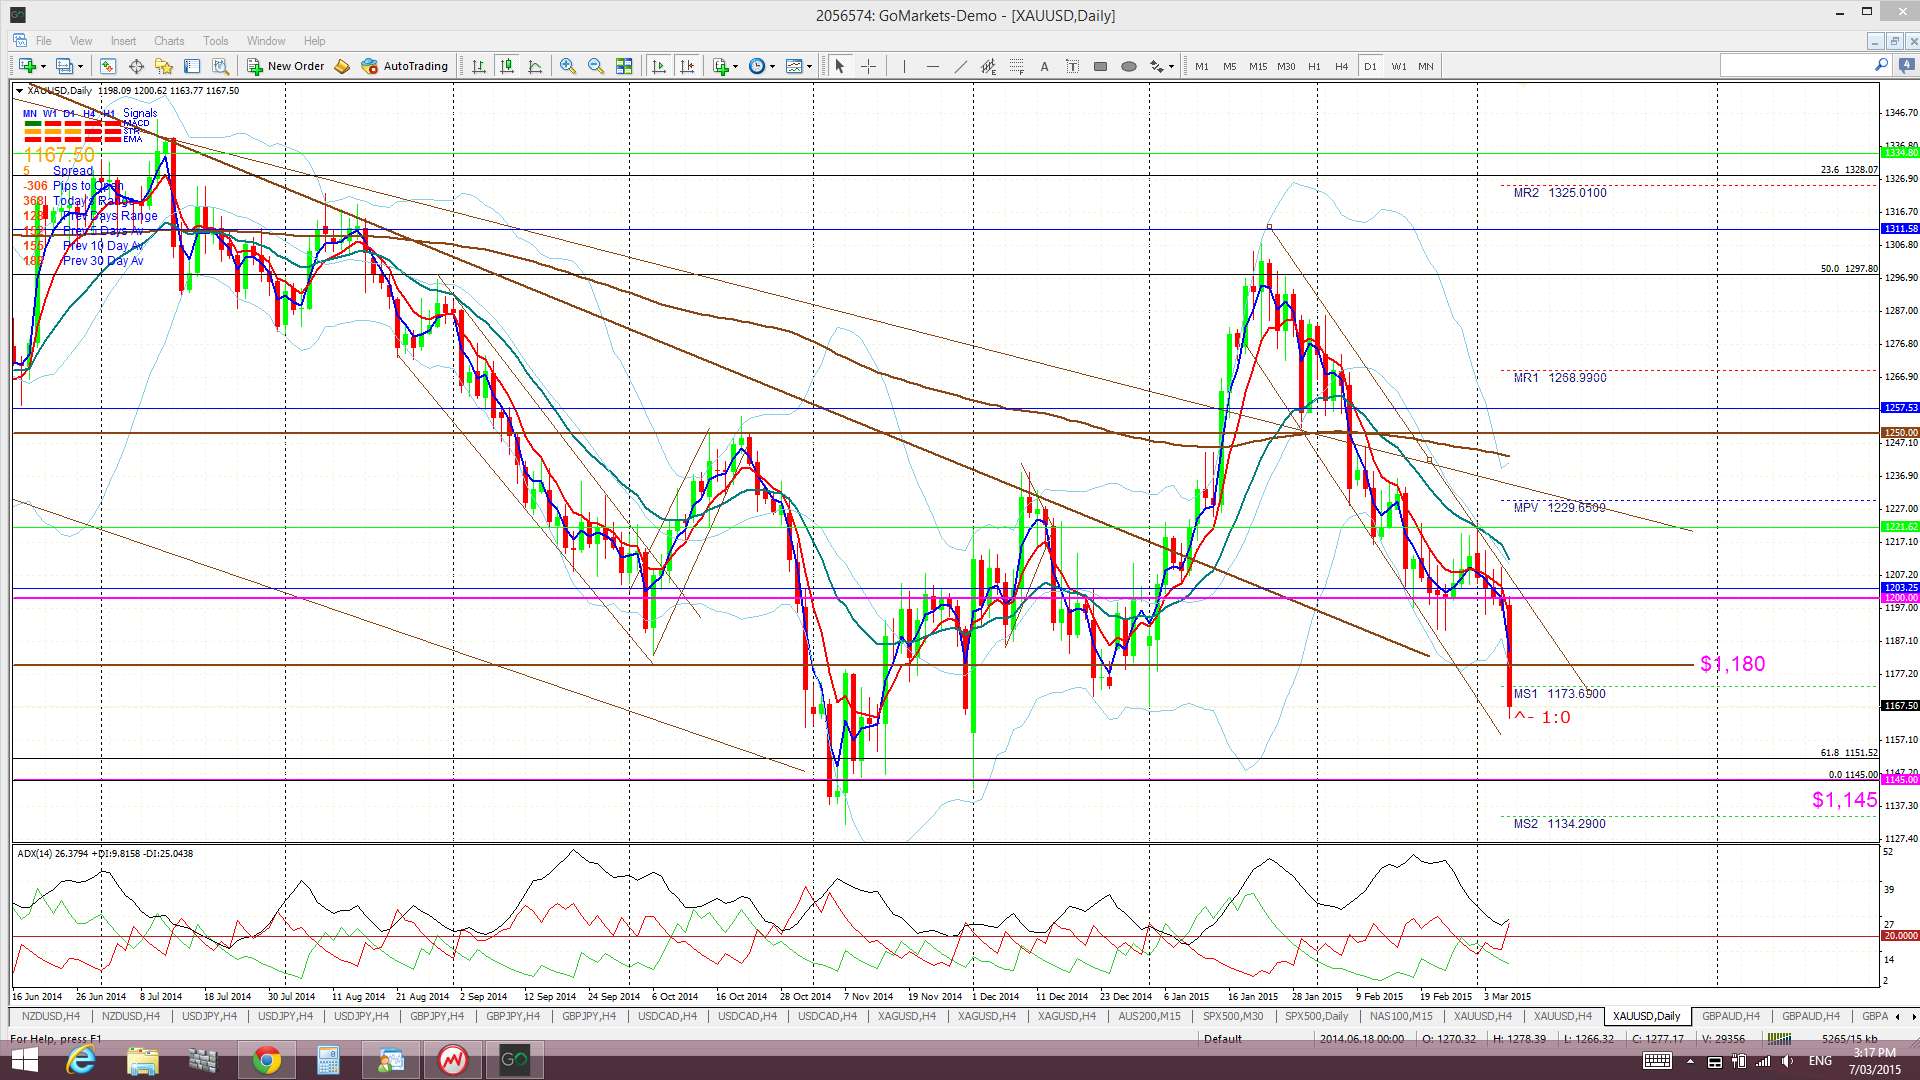
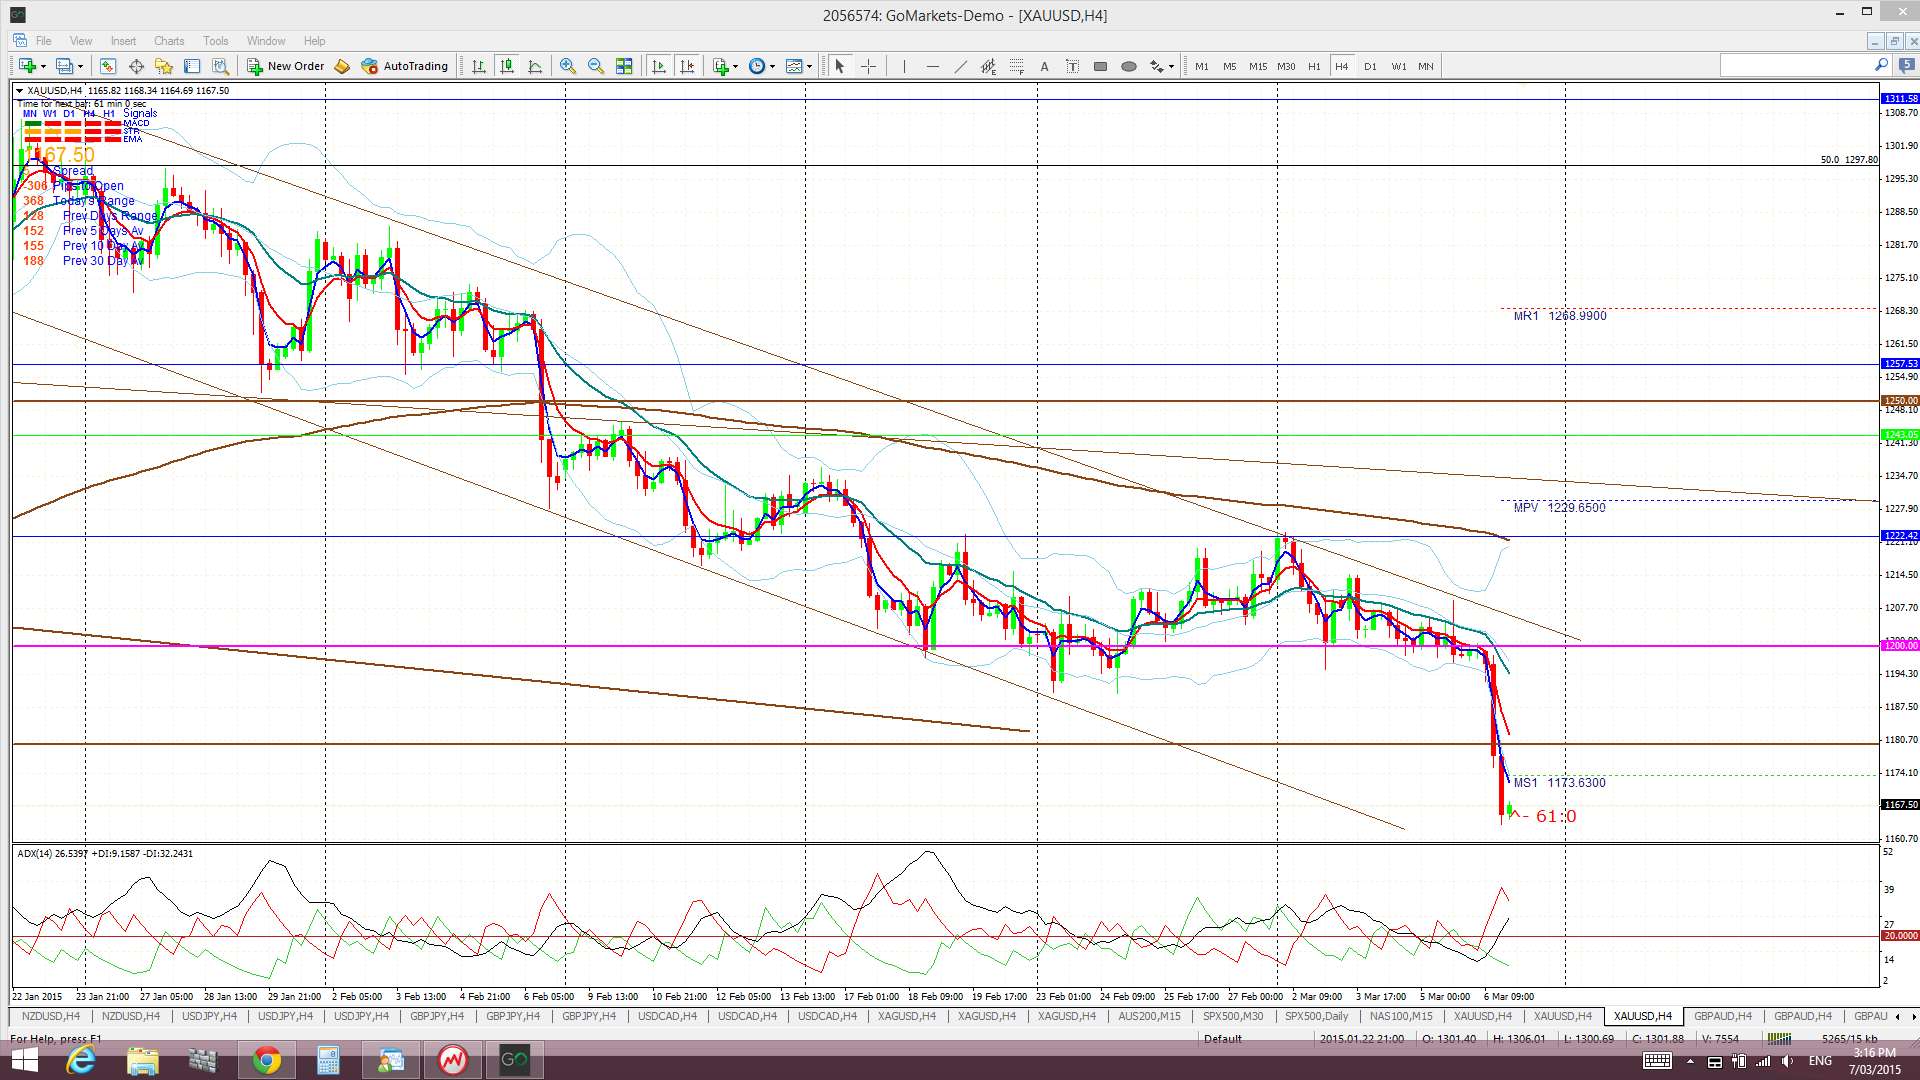
Gold: Gold chopped a bit lower last week but, as with Silver, had managed to hold above support until Friday’s NFP. This support was from the psychological $1,200 level but this gave way as the US$ surged after the payrolls data. The 30 min chart gives a clear idea about what Gold thought of the NFP result!
As with Silver, a recent trend line from a trading channel has yet to be broken BUT any breakdown here may support a new, longer term SHORT trade.
The break of $1,200 and $1,180 support brings a major support level back into focus. The $1,145 level is just below current price now and is a major S/R level as it is the 61.8% fib of the 2008-2011 bull run. Any new break and hold below $1,145 would suggest a deeper pull back. Bearish targets below $1,145 include the $1,000 psychological level and, then, the 78.6% fib near $950. This is also the region of the monthly 200 EMA for added confluence. Below that, the 100% retracement of the swing high move is down near $675 and is a previous reaction zone.
Gold is now trading below the Ichimoku Cloud on the 4hr, daily, weekly and monthly charts which is a bullish shift here too.
The weekly candle closed as a large bearish, almost ‘engulfing’ candle.
When you look at the monthly chart of the USD index you see that it has a lot of room to run higher. Similarly here, the monthly chart of Gold shows it has a lot of room to run lower.
- I’m watching for any new TC signal and the $1,145 level.
The post USD rally & Interest rate fear spooks US stocks & impacts FX. appeared first on www.forextell.com.