Last week: It was a choppy week for my trend trading TC system brought about in part because the FX indices remained triangle-bound until Thursday night. There were a few TC signals but most of them struggled: A/U= -25, A/J= -20 and Kiwi = -40. The USD then rallied on Thursday and broke up and out of a Bull Flag pattern although it still has to negotiate a potential bearish Double Top. Three TC signals triggered after this USD breakout are experiencing mixed journeys as well: E/U= flat for now, E/J= down 25 and U/J= up about 20 pips. I am actually expecting this choppiness to continue until the USDX breaks out of the 95.50 / 92.50 channel.
The USD and EUR indices have both broken out of triangle patterns on the 4hr / daily charts. The USDX has not avoided a potential bearish ‘Double Top’ at 95.50 though and the EURX may be approaching a bullish ‘Double Bottom’ as it nears 96. The lingering uncertainty with the FX indices has contributed to choppy trading on many currency pairs off the 4hr and higher time-frame charts. The 30 min charts during the US session have presented some decent trend trading opportunities though. A review of the FX Indices can be found through the following link.
This week:
There is a lot of high impact news this week and it started today with Chinese Manufacturing PMI. This data came out slightly better than expected but still below the expansionary 50 level. Later in the week there are Central Banks from four countries/regions reporting on interest rates, AUD, CAD, GBP and EUR, and this is followed up by the closely watched ‘Big Kahuna’ event of US NFP.
Cable: this pair might be trying to carve out a base off 1.50 but I’m on the lookout for a potential weekly chart ‘Bear Flag’ forming up here too.
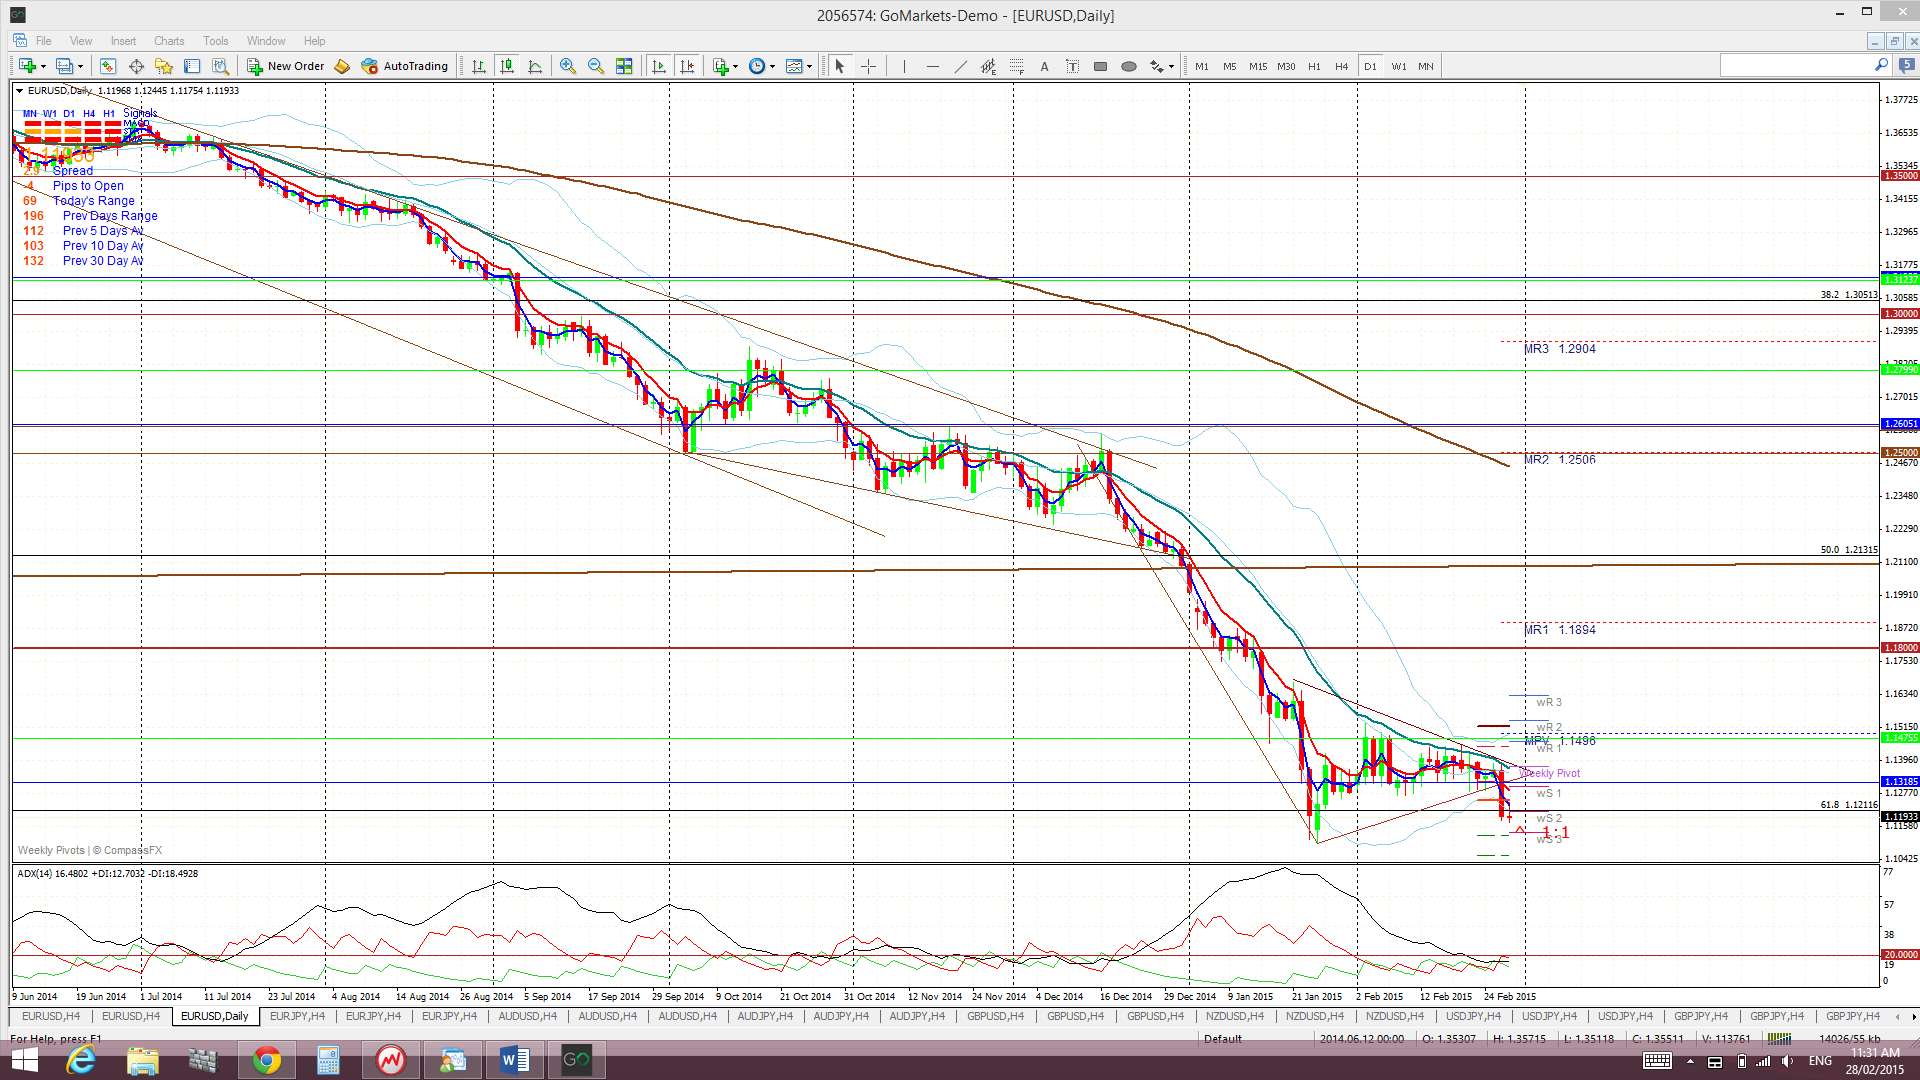
EUR/USD: the 4hr chart shows a Double Bottom region at 1.11 which may offer some support BUT a break and hold below this would suggest bearish continuation.
Friday was the last day of the trading month so watch for new monthly pivots next week.
Events in the Ukraine and the Middle East, as well as with Greek Debt talks, continue to have the potential to undermine any developing ‘risk’ appetite and need to be monitored.
Stocks and broader market sentiment:
The S&P500 and DJIA finished lower on Friday but printed their best monthly candles since 2011. They also had their best February since 1998 which is something to crow about! The NASDAQ has made a monthly close above 4,800 level thereby notching its highest ever monthly close and the ‘bellwether’ Russell 2000 has also printed its highest monthly close as well so the picture with stocks looks fairly buoyant. I published an updated post yesterday on the NASDAQ detailing about what I am expecting and the particular stocks and levels I am watching. This article can be found through the following link.
NASDAQ: a monthly close above 4,800:

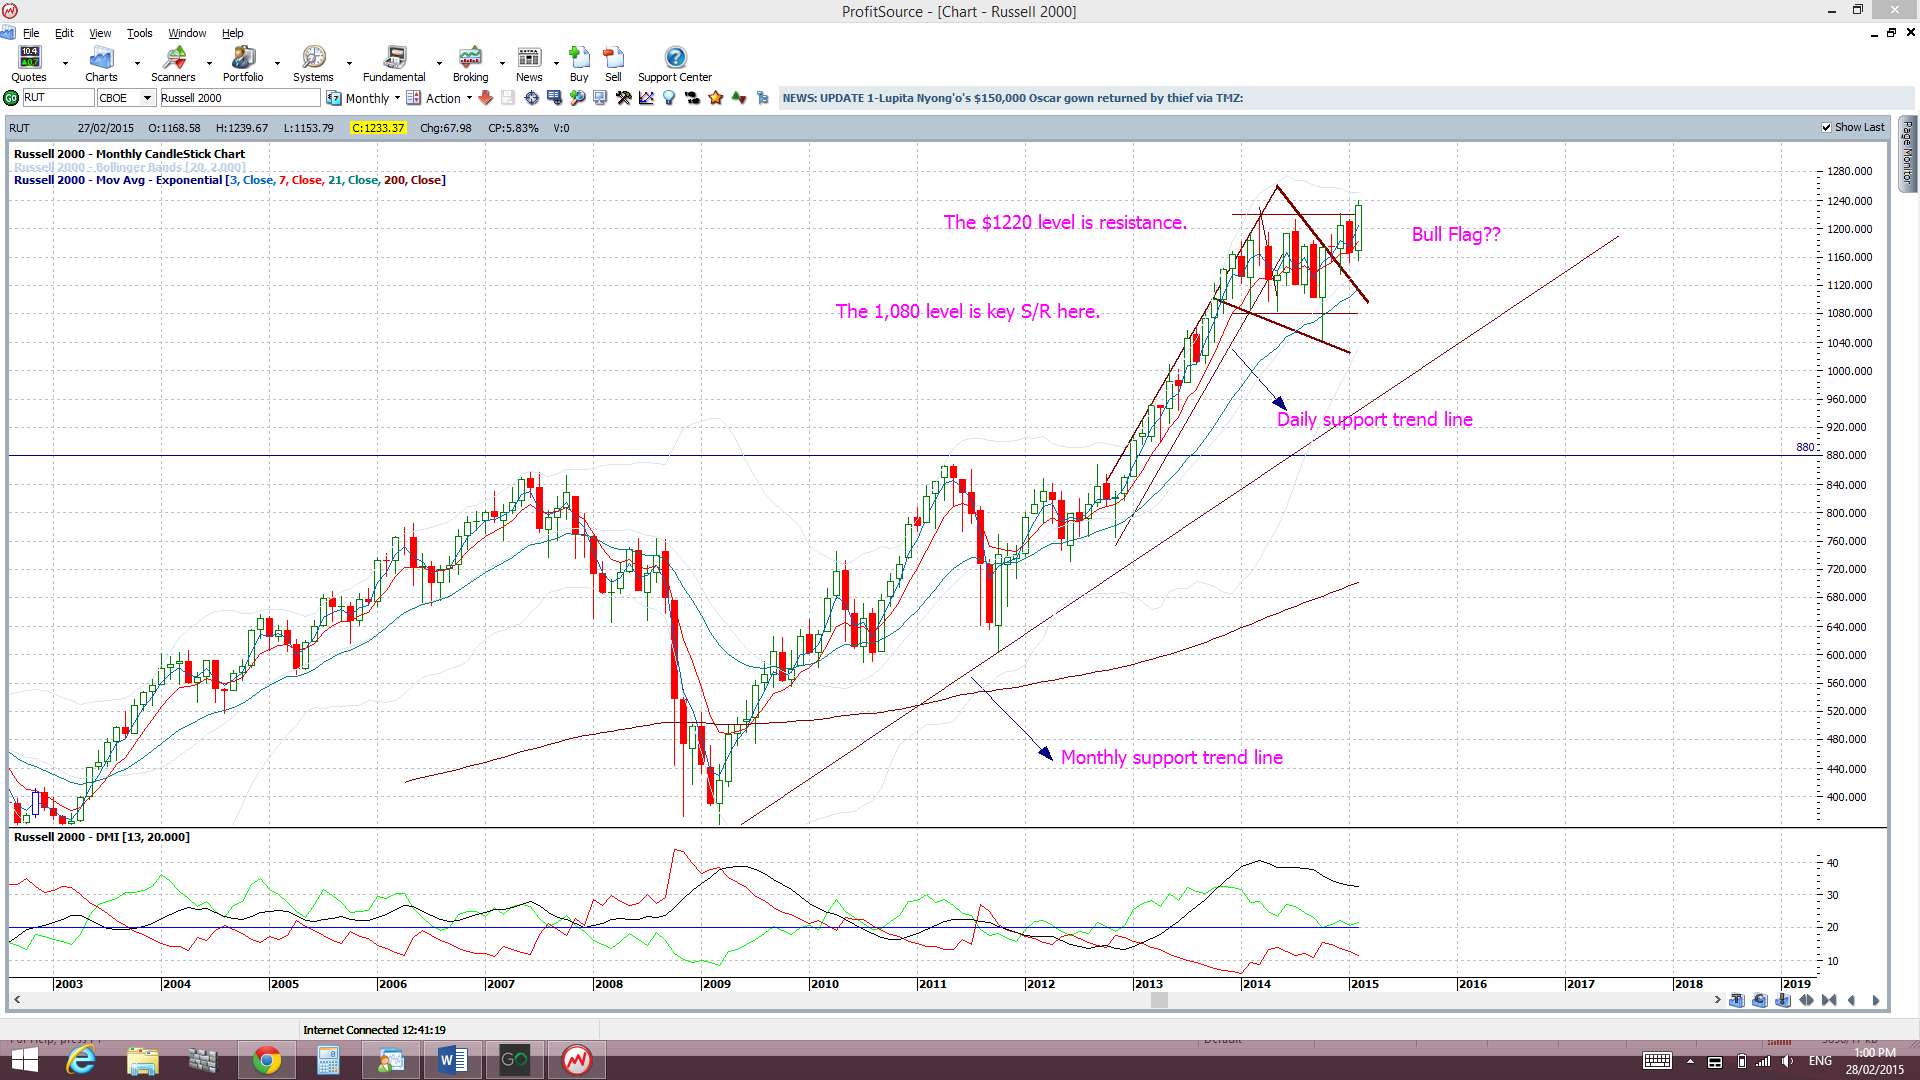
Russell 2000: a monthly close above 1,220:

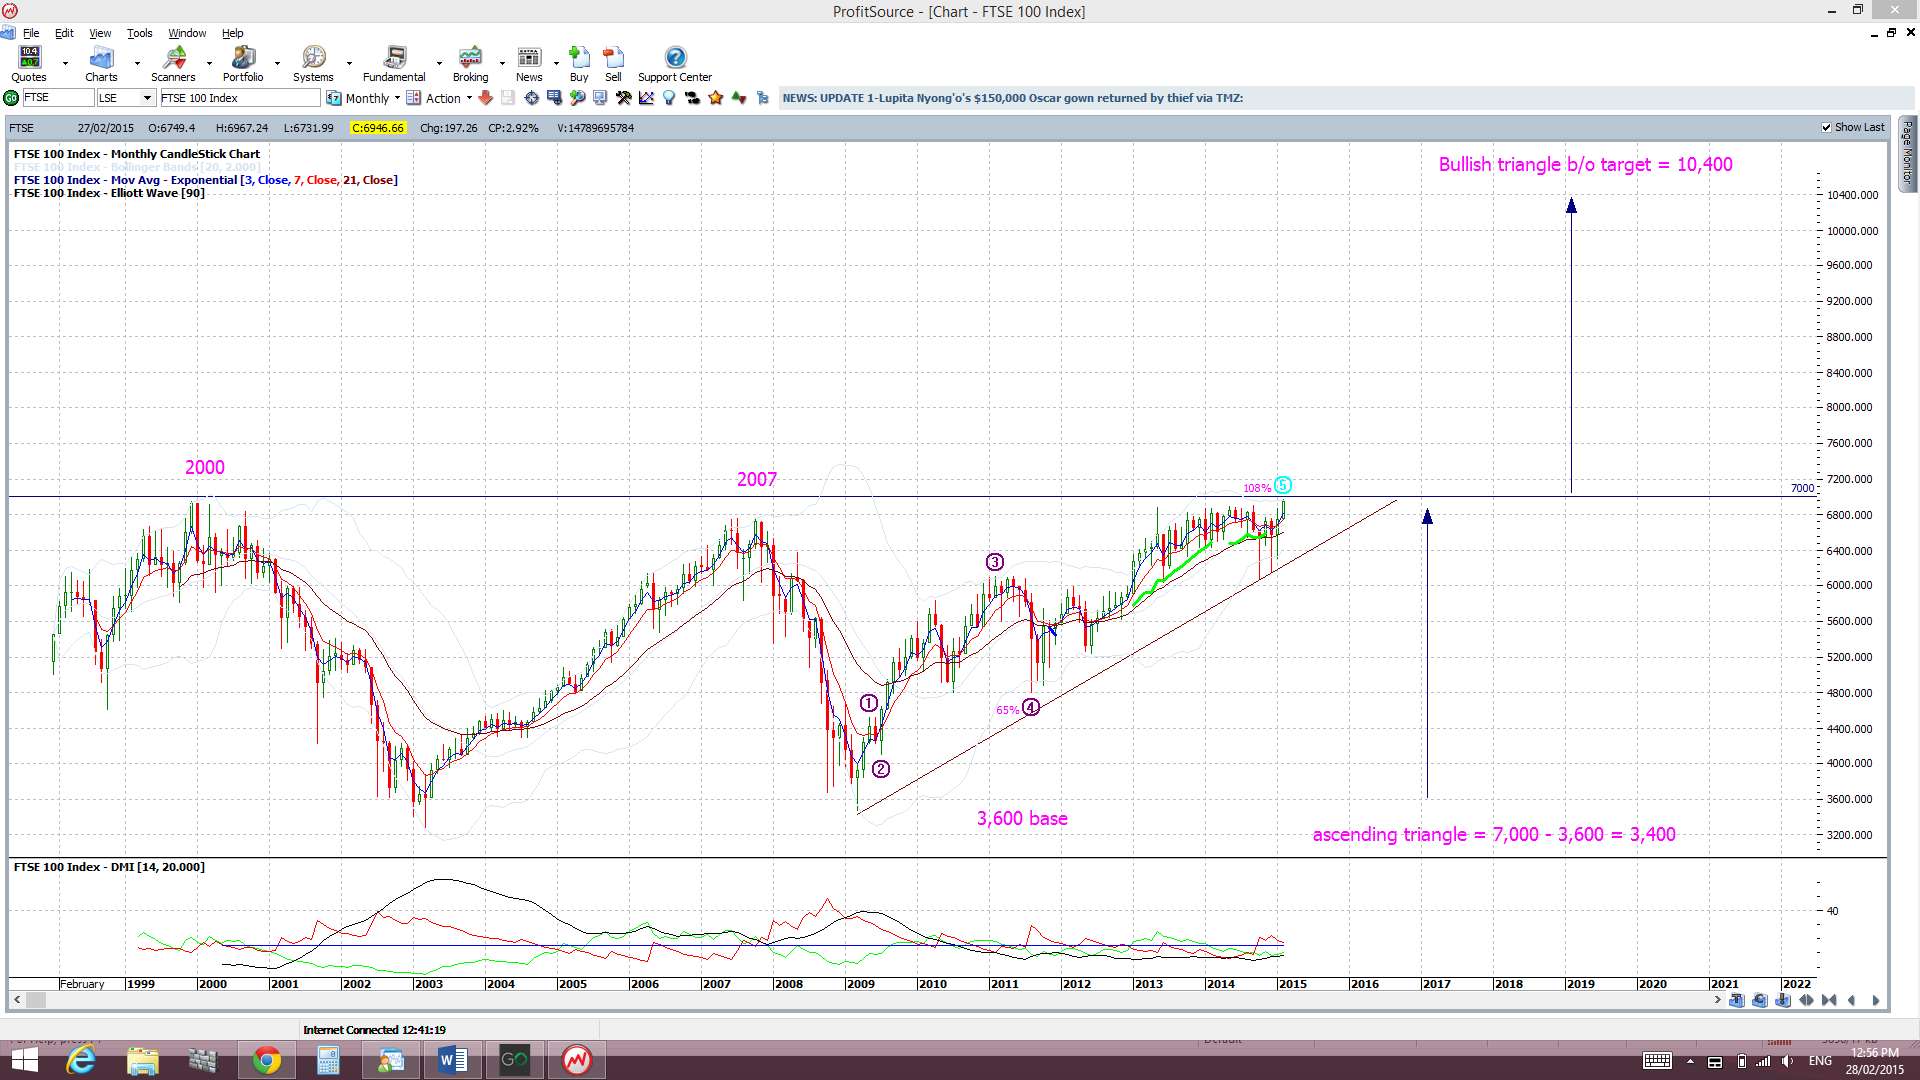
London’s FTSE-100 has rallied almost 6% this year and is looking quite menacing as it sits just under the key 7,000 breakout region.
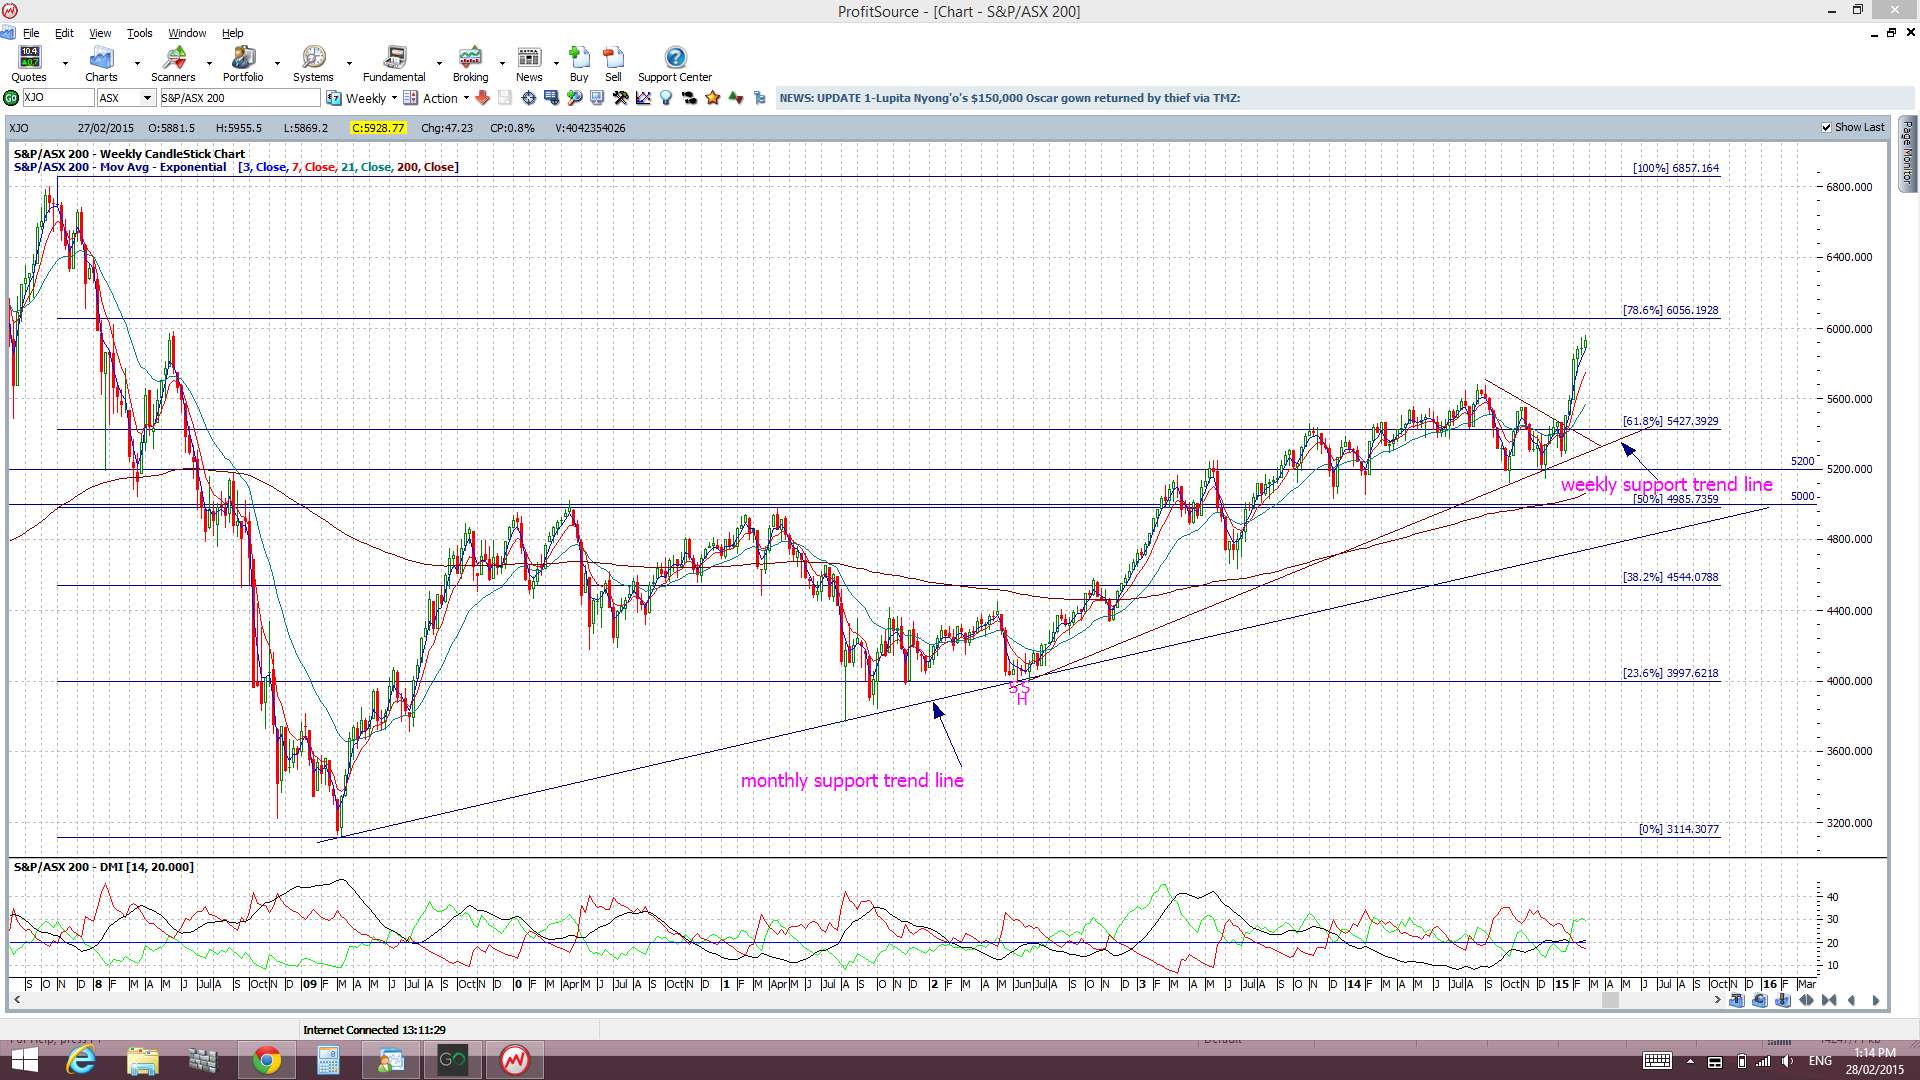
After chopping around either side of the key 61.8% fib for fifteen months, since November 2013, the ASX-200 finally made a triangle breakout in the last week of January. I noted this in my blog post on Jan 27th and this can be found through the following link. The index is still lurking just under the 78.6% fib near 6,000 and any continuation after that should see it head to test the 7,000 region.
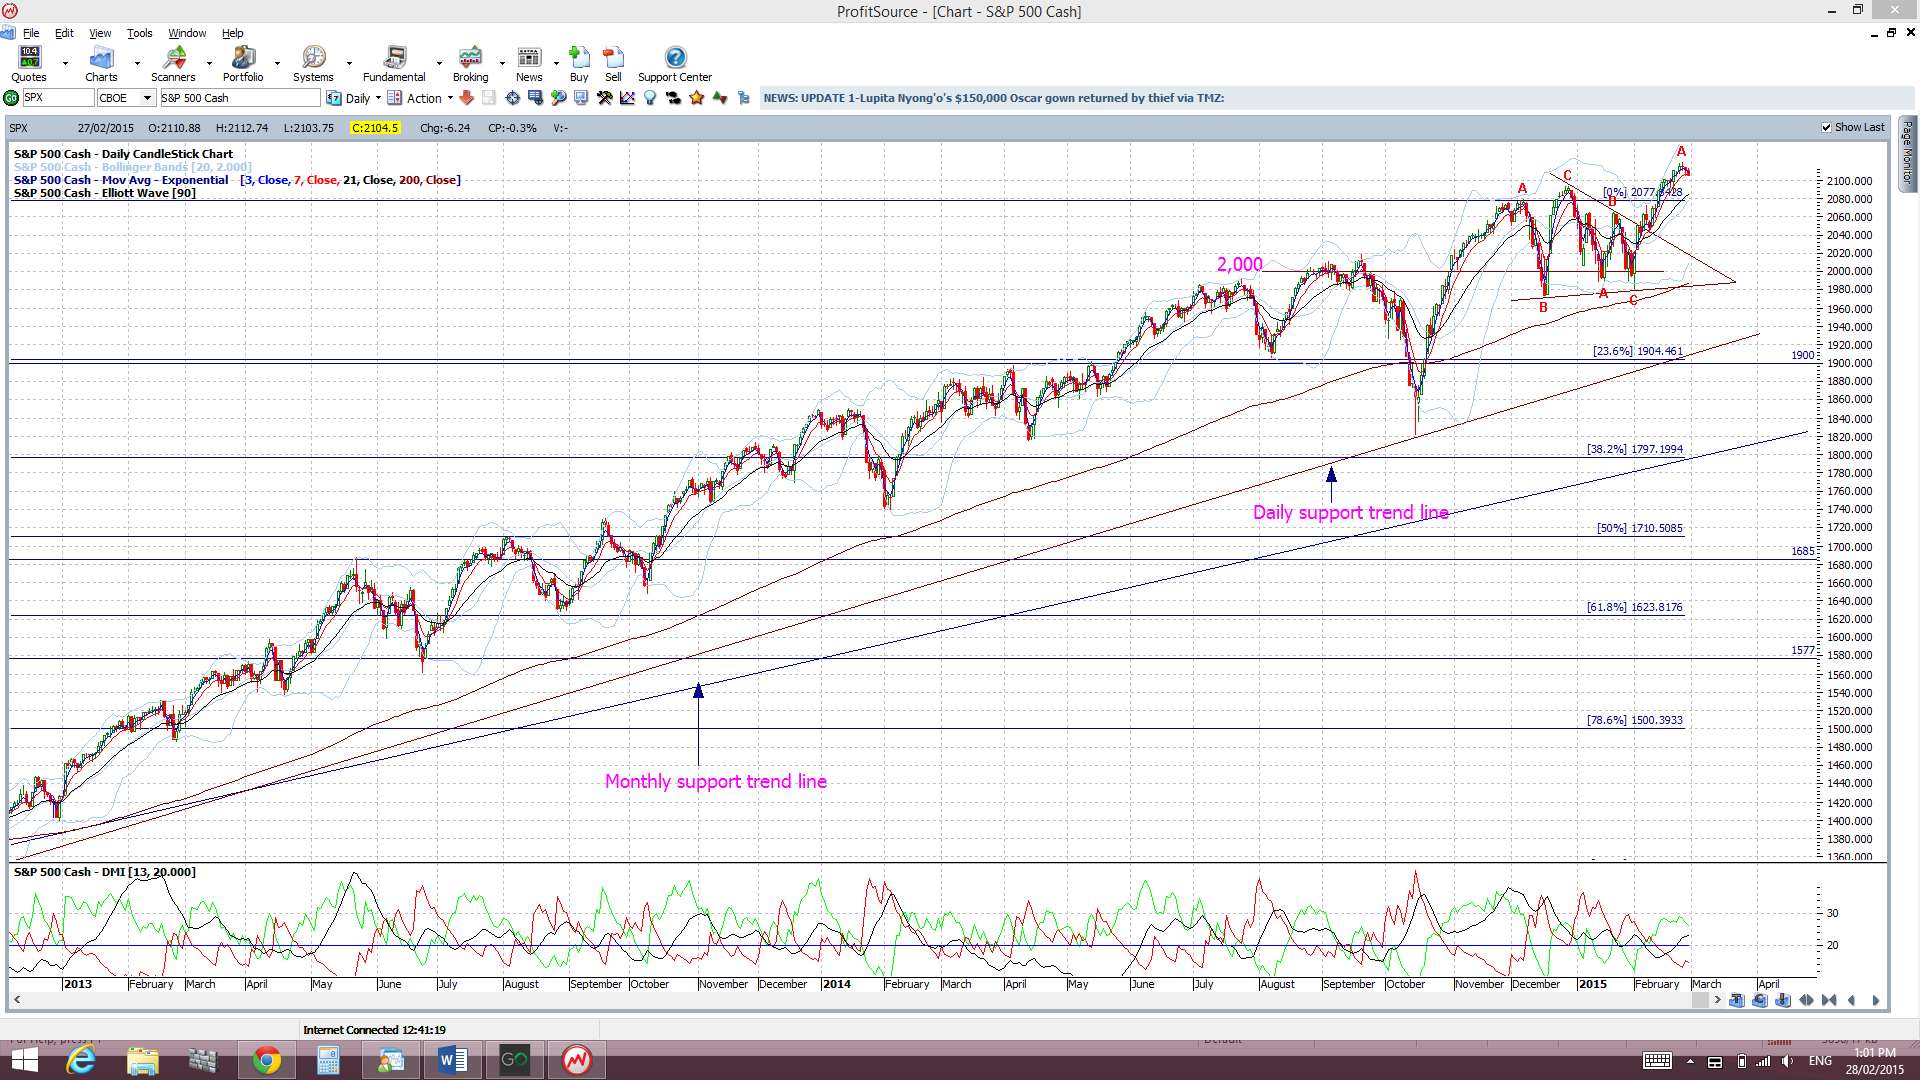
The S&P500 is still navigating new highs above 2000 but the chance of a pullback cannot be ruled out. There has not been any real deep pull back since the break up through the 1,577, 1,600, 1,700 and 1,800 levels and the major break of the 1,577 level was only tested once.
Thus, with all of this, I continue to watch out for further clues as to any new momentum move, long or short though! In particular I’m looking out for:
S&P500 daily chart: The index is still trading above the psychological 2,100 level and above the daily trend line. Price recently made a bullish triangle breakout:
Ichimoku S&P500 chart: a clear cross of the blue Tenkan-sen line below the pink Kijun-sen line. There has been a recent bullish Tenkan/Kijun signal that is now confirmed. The index is also trading above the Cloud and recently made a bullish triangle breakout.

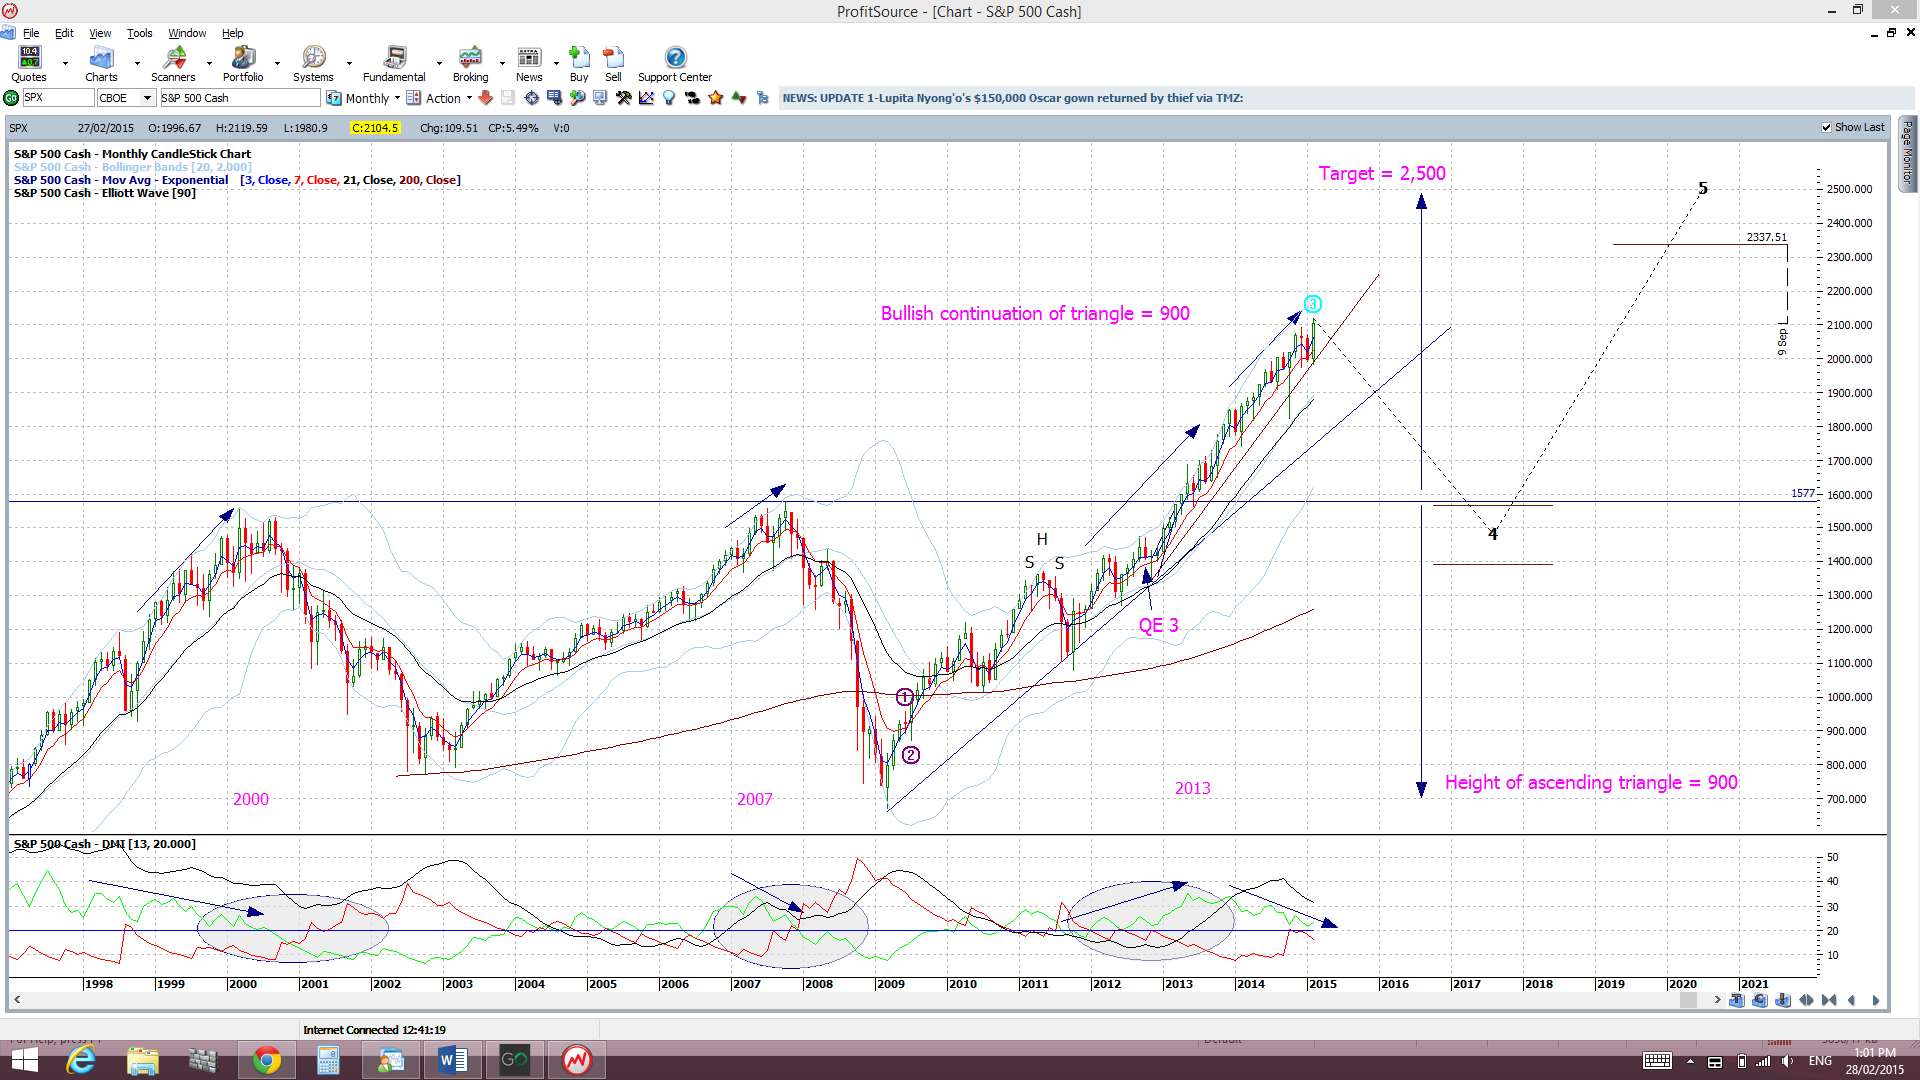
S&P500 monthly chart: a break of the monthly support trend line (see monthly chart). The monthly trend line remains intact. A break of this support level would suggest to me of a more severe pull back or correction.
Russell 2000 Index: this small caps index is a bit of a US market ‘bellwether’ and is trading above the key 1,220 level. The monthly close above this level is bullish and suggests continuation from the earlier Bull Flag breakout:
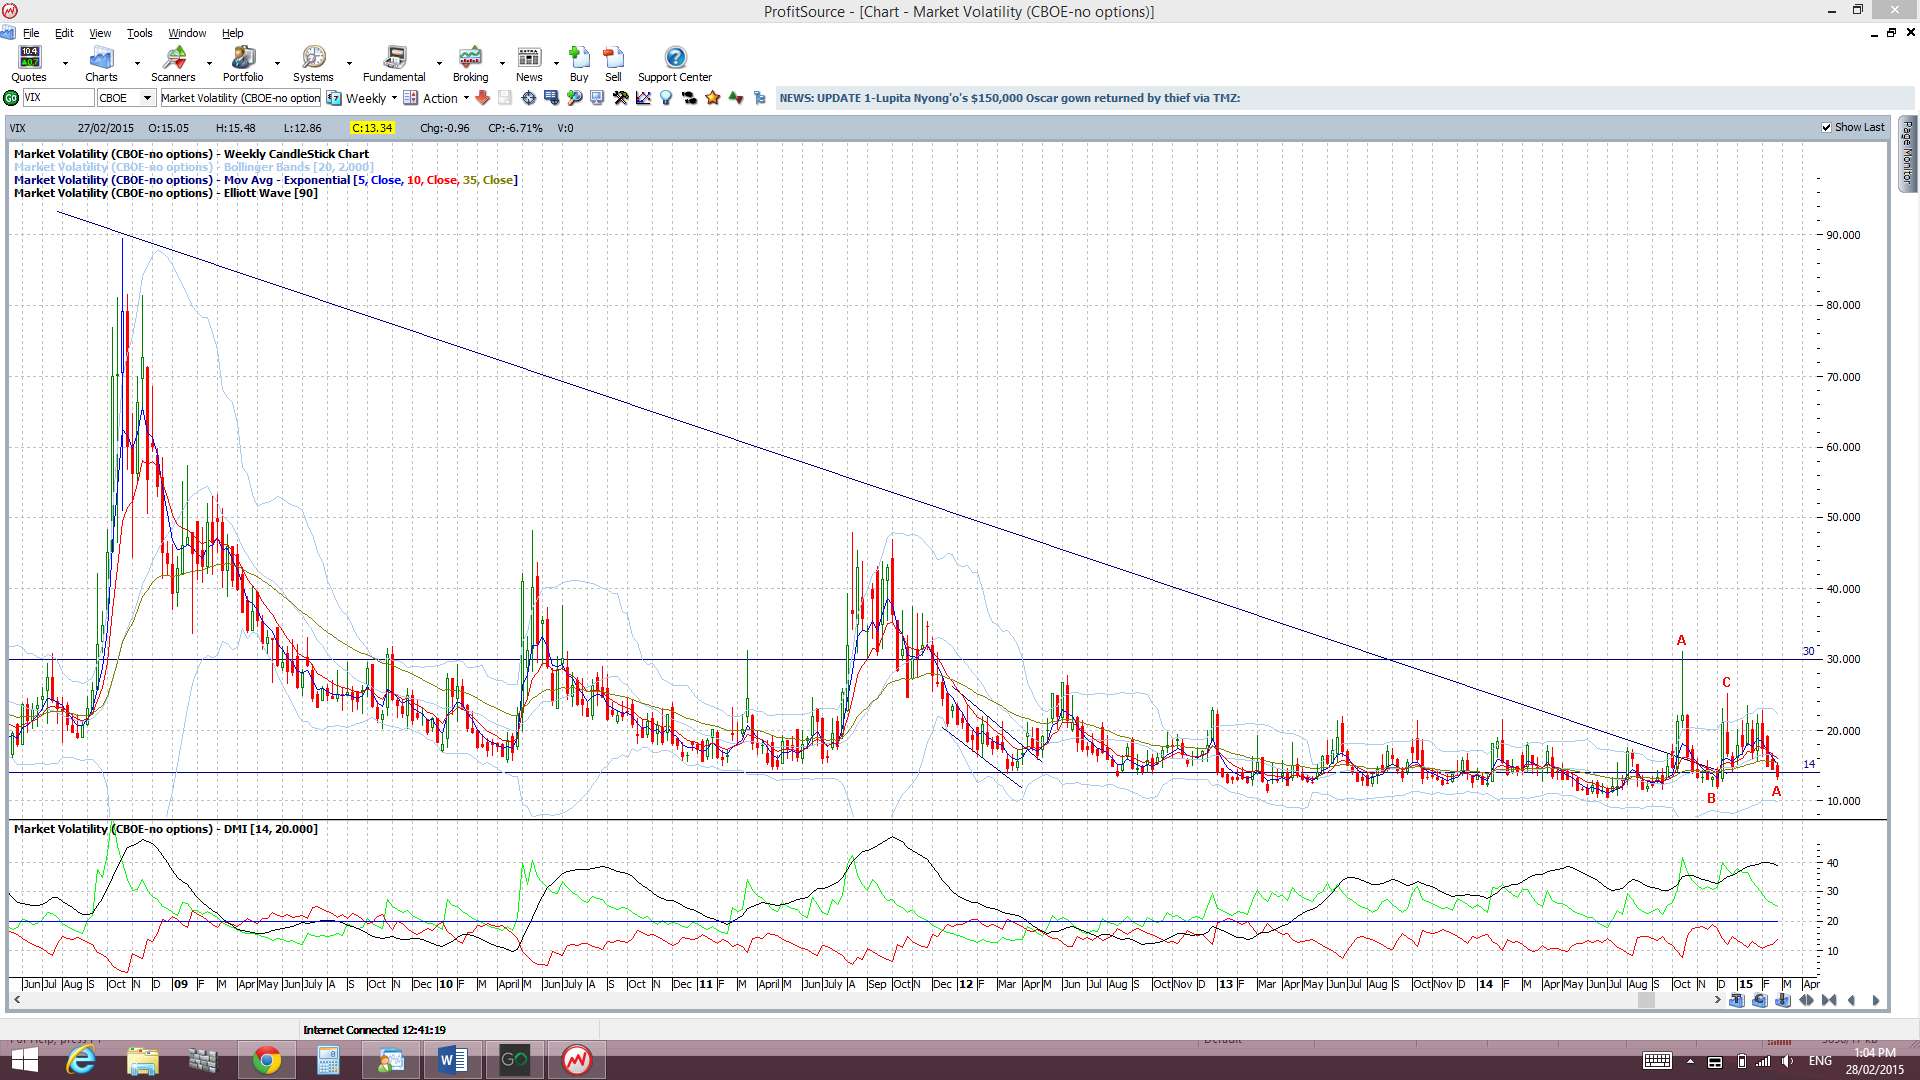
VIX Index: The ‘Fear’ index is now trading below the 14 level:
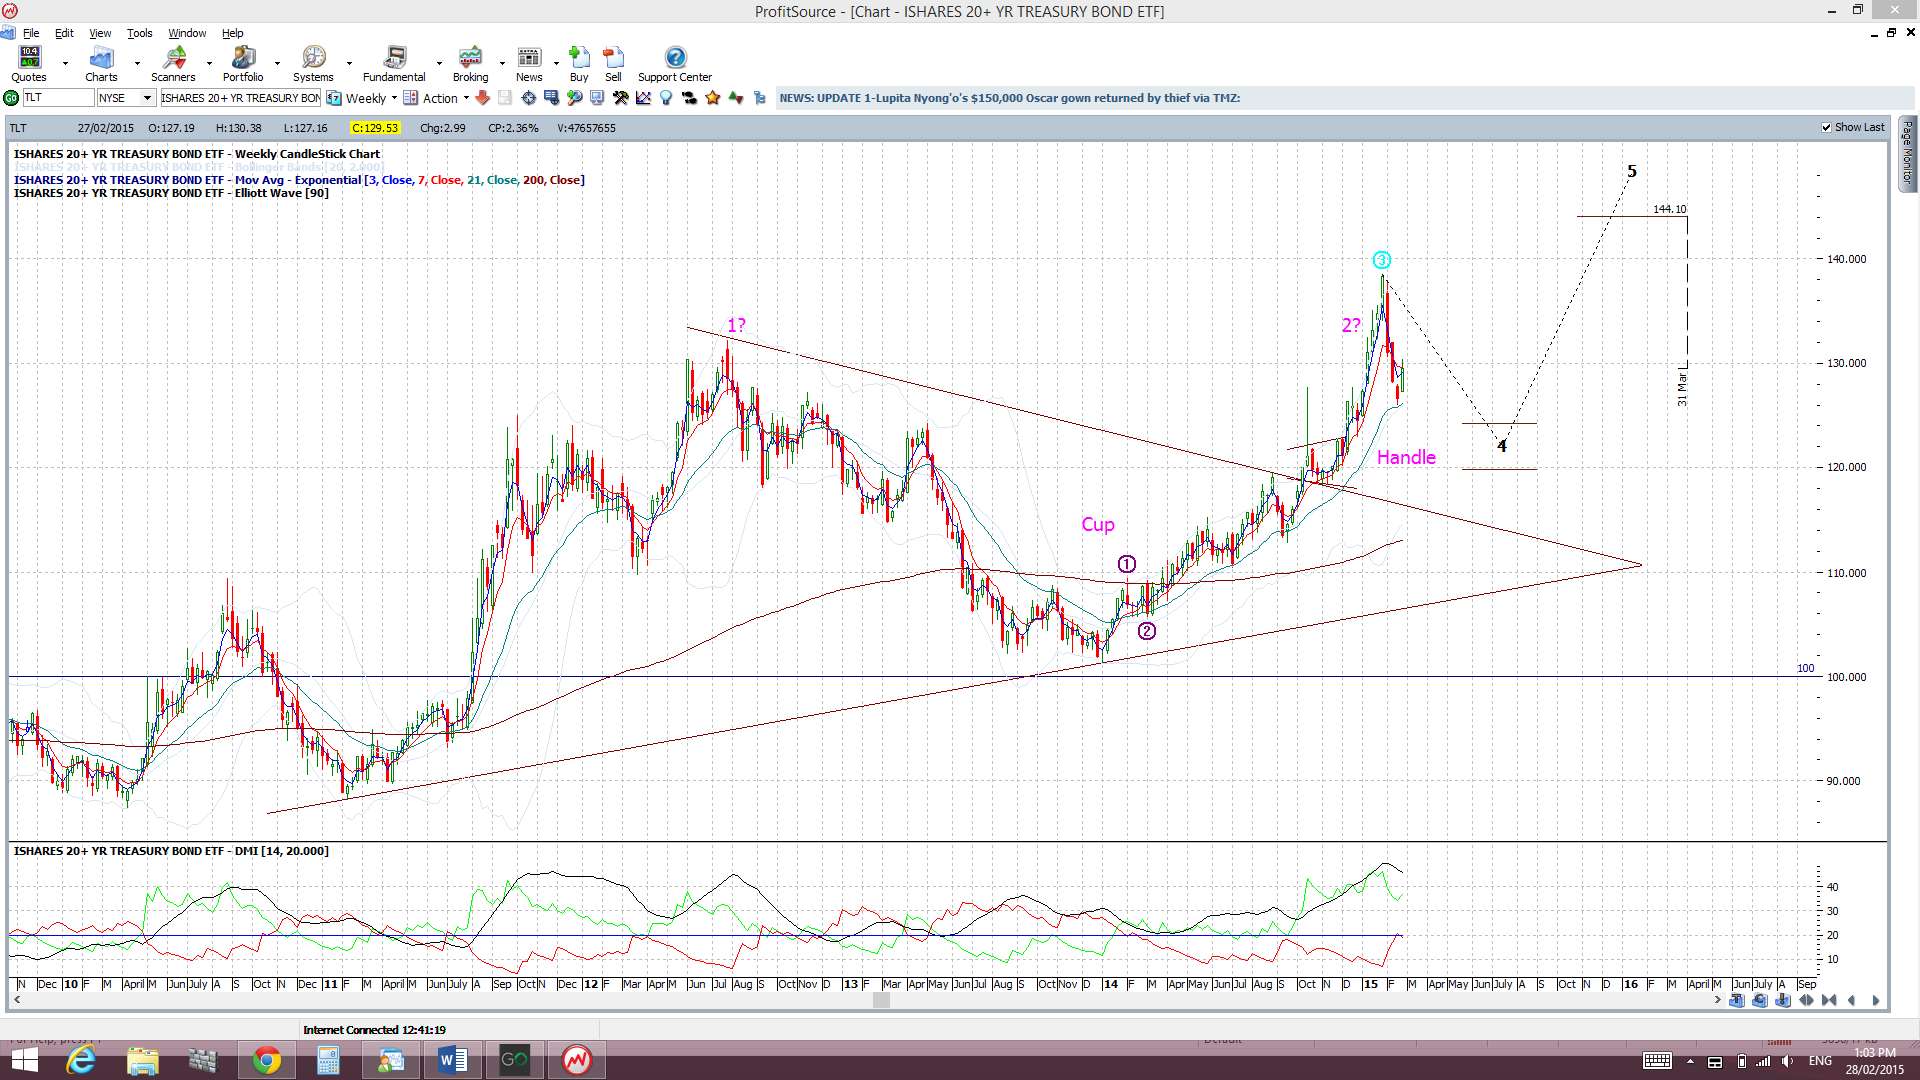
Bonds: The bond ETF has a bullish week:
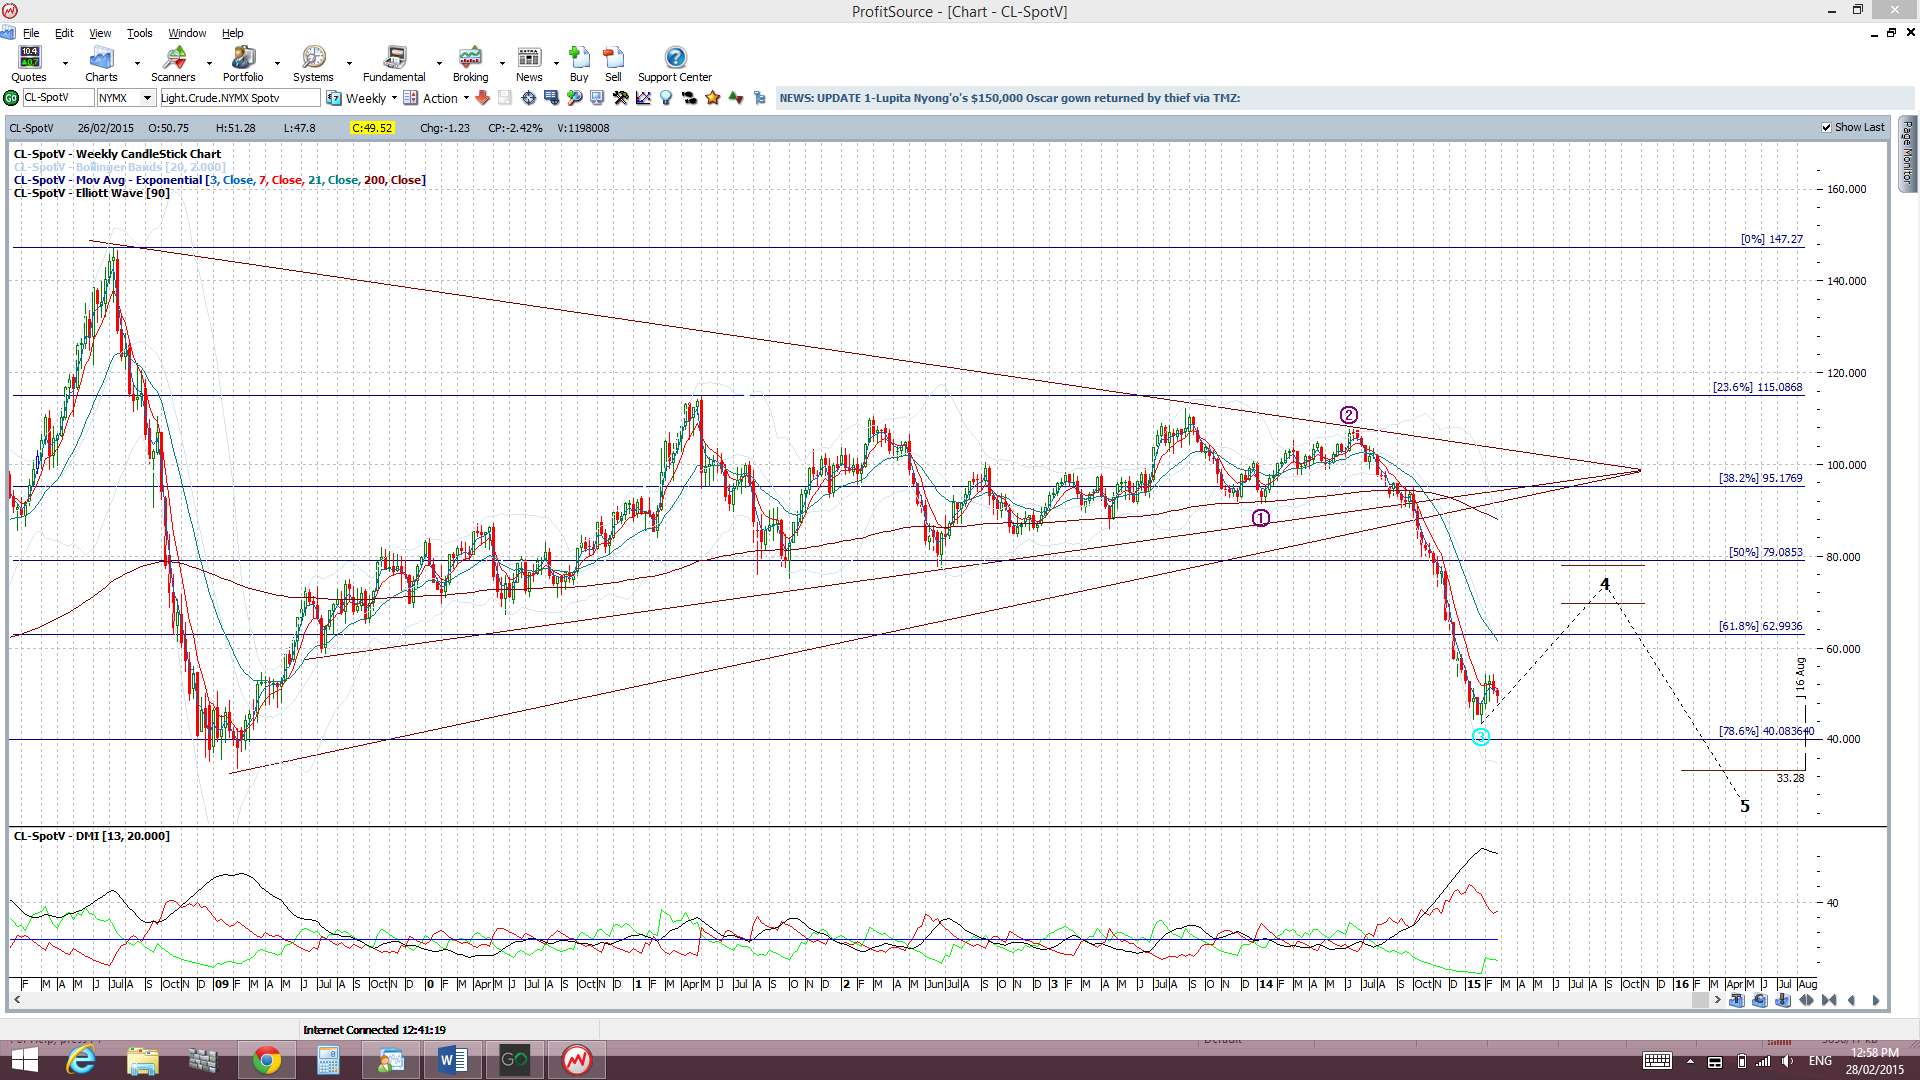
Oil: Oil had another bearish week but is still above $40 support:
Trading Calendar Items to watch out for:
Forex:
- Sun 1st: CNY Manufacturing PMI.
- Mon 2nd: CNY HSBC Final Manufacturing PMI. GBP Manufacturing PMI. EUR CPI Flash Estimates. USD ISM Manufacturing PMI.
- Tue 3rd: AUD Building Approvals, RBA Cash Rate & RBA Statement. EUR Spanish Unemployment Change. GBP Construction PMI. CAD GDP. NZD GDT Price Index. USD Fed Chair Yellen speaks.
- Wed 4th: AUD GDP. GBP Services PMI. USD ADP NFP & ISM Non-Manufacturing PMI. CAD Cash Rate & BoC Statement.
- Thurs 5th: AUD Trade Balance & Retail Sales. GBP Bank Rate and BoE Statement. EUR Cash Rate & ECB Press Conference. USD Unemployment Claims. CAD Ivey PMI.
- Fri 6th: CAD Building Permits & Trade Balance. USD NFP, Unemployment Rate & Trade Balance.
E/U: The E/U chopped along within a 6-week Flag until Thursday. USD strength kicked in and triggered a triangle breakout, a move below the key 61.8% fib from the 2000-008 bull run and a new TC signal to short. The 4hr chart shows a potential ‘Double Bottom’ region at 1.11 and this may act as some support so I will be waiting for a make or break of this level before taking any new trade on the E/U.
This triangle pattern had been giving the higher time frame charts a ‘Bear Flag’ appearance which now looks like it could evolve. A caveat here though being if the USD index fails at the ‘Double Top’ 95.50 region as then this might help to support the E/U and bring about the 4hr/daily chart ‘Double Bottom’.
The E/U continues to hold below the major 1.18 level but, until Thursday, had managed to hold above the support of the key 61.8% fib from the 2000-2008 bull run. Any move back above this 61.8% fib would undermine this renewed bearish sentiment but a hold below would suggest bearish continuation. I had mentioned I was expecting this pair to test the broken 1.18 level and I am still on the lookout for this although it is looking less and less likely. Whether price would remain bearish following any test of 1.18 though would still be a ‘wait and see’ prospect but I’ll be looking for signs of weakness to take up the technical triangle breakdown trade as described below.
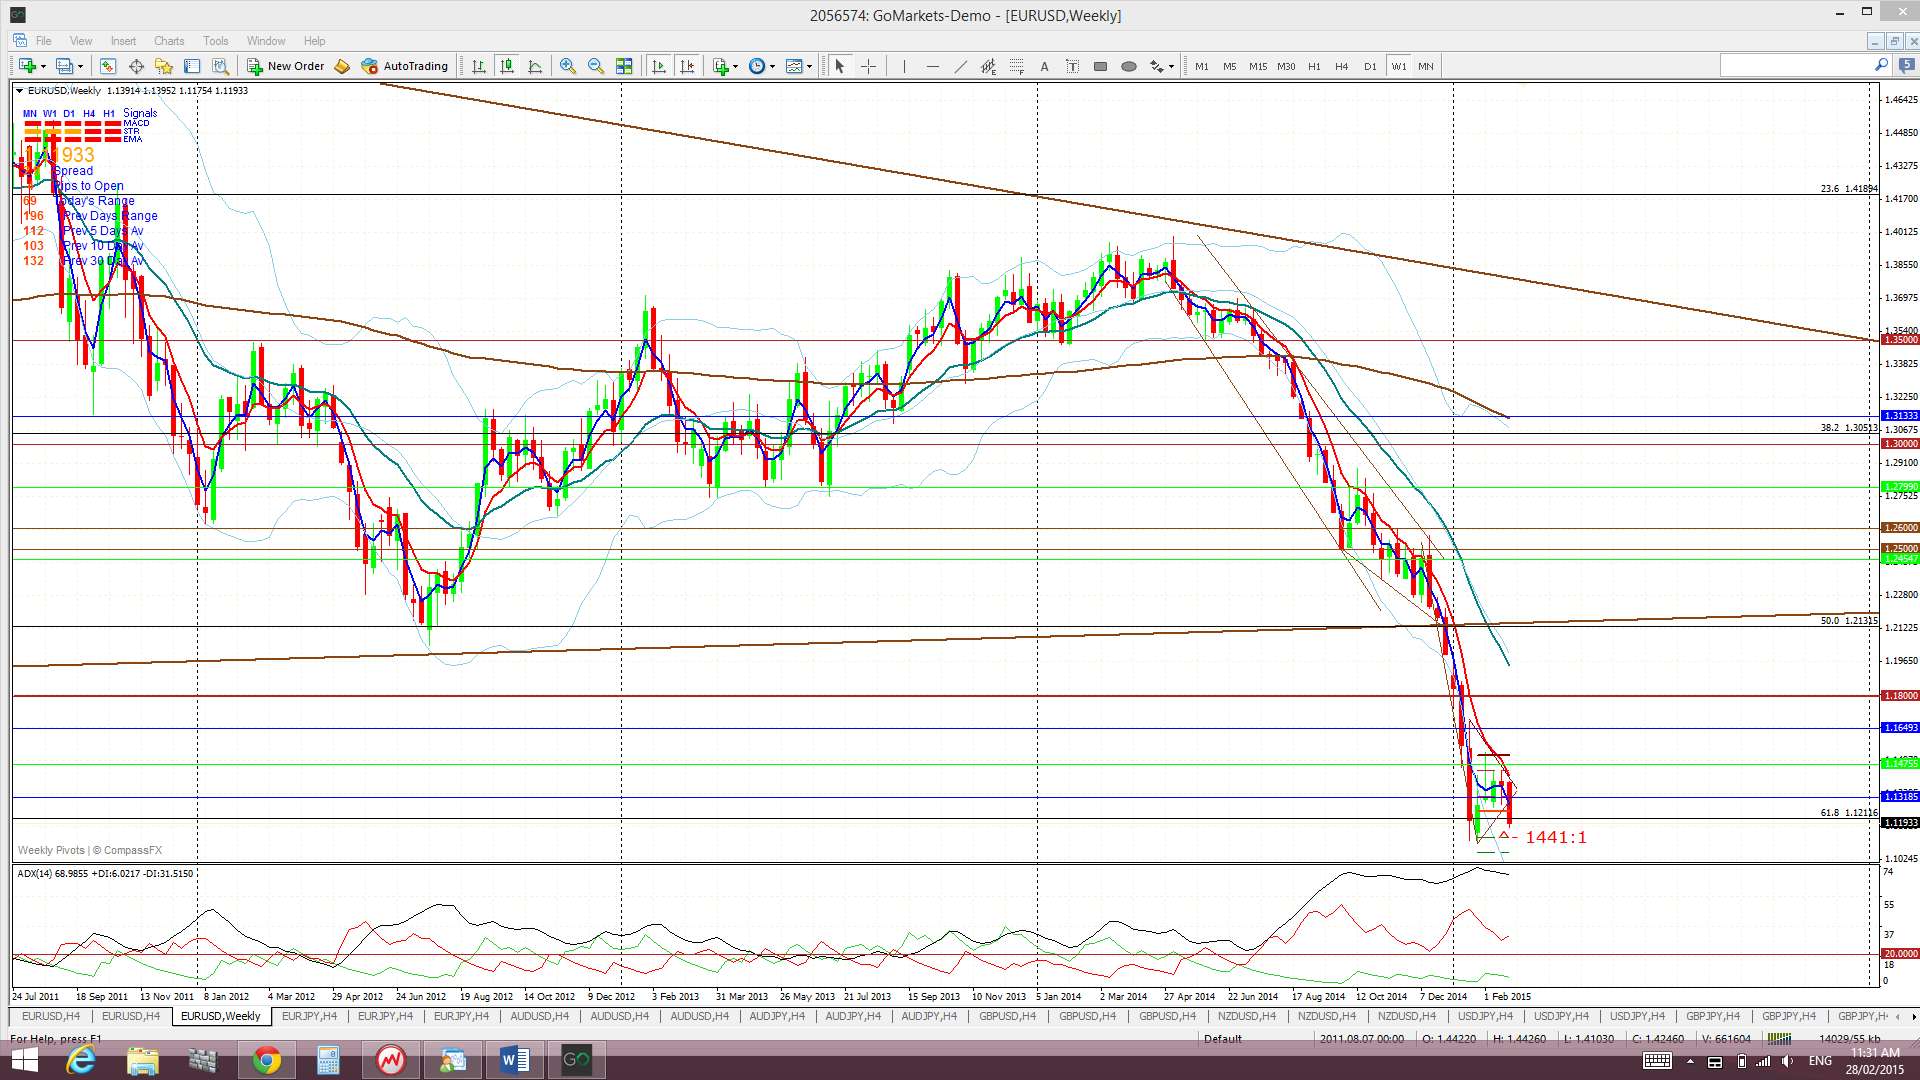
Descending triangle on the monthly chart: the descending triangle pattern is a bearish continuation pattern and has a base at around the 1.18 level. The height of this triangle is about 4,000 pips. Technical theory would suggest that any bearish breakdown of this triangle below 1.18 might see a similar move. It is worth noting that this would bring the E/U down near 0.80 and to levels not seen since 2000/2001! The monthly chart shows how critical this 1.18 level is for the E/U. The January monthly candle closed below this key level and I will be looking for a test of 1.18 before further possible bearish continuation. I’m beginning to wonder if we will see this ‘test’ though.
Price is back trading below the Ichimoku Cloud on the 4hr, daily, weekly and monthly charts which is bearish.
The weekly candle closed as a large bearish candle. The monthly candle closed as a small bearish candle with a long upper shadow.
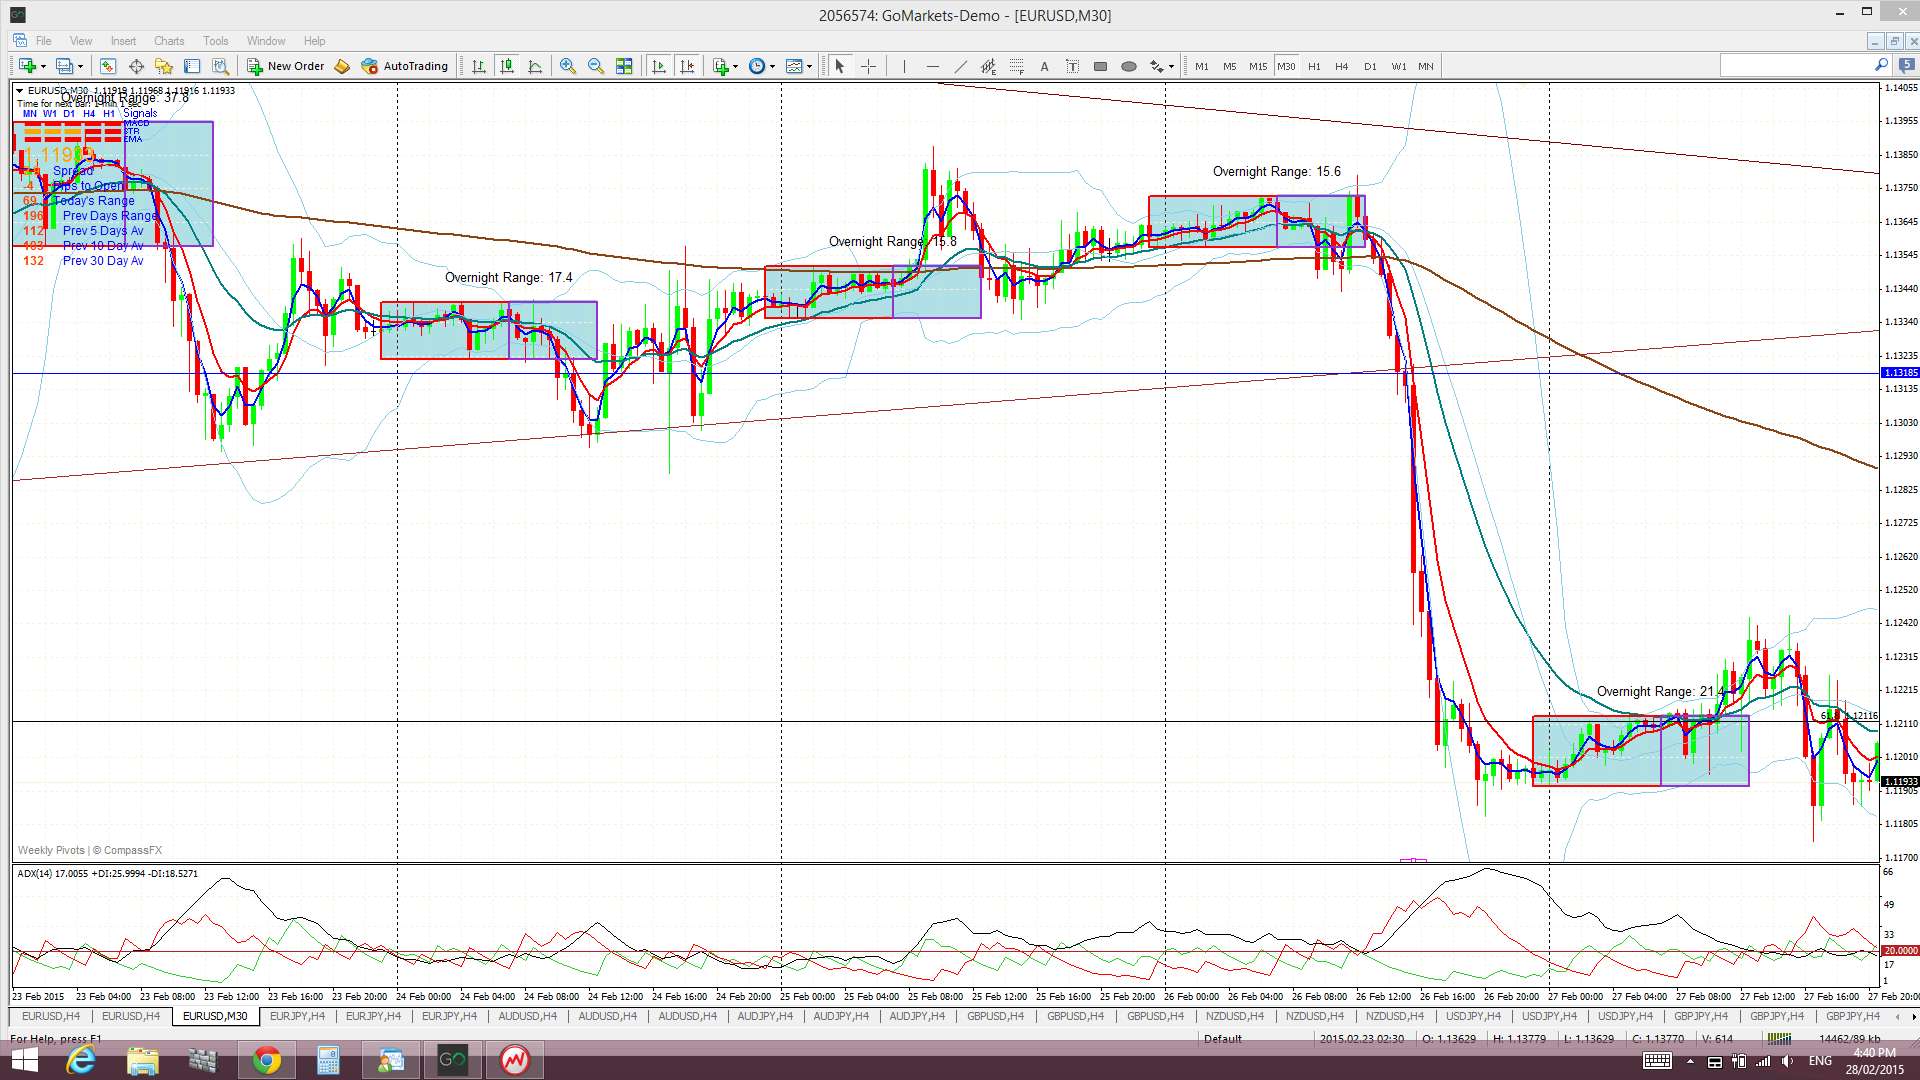
Note the decent trend trading opportunity off the 30 min charts during the US session. (chart below)
Risk events for the E/U this week stand out as the ECB Interest Rate announcement and Press Conference as well as US NFP. I can see arguments/logic for E/U price action trying to carve out a base here as well as for more bearish potential and consider that much may depend on the USD and whether it breaks or retreats from the 95.50 level.
- There is a new TC signal on this pair.


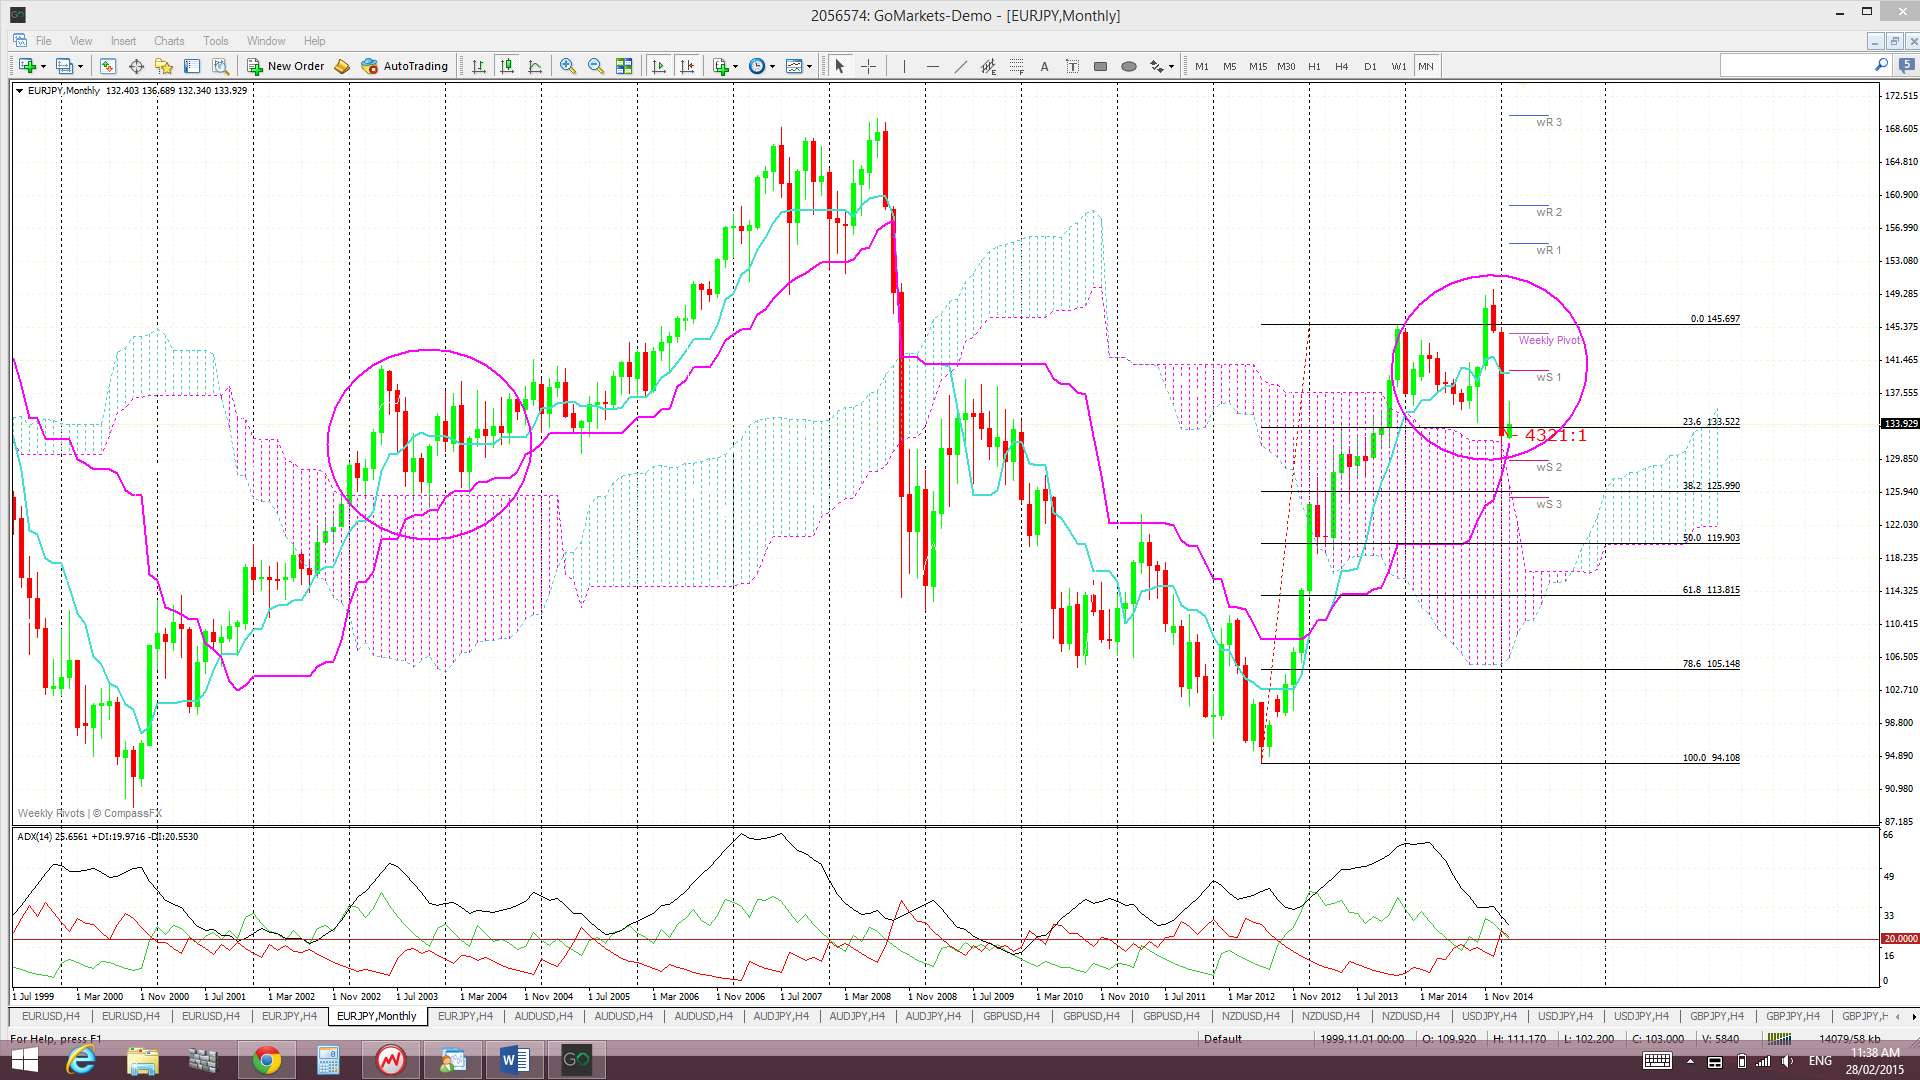
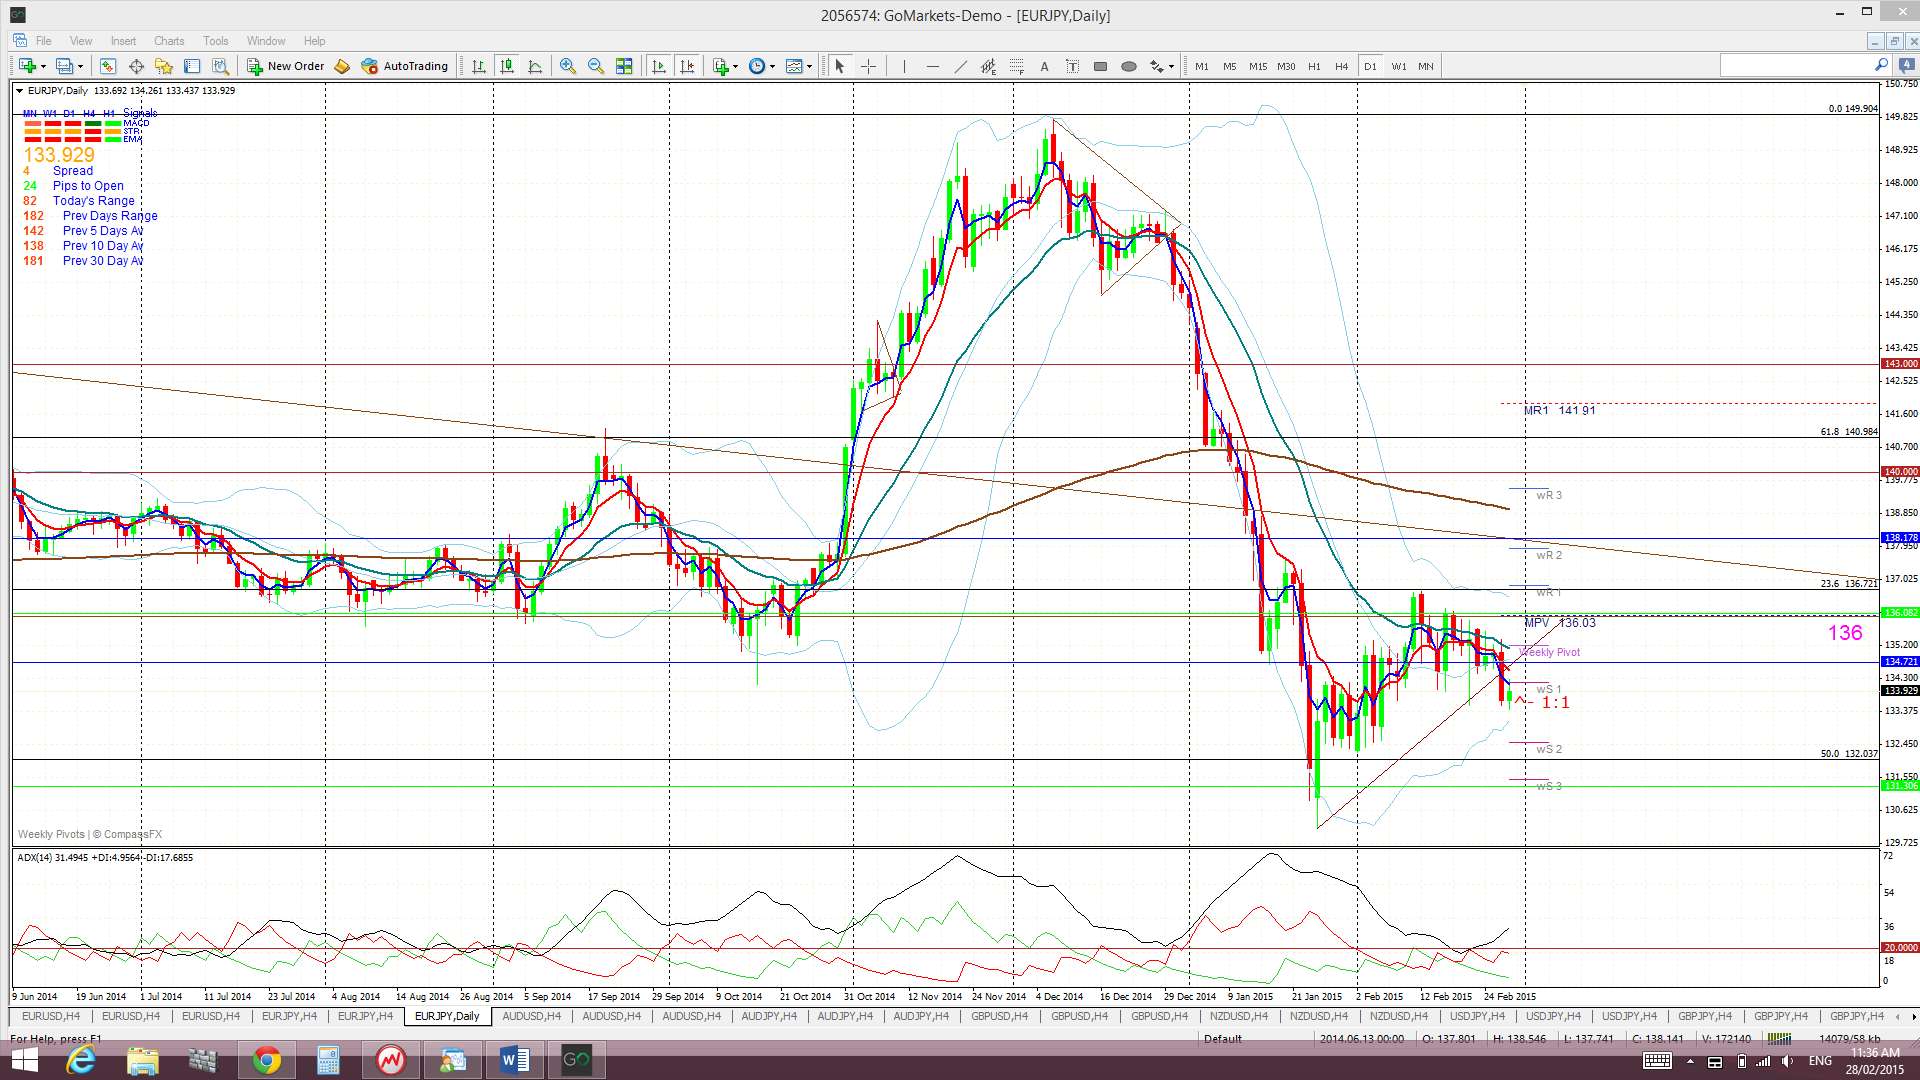
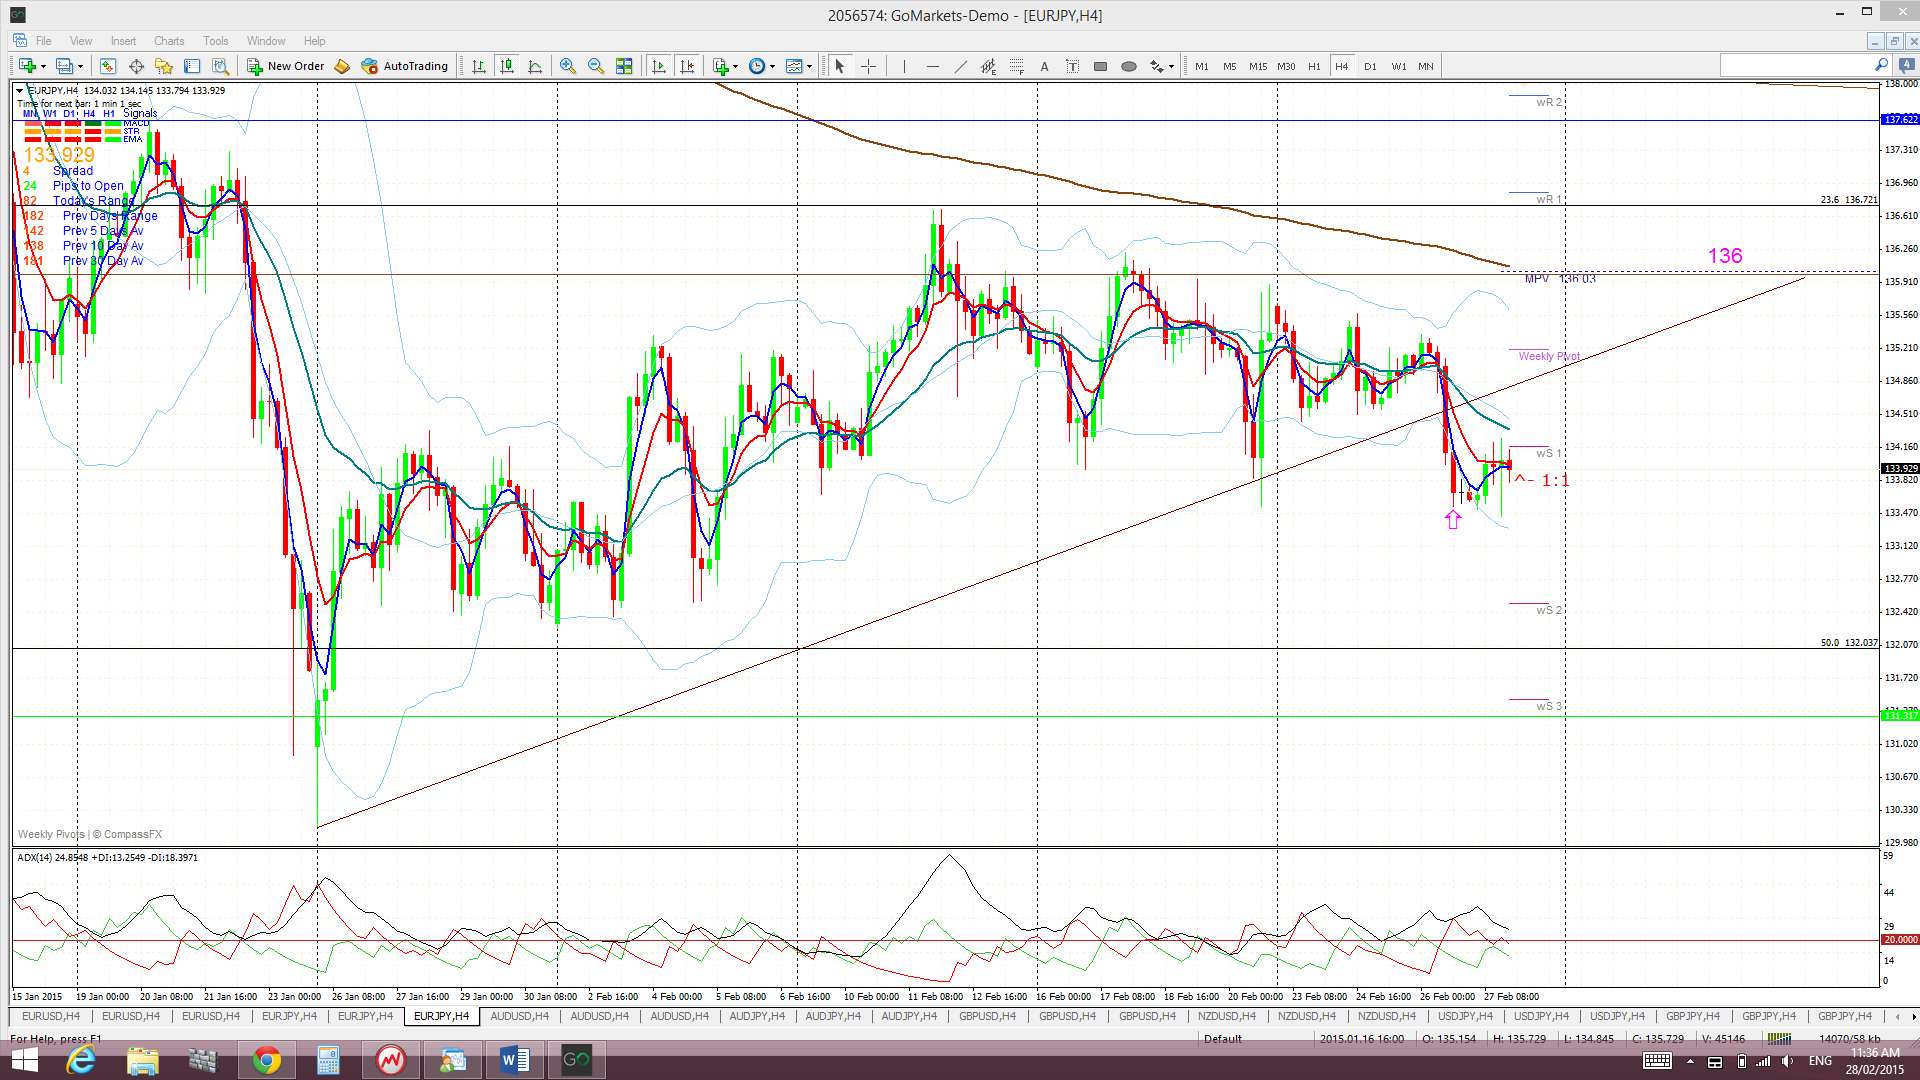
E/J: The E/J continued to hold above a 5 week support trend line but below the 136 level until EUR weakness was triggered on Thursday. Price broke down below this support and triggered a new TC signal as well but this is struggling at the moment.
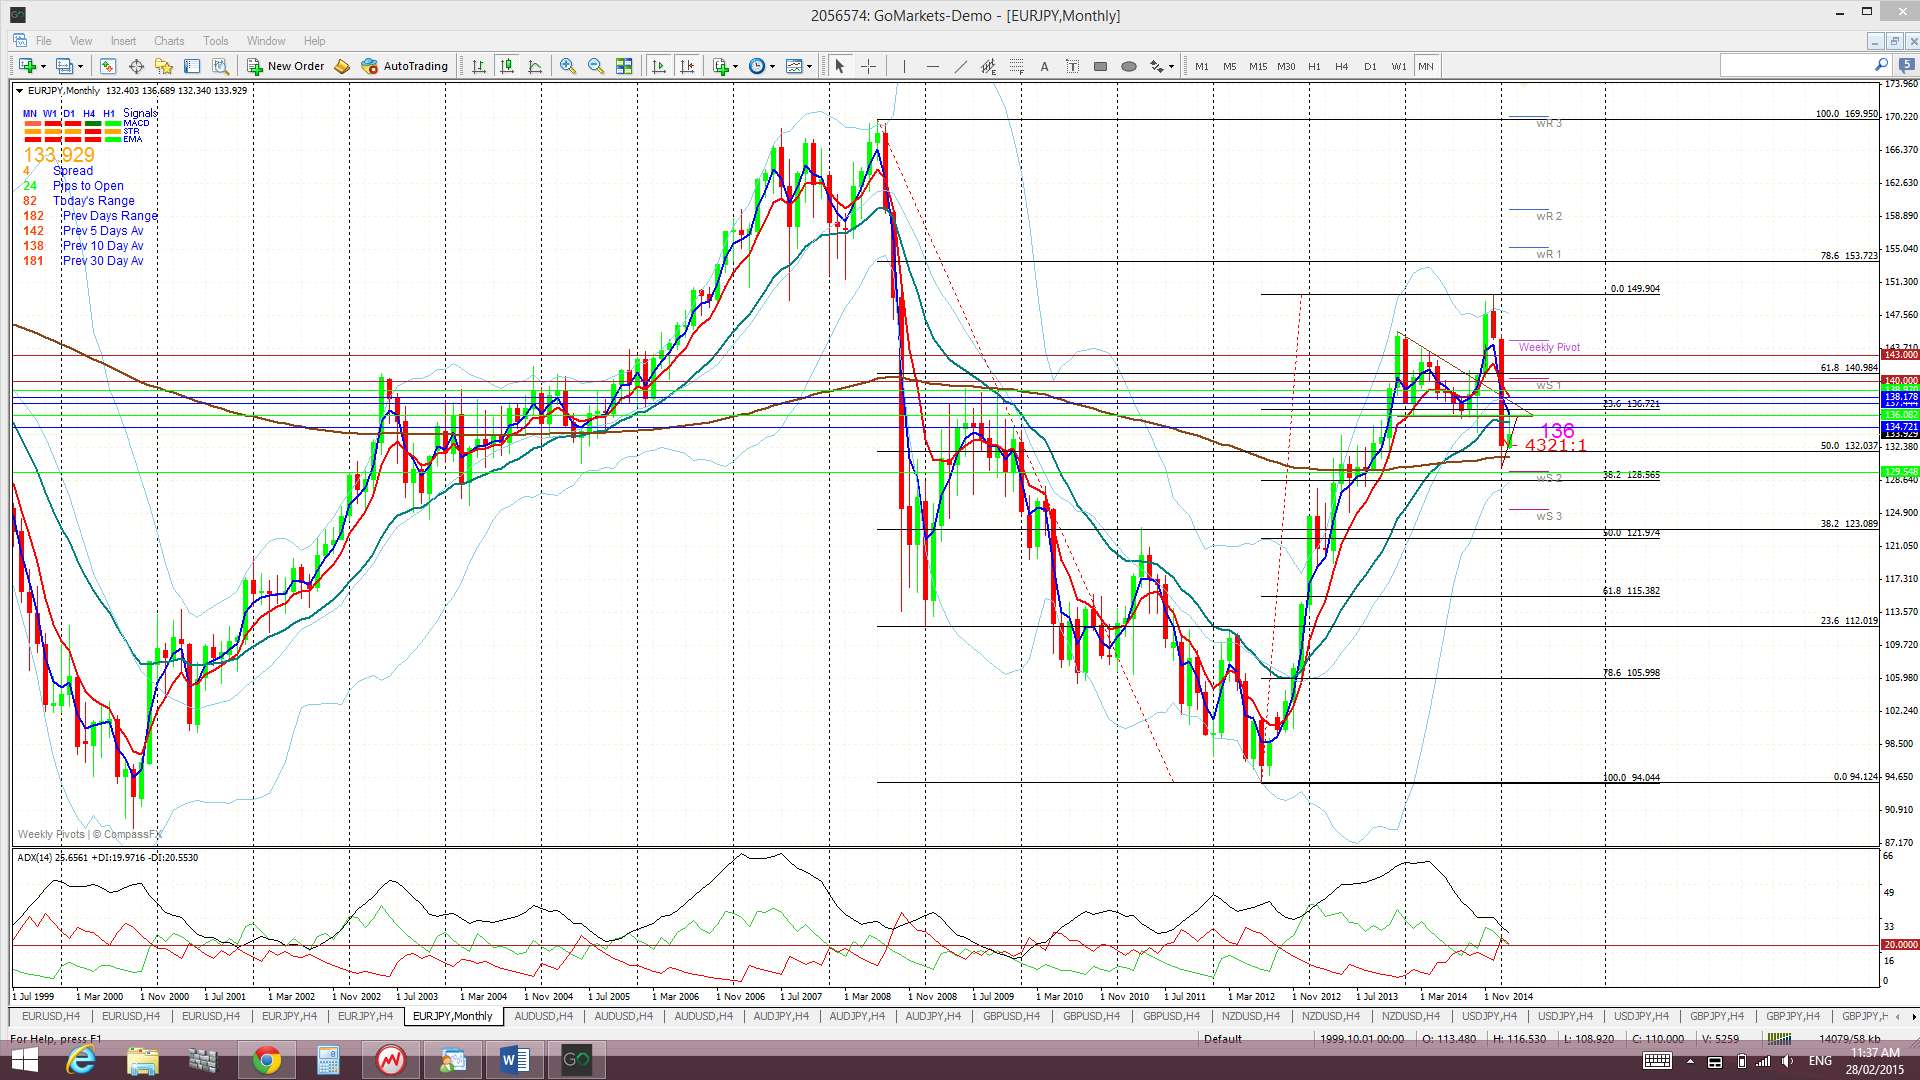
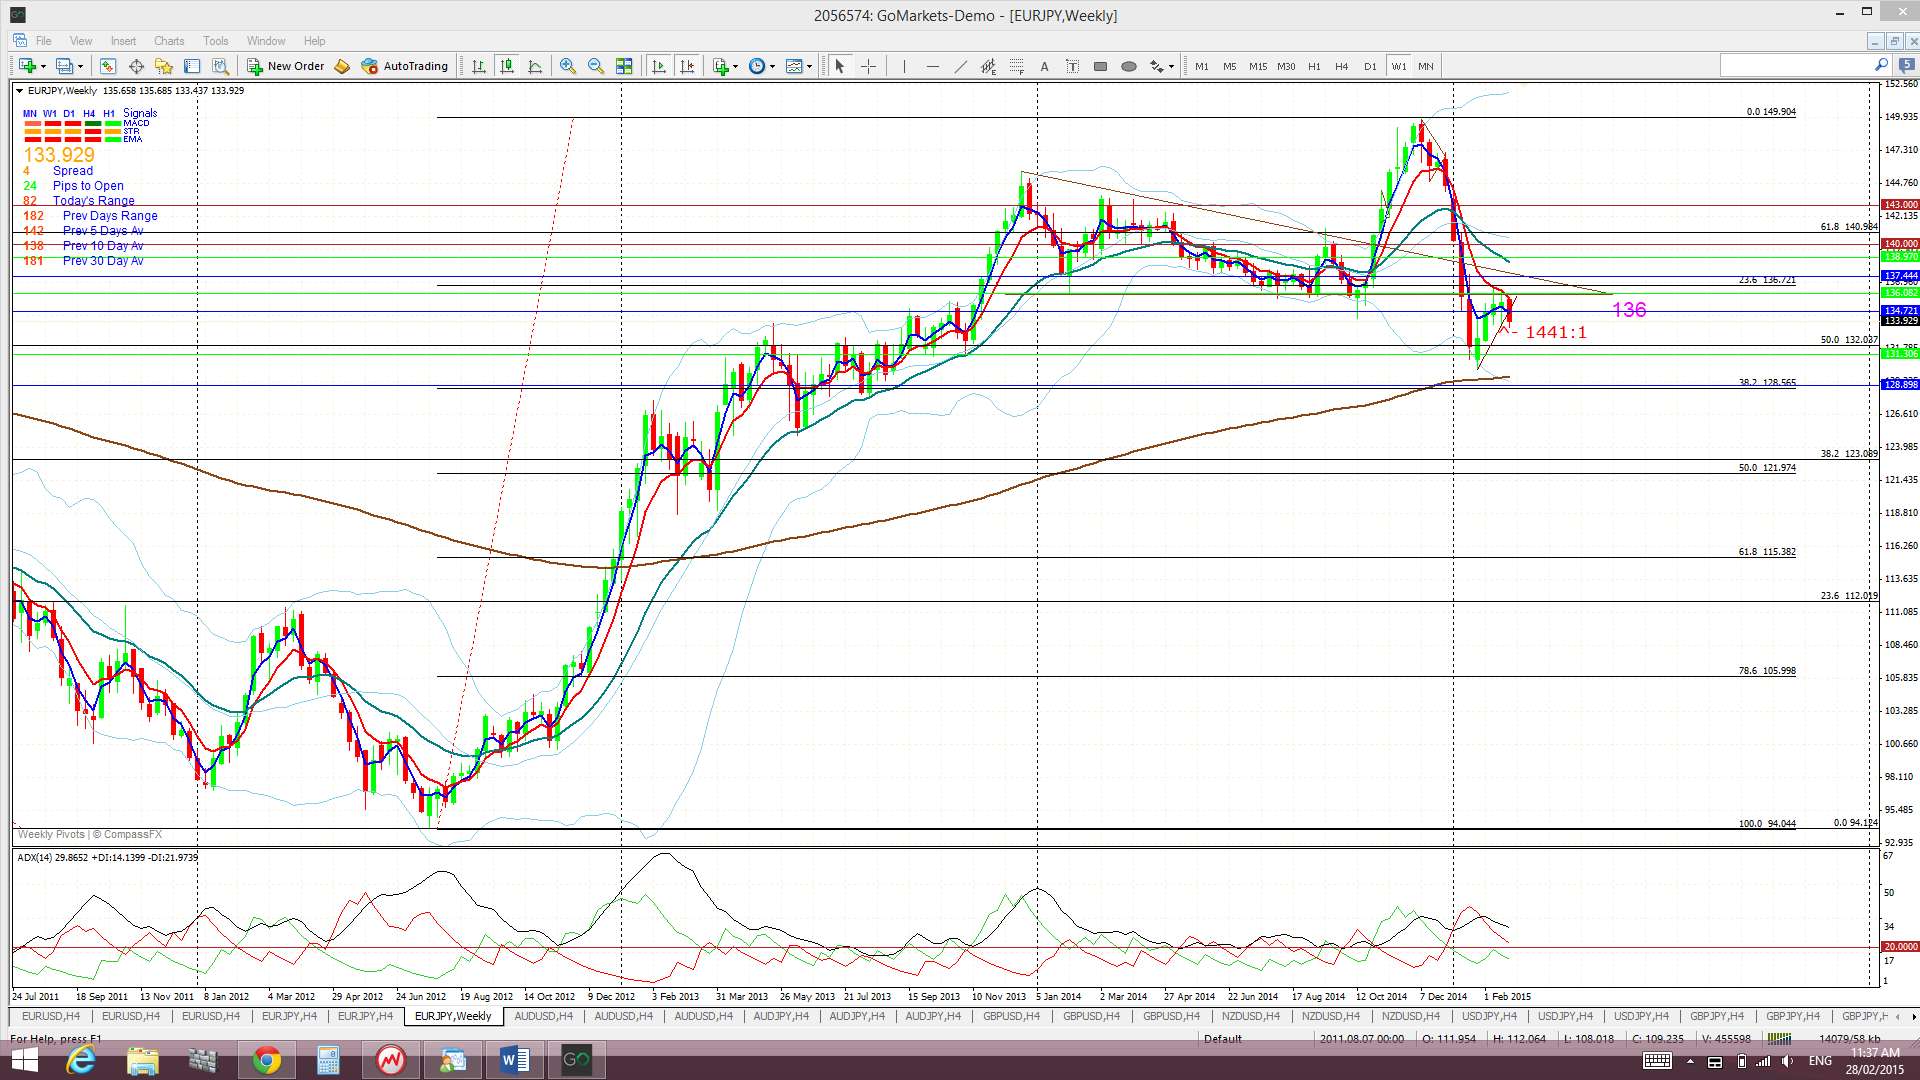
The weekly chart continues to reveal how the 136 level has been a strong S/R level and I would look at any close and hold above 136 as bullish. Price appears to have bounced up off the monthly Cloud and so I’ll be looking for continuation here:
Price is trading below the Cloud on the 4hr, daily and weekly charts but above on the monthly chart. I do note there has been a Tenkan/Kijun cross on the daily chart but the angles do not fully support a new bullish signal just yet.
The weekly candle closed as a bearish engulfing candle and, just to confuse matters, the monthly candle closed as a bullish-reversal ‘Inverted Hammer’ candle.
Risk events for the E/J this week stand out as the ECB Interest Rate announcement and Press Conference as well as US NFP.
- There is a new TC signal on this pair.
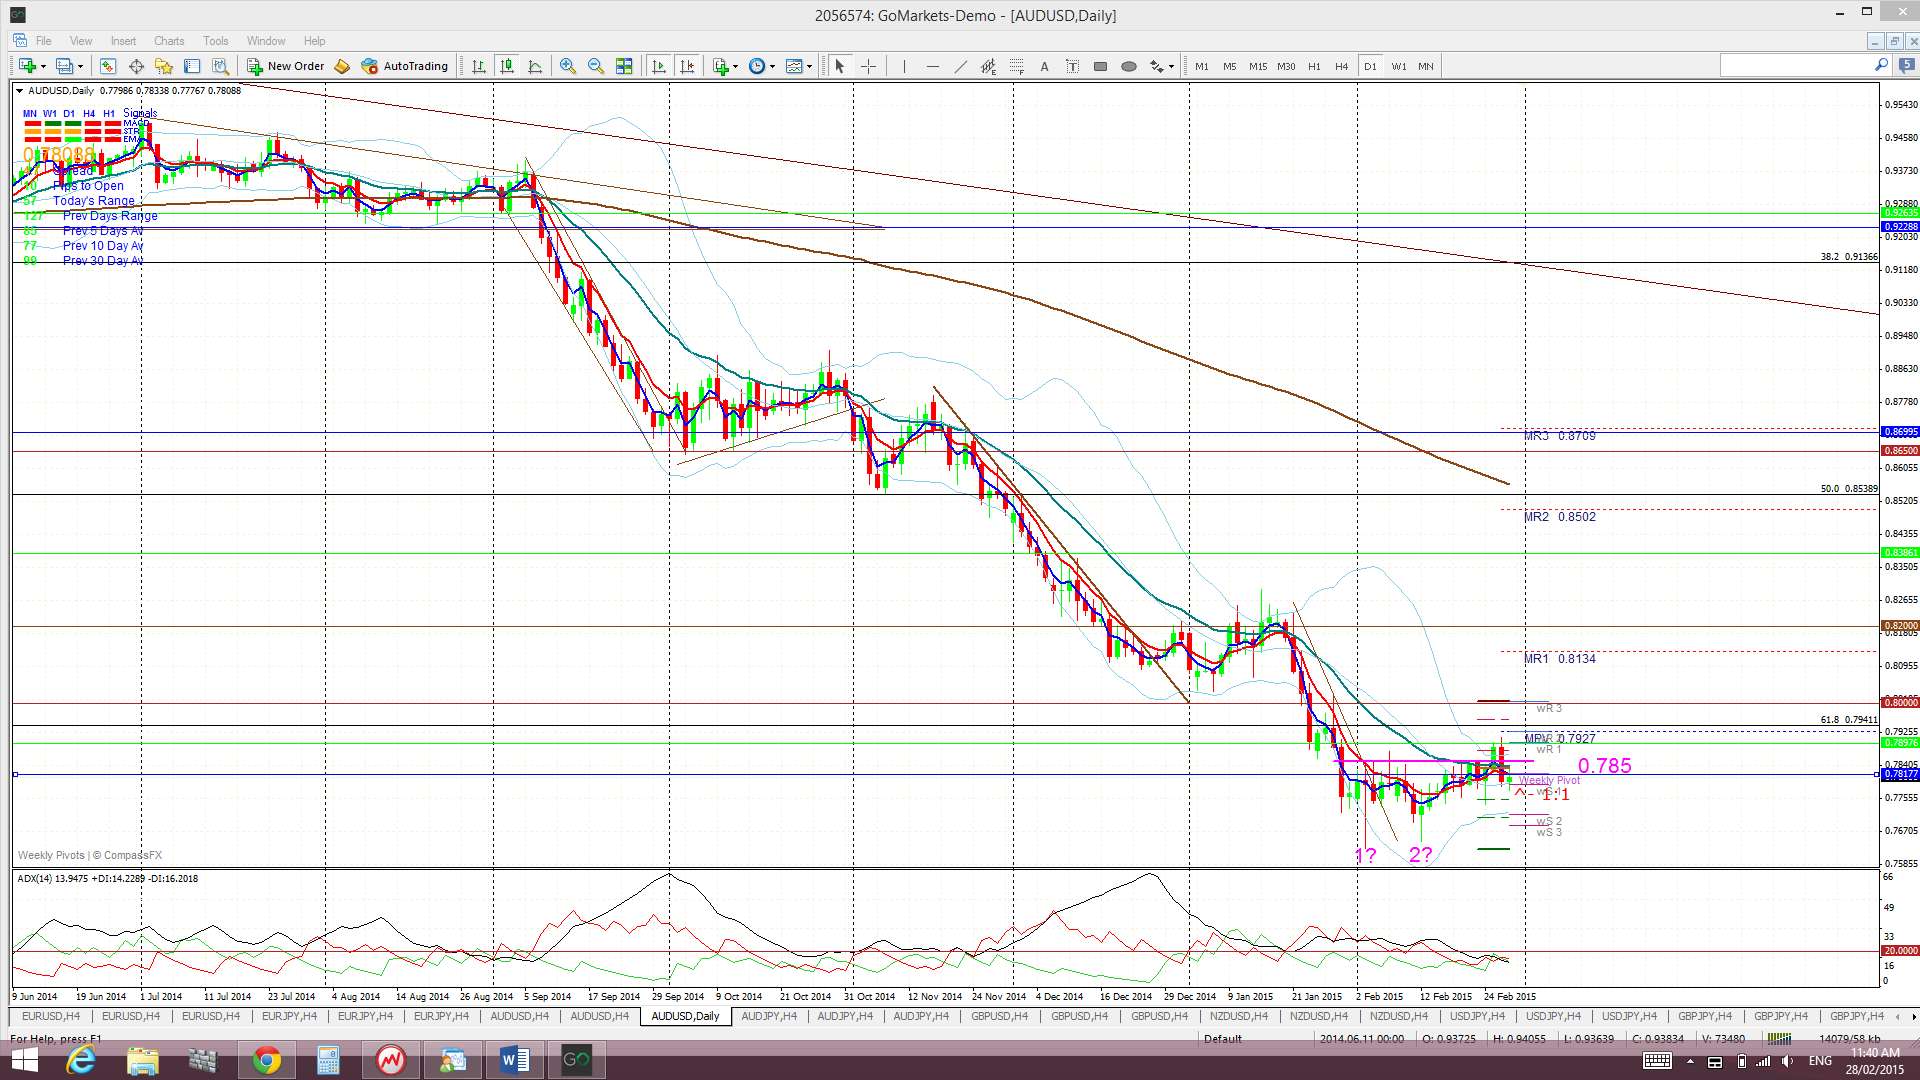
A/U: The A/U broke up above the ‘neck line’ of a potentially bullish ‘Double Bottom’ but has failed to follow through. USD strength on Thursday resulted in a pullback for the A/U.
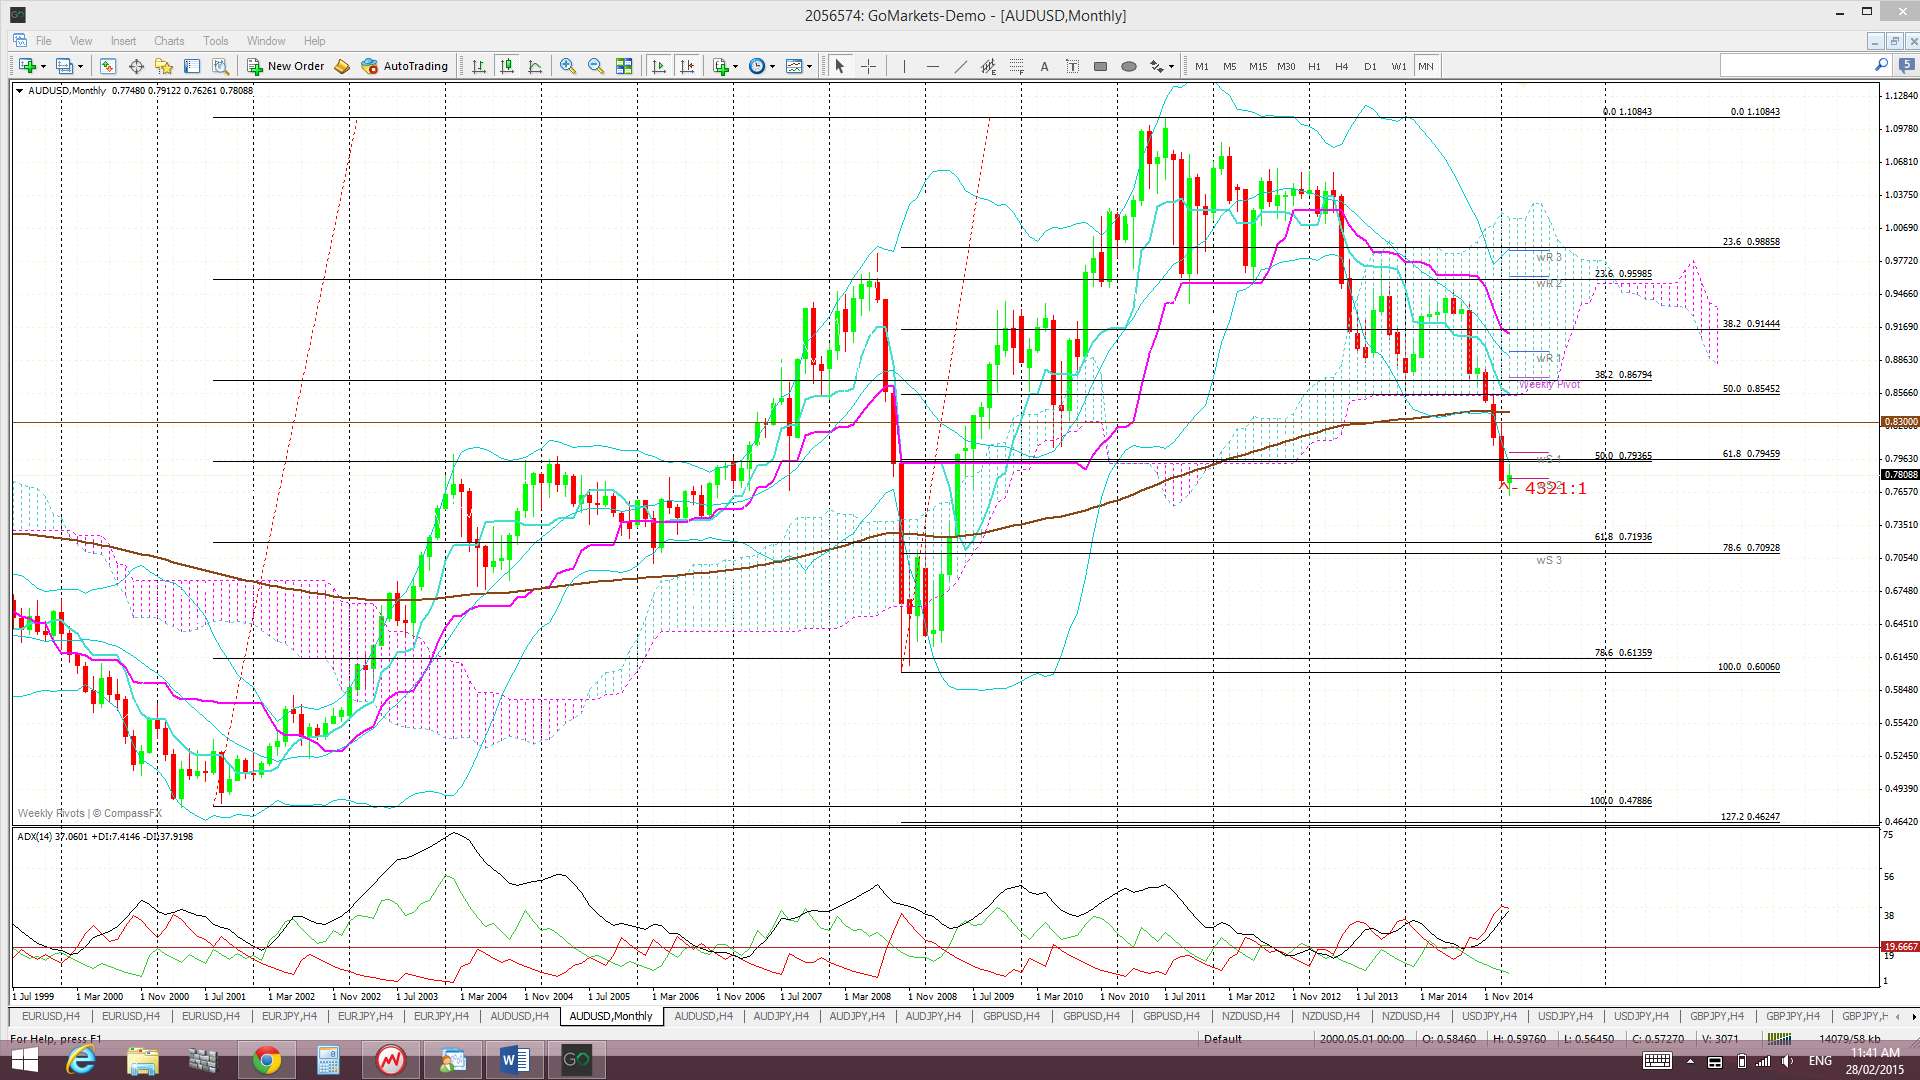
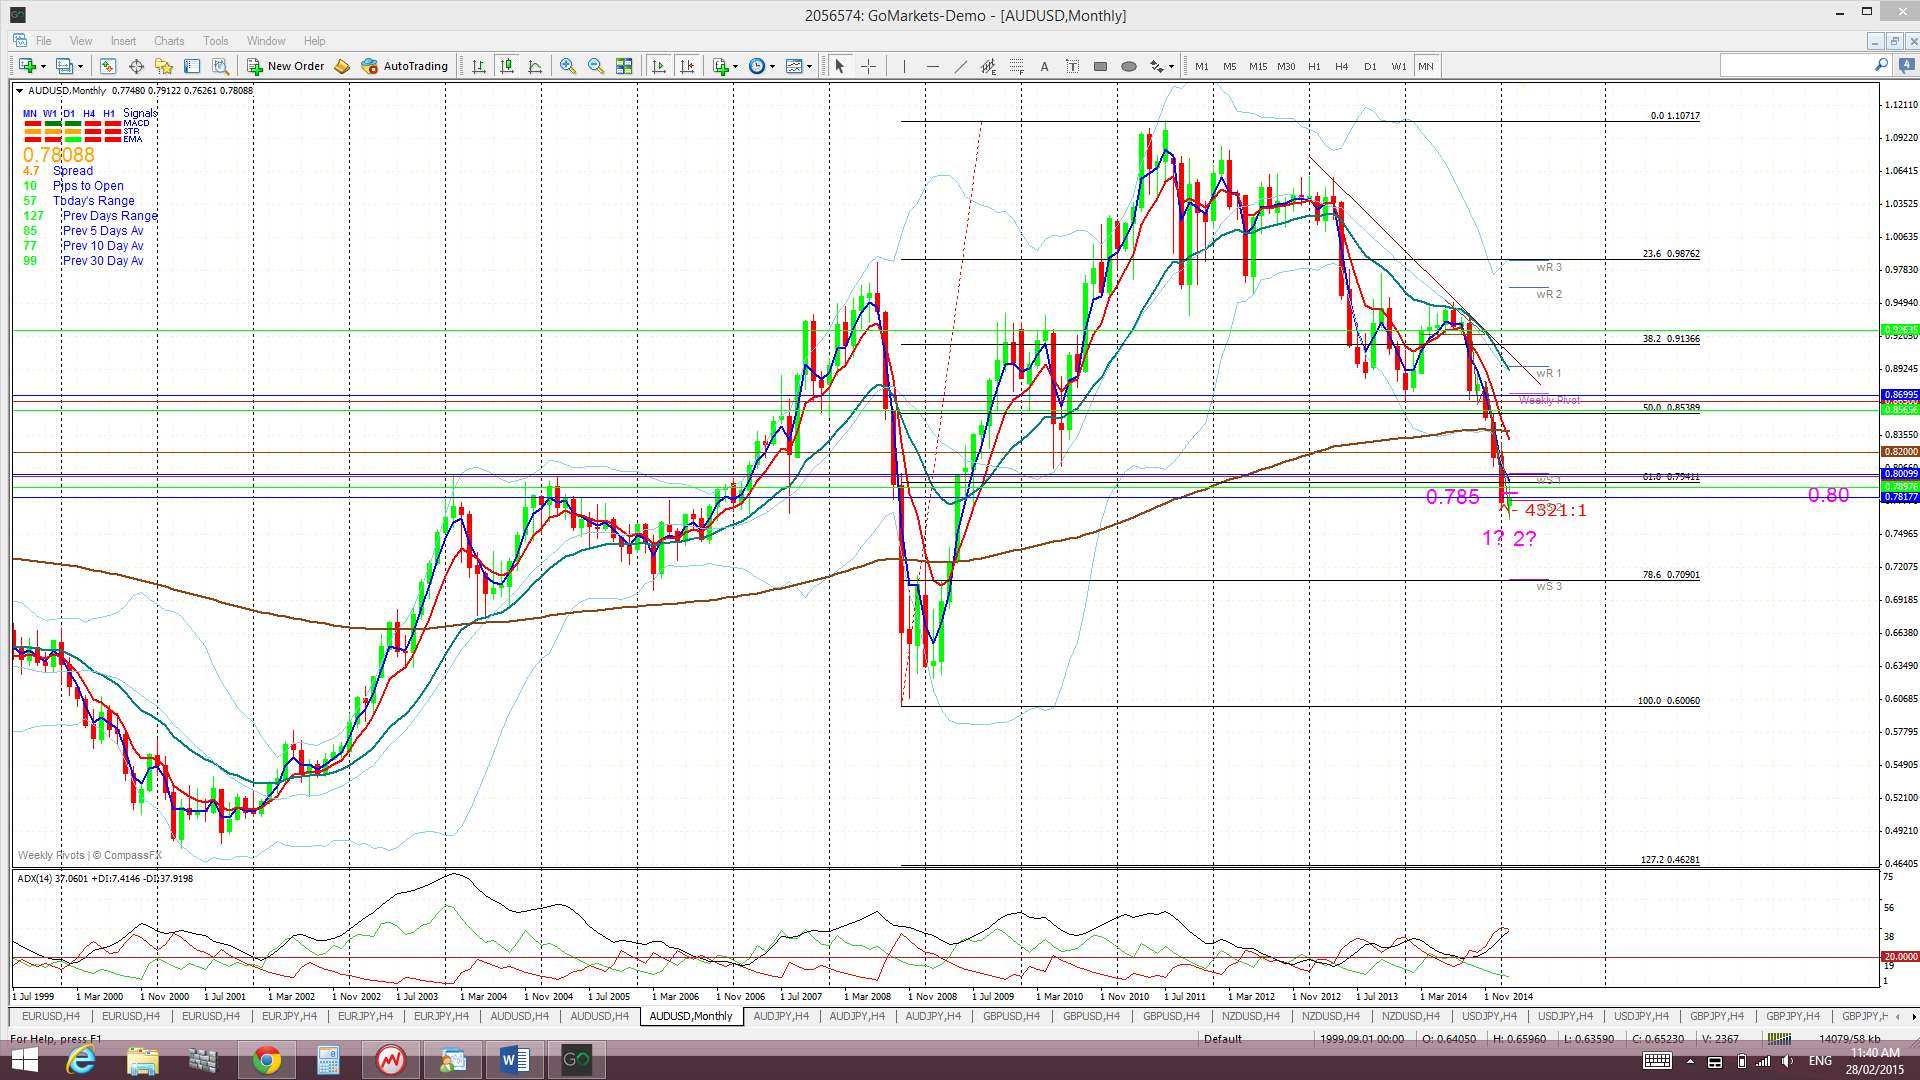
As I’ve been noting for the last few weeks though, the close and hold below 0.80 suggested the start of a possible 700 pip Bear Flag. Technical theory would have traders looking for a test of 0.80 before bearish follow through and, whilst we’ve already had one test, I’m still hoping for another. However, I’m keeping an open mind here as any renewed USD weakness could be a complete game changer here. I’ll will be watching for any reaction at 0.80, if price manages to get back up that far, to see whether this level will halt any A/U ascent.
Bear Flag? The break and hold below this 0.80 support suggests the start of a possible new 700 pip Bear Flag. It is no surprise that 0.80 had offered some decent support for the A/U as this was the region of the 61.8% fib from the 2008-2011 bull run and the 50% fib of the 2001-2011 bull run. The break and hold below 0.80 support suggests a trip lower and possibly down to the 70 region where the next layers of fib support kick in. I will still look for another possible test of the 0.80 level to join this Bear Flag trade.
As previously noted: A number of commentators are now claiming that the A/U may have bottomed here and to look for continued signs of reversal. I’ll be keeping an open mind here BUT, when you look at the monthly chart below, price does seem to be in a bit of ‘no-man’s land’. Had this recent bounce come off one of the noted fib levels I’d be more on board to support a pullback. Thus, despite this recent rally, I’m still thinking a test of the lower fibs near 0.72/0.71 could be in store.
Price is still trading above the Cloud on the 4hr chart (only just) but below the Cloud on the daily, weekly and monthly charts.
The weekly candle closed as a bearish coloured ‘Spinning Top’ and the monthly candle closed as bullish coloured ‘Spinning Top’; both candles reflecting the indecision that exists here.
Key risk events for the A/U this week stand out as the RBA Cash Rate & Statement as well as US NFP.
- I’m watching for any new TC signal on this pair, the 0.785 ‘neck line level and the 0.80 level.


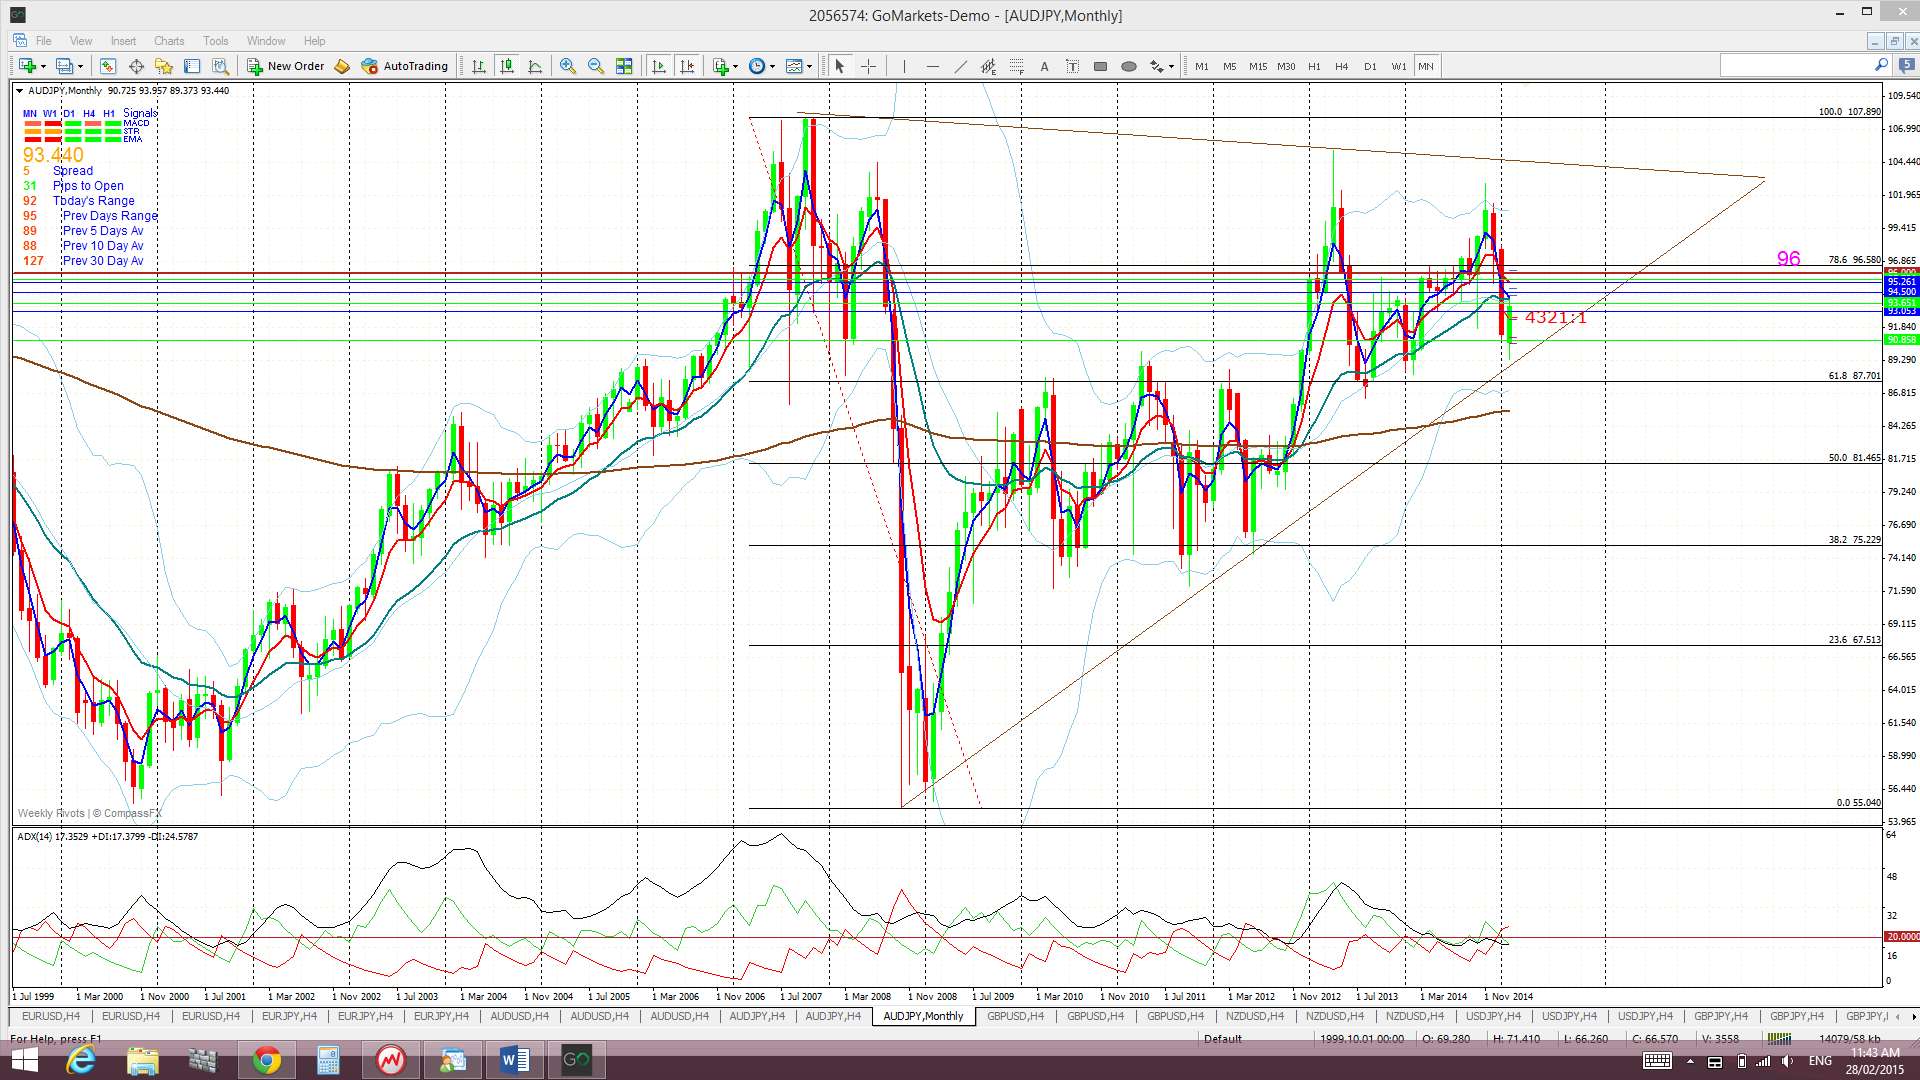
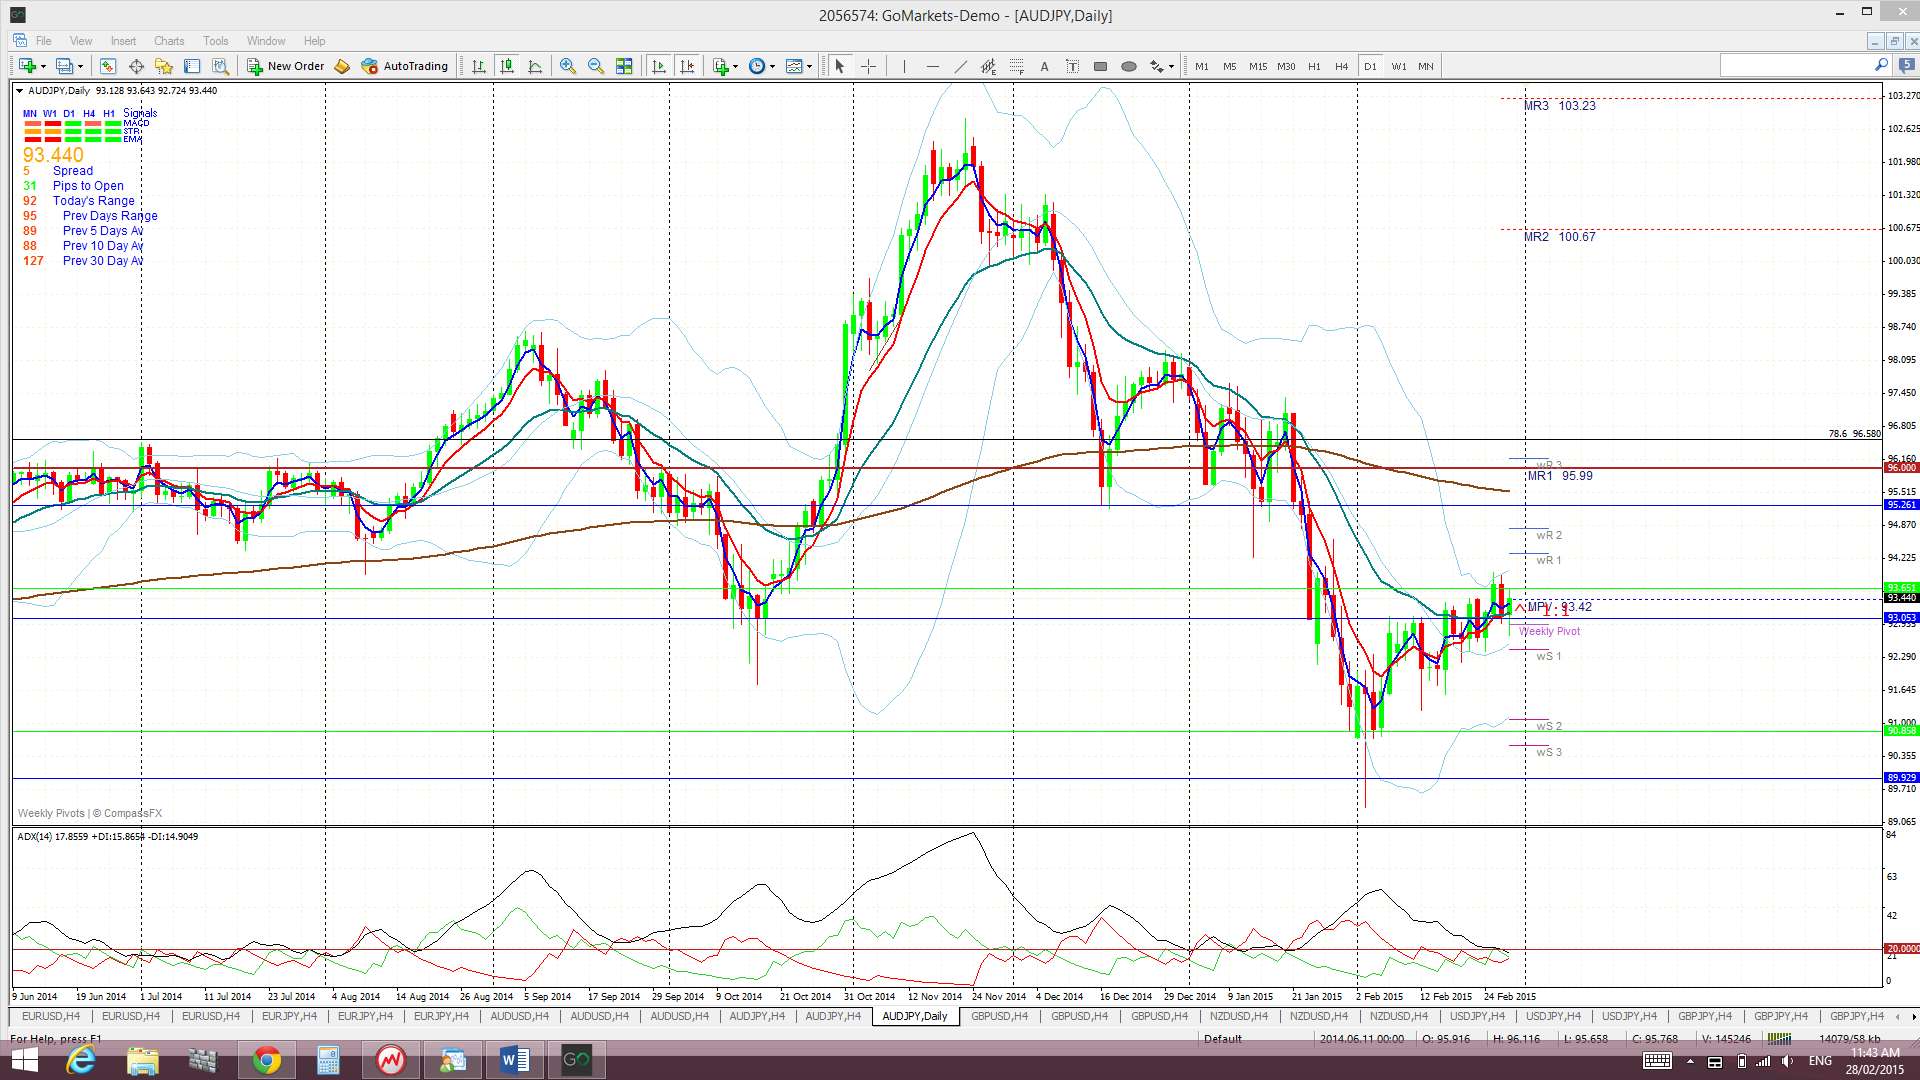
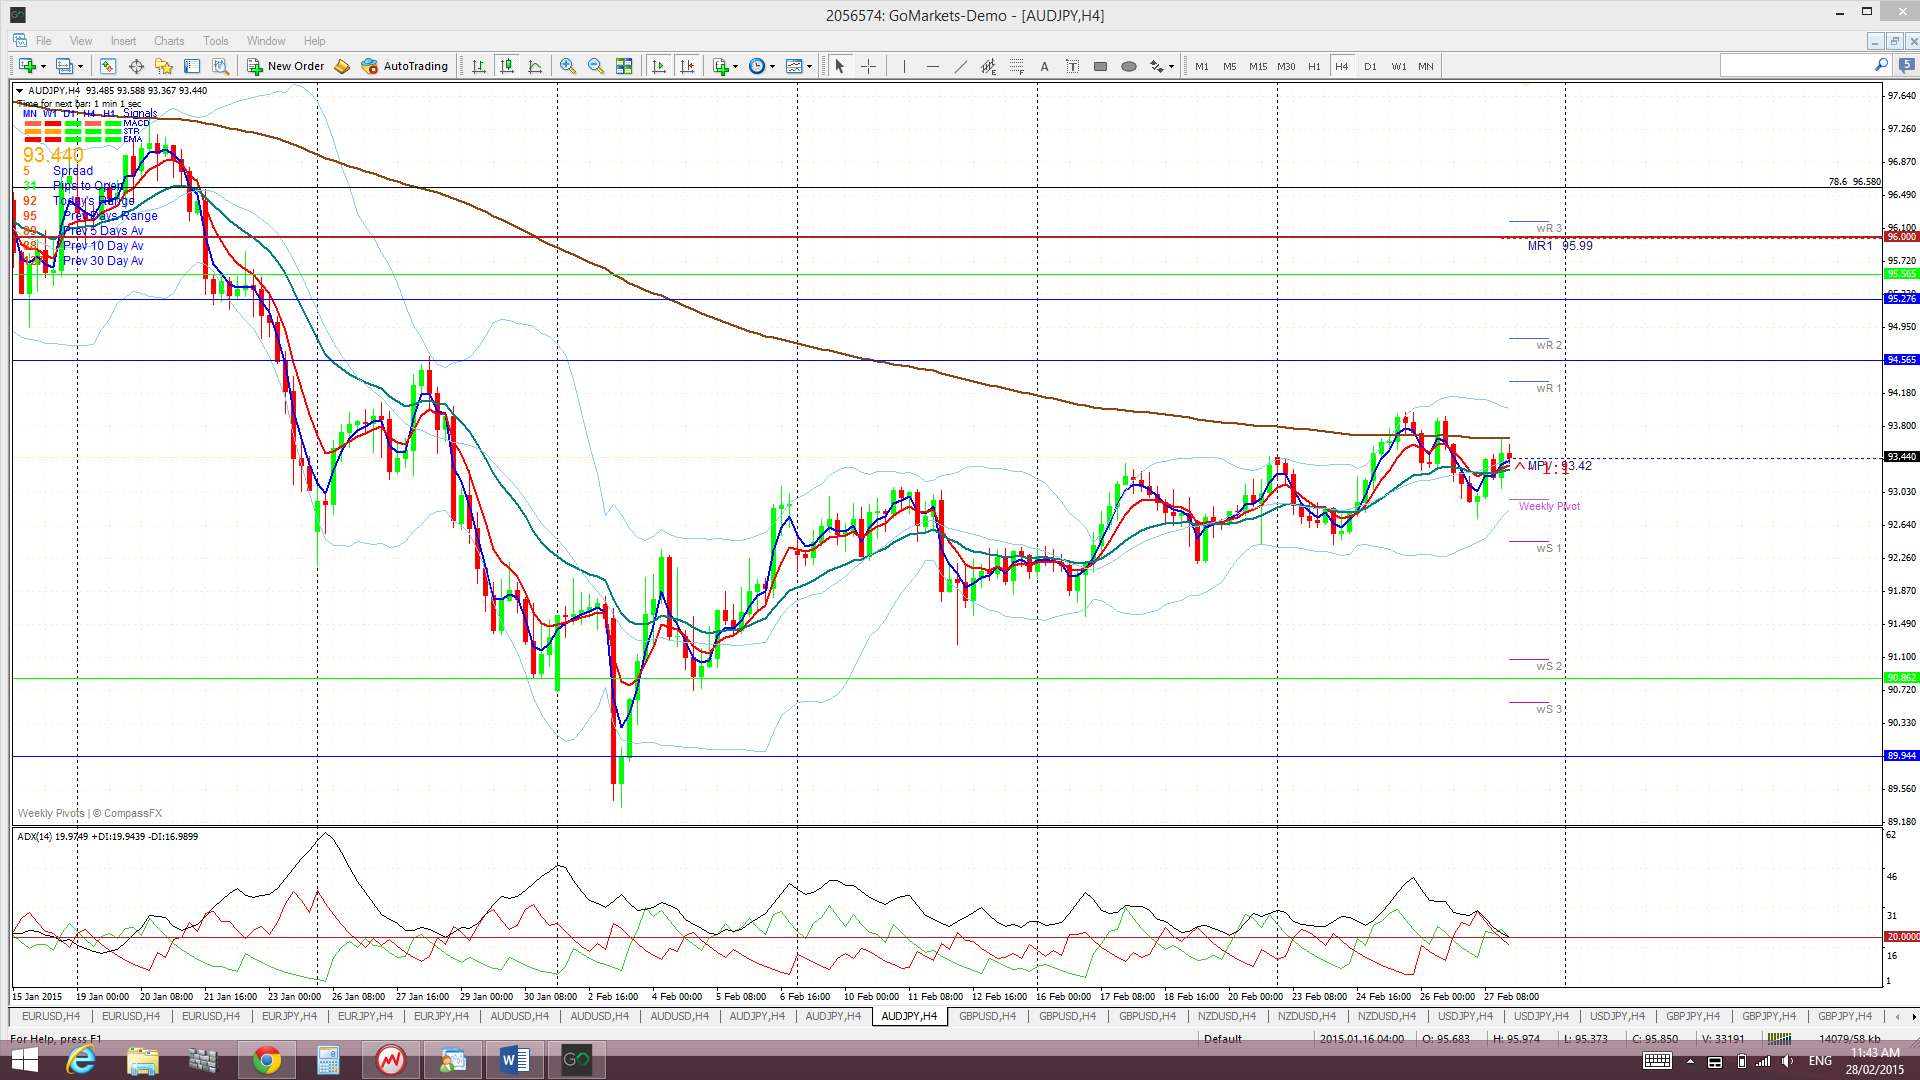
A/J: The A/J has continued to chop aimlessly under the 96 level as it has done for the last four weeks now. This pair essentially bounced up off the bottom monthly triangle trend line some weeks ago and looks to be back ranging within this monthly triangle pattern.
Price is still trading above the Cloud on the 4hr chart, below on the daily, in the Cloud on the weekly chart but above the Cloud on the monthly chart.
The weekly candle closed as a bullish coloured ‘Spinning Top’ candle, reflecting some indecision. The monthly candle closed as a bullish candle.
Key risk events for the A/J this week stand out as the RBA Cash Rate & Statement as well as US NFP.
- I’m watching for any new TC signal on this pair and the 96 level.

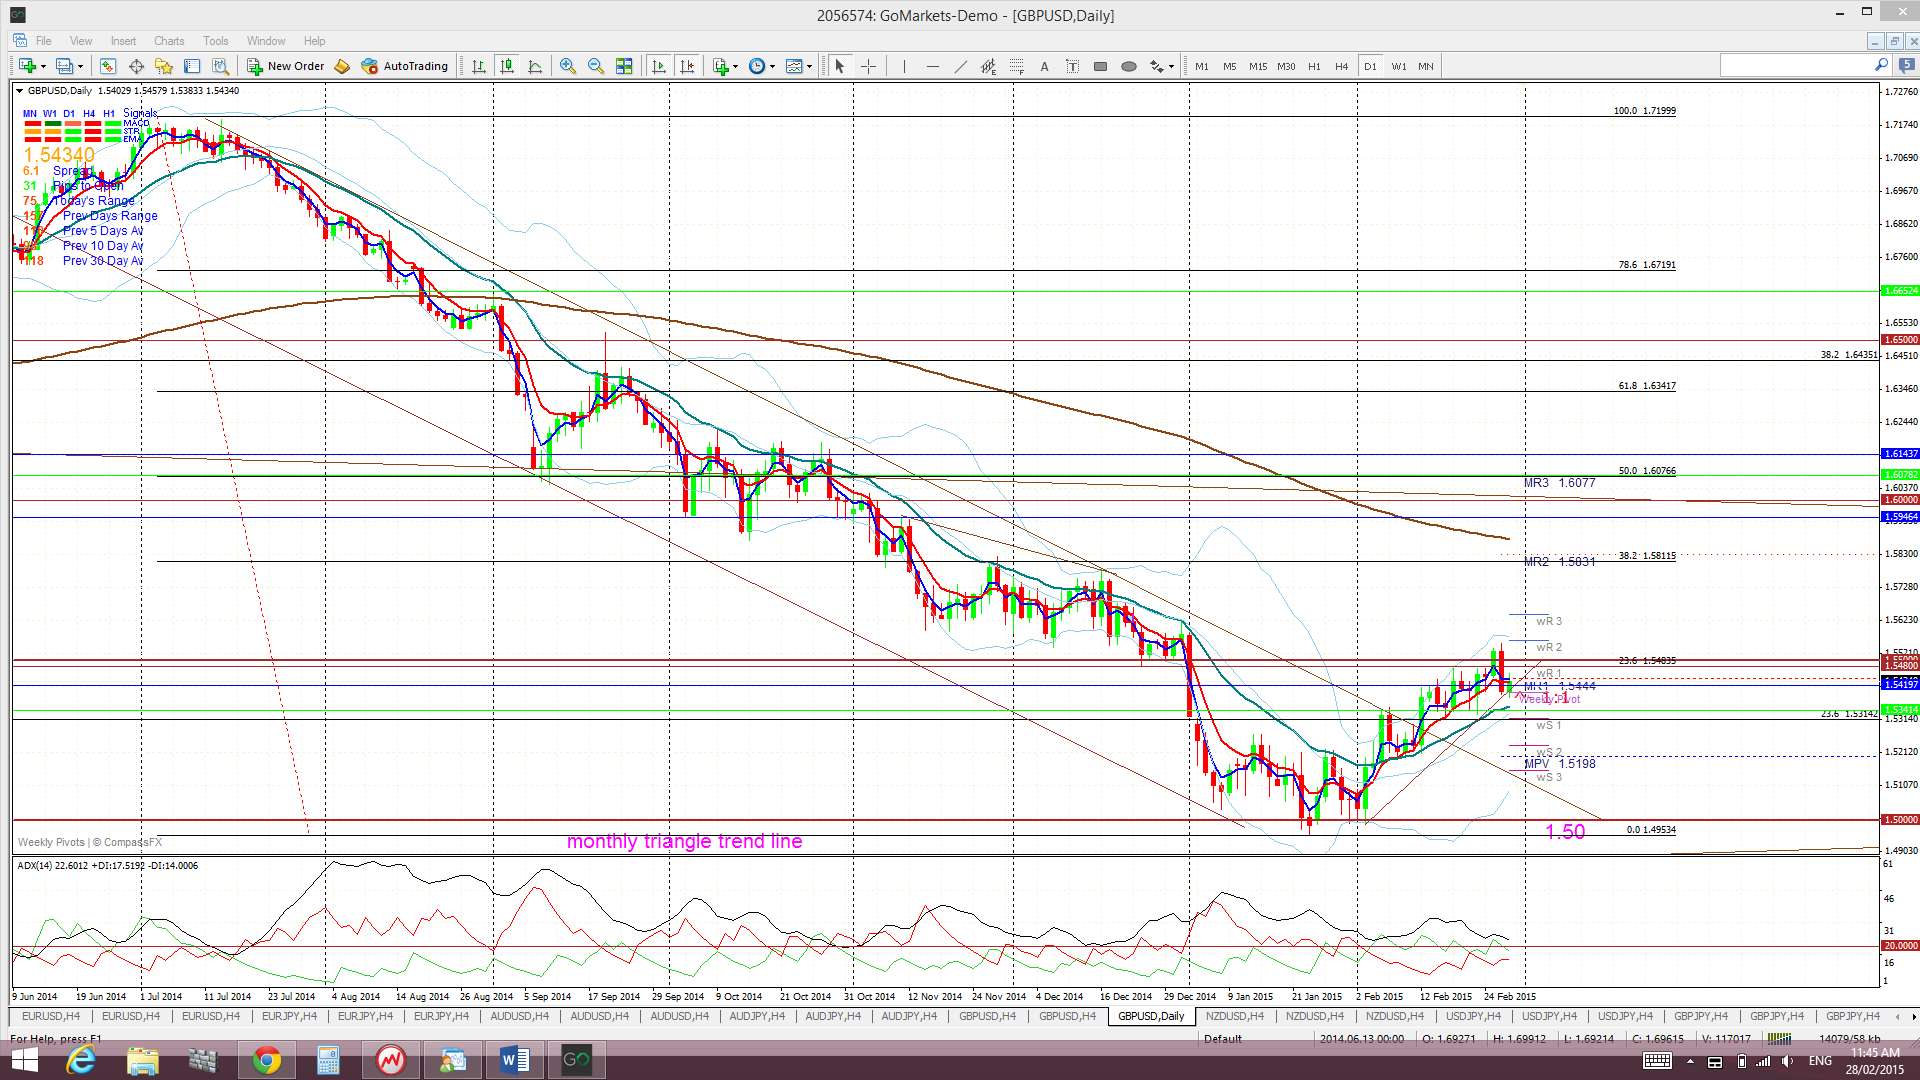
G/U: The Cable rallied last week and managed one daily candle close above the combined resistance of the 1.55 level and top of the daily Cloud region. This move was short lived though and USD strength on Thursday brought the GBP/USD tumbling lower again. It found support from a recent bull trend line and parked near this for the remainder of the week.
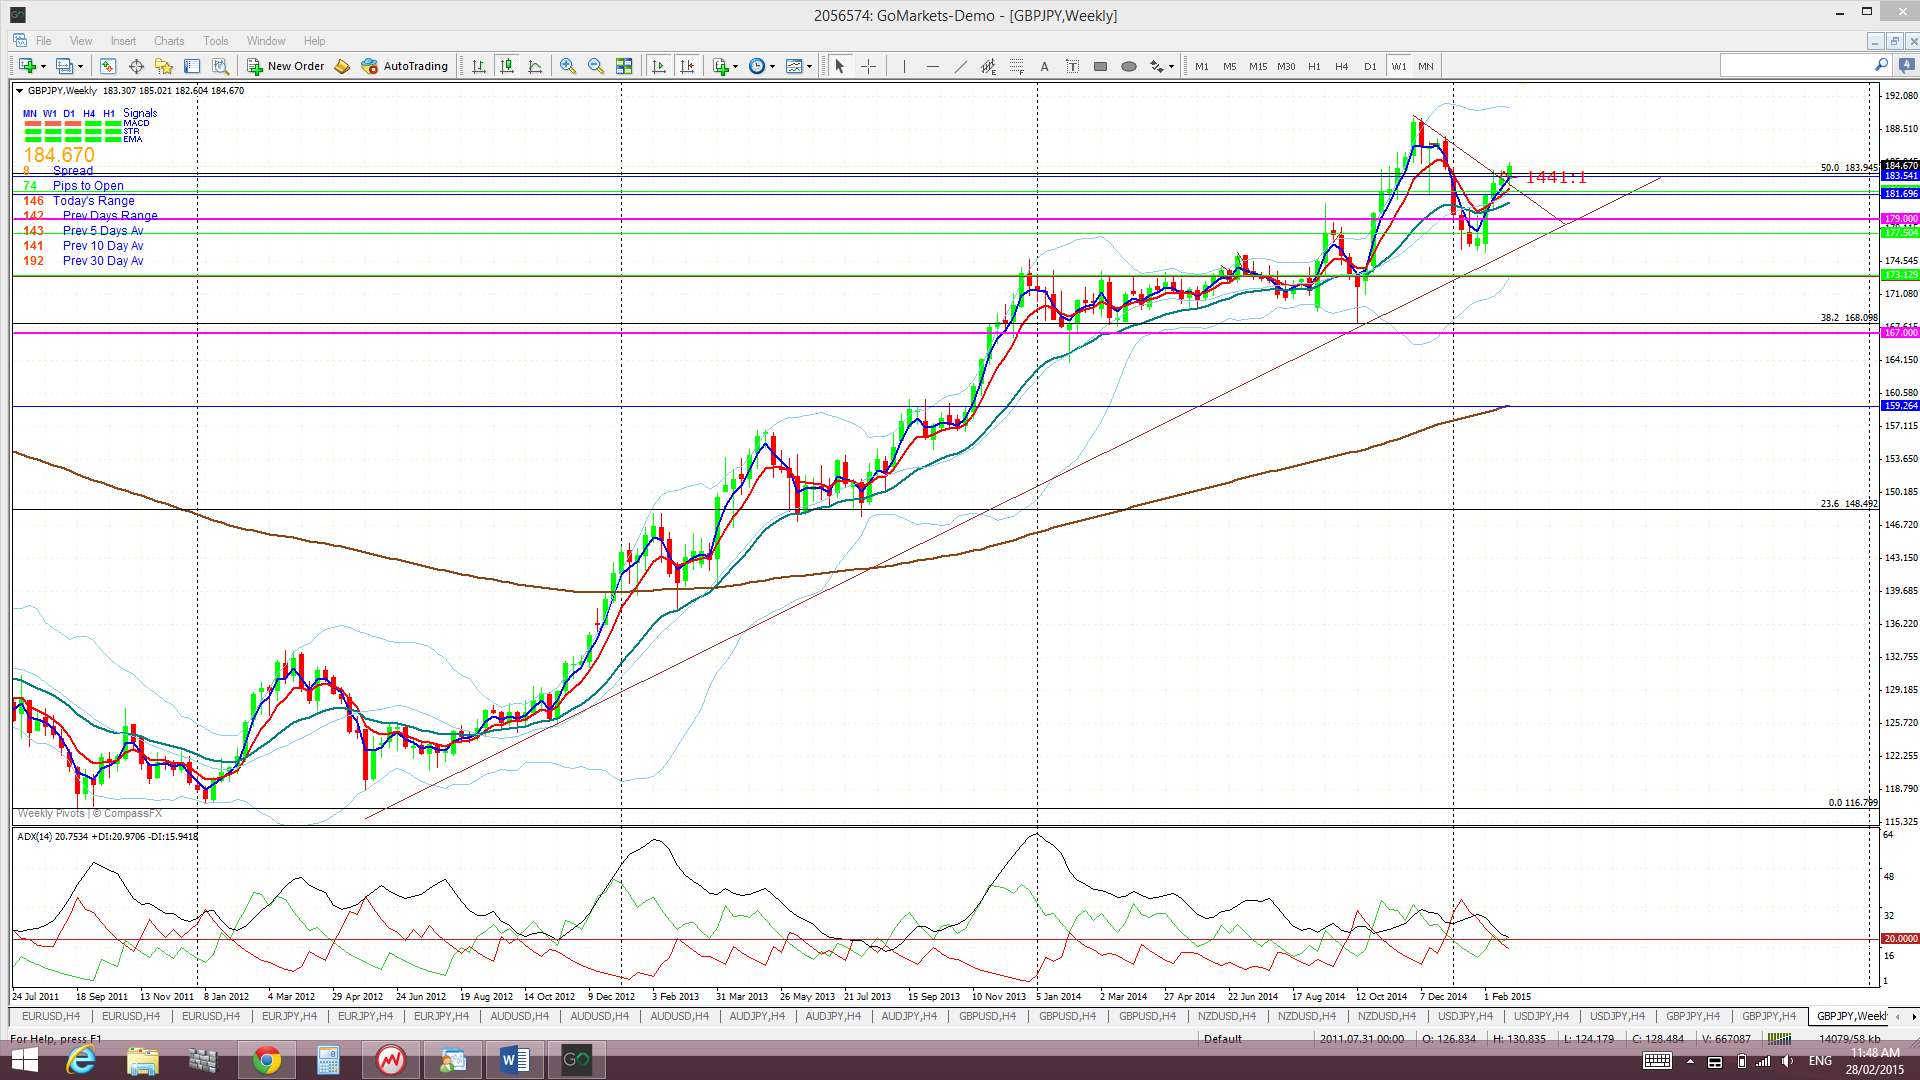
I still see that any new close and hold above the daily Cloud would be a bullish signal BUT managing the ‘hold’ part seems to be a problem here. However, a failure to hold above 1.55 would help to support a developing ‘Bear Flag’ on the weekly chart:
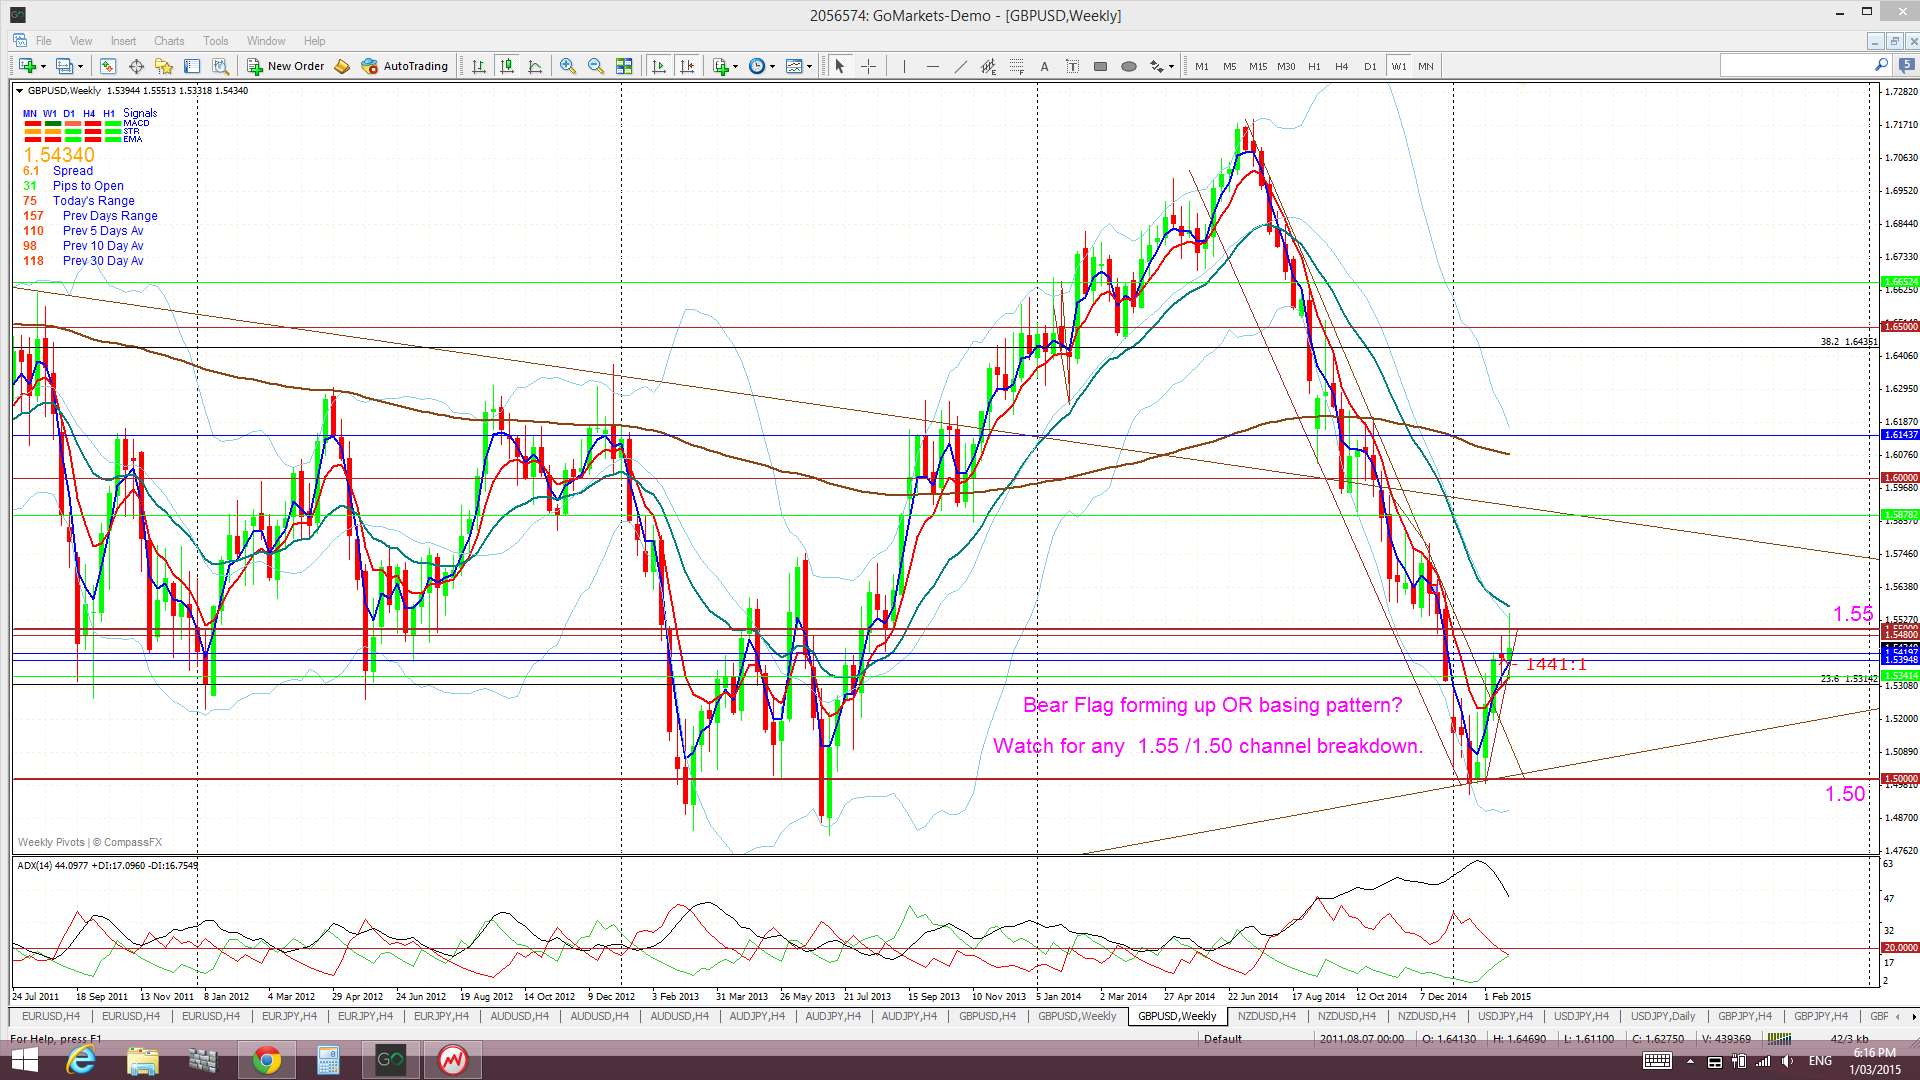
Price is still trading above the Cloud on the 4hr chart, IN the Cloud on the daily chart but below on the weekly and monthly charts. Keep an eye on the daily Cloud chart though as any new close and hold above the daily Cloud would have be seen as bullish:

The weekly candle closed as a bullish, almost ‘engulfing’ candle. The monthly candle closed as a bullish coloured ‘Inside’ candle reflecting some indecision here.
Risk events for the GBP/USD this week stand out as GBP Manufacturing, Construction & Services PMIs, a BoE Gov Carney speech, Interest Rate news with accompanying BoE Statement as well as US NFP.
As with the E/U, I can see arguments/logic supporting GBP/USD price action trying to carve out a base here as much as for further bearish potential. I consider that the outcome on this pair may also hinge on the USD and whether it breaks or retreats from the key 95.50 level.
- I’m watching for any new TC signal on this pair, the daily Cloud and the 1.55 level.


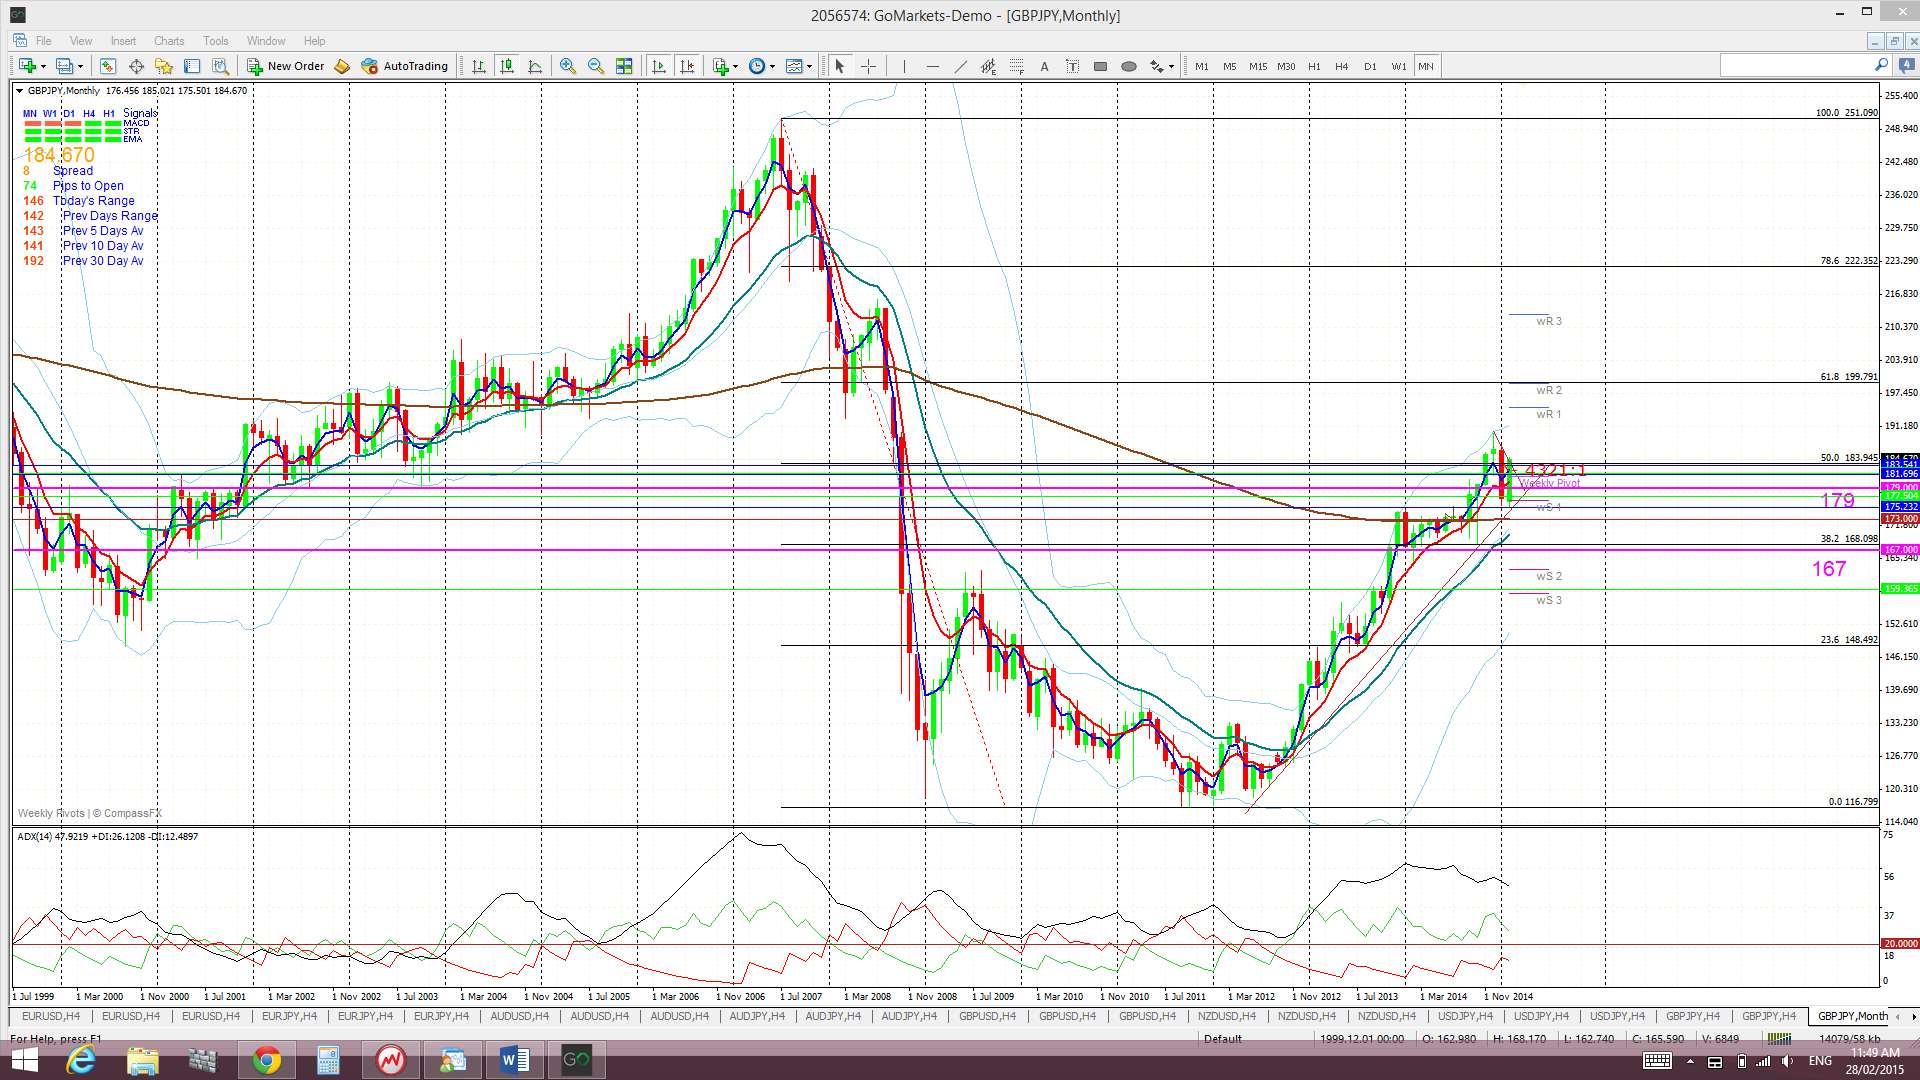
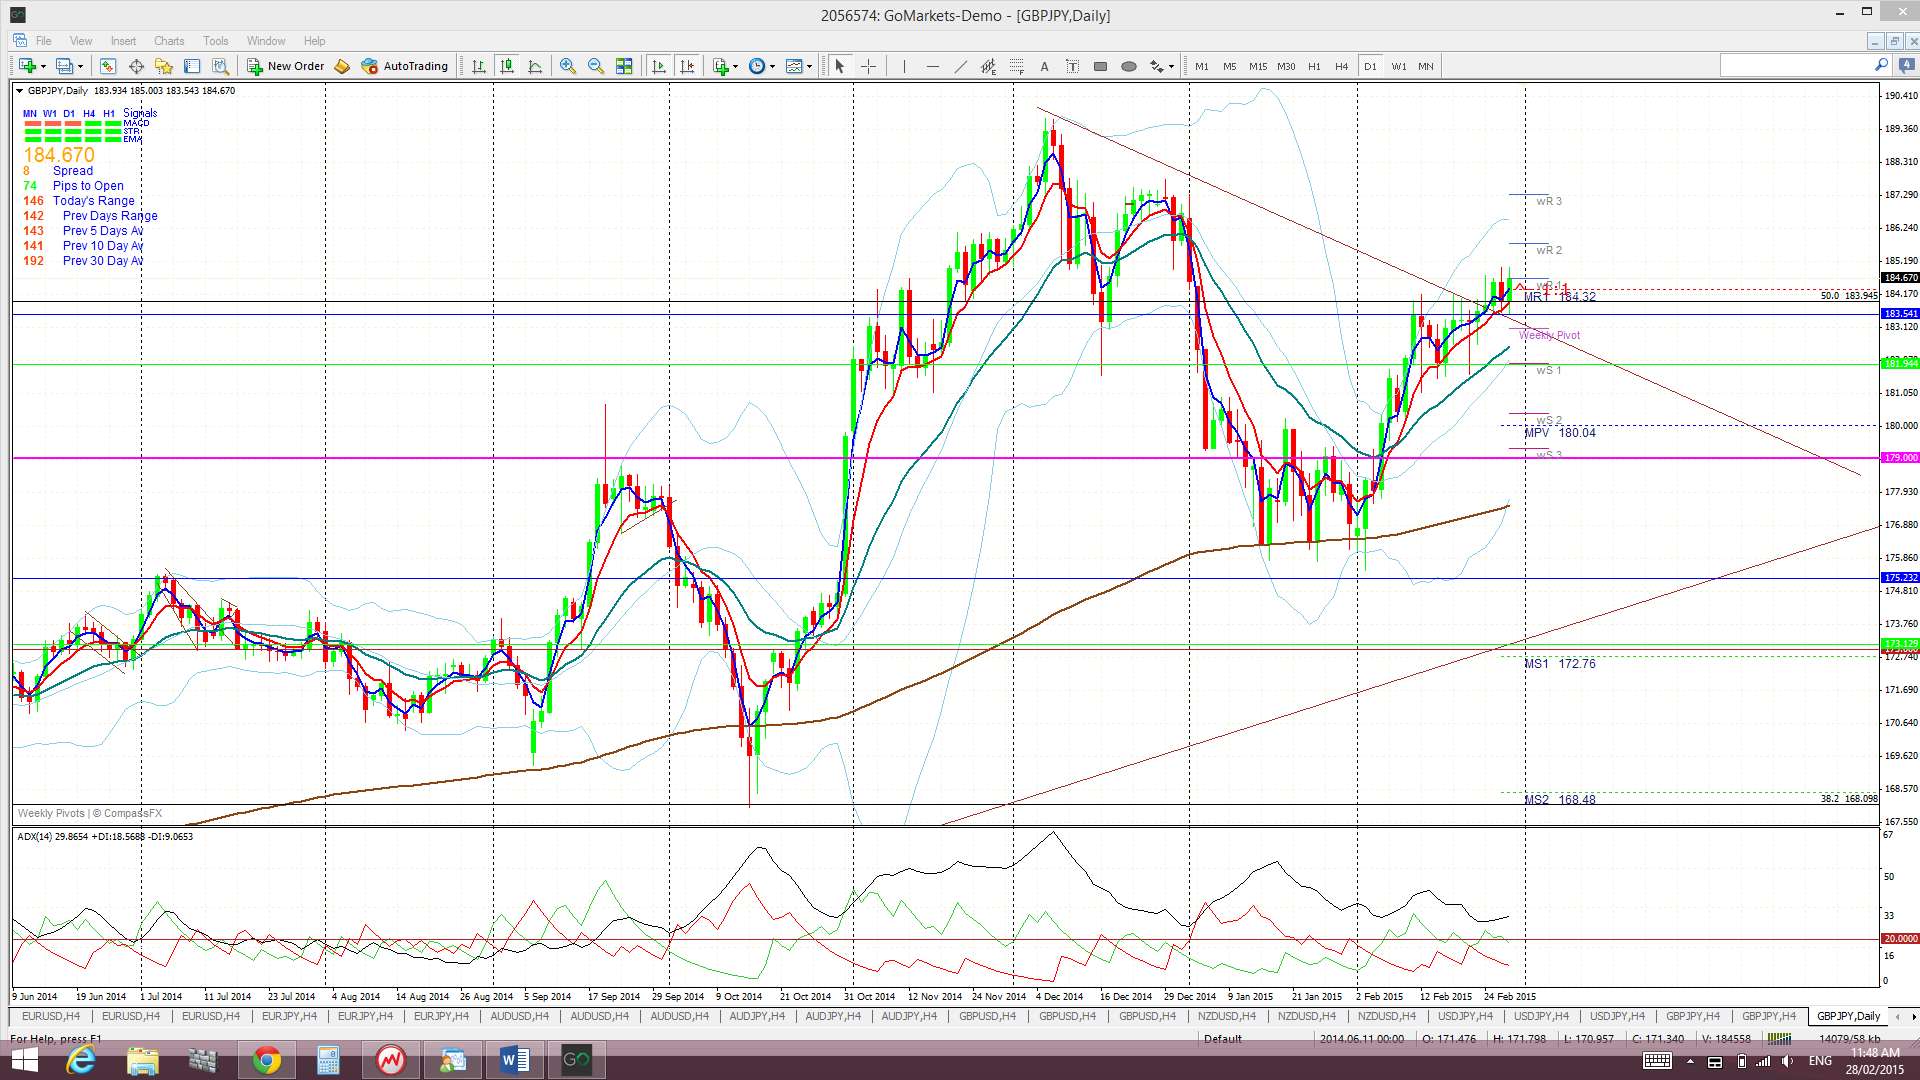
GBP/JPY: The GBP/JPY seemed to break up and out from a triangle last week on the daily chart time frame and has continued from there. Price action has been choppy again here though as it has been navigating a major Fib level at the 50% Fib of the 2007-2012 bear move.
Two key S/R levels on the G/J chart: The monthly chart shows a band of choppy congested activity across the chart. This band is defined by rather strong S/R levels at 179 and 167. The 179 level seems to be a key demarcation level and a close and hold above this would suggest bullish continuation. The key 173 level lies midway between these two S/R levels. Targets for any bullish continuation include the 61.8% fib near 200 and the 78.6% fib near 222.
Price is still trading above the Ichimoku Cloud on the 4hr, daily, weekly and monthly charts which is bullish.
The weekly candle closed as a bullish candle. The monthly candle closed as a large bullish candle.
Risk events for the GBP/JPY this week stand out as GBP Manufacturing, Construction & Services PMIs, a BoE Gov Carney speech, Interest Rate news with accompanying BoE Statement as well as US NFP.
- I’m watching for any new TC signal on this pair and the weekly chart’s triangle trend lines.

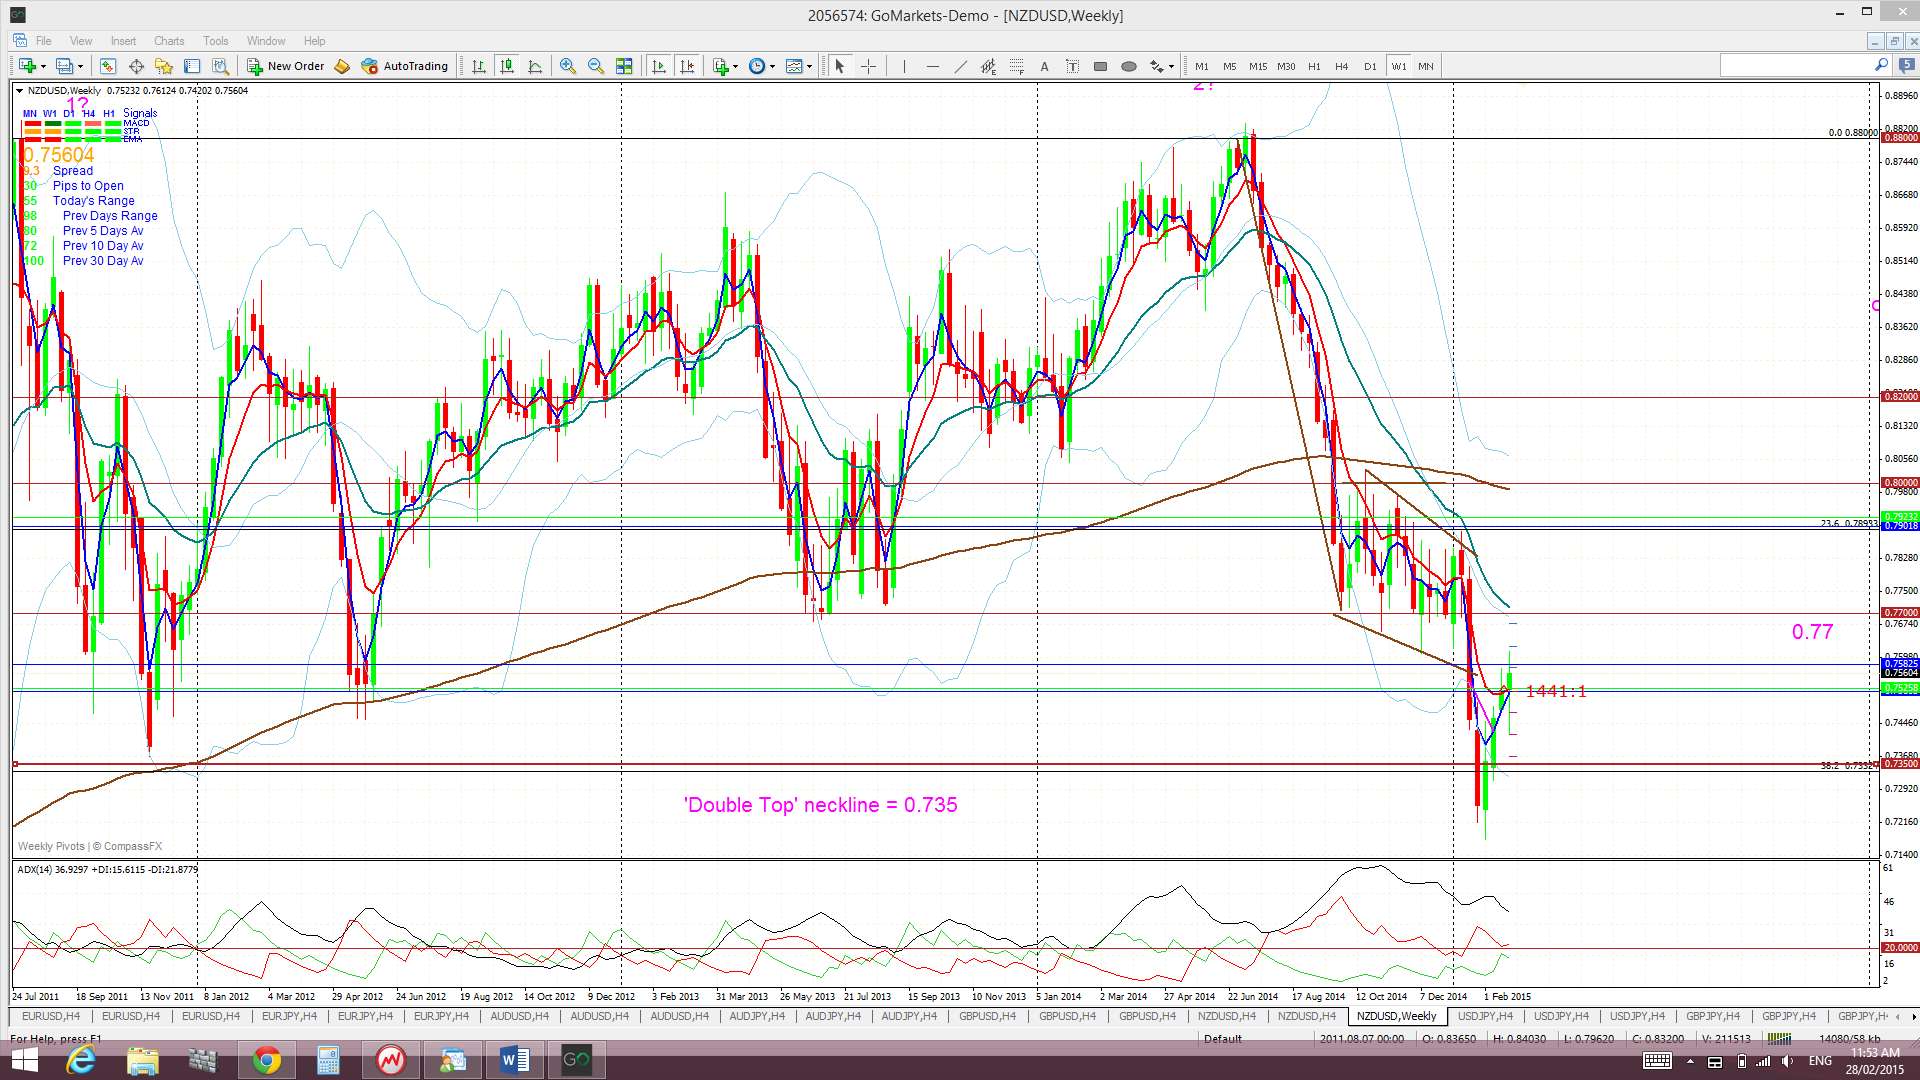
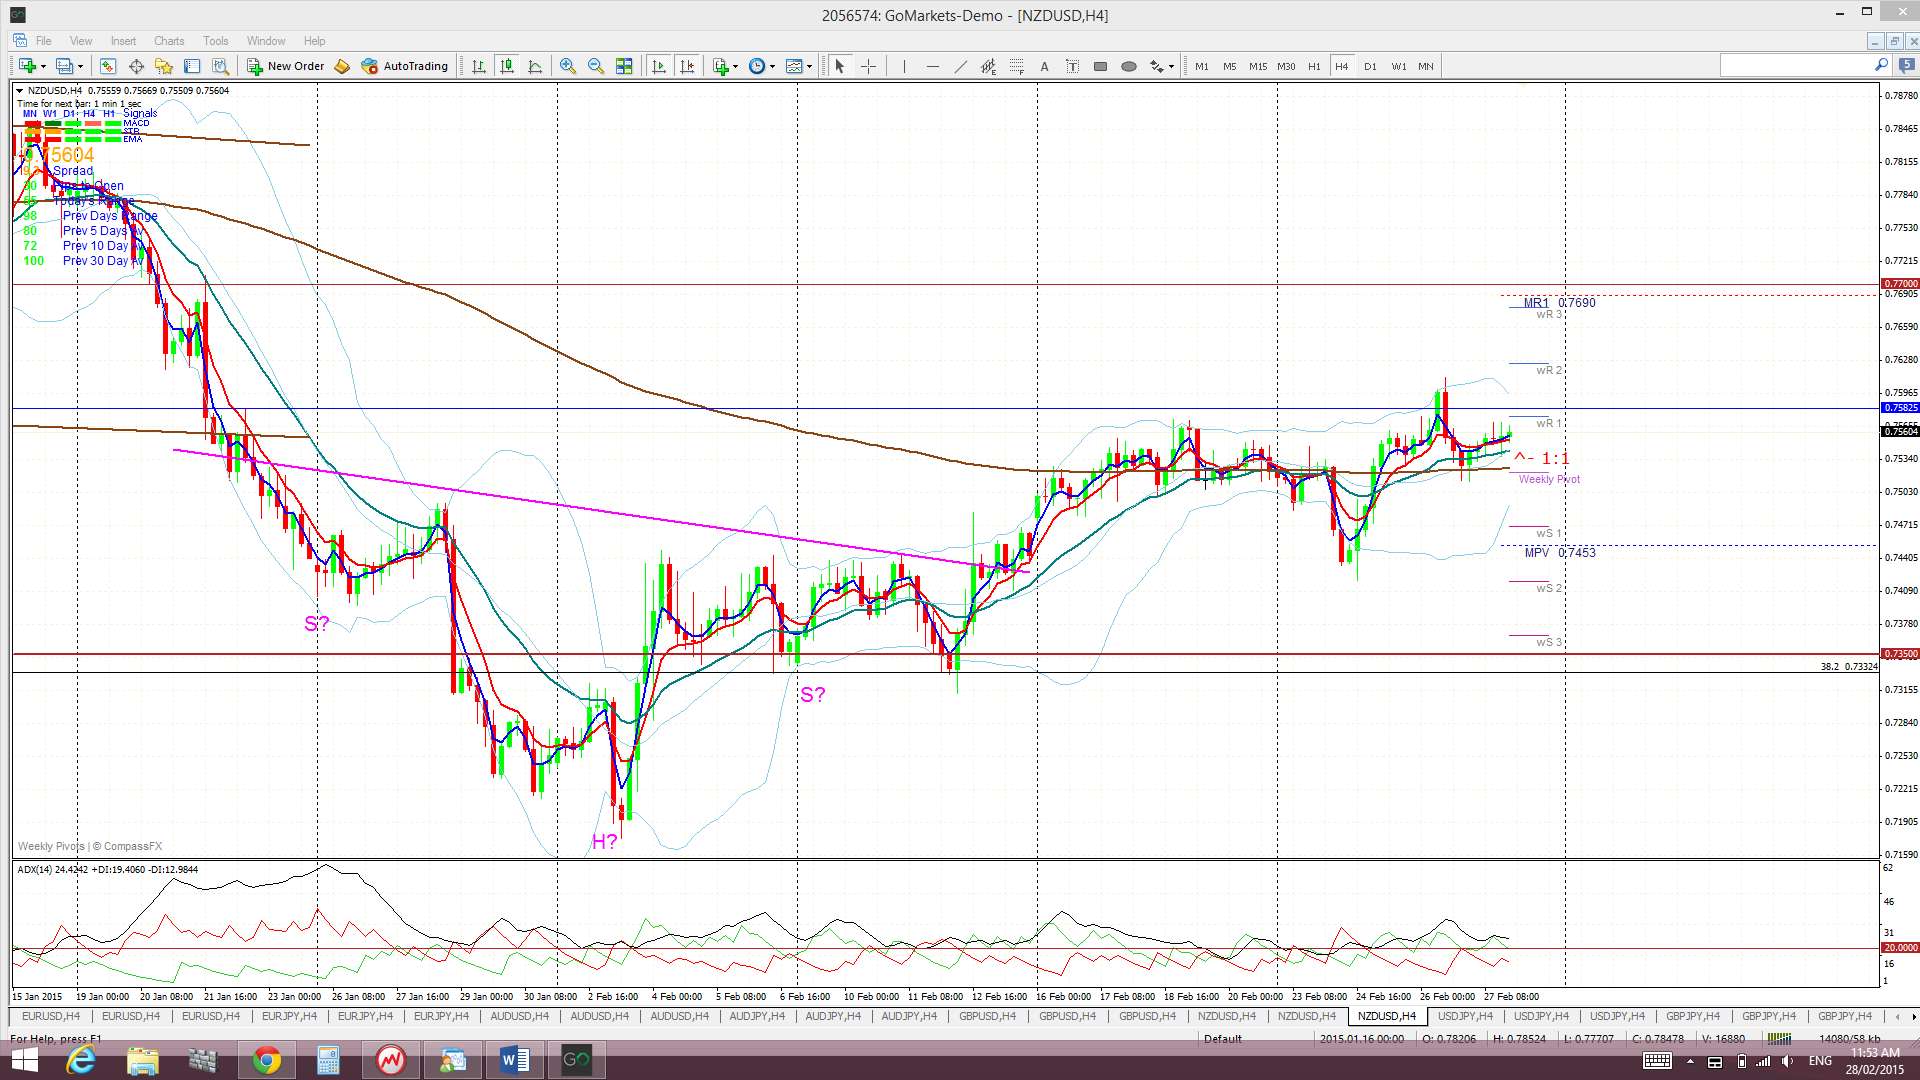
Kiwi: NZD/USD: The Kiwi chopped a bit higher and has managed to hold above the key S/R level of 0.735 and break above the 4hr 200 EMA. The pivotal 0.77 level is just above price and will be a key level to watch if price keeps edging higher.
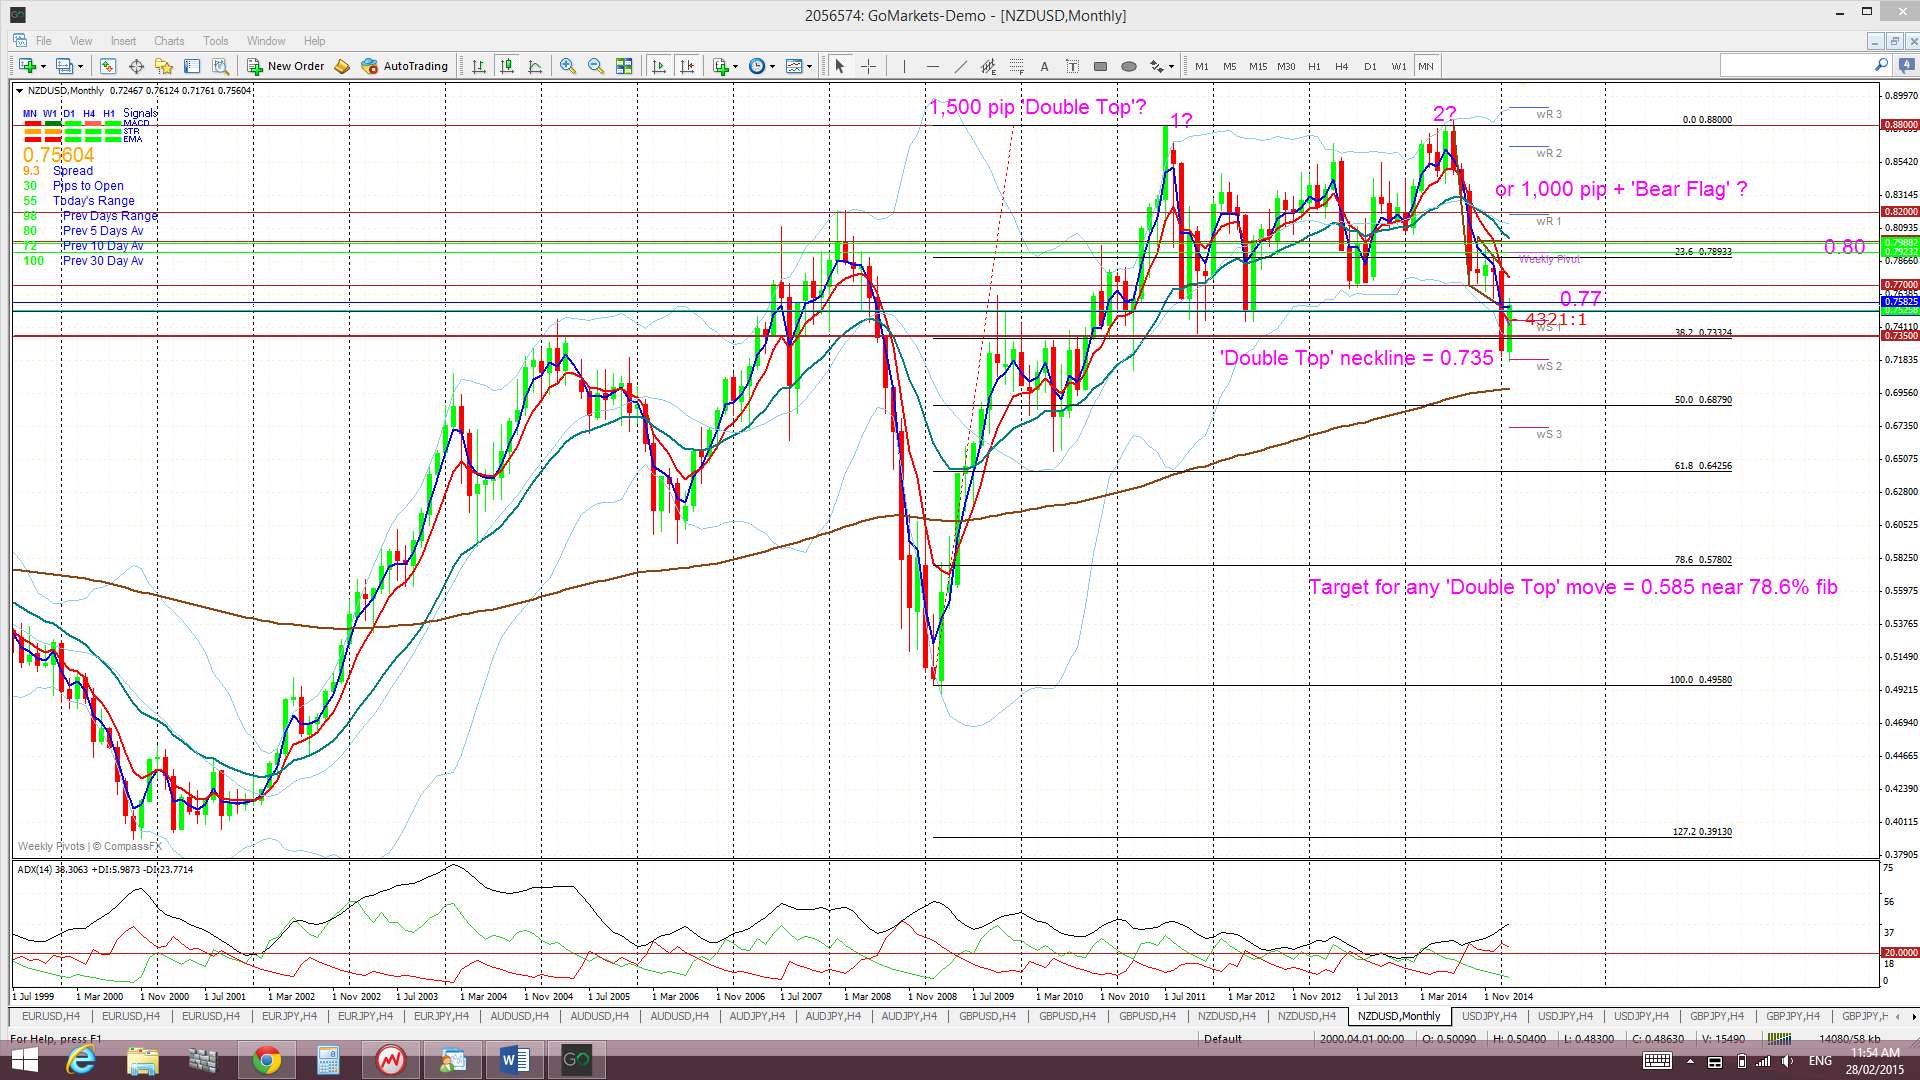
I have to admit I’m a bit confused with this pair and think that the Kiwi might be at the mercy of the next USD move and whether that move is up or down is still not clear. The monthly chart seems to support that the Kiwi is back to consolidating within the trading channel bound by 0.88 and 0.735. The weekly chart can still be stretched to see a Bear Flag brewing and a test of the breakout 0.77 region might still be forming up. I am hoping that the USD index will breakout, either up or down, and that this may help make the picture here a little easier to interpret.
Bear Flag for Kiwi on Weekly chart? The hold below 0.77 continues to support the start of a possible 1,000 pip Bear Flag. The 0.77 level represents the previous swing low for the period during mid-2013 and, prior to then, from mid-2012. The ‘Flag Pole’ for the Kiwi’s ‘Bear Flag’ is about 1,100 pips. Thus, any bearish breakdown and continuation below the ‘Flag’ trend line may be expected to extend by 1,100 pips as well. This would bring the Kiwi down to near 0.67 cents. This level is between the 61.8 and 78.6% fibs of the 2009-2014 bull run. I was looking for a test of 0.77 to enter this trade but this has not evolved as yet.
‘Double Top’ breakdown on Monthly chart? The monthly chart reveals a possible ‘Double Top’ pattern with a neck line at 0.735. The monthly candle close below this level for January suggested a possible 2,000 pip bearish follow through move as this is the height of the ‘Double Top’ BUT there does not seem to be a hold below this key level JUST YET. This may still well evolve, especially if the USD index regains its bullish mojo but any reversal on the USD index could see Kiwi continue to bounce up off this major support.
Fib levels shows other possible targets for any bearish continuation below 0.77 as being the:
- 38.6% fib near 73.5.
- 50% fib near 70 and the monthly 200 EMA.
- 61.8% fib near 0.65.
Price is still trading above the Ichimoku Cloud on the 4hr chart, below on the daily and weekly charts and in the middle of the Cloud on the monthly chart.
The weekly candle closed as another small bullish candle but with longer shadows this week. The monthly candle closed as a bullish candle.
- I’m watching for any new TC signal on this pair, the 0.735 and 0.77 levels.

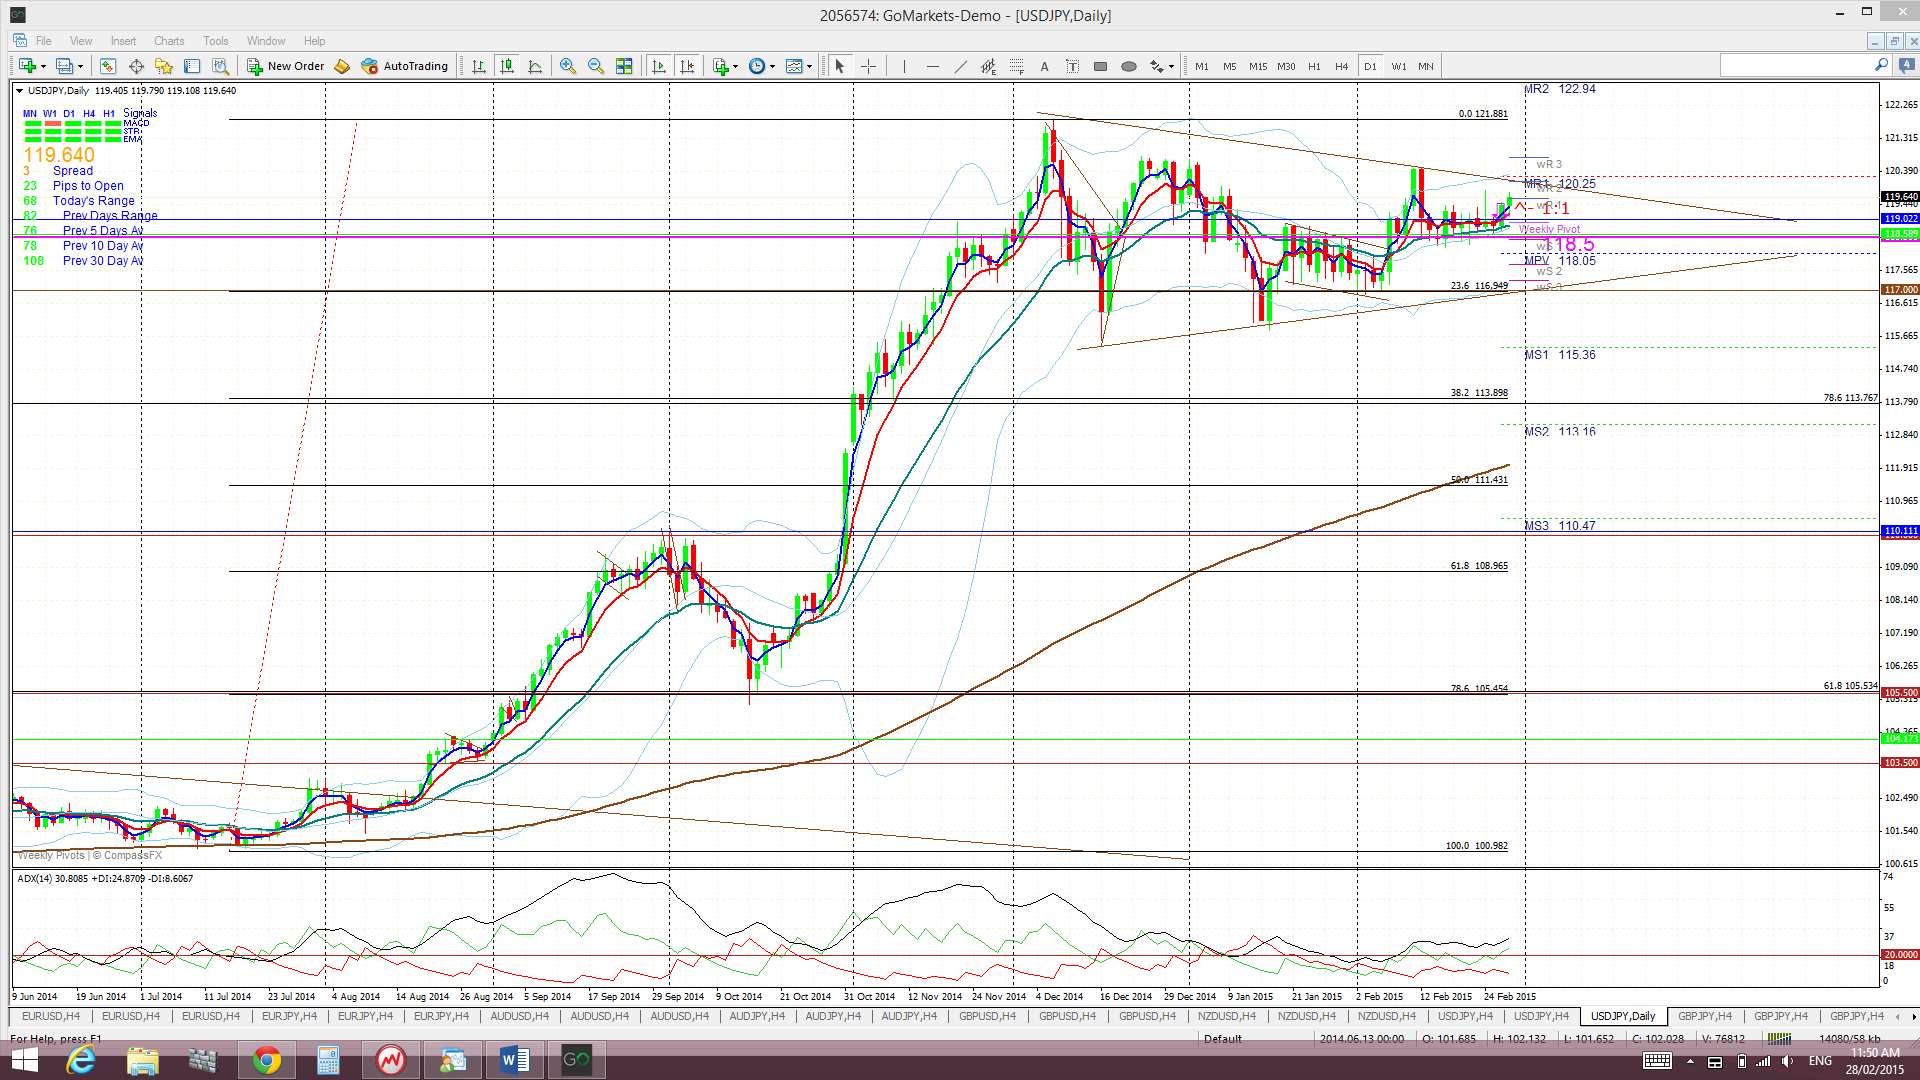
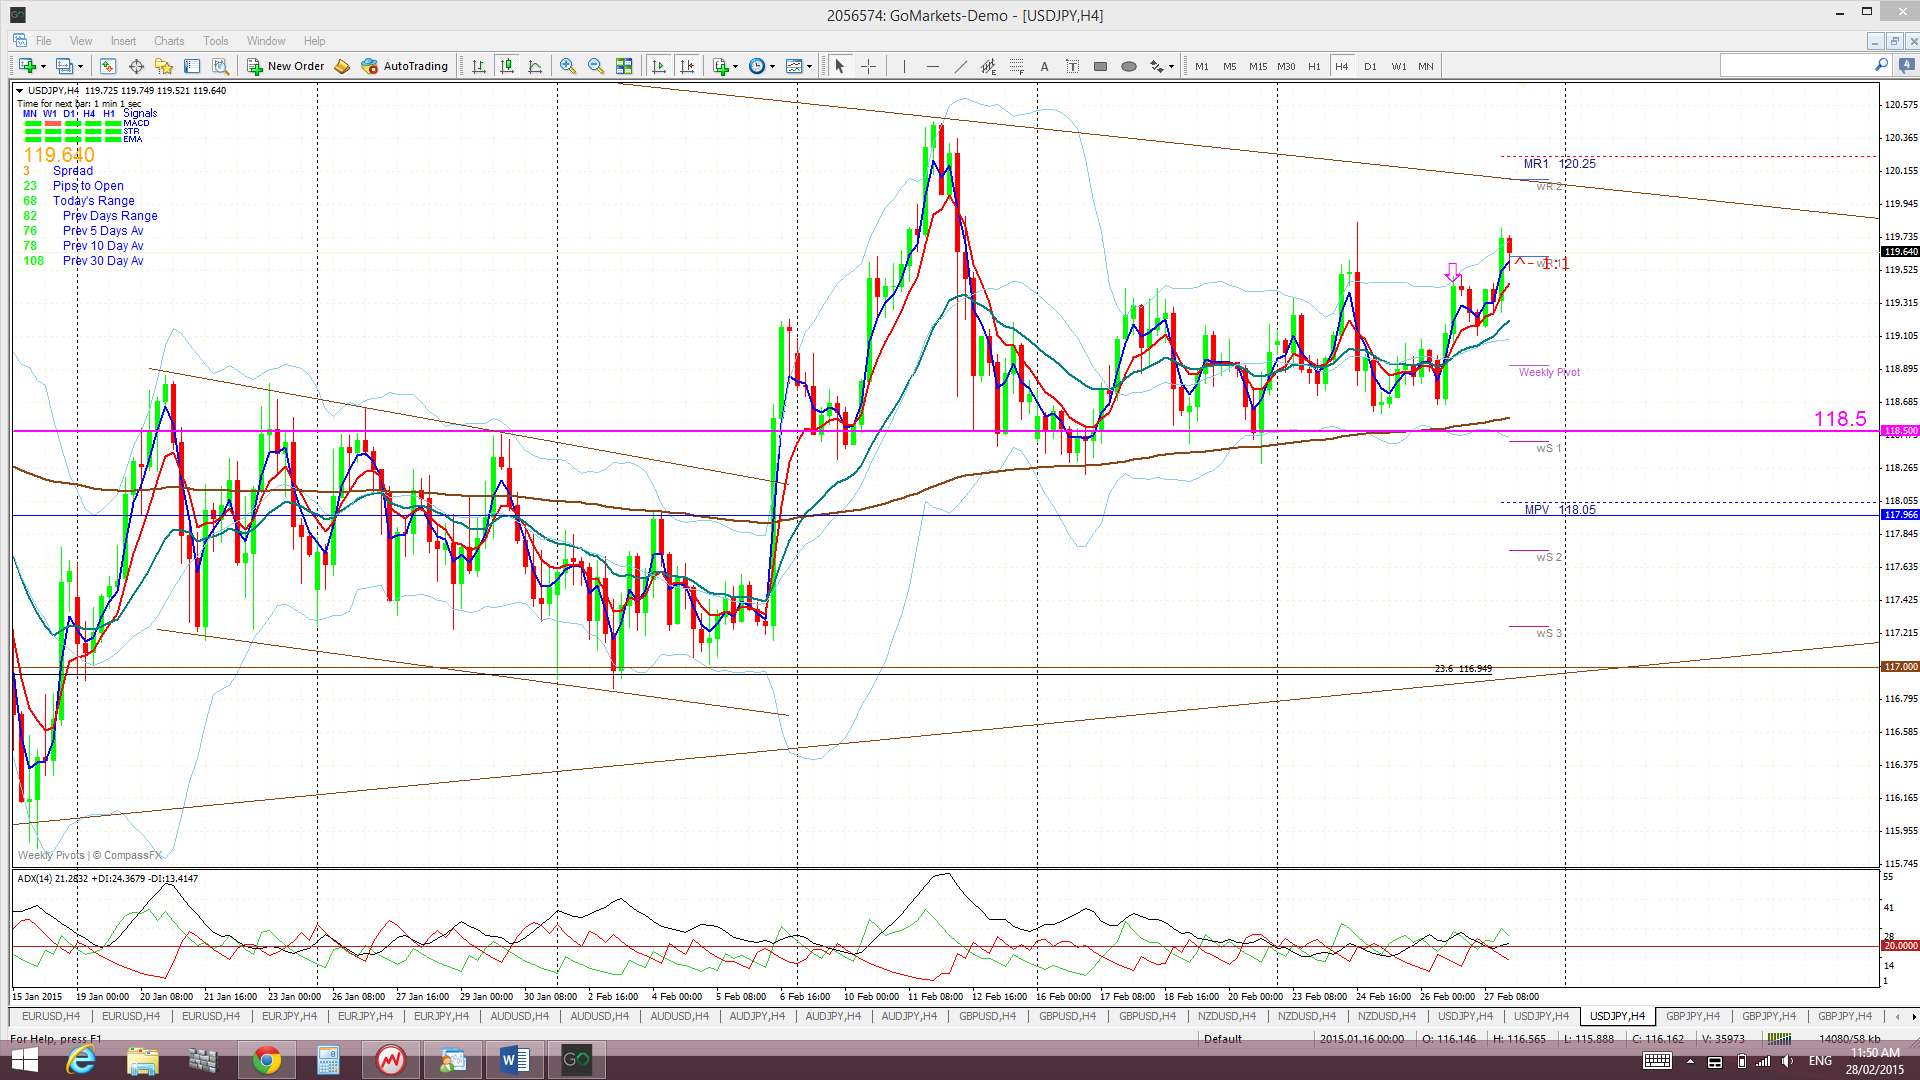
The Yen: U/J: The U/J continued to chop around within the daily chart’s triangle pattern and above 118.5 support last week. The rally with the USD on Thursday triggered a new TC signal BUT I will wait for any bullish daily chart triangle breakout before taking any LONG trade here, although, price has edged much closer to this trend line.
Price is now trading above the Cloud on the 4hr, daily, weekly and monthly charts which is bullish. November 2013 was the first monthly candle close above the Ichimoku Cloud since mid-2007 and the bullish hold above the monthly Cloud continues to be noteworthy.
The weekly candle closed as another small bullish candle. The monthly candle closed as a bullish candle.
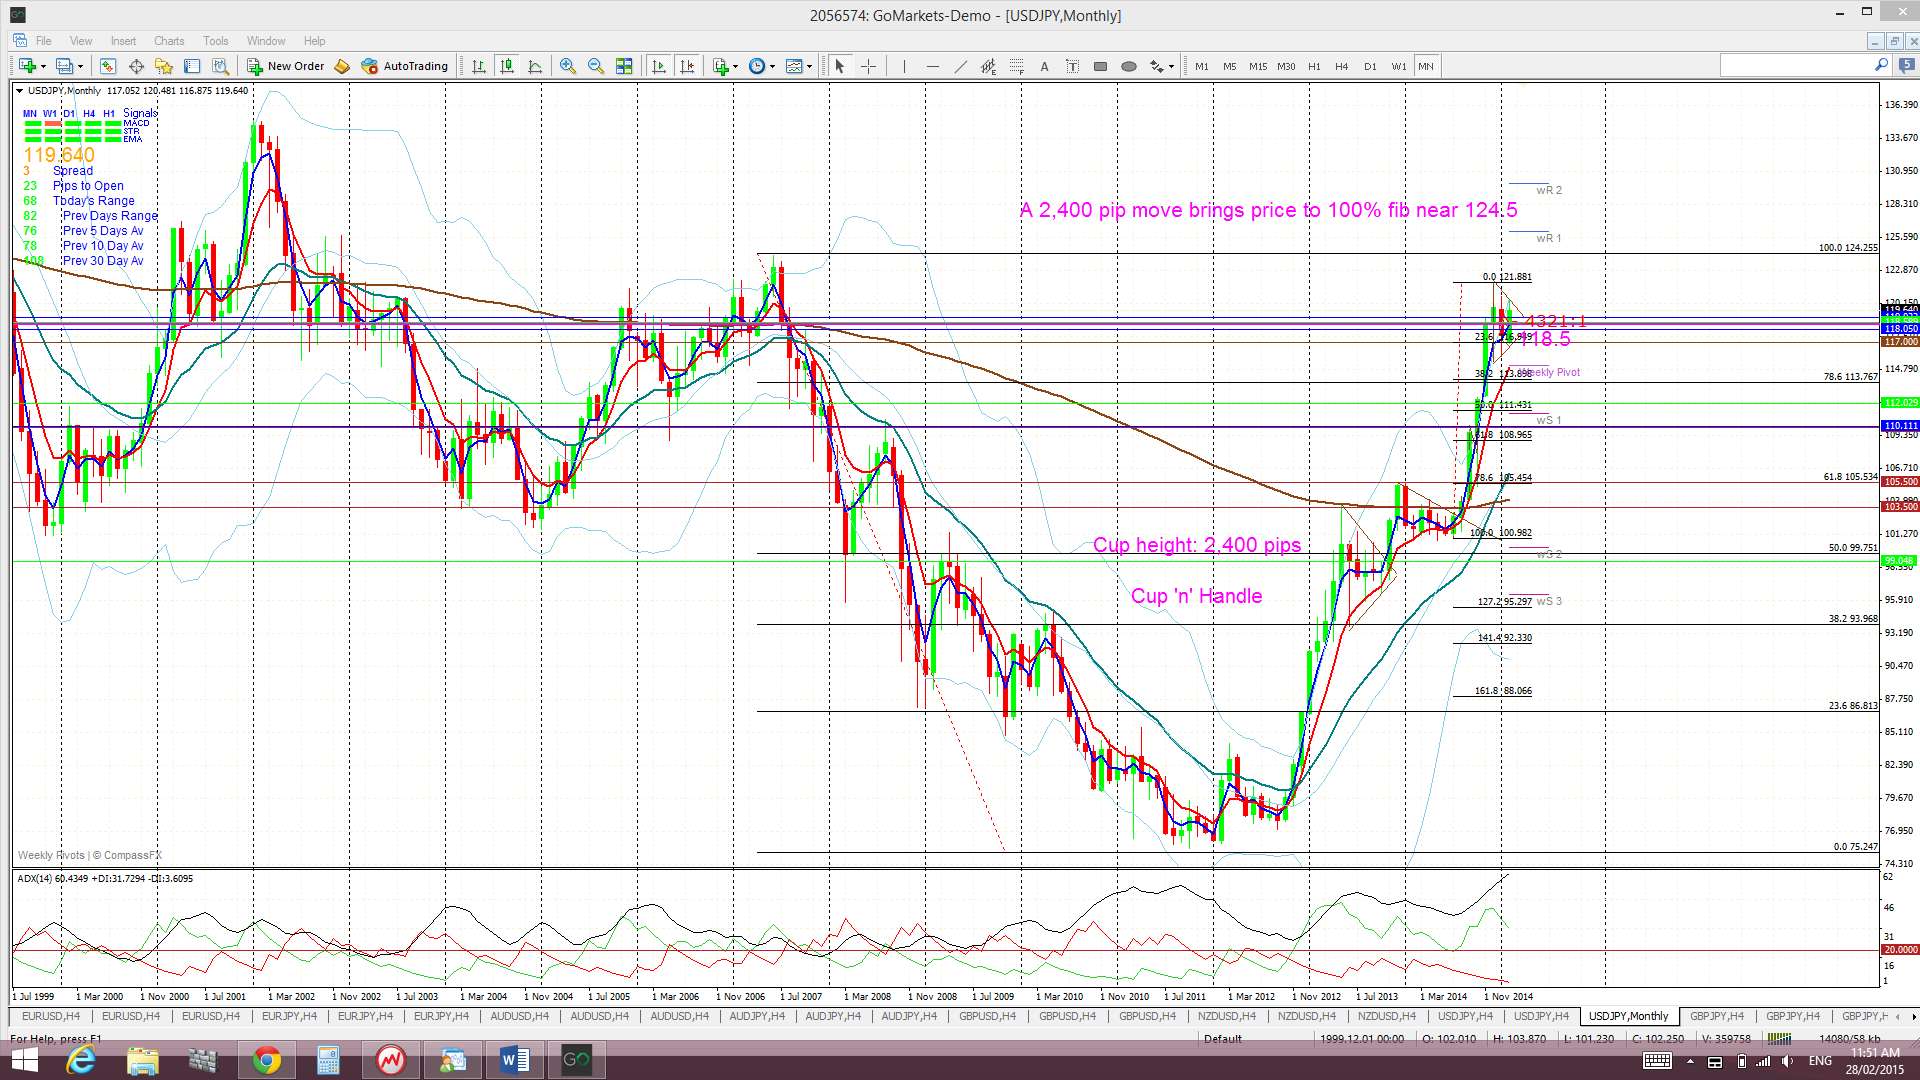
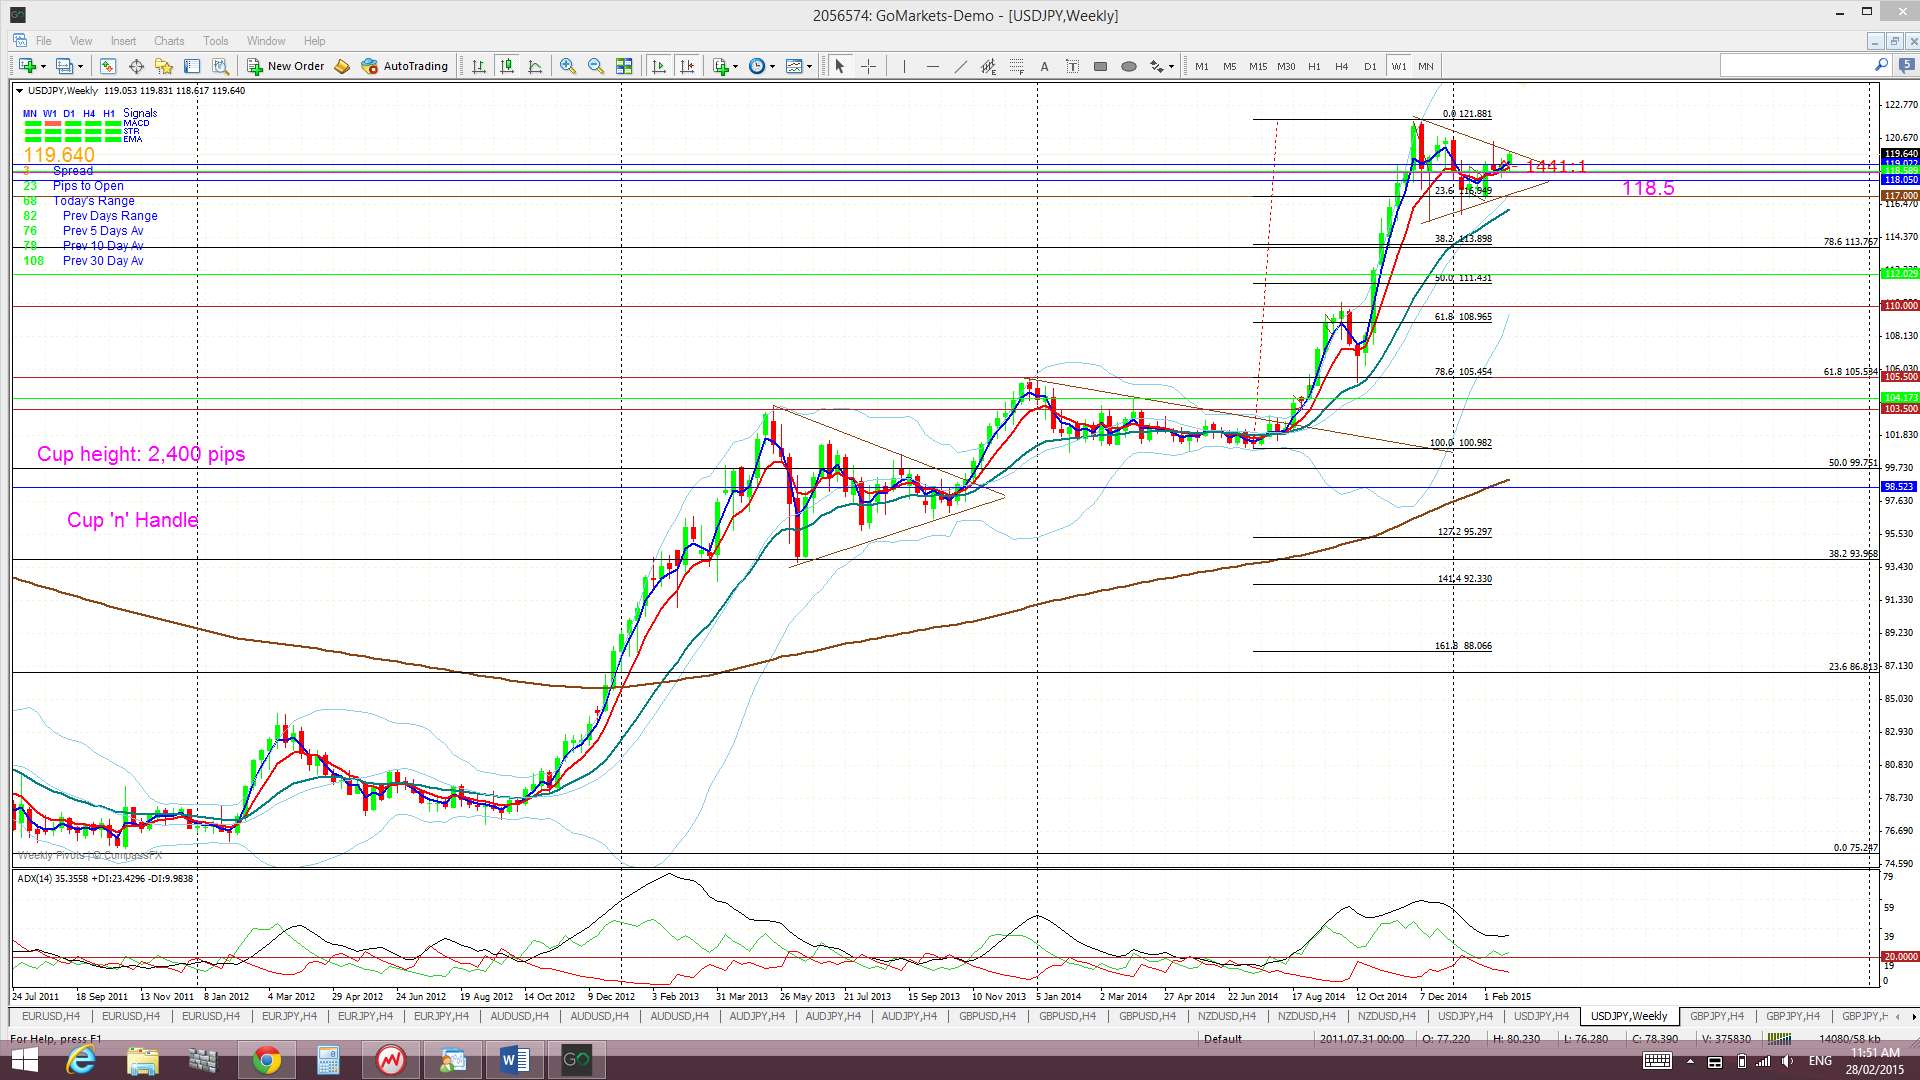
Weekly Chart Bullish Cup’ n’ Handle pattern: This pattern seems to have completed now just 300 pips short of the 2,400 pip target. The theory behind these patterns is that the height of the ‘Cup’ pattern is equivalent to the expected bullish move from the ‘handle’ breakout. The height of the Cup for the U/J weekly chart is around 2,400 pips. The interesting point here is that a 2,400 pip bullish move up from the ‘Handle’ would put price up near the 124 level. This level is the last major swing high for the U/J from back in 2007 and represents the 100% fib pullback for the move down in 2007 to the lows of 2012. This pattern gave up to 2,100 pips of the 2,400 pip target!
The main risk events for the USD/JPY this week will most likely be the Fed Chair Janet Yellen speech and US NFP.
- There is a new TC signal on this pair BUT I’m waiting for any daily-chart triangle breakout.
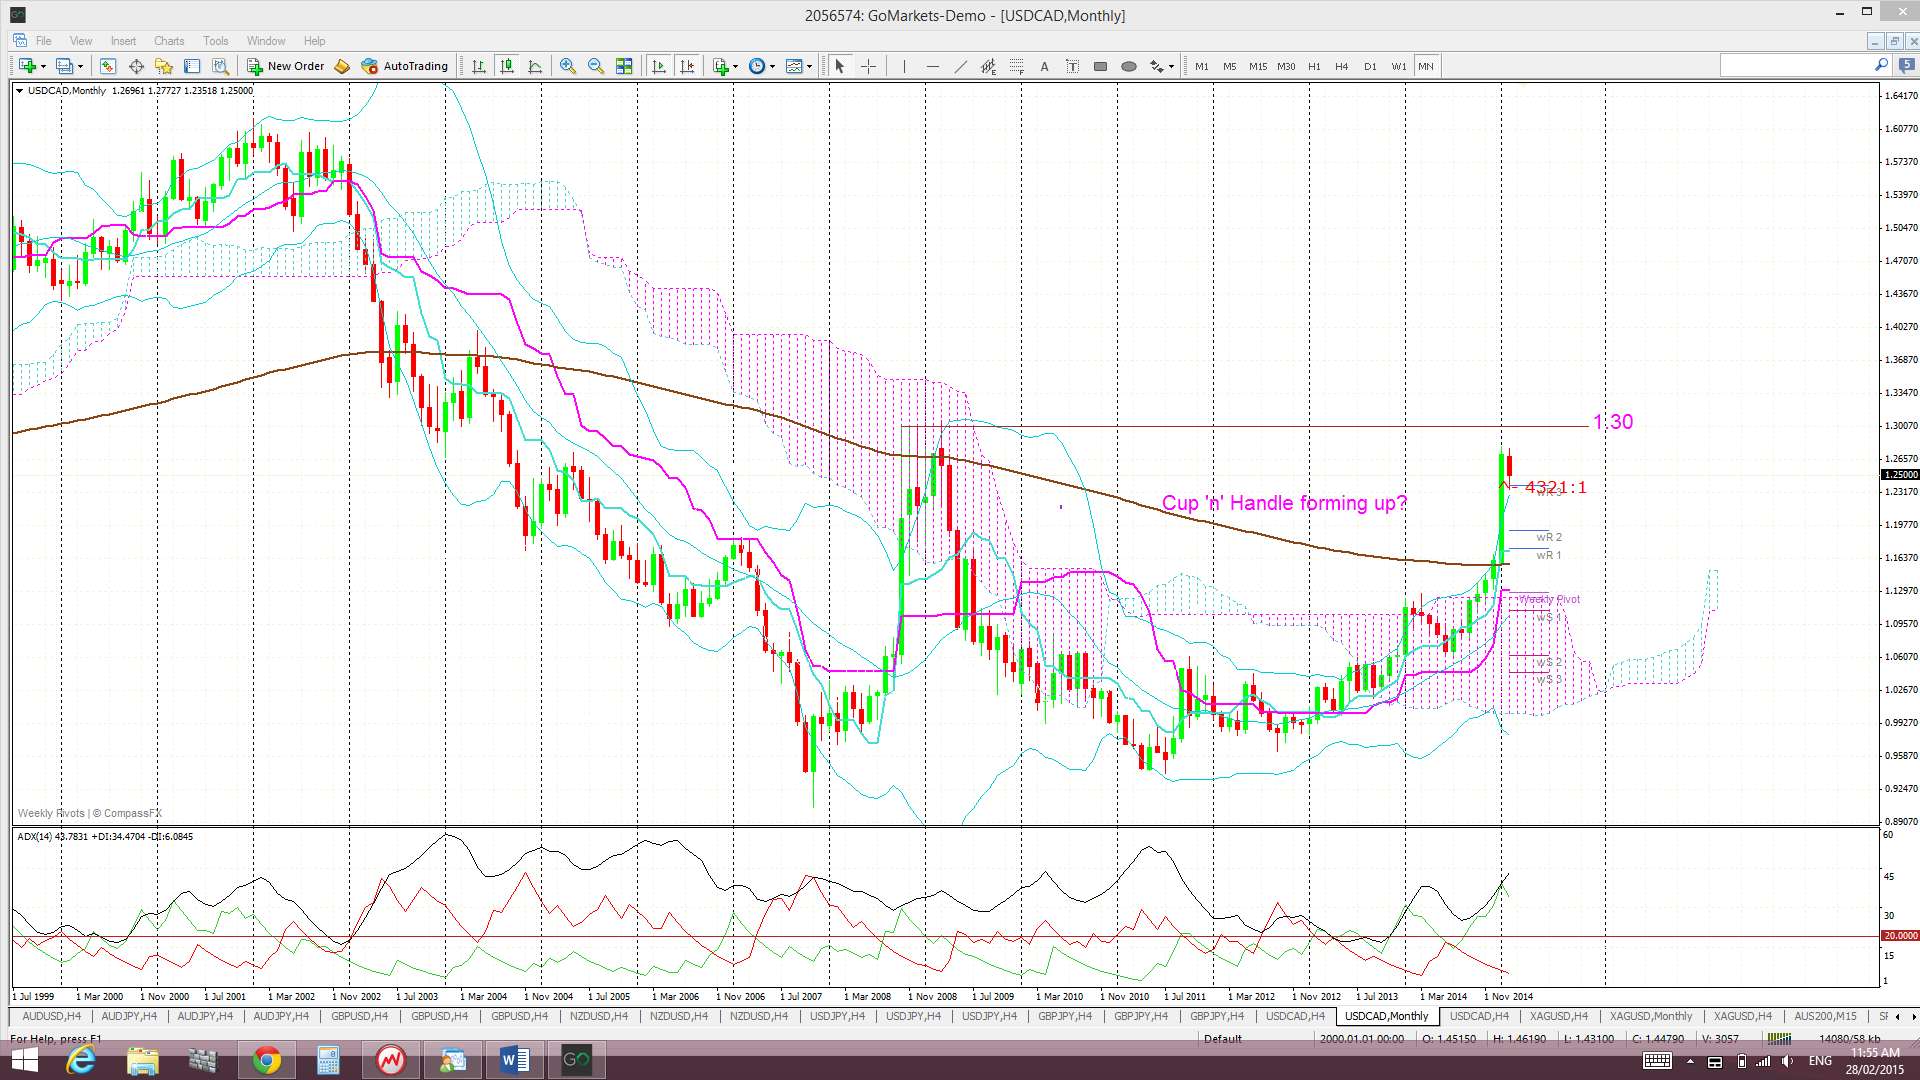
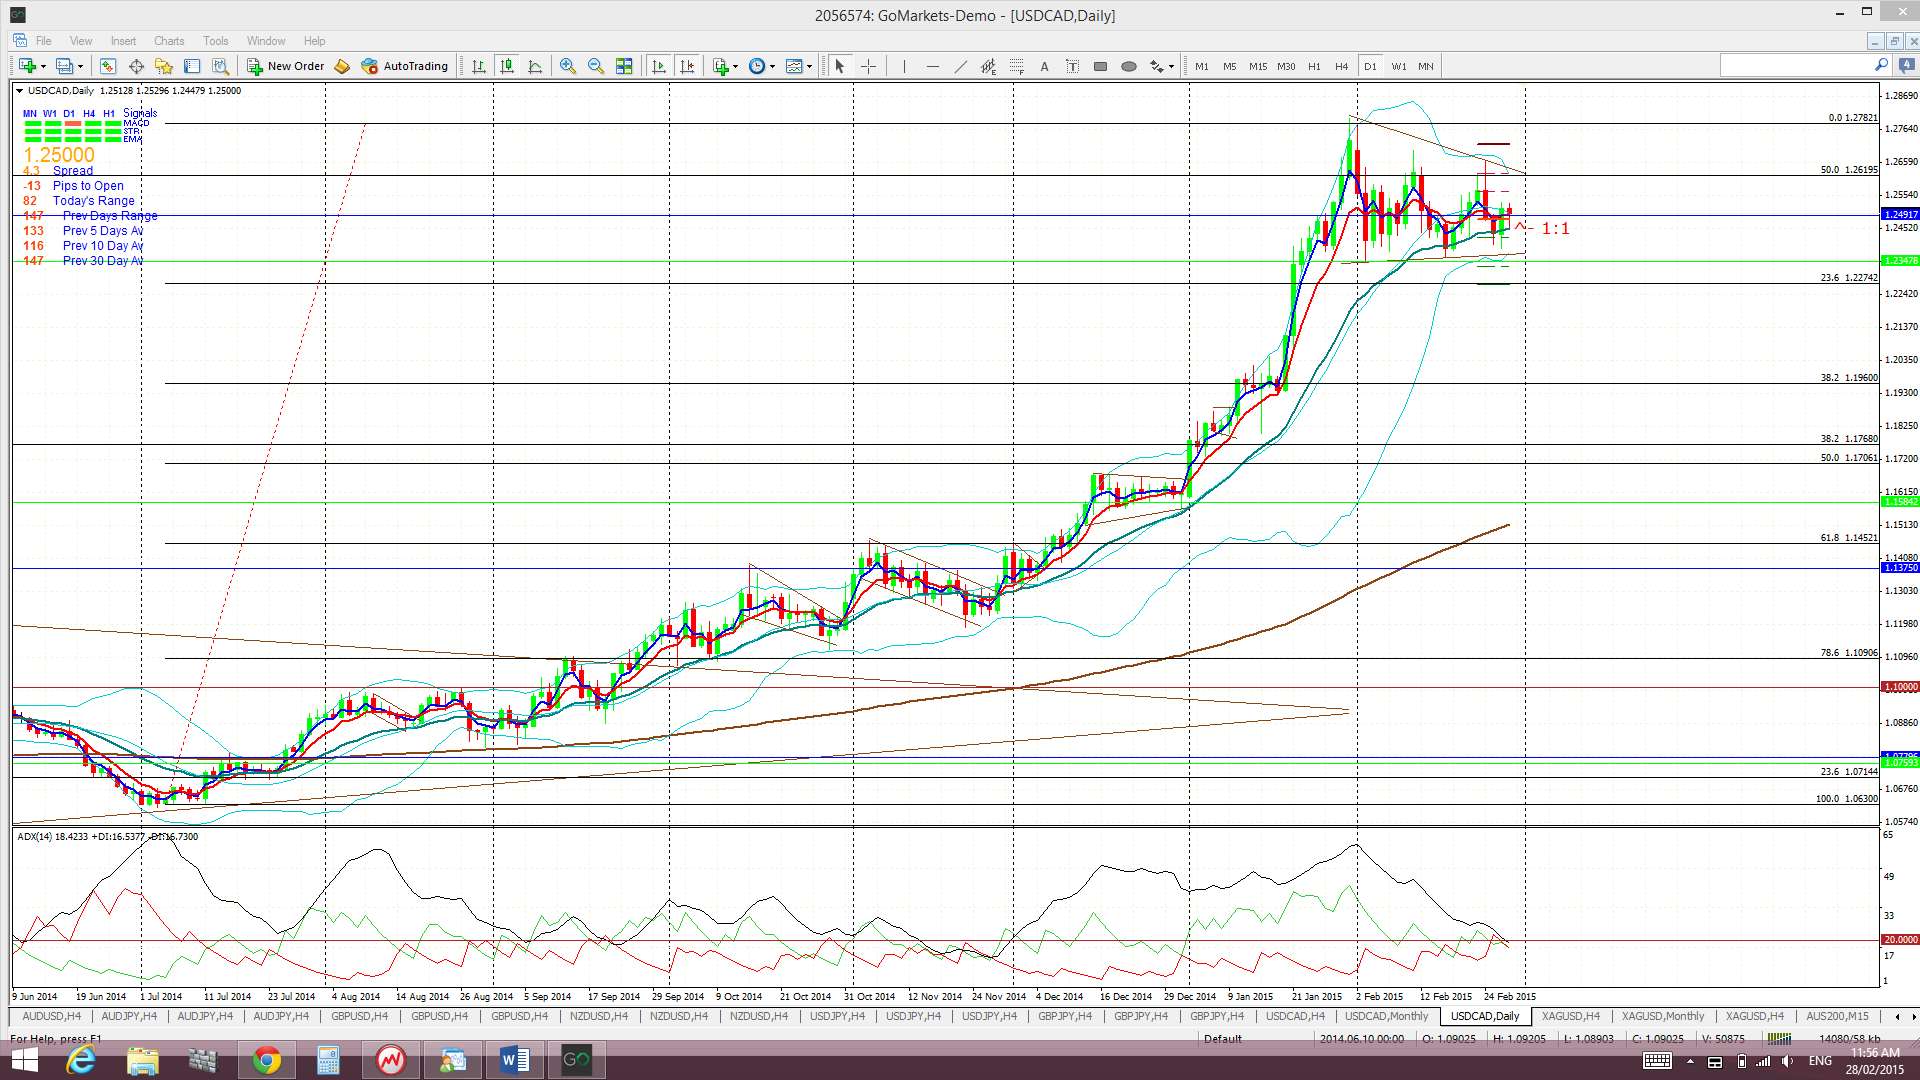
USD/CAD: The USD/CAD continued consolidating sideways within a wedge and has done so now for the last five weeks. I’m waiting for any momentum-based breakout but wondering if this range trading will continue and help to form up the ‘Handle’ of a potential monthly chart ‘Cup ‘n’ Handle’ pattern.
Price continues holding above the monthly 200 EMA however and it is worth remembering that the last bullish monthly candle close above this level was back in February 2009, almost 6 years ago. This period also marks the longest bullish hold by the Loonie above the monthly Cloud since 2002! Note the possible bullish Cup ‘n’ Handle forming up on the monthly chart that is in addition to the bullish triangle breakout already in play.
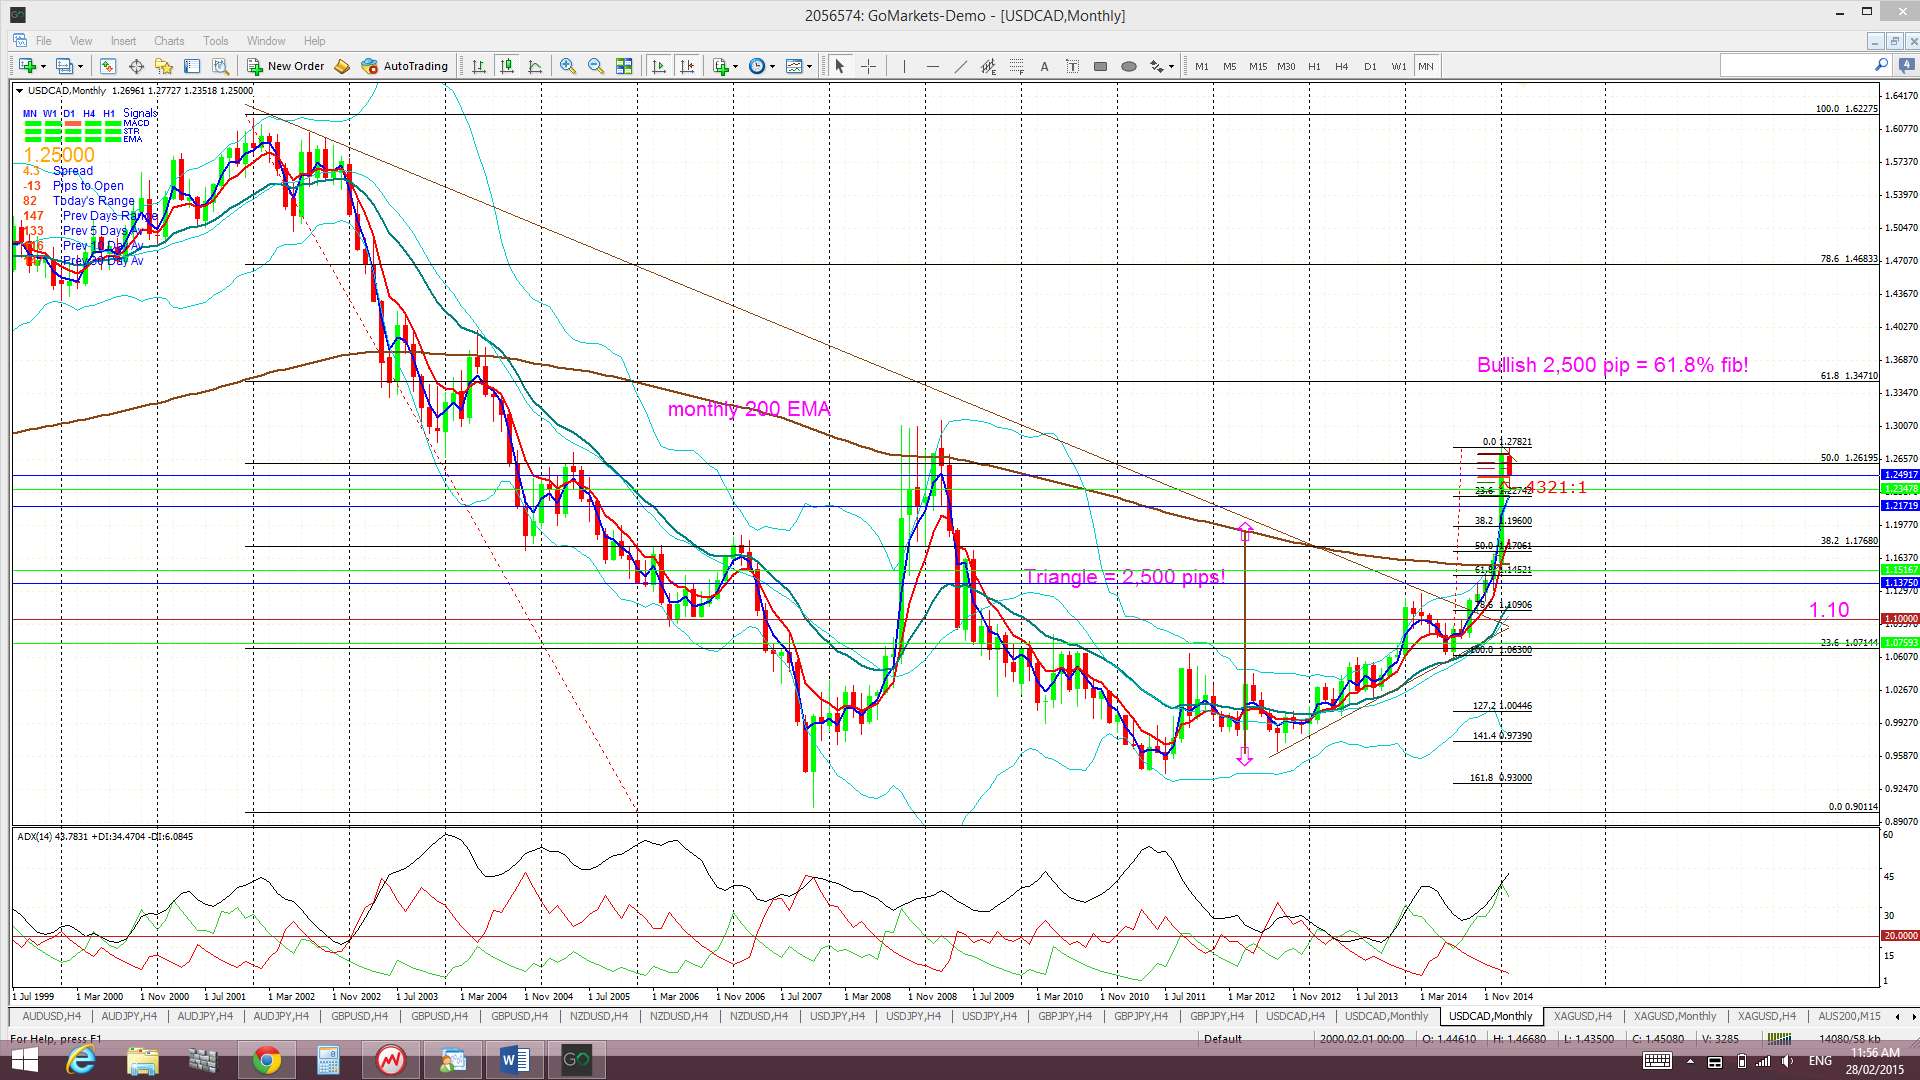
Triangle breakout target: The Loonie has already broken up and out from a major monthly chart triangle pattern that could deliver up to 2,500 pips. This 2,500 pip figure is evaluated from the height of the triangle. I have used the triangle height from the beginning of the bull trend line, as shown in the monthly chart below. The height of the triangle is around 2,500 pips and, thus, this would be the expected move from any breakout action. Extrapolating a bullish move from this triangle places price up at the 61.8% fib level. These fibs levels are popular targets in retracement moves and so this adds some confluence to this as a possible target. The bullish move has given up to 1,600 pips so far.
Price is still trading IN the Cloud on the 4hr chart but above on the daily, weekly and monthly charts.
The weekly candle closed as a bearish coloured ‘Spinning Top’ candle and the monthly candle closed as a bearish coloured ‘Inside’ candle. Both of these patterns are reflecting some indecision here.
There are a lot of risk events for the USD/CAD this week including the Fed Chair Janet Yellen speech, US NFP as well as CAD GDP, Interest Rates, BoC Statement, Ivey PMI, Building Permits & Trade Balance.
- I’m watching for any new valid TC signal on this pair and the wedge trend lines.


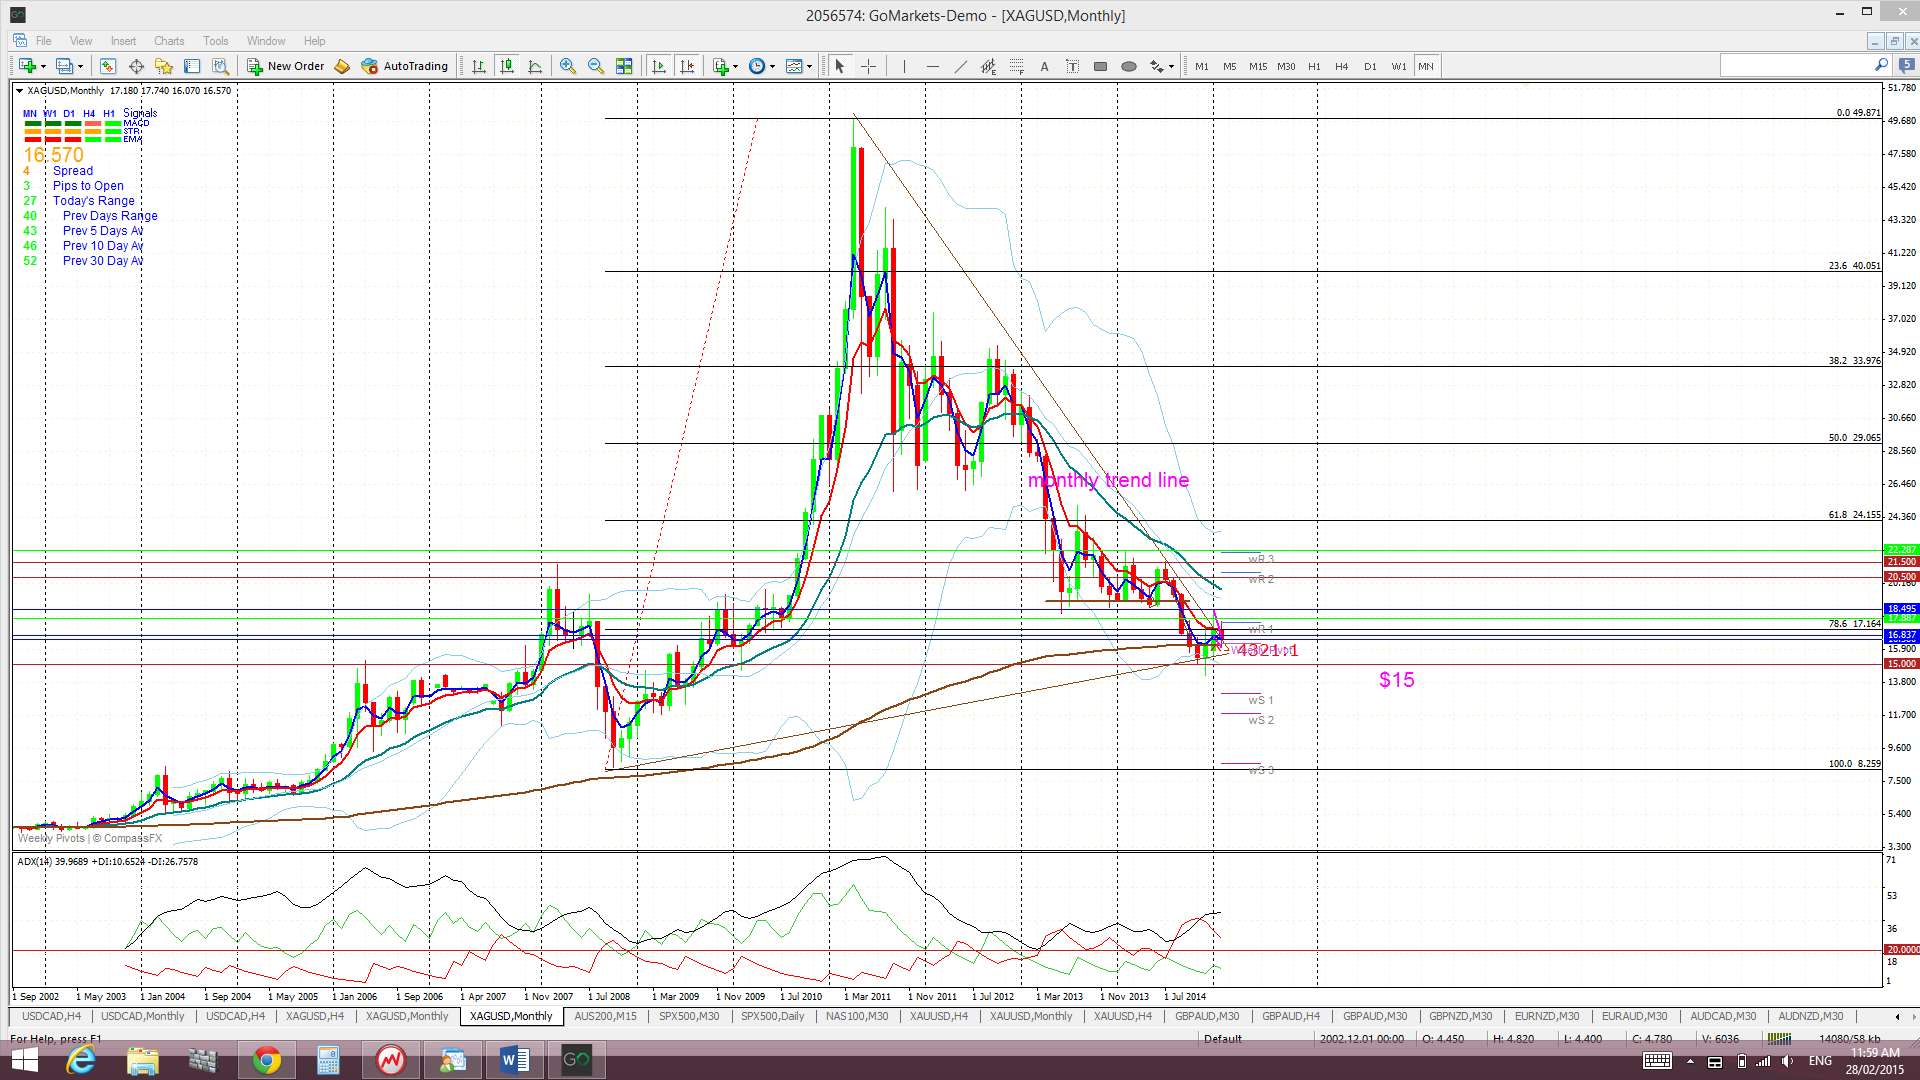
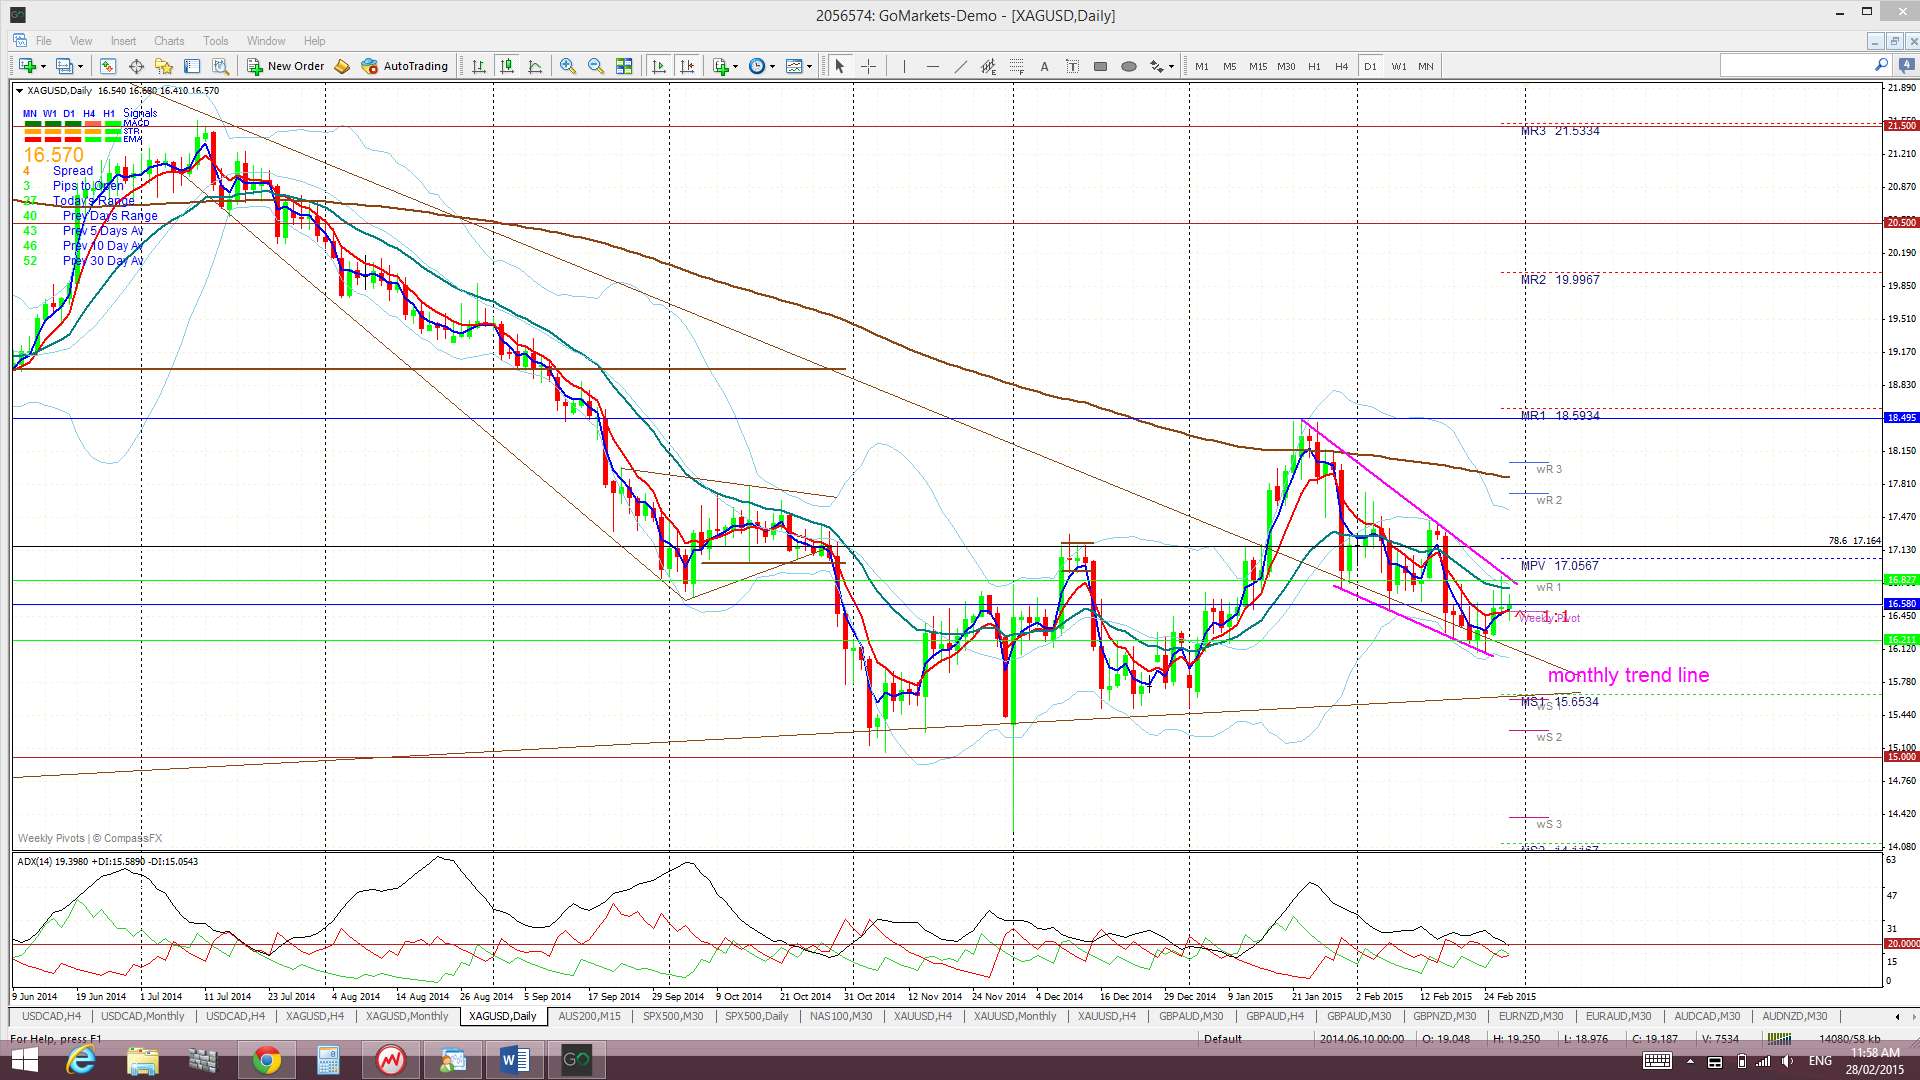
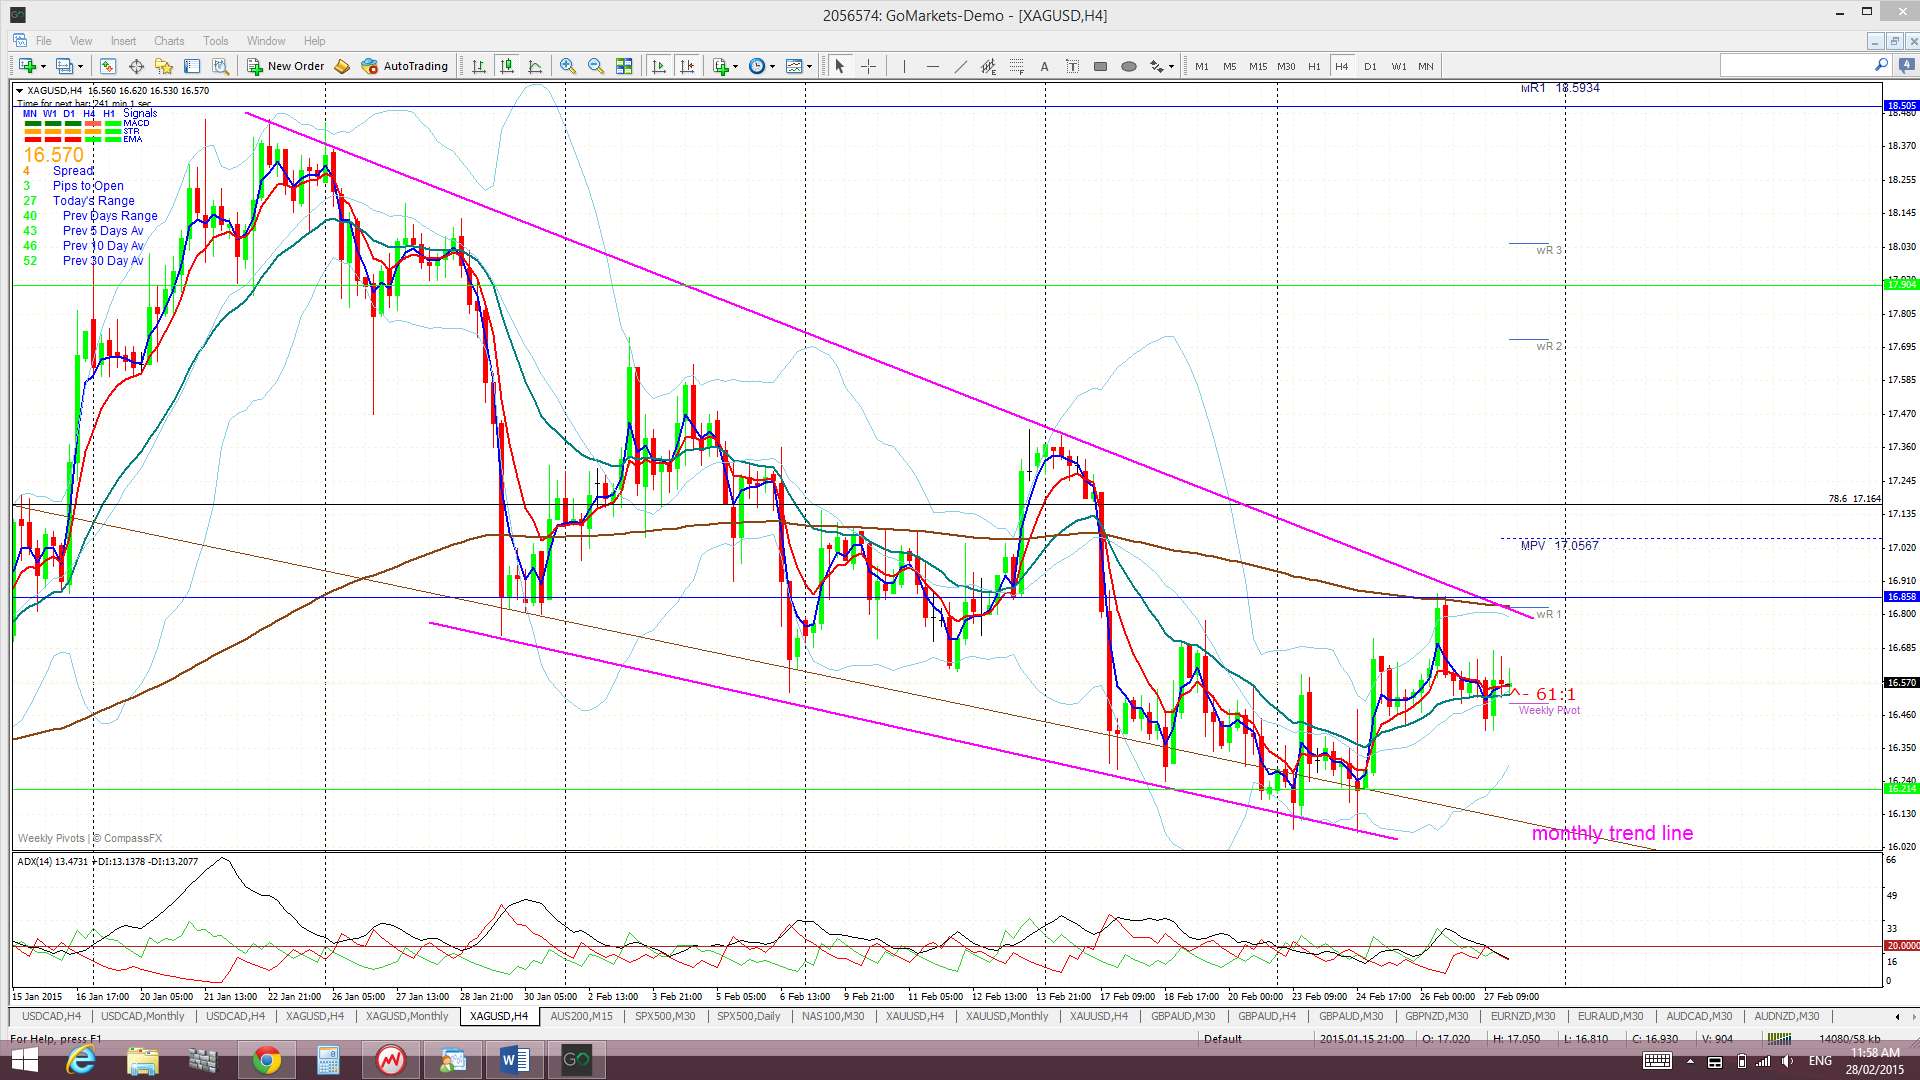
Silver: Silver chopped higher last week and found support from a recent support trend line, the monthly bear trend line that was broken a few weeks ago and the $16 level. Price action stalled though at the top of the recent wedge pattern but is still conforming to this bullish descending wedge pattern.
Silver is now trading in the Ichimoku Cloud on the 4hr and daily charts but below the Cloud on the weekly and monthly charts.
The weekly candle closed as a small bullish coloured ‘Inside’ candle. The monthly candle closed as a bearish coloured ‘inside’ candle. Both weekly and monthly candles reflecting some indecision.
- I’m watching for any new TC signal, the descending wedge trend lines and the monthly triangle trend line.

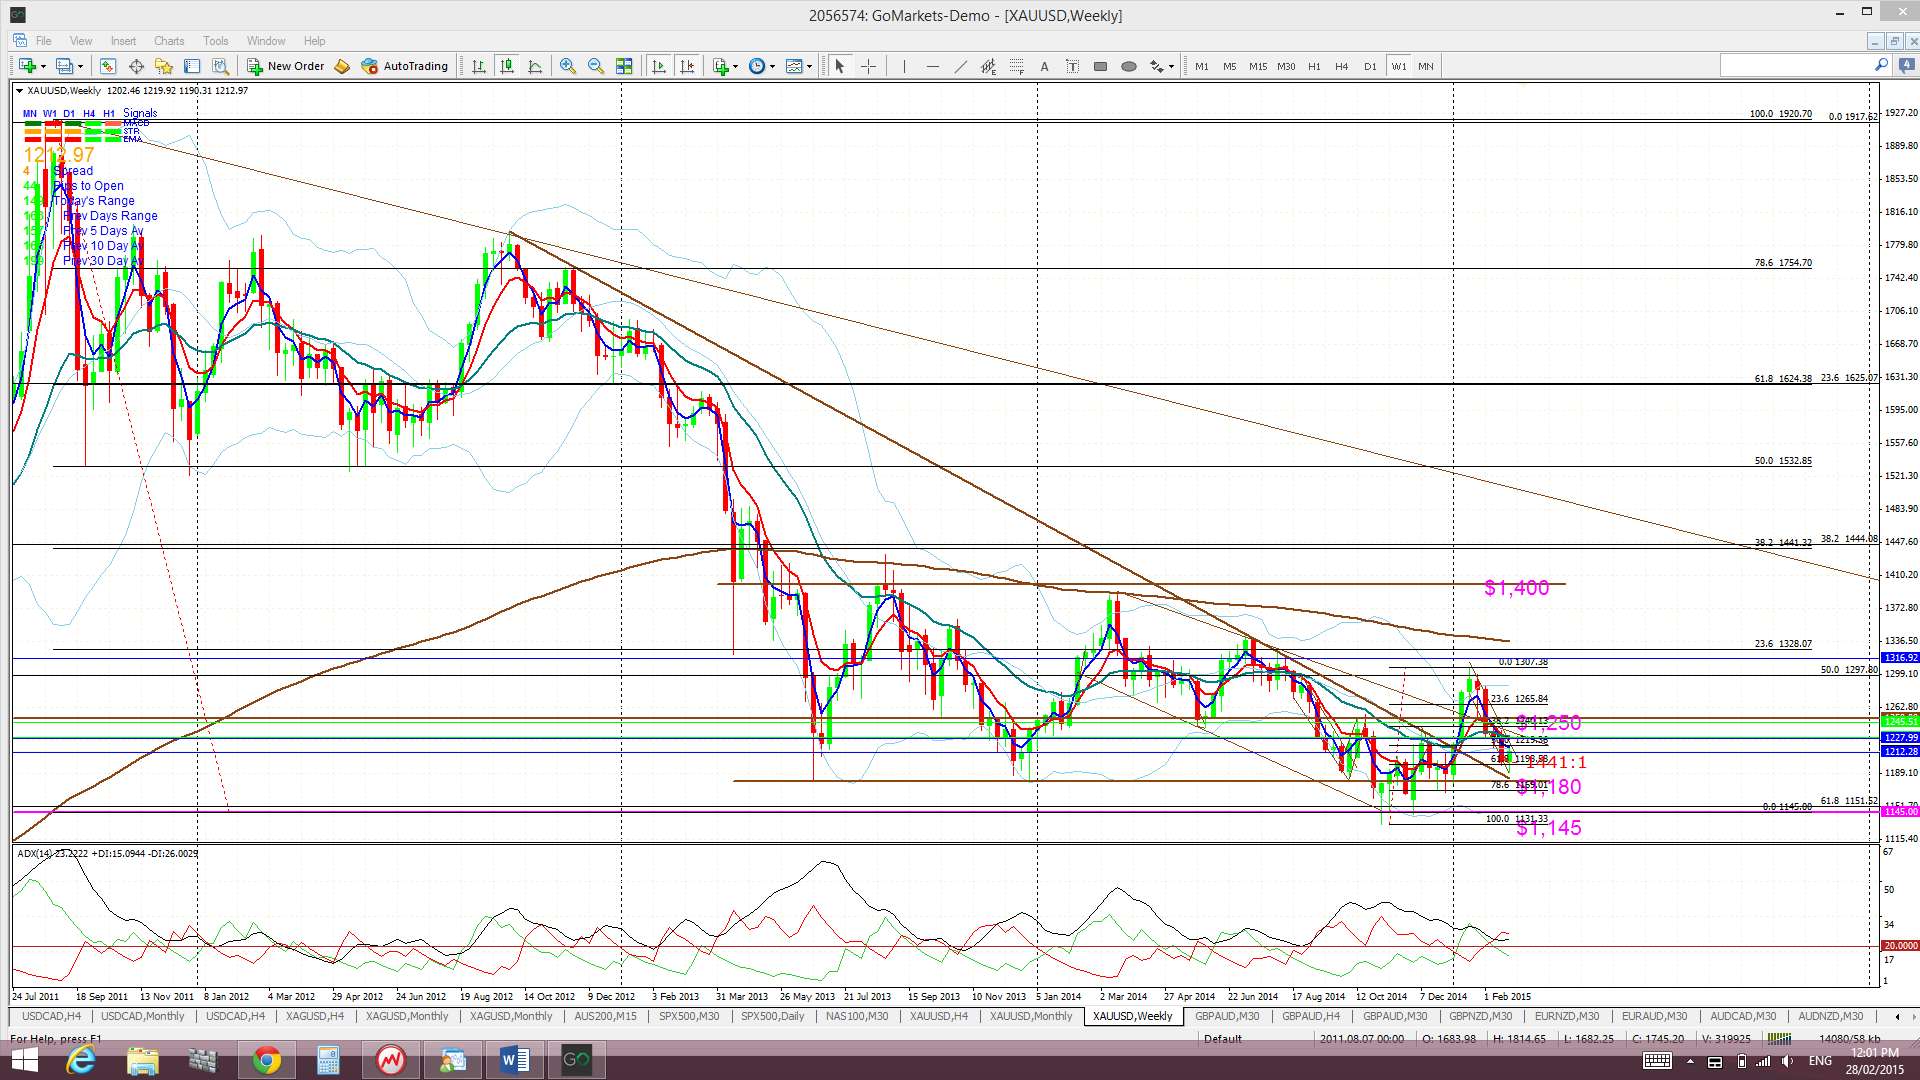
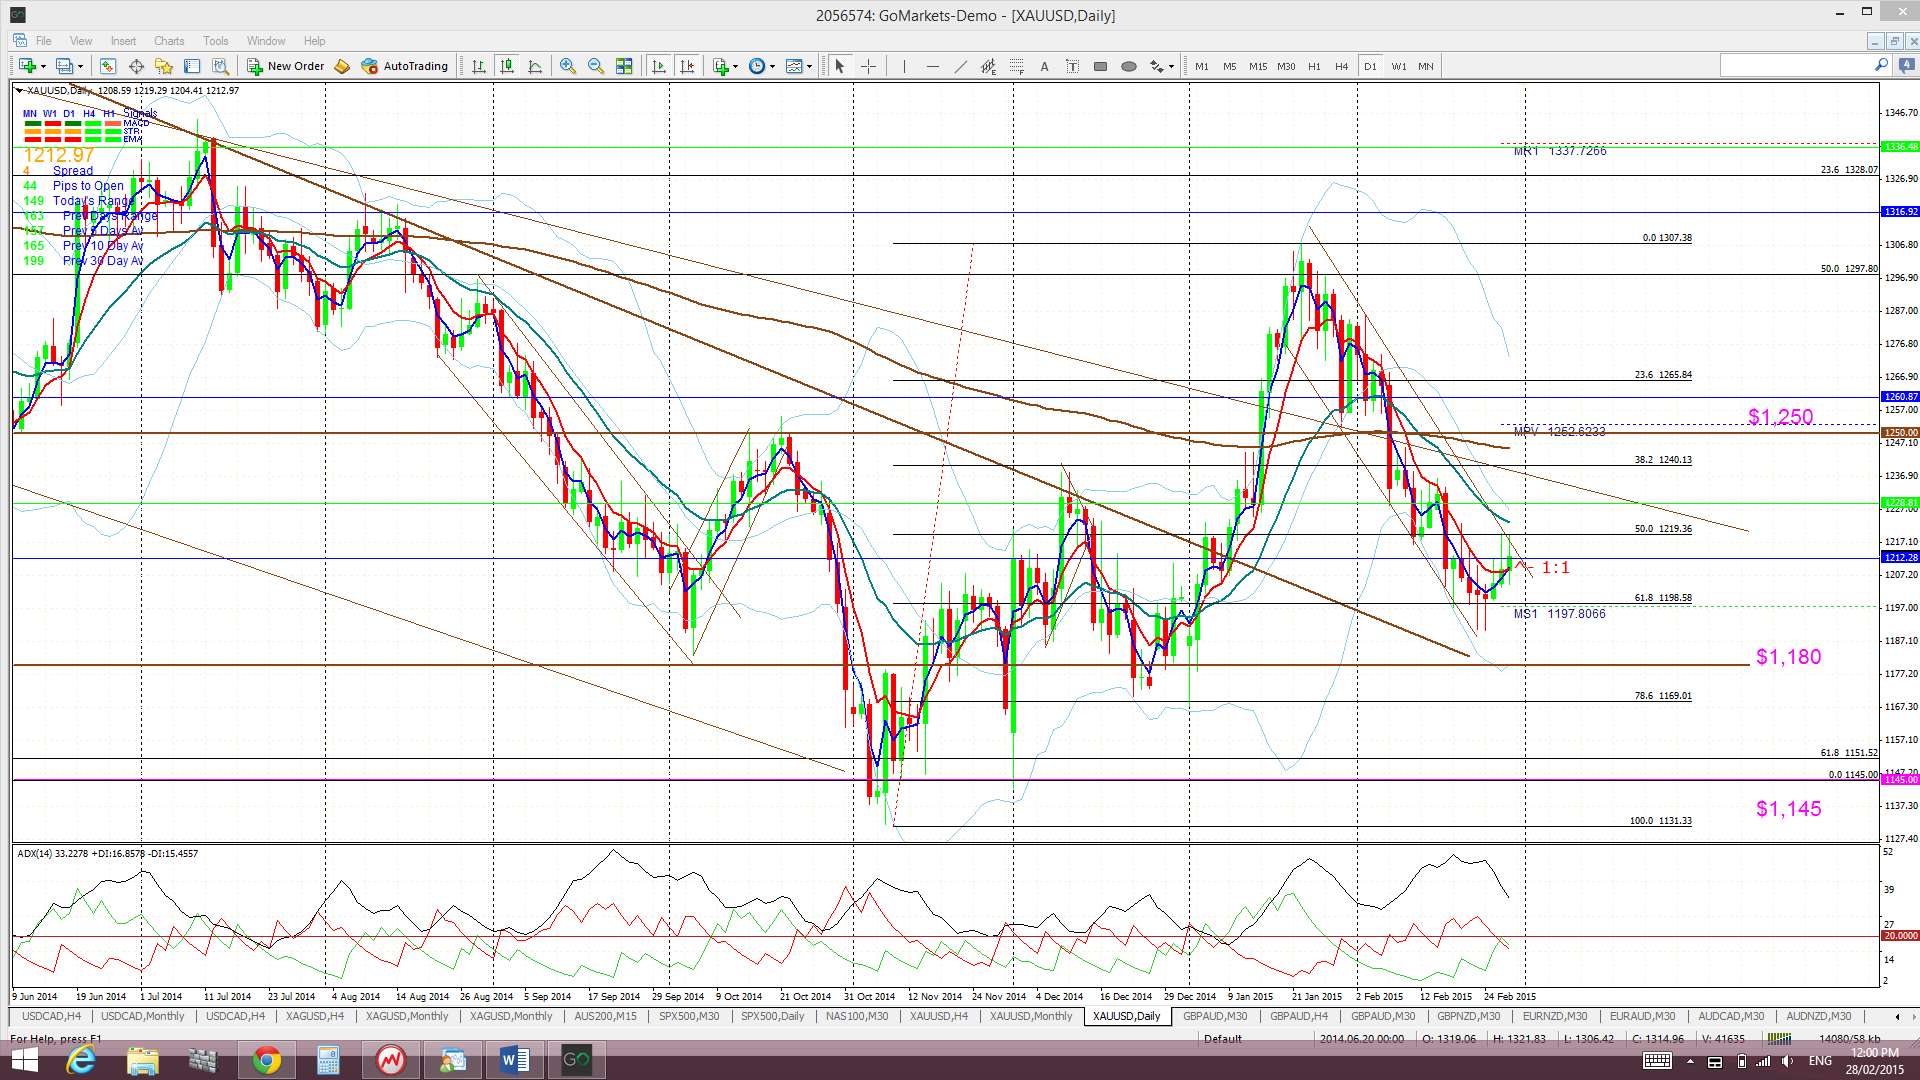
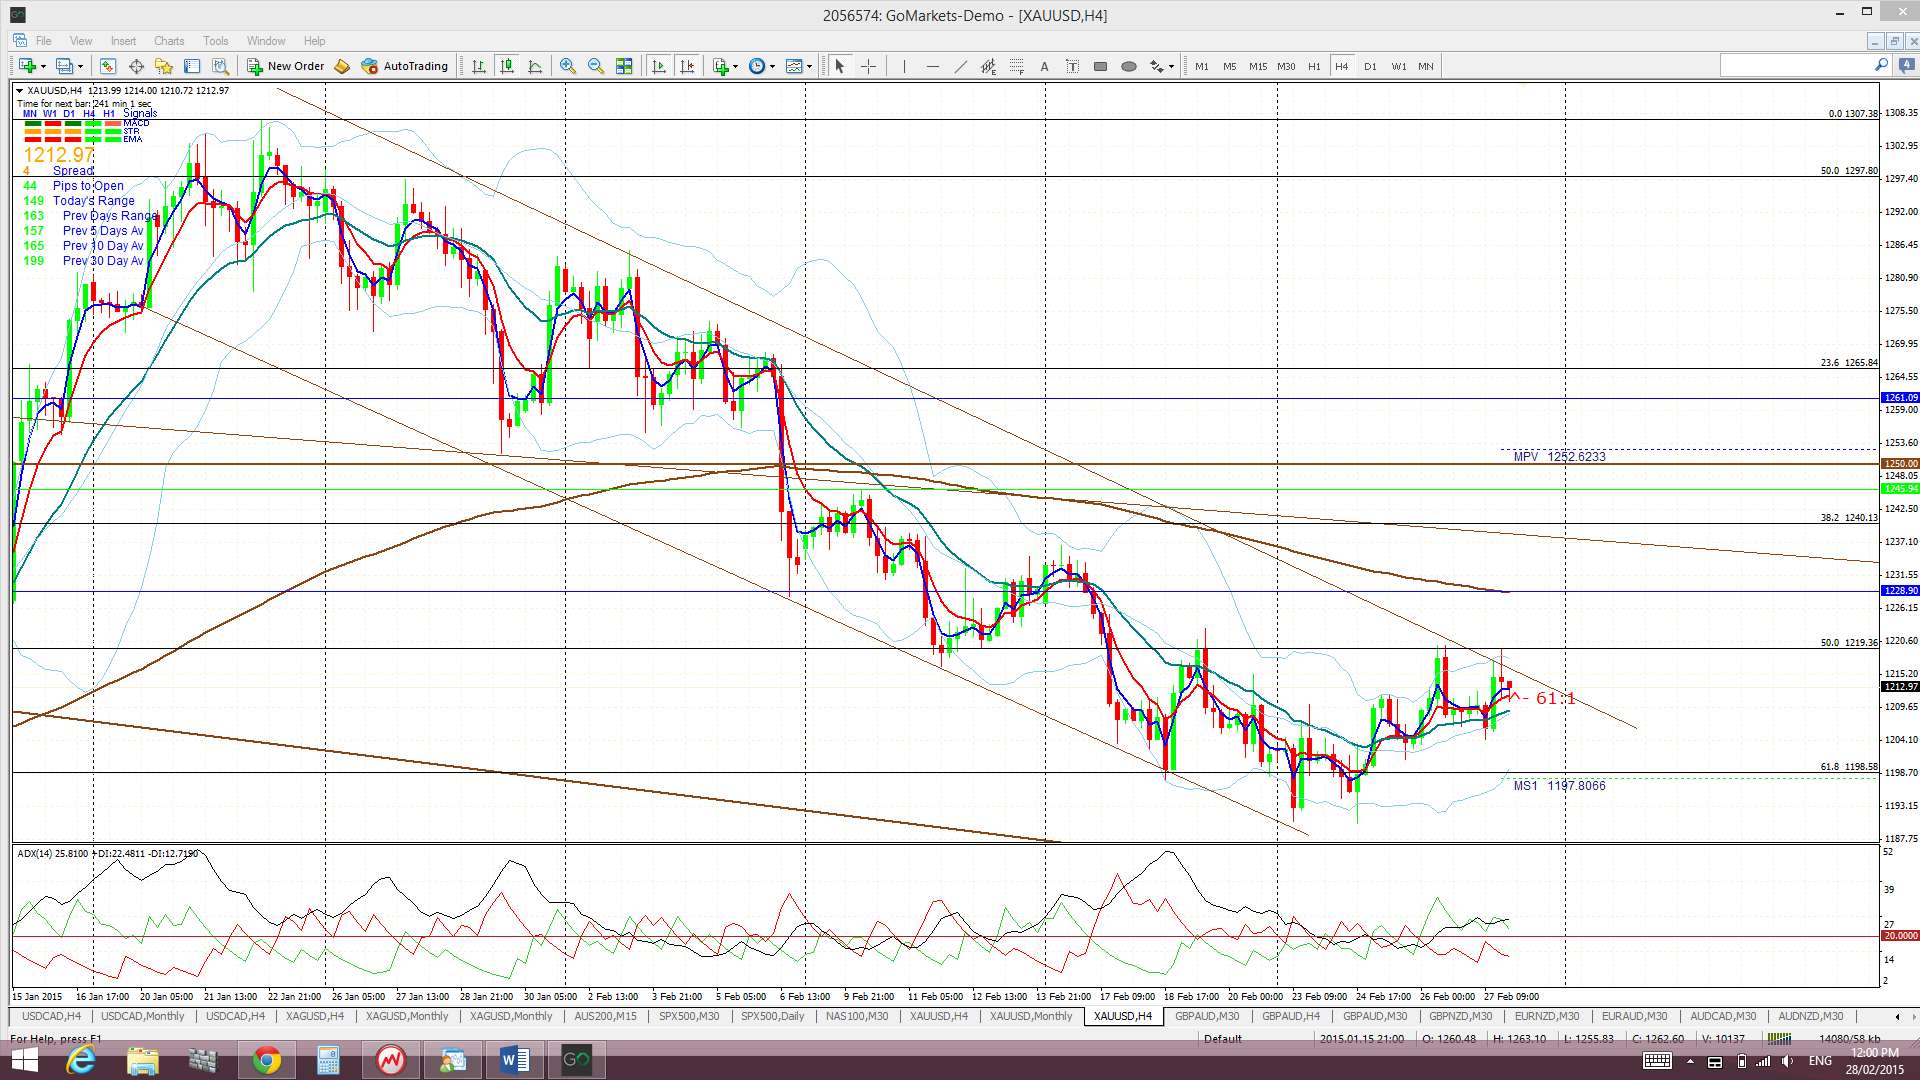
Gold: Gold chopped a bit higher last week and, although holding above the psychological $1,200 level, is still contained within a descending channel that has held price action now for six weeks.
The daily chart shows that a 61.8% fib pullback of the recent bull run is right near the key $1,200 support level and price has held above there for now. $1,180 is another S/R level and just below current price so I’ll be watching for any reaction there if price makes it down that far.
Whilst it looks likely that Gold has carved out a base here any new break and hold below $1,145 would suggest that this support might give way to a deeper pull back. Bearish targets below $1,145 include the $1,000 psychological level and, then, the 78.6% fib near $950.
Gold is trading in the Ichimoku Cloud on the 4hr chart but below the Cloud on the daily, weekly and monthly charts.
The weekly candle closed as a small bullish coloured ‘Inside’ candle. The monthly candle closed as a bearish coloured ‘inside’ candle. Both weekly and monthly candles reflecting some indecision.
- I’m watching for any new TC signal, the $1,200 and the $1,180 level and the trading channel trend lines.

The post USD still capped for now. NASDAQ & RUT break out. appeared first on www.forextell.com.