USDX
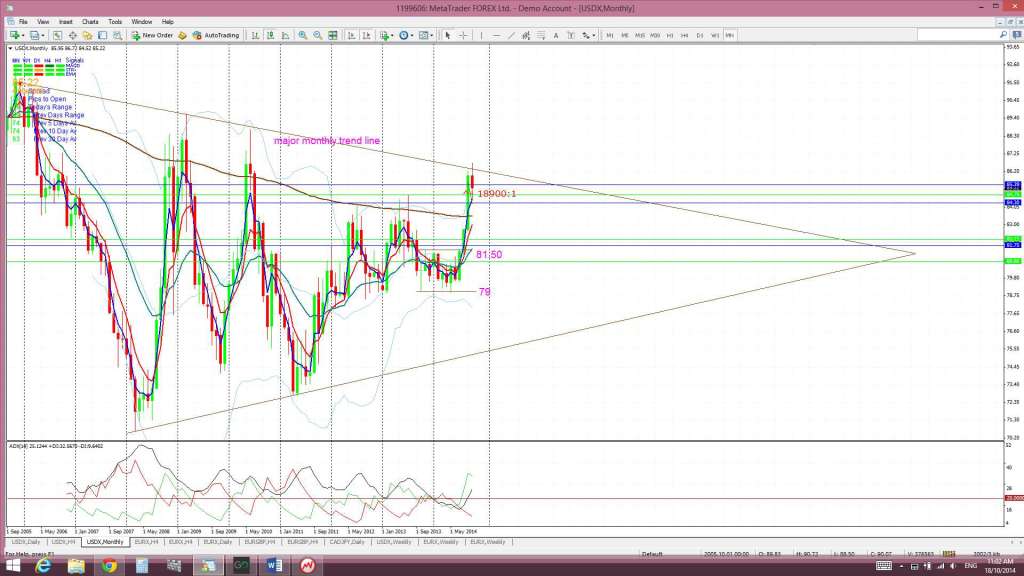
Monthly: The October candle is now printing a bearish coloured ‘inside’ candle and is still sitting just below the resistance of the monthly chart’s bear triangle tend line. A respect of this significant resistance zone could see the USD index reverse from here which could boost the EURX.
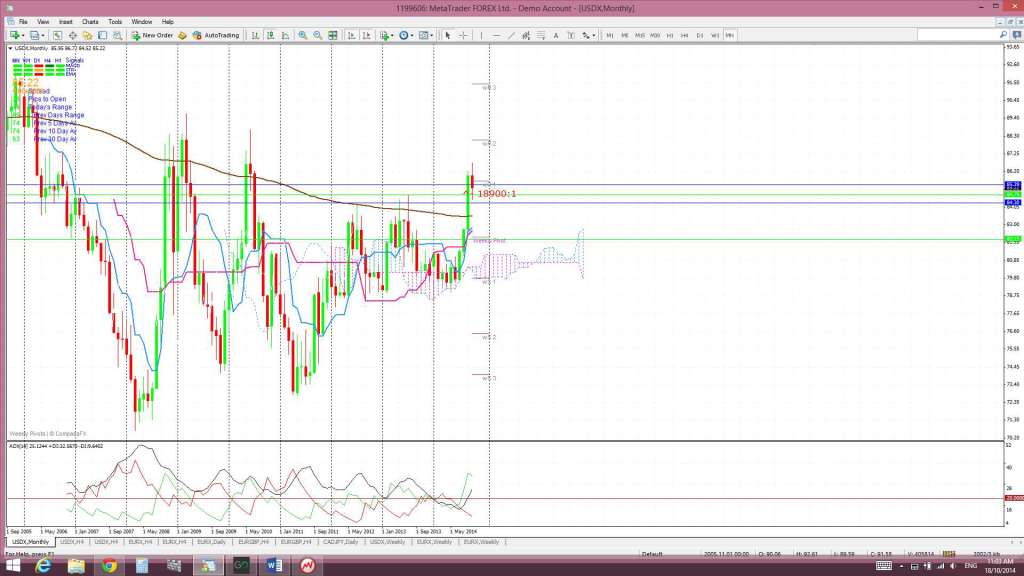
Monthly Ichimoku: The October candle is well above the monthly Cloud.
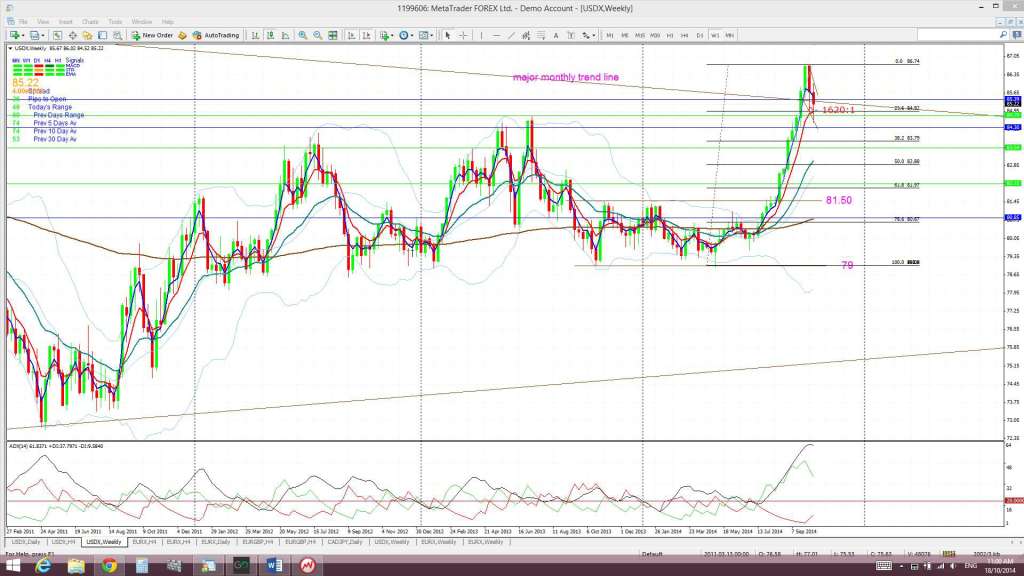
Weekly: Last week’s candle closed as a bearish-reversal ‘Railway Track’ candle and this accurately predicted a bearish week for the USDX. The weekly candle closed as another bearish candle.
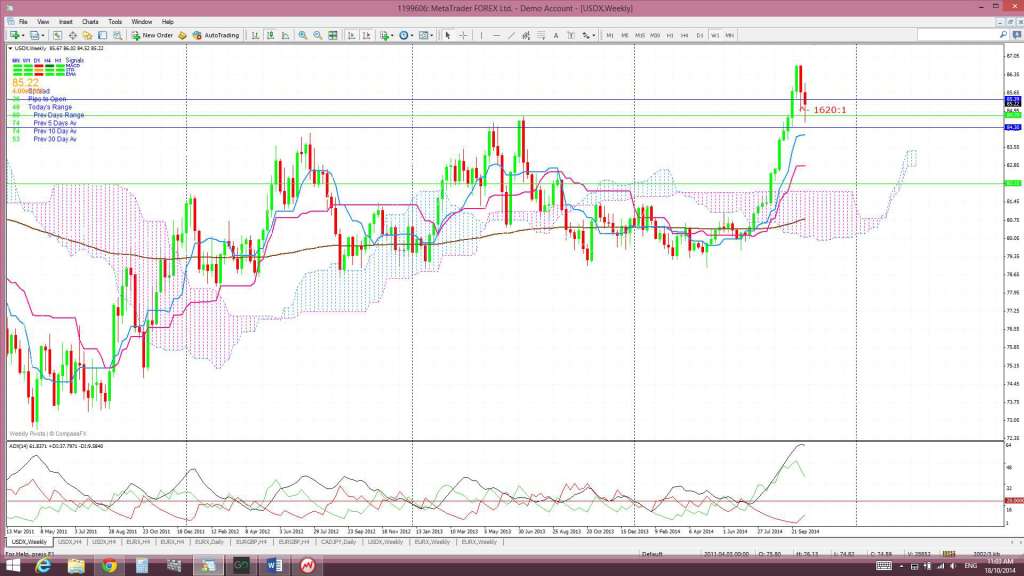
Weekly Ichimoku: Price is still trading ABOVE the weekly Cloud.
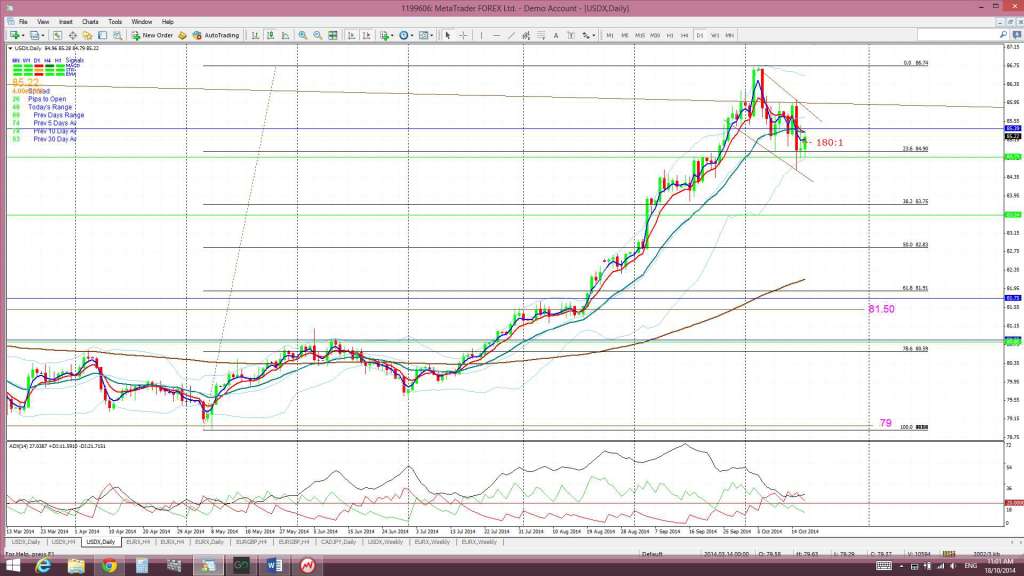
Daily: Price chopped lower last week but is still trading within a possible ‘Bull Flag’. I’m still on the lookout for a possible pull back to test the 81.50 region even if there is to be ultimate bullish continuation. This is the previous S/R zone from the recent 11 month trading channel and near the 61.8% fib pull back level of the recent bull run.
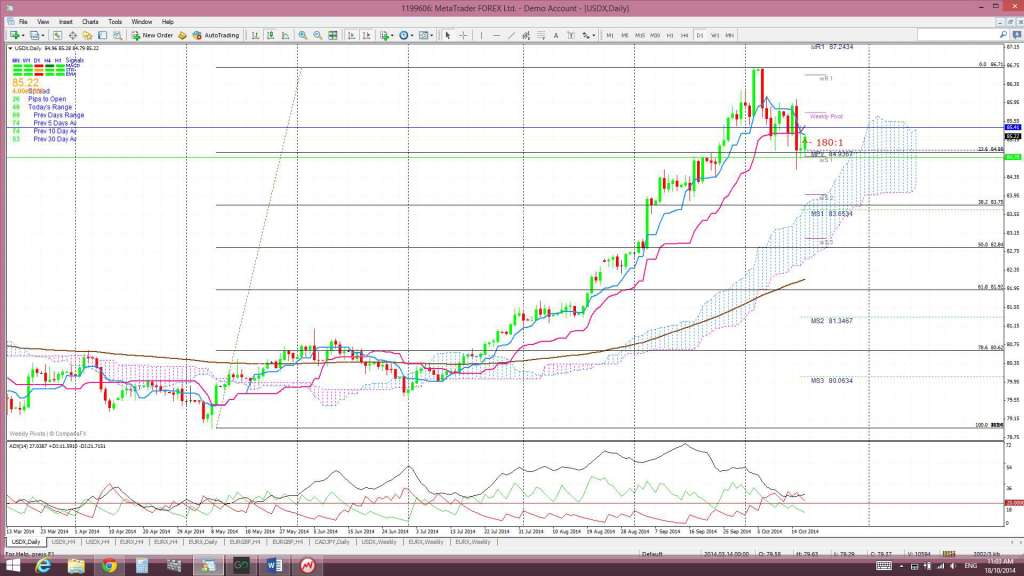
Daily Ichimoku Cloud chart: Price traded above the Cloud all week. Price is still above the daily Cloud and some pull back here would not be out of order, even as part of a broader bullish continuation move. There has been a bearish Tenkan/Kijun cross on the daily chart although the Kijun angle is not favourable here just yet.
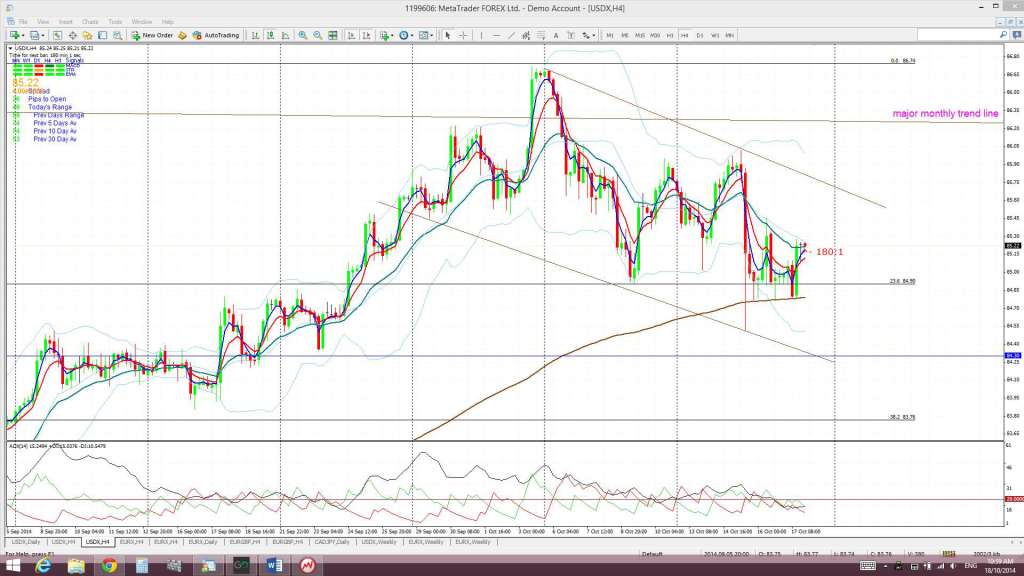
4hr: Price chopped lower last week within the ‘Flag’ pattern.
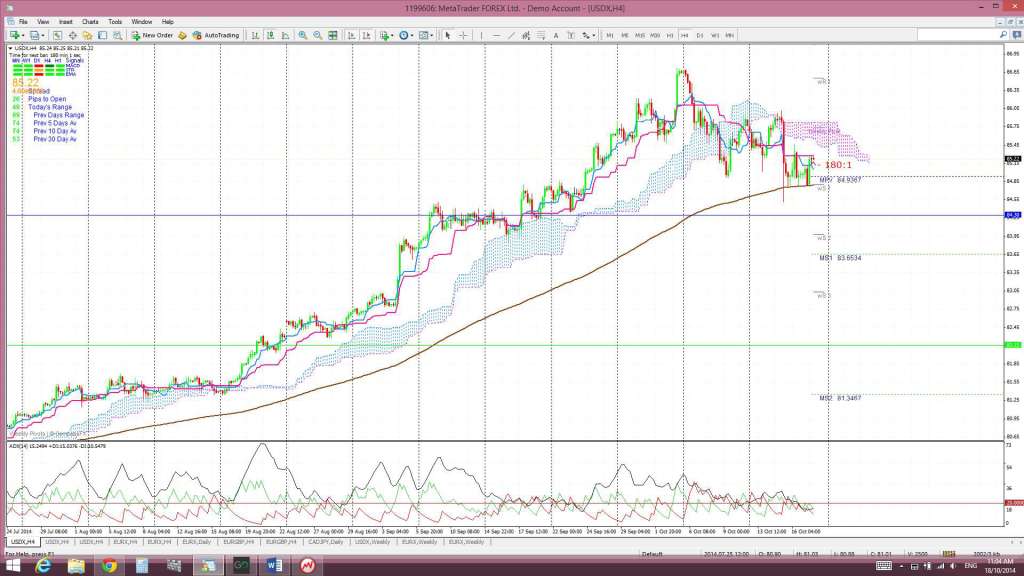
4hr Ichimoku Cloud chart: Price attempted to move back up through the 4hr Cloud last week but wasn’t successful. This chart is divergent from the daily chart and suggests choppiness.
EURX
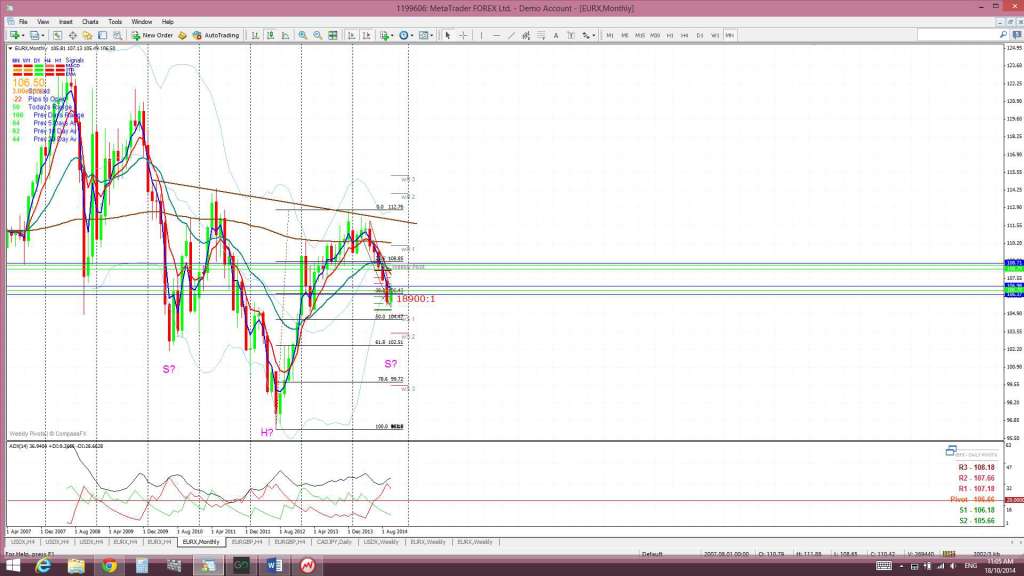
Monthly: The October candle is now printing a bullish coloured ‘Inside’ candle. I am still seeing a larger scale bullish ‘inverse H&S’ pattern here. This candle doesn’t close off for another 2 weeks but if it remains bullish and closes as such then that would be the first bullish monthly candle for 5 months!
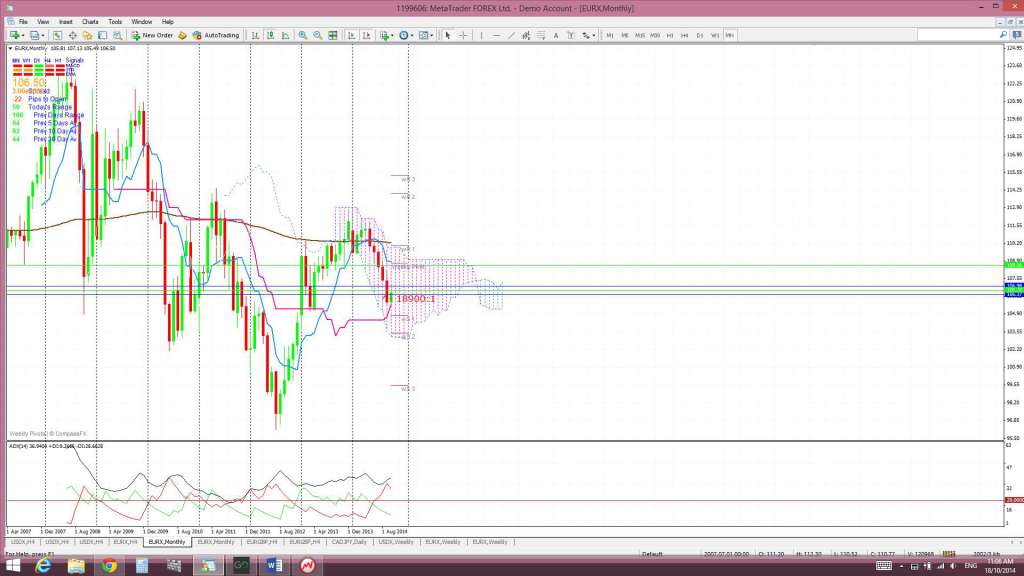
Monthly Ichimoku: The October candle is trading within the monthly Cloud.
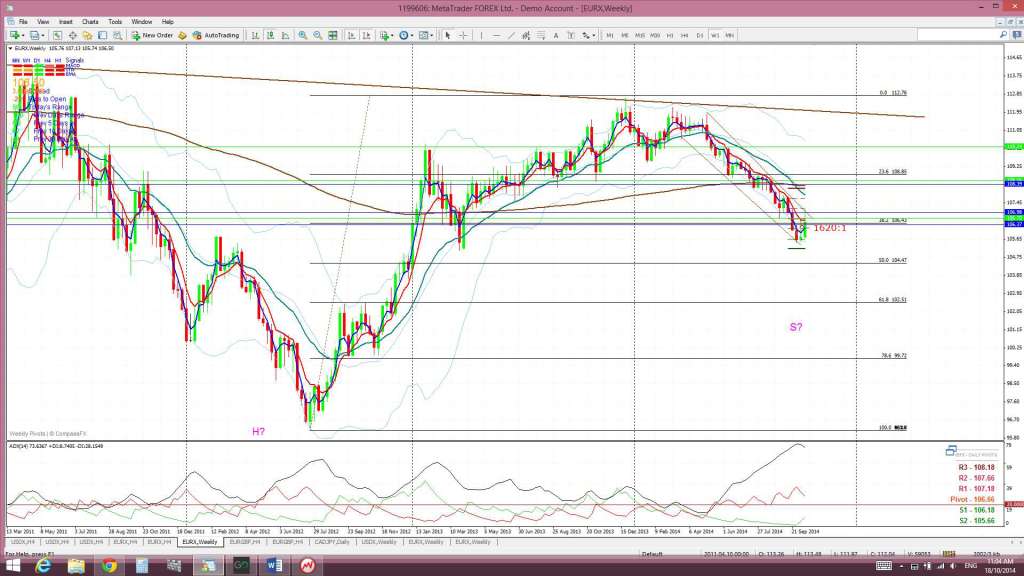
Weekly: The weekly candle closed as a large bullish candle and this follows from last week’s bullish-reversal ‘Inverted Hammer’ candle.
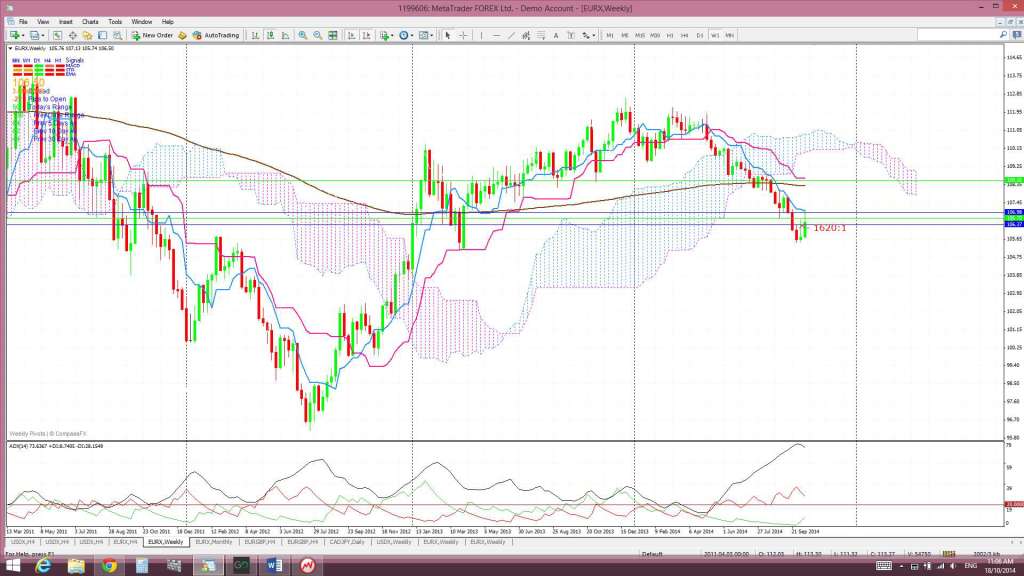
Weekly Ichimoku: Price is still trading below the weekly Cloud.
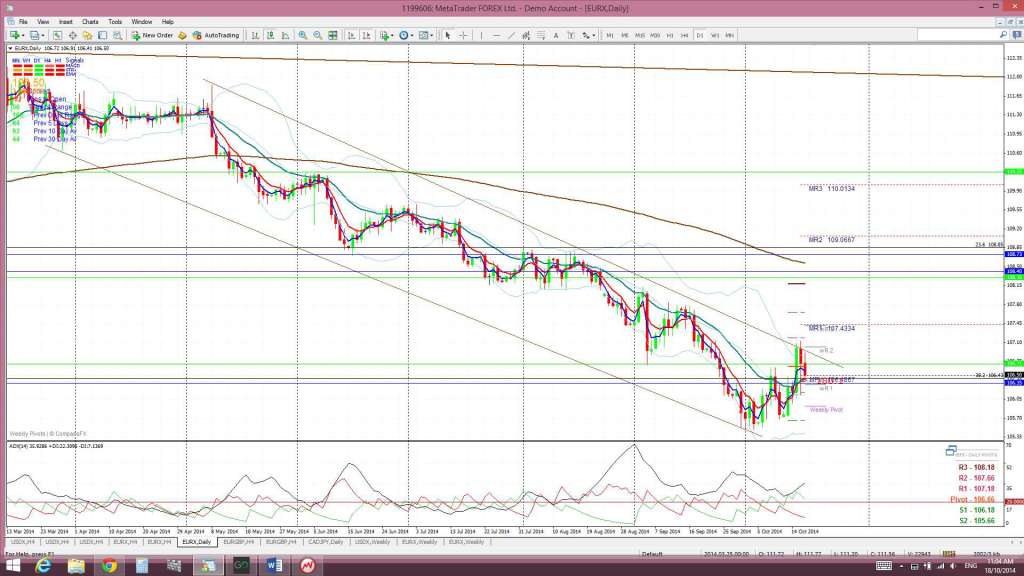
Daily: Price chopped higher last week and, whilst making a brief bullish breakout, has ended up back within the descending trading channel. Any bearish pull back on the USDX could result in this index making a bullish breakout from this channel. Traders need to keep an open mind to this possibility.
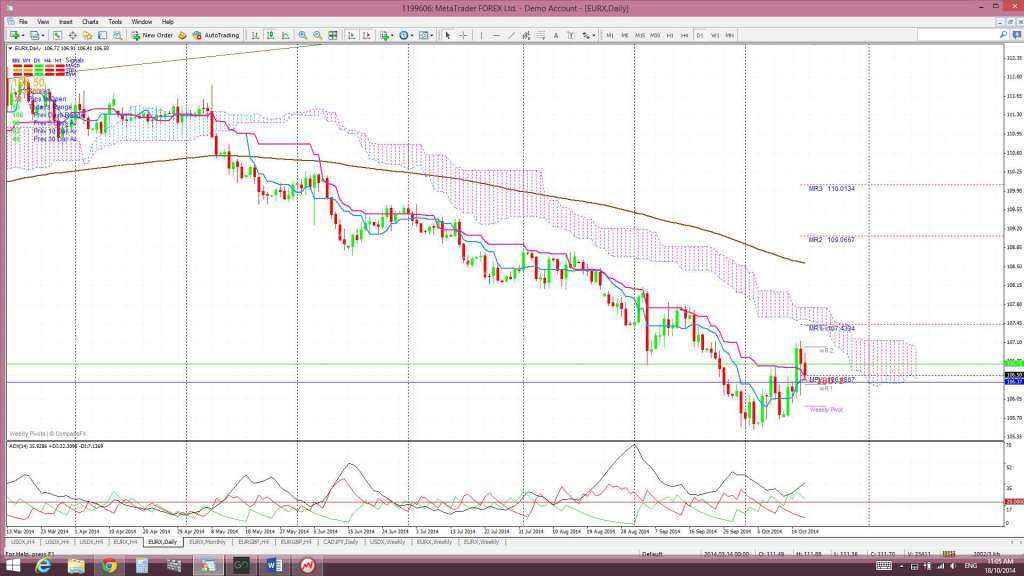
Daily Ichimoku Cloud chart: Price is still below the Cloud. There hasn’t been a bullish Tenkan/Kijun cross with an upward sloping Tenkan since April. That cross didn’t come to much but the Tenkan/Kijun lines are close to possibly crossing again. These are worth keeping an eye on!
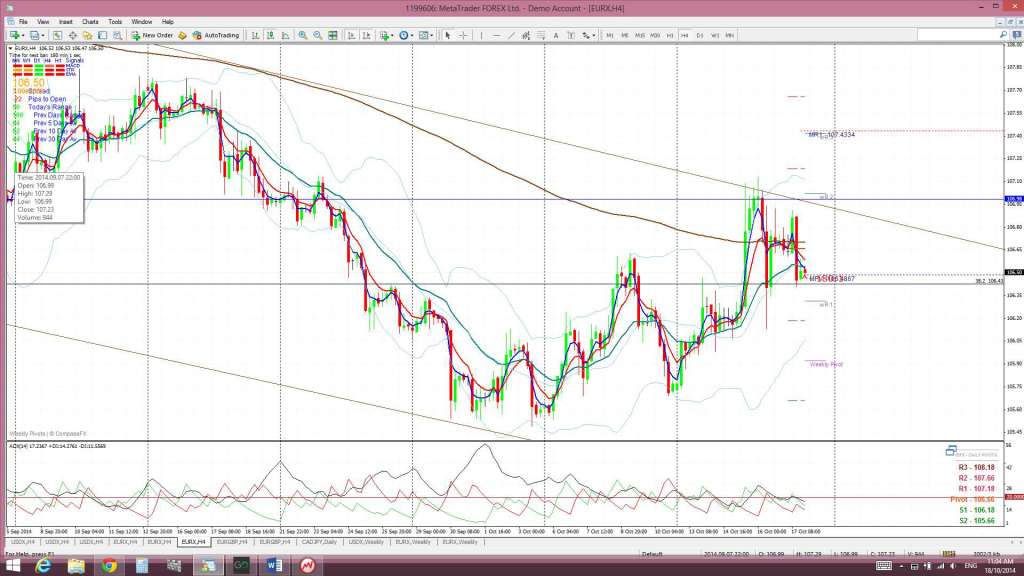
4 hr: Price chopped higher last week.
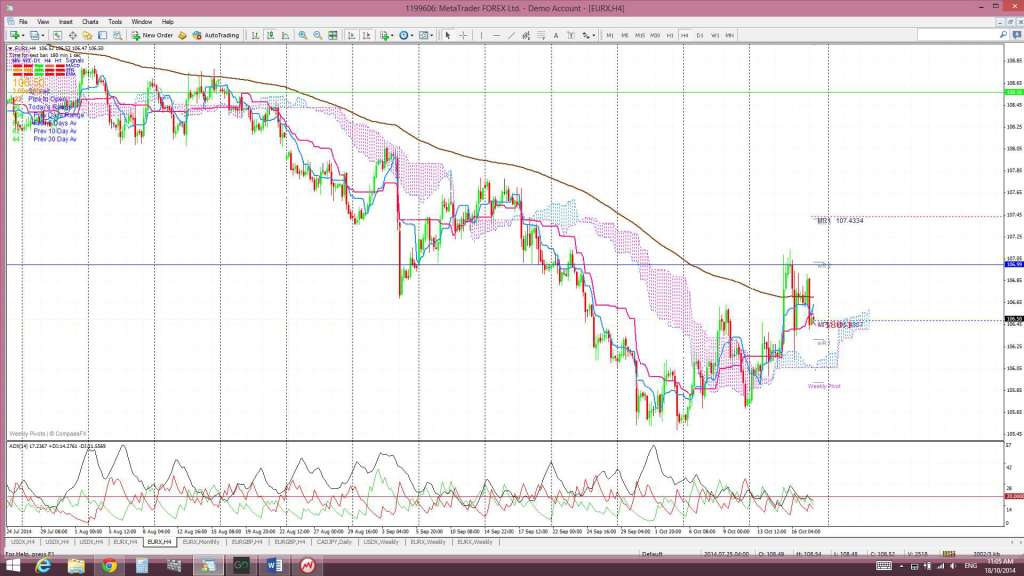
4 hr Ichimoku Cloud chart: The EURX chopped higher last week and broke back above the 4hr Cloud. This chart is divergent from the daily chart and suggests choppiness.
Comments:
NB: I continue having some parallax issues with trend lines as I move from 4hr, to daily weekly and monthly time frames.
General: Both FX indices are trading either side of the Cloud on their 4hr and daily charts and so are prone for choppiness. Thus, I’m expecting choppiness to flow through to FX pairs and, with the elevated VIX, I’m still seeing trading off shorter time frame charts during the US session as offering preferable trading opportunities.
USDX: the USDX had another bearish week. There is yet to be a monthly candle close above the monthly chart’s bear triangle trend line and price continues to consolidate just under this huge resistance level.
I am still on the lookout for a possible move back down to test the 81.50 level. This 81.50 level was recent strong resistance, forming up the top edge of an 11 month trading channel, and is also near the 61.8% fib of the recent bull move. A move back down to test this key fib and S/R level would not be out of order even if there is to be ultimate bullish continuation. However, a failure to hold above this 81.50 level would suggest a trend reversal is underway.
EURX: the EURX closed higher last week following on from clues given last week with the bullish-reversal weekly candle. The index is still well below key support levels of the weekly Cloud, the 108.5 level, the weekly 200 EMA and a previously broken weekly support trend line. This latest rally has come out of USD weakness though and is not based on any new positive Euro news. The main issue remains that divergence between the Eurozone and US economies continues to widen and this reprieve for the EURX may, thus, be short lived. I am on the lookout for a possible continued pull back on the EURX down to the 103 region as this is a 61.8% fib pull back of the latest bull move (2012-2013). It would also tie in with a possible inverse H&S on the monthly chart. Having said all that though, any reversal with the USD from the major resistance zone it is currently navigating could have the effect of boosting this EURX. Whilst such activity might not seem logical based on fundamentals….traders need to keep an open mind.
Note: The analysis provided above is based purely on technical analysis of the current chart set ups. As always, Fundamental-style events, by way of any Ukraine, Ebola, Eurozone or Middle East events and/or news announcements, continue to be unpredictable triggers for price movement on the indices. These events always have the potential to undermine any technical analysis.
The post USD still ‘marking time’: FX Indices Review. appeared first on www.forextell.com.

