Last week:Â It was a good week for Trade Charting with three valid TC signals yielding a maximum of 660 pips: GBP/JPY = 580 pips, GBP/USD = 120 pips and the A/J = -40 pips. These three signals were posted just after forming up on their respective 4hr candles.
As well as these TC signal moves there have been other technical breakout trades that were discussed in advance and then flagged in my blog updates that have delivered pips as well:Â
- The descending triangle breakout move on the A/U completed yielding the full quota of 280 pips.
- The U/J triangle breakout has now yielded up to 630 pips and
- One of the E/J triangle breakouts gave up to 160 pips.
This week:
The USDX continues to trade under major resistance and this remains a pivotal level for the index and a ‘make or break’ point. A review of this index can be found through this link. ‘New Home Sales’ is the first item of US data next week and is released on Wednesday so traders should watch to see how the USDX reacts to this data. Any softness here might be enough of a catalyst to get the USD retreating from these recent highs. I have a bit of a ‘wish list’ here. I’d like to see the USD pull back and for a return to some classic old style ‘risk on’. This being a rally for the usual gang of the E/U, A/U, Cable, Kiwi, Stocks and Commodities. I’m just wishing here though….not predicting! To help here though I’m playing this for the USD given its recent run.
There isn’t  a lot of scheduled  high impact data for this coming week.Â
I am away from Friday until Monday and so updates will be brief and less frequent during that period.
NB: Events in the Ukraine and the Middle East continue to have the potential to undermine any developing ‘risk’ appetite and need to be monitored.
Stocks and broader market sentiment:
The S&P500 index has closed back above the psychological 2,000 level and the DJIA closed at a new all time high. The S&P500, DJIA and NASDAQ all printed bullish weekly candles but the Russell 2000 printed a bearish one. Now this bearish weekly candle on the small cap index could be a warning bell or it might just be suffering a bit in the wake of last week’s massive Alibaba IPO event.
I am still seeing divergence on the monthly S&P500 monthly chart though and whilst this might just be warning of a pause, as the index navigates these new highs up at the 2000 region, the chance of a pullback cannot be ruled out either. There has not been any real deep pull back since the break up through the 1,577, 1,600, 1,700 and 1,800 levels and the major break of the 1,577 level was only tested once. Thus, I am still being cautious here now even though the daily support of the S&P500 has not been broken.Â
It is worth noting that a 61.8% fib pull back of the recent bull run (Nov 2012-present) would bring price down to near the 1,577 area. This remains significant as it is the breakout level of the previous highs from the 2000 and 2007 peaks. I would expect this region could be a target if there was any pullback on the S&P500.
Thus, with all of this, I continue to watch out for further clues as to any new momentum move, long or short though! In particular I’m looking out for:
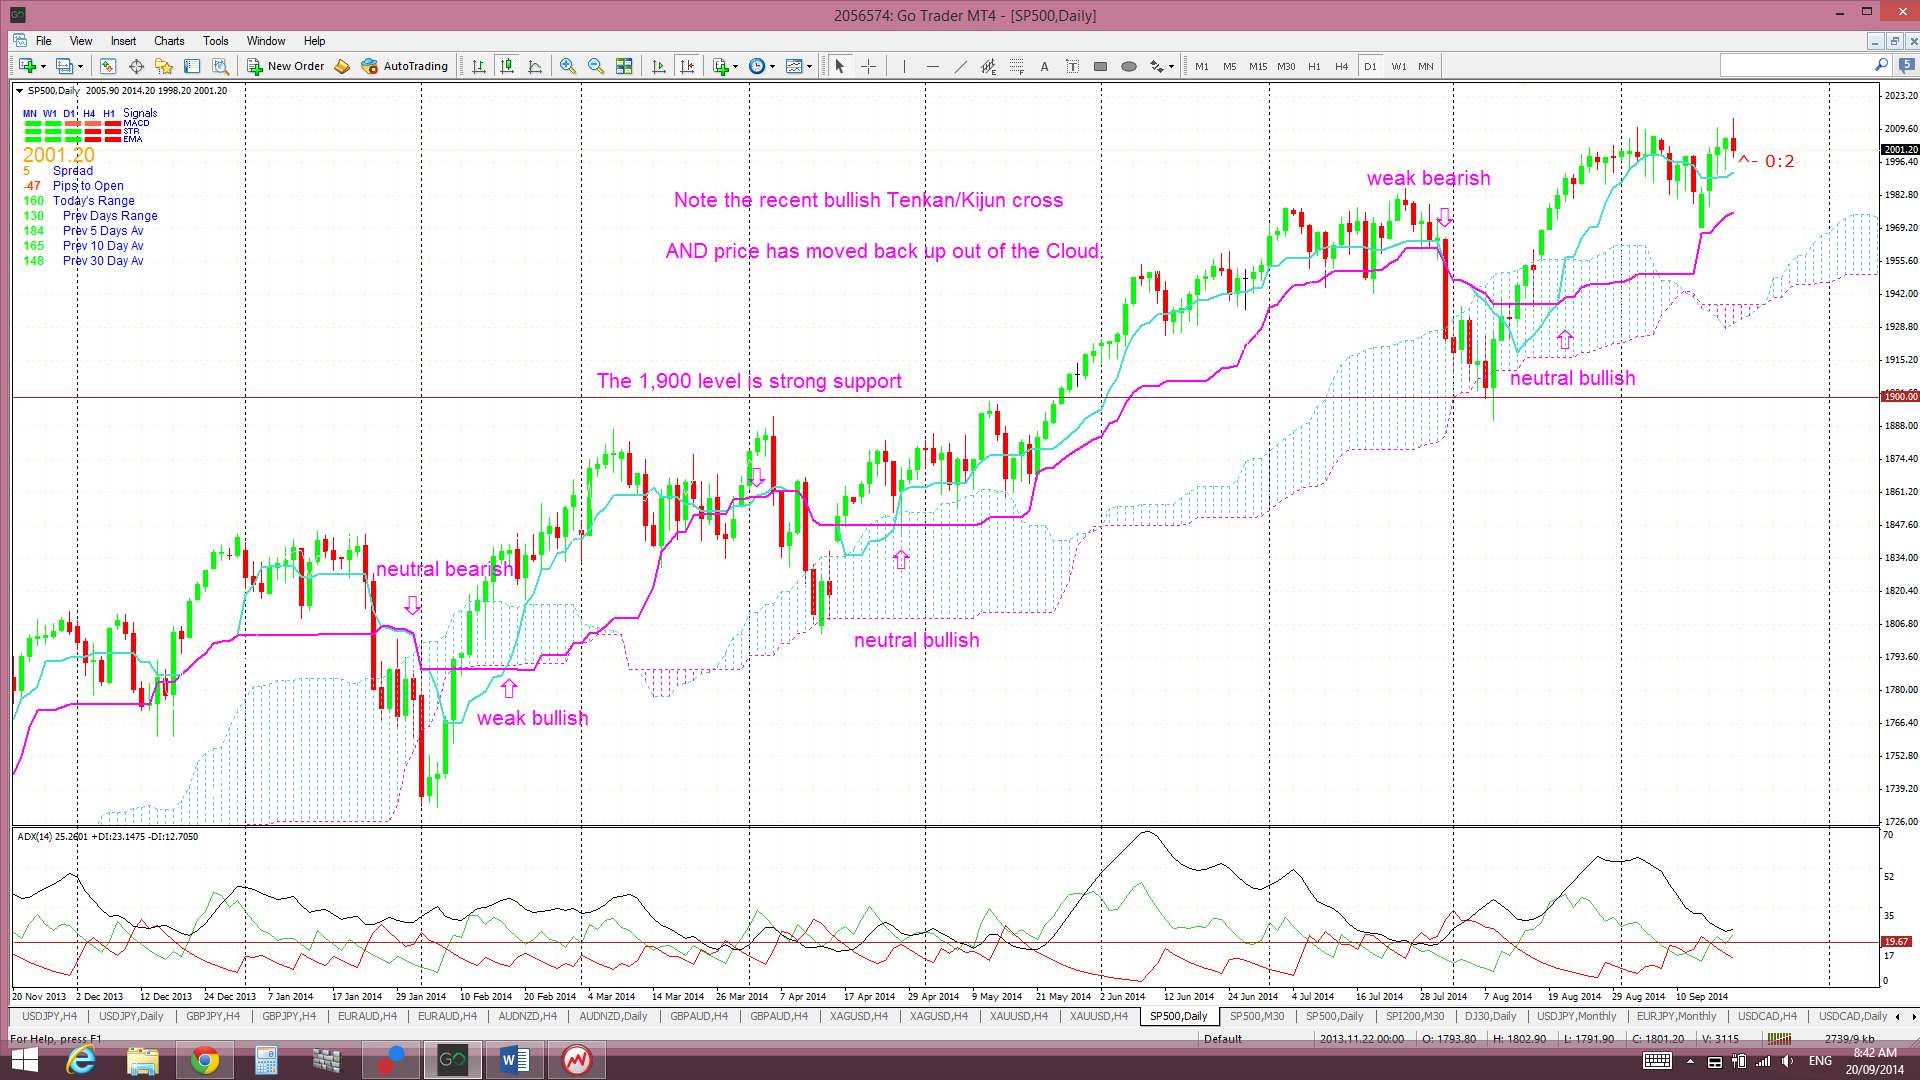
S&P500 daily chart: I’m watching for any break of the daily trend line but price is holding above this for the time being. The index also continues to hold above the top trend line of the bullish ascending triangle (1,900).

Ichimoku S&P500 chart: a clear cross of the blue Tenkan-sen line below the pink Kijun-sen line. However, the bullish Tenkan/Kijun cross signal on the index is still open and the index is still trading above the Cloud which is bullish.
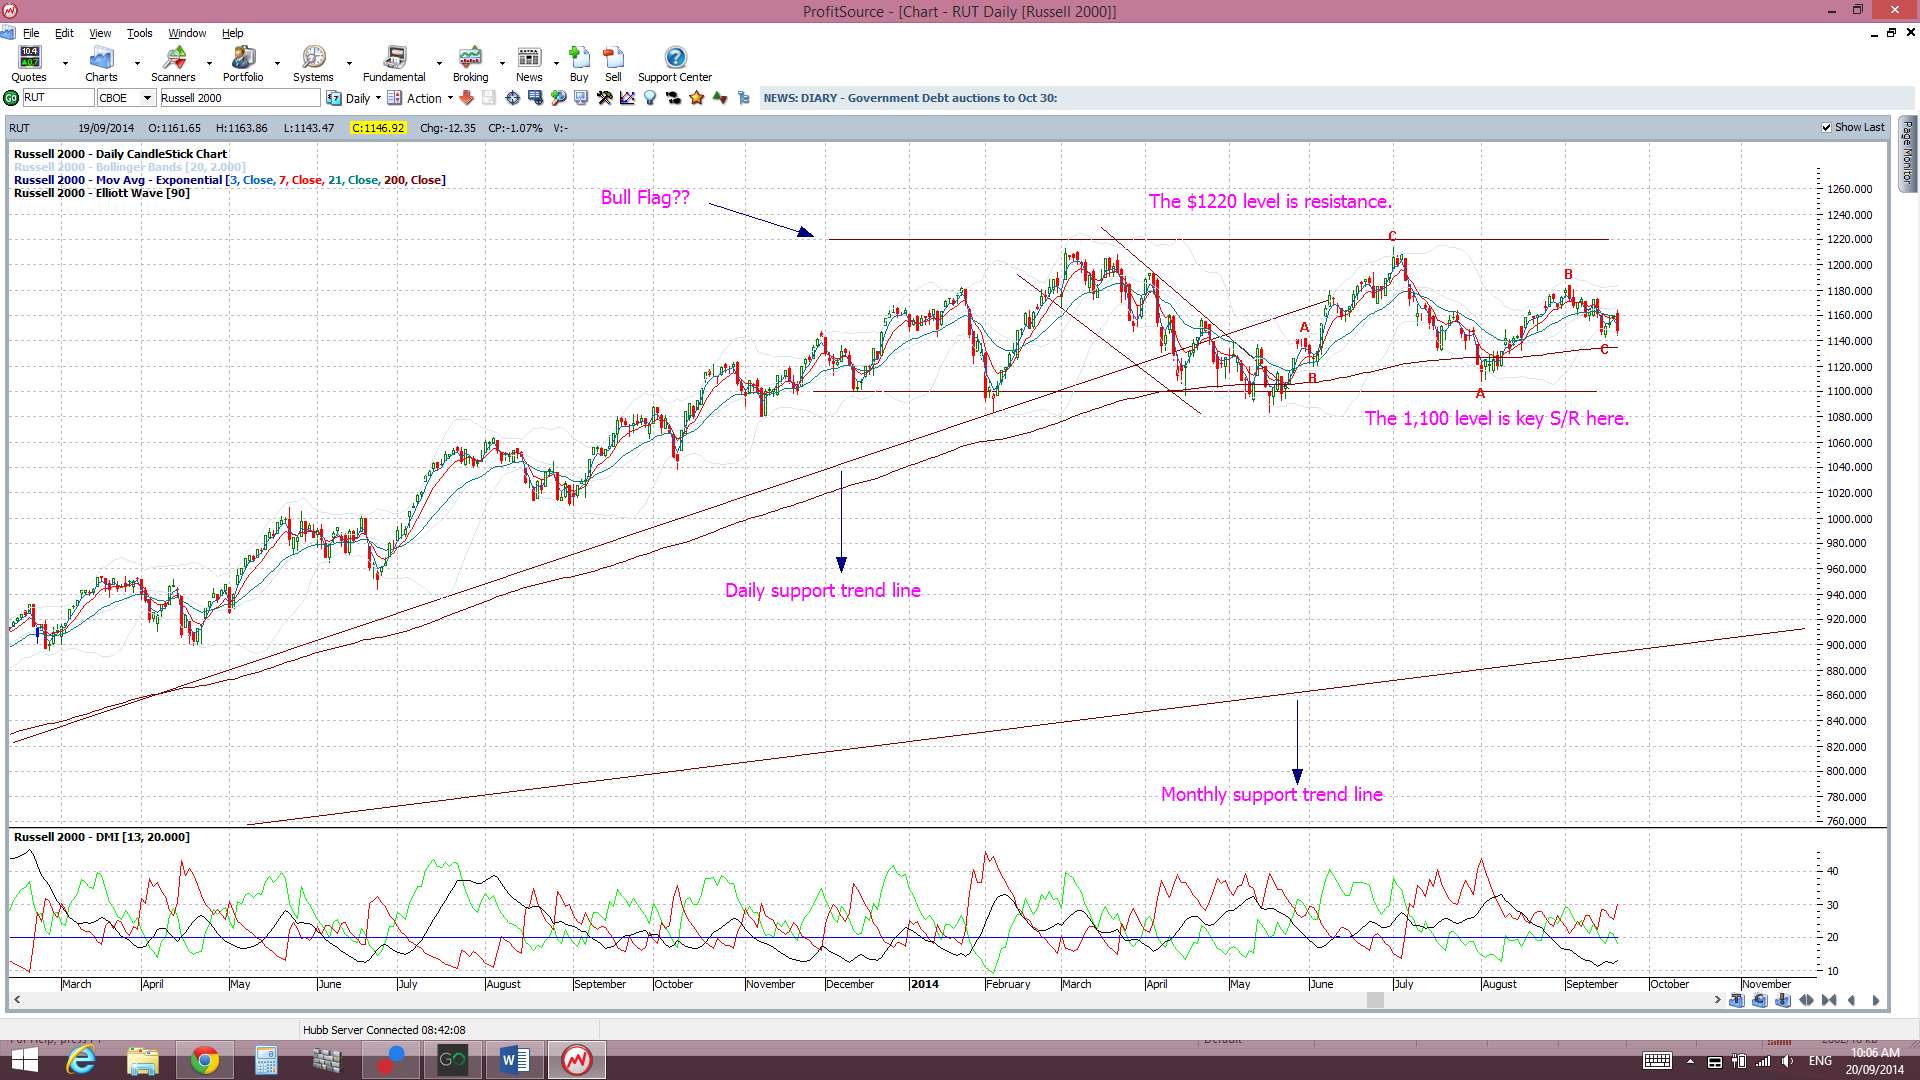
S&P500 monthly chart: a break of the monthly support trend line (see monthly chart). The monthly trend line remains intact.Â

Russell 2000 Index: this small caps index is a bit of a US market ‘bellwether’ and I see the 1,100 level as key support here. The index, although printing a bearish weekly candle, continues to hold above this support for the time being:
Trading Calendar Items to watch out for:
- Sat 20th: NZD Elections. G20 Meetings.
- Sun 21st: G20 Meetings.
- Mon 22nd: EUR ECB President Draghi speaks.
- Tue 23rd: JPY Bank Holiday. CNY HSBC Flash Manufacturing PMI. EUR French & German Flash Manufacturing PMI. CAD Core Retail Sales.
- Wed 24th: NZD Trade Balance. EUR German Ifo Business Confidence. USD New Home Sales.
- Thurs 25th: AUD RBA Gov Stevens speaks. USD Core Durable Goods & Unemployment Claims.
- Fri 26th: nil
Forex:
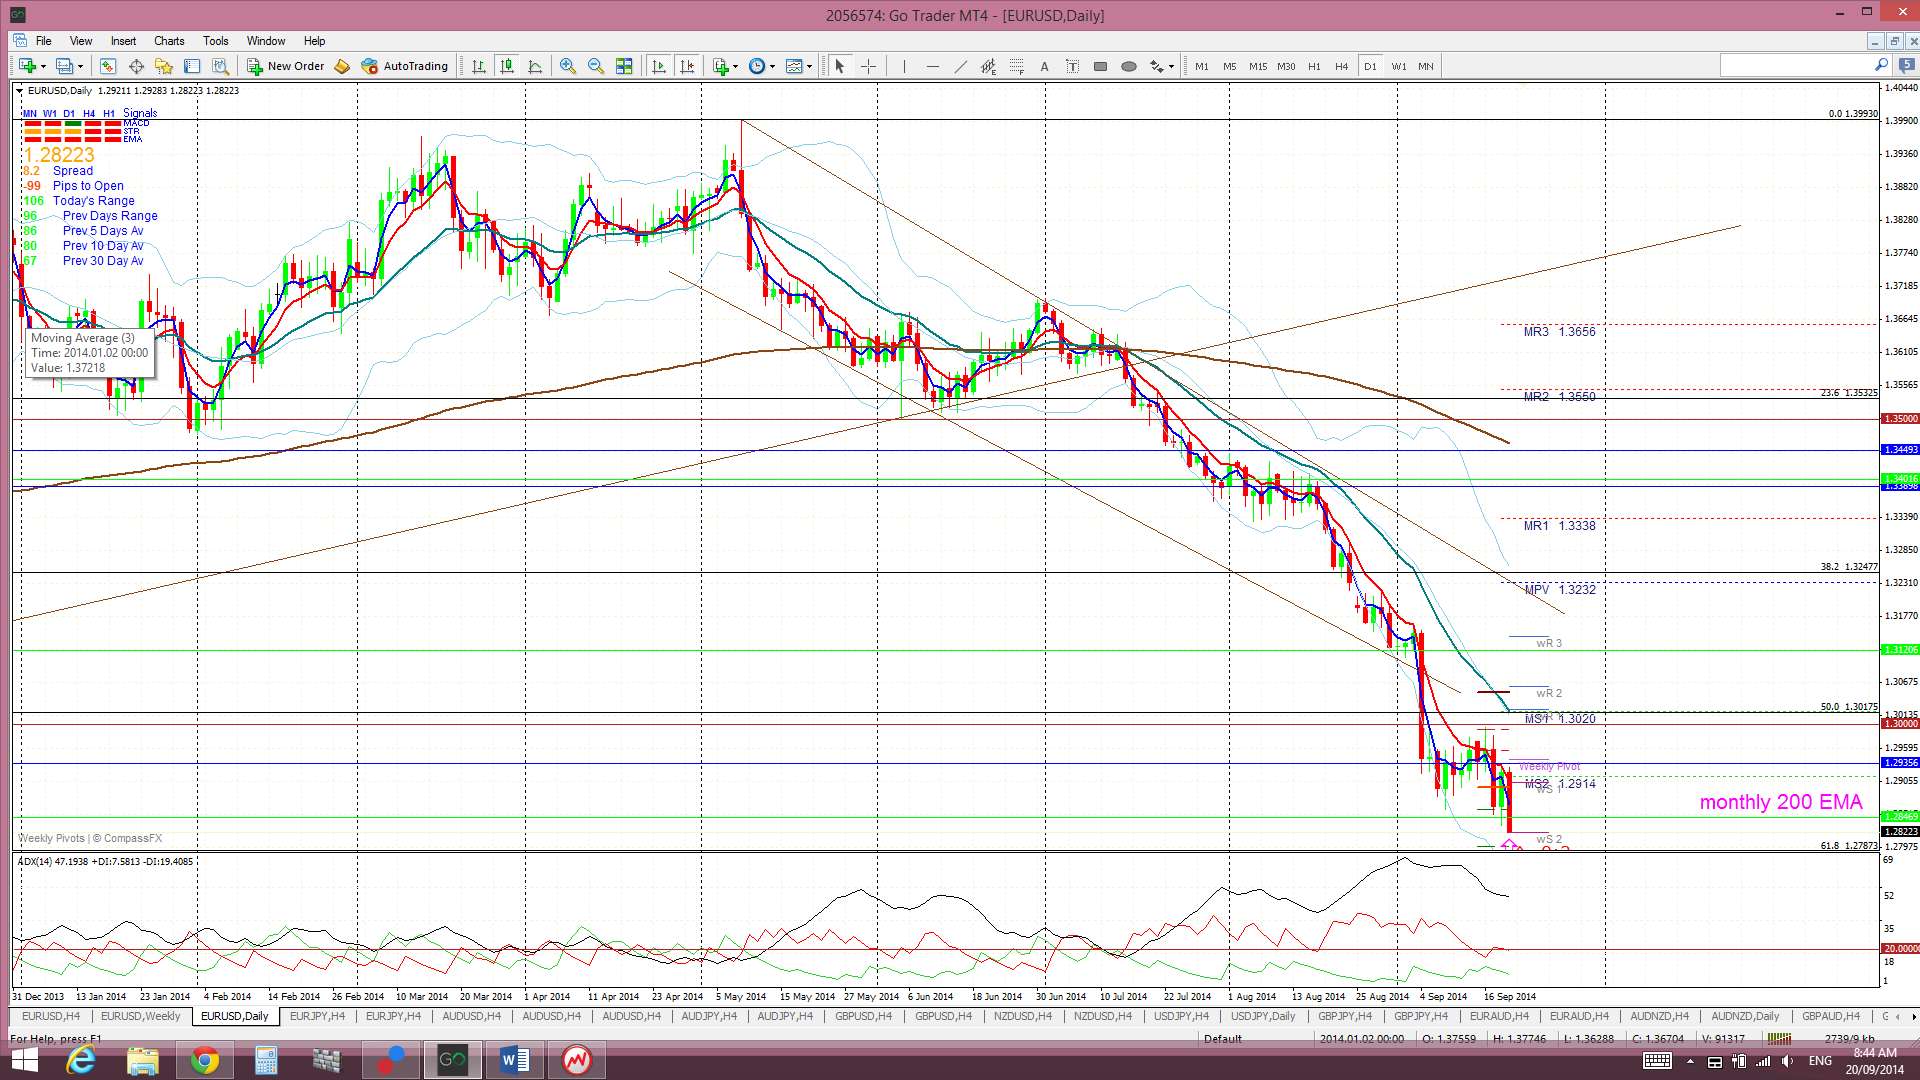
E/U: The E/U chopped sideways under the key 1.30 level but above the support of the monthly 200 EMA for much of last week.  I had been expecting that we might see the broken 1.30 level tested before any potential bearish follow through, given that this is a major whole-number psychological level and 50% fib of the latest bull move, and price did come to within a few pips of this key level during the week. The E/U drifted lower on Friday though, triggered a new TC ‘short’ signal and broke below the support of this monthly 200 EMA.
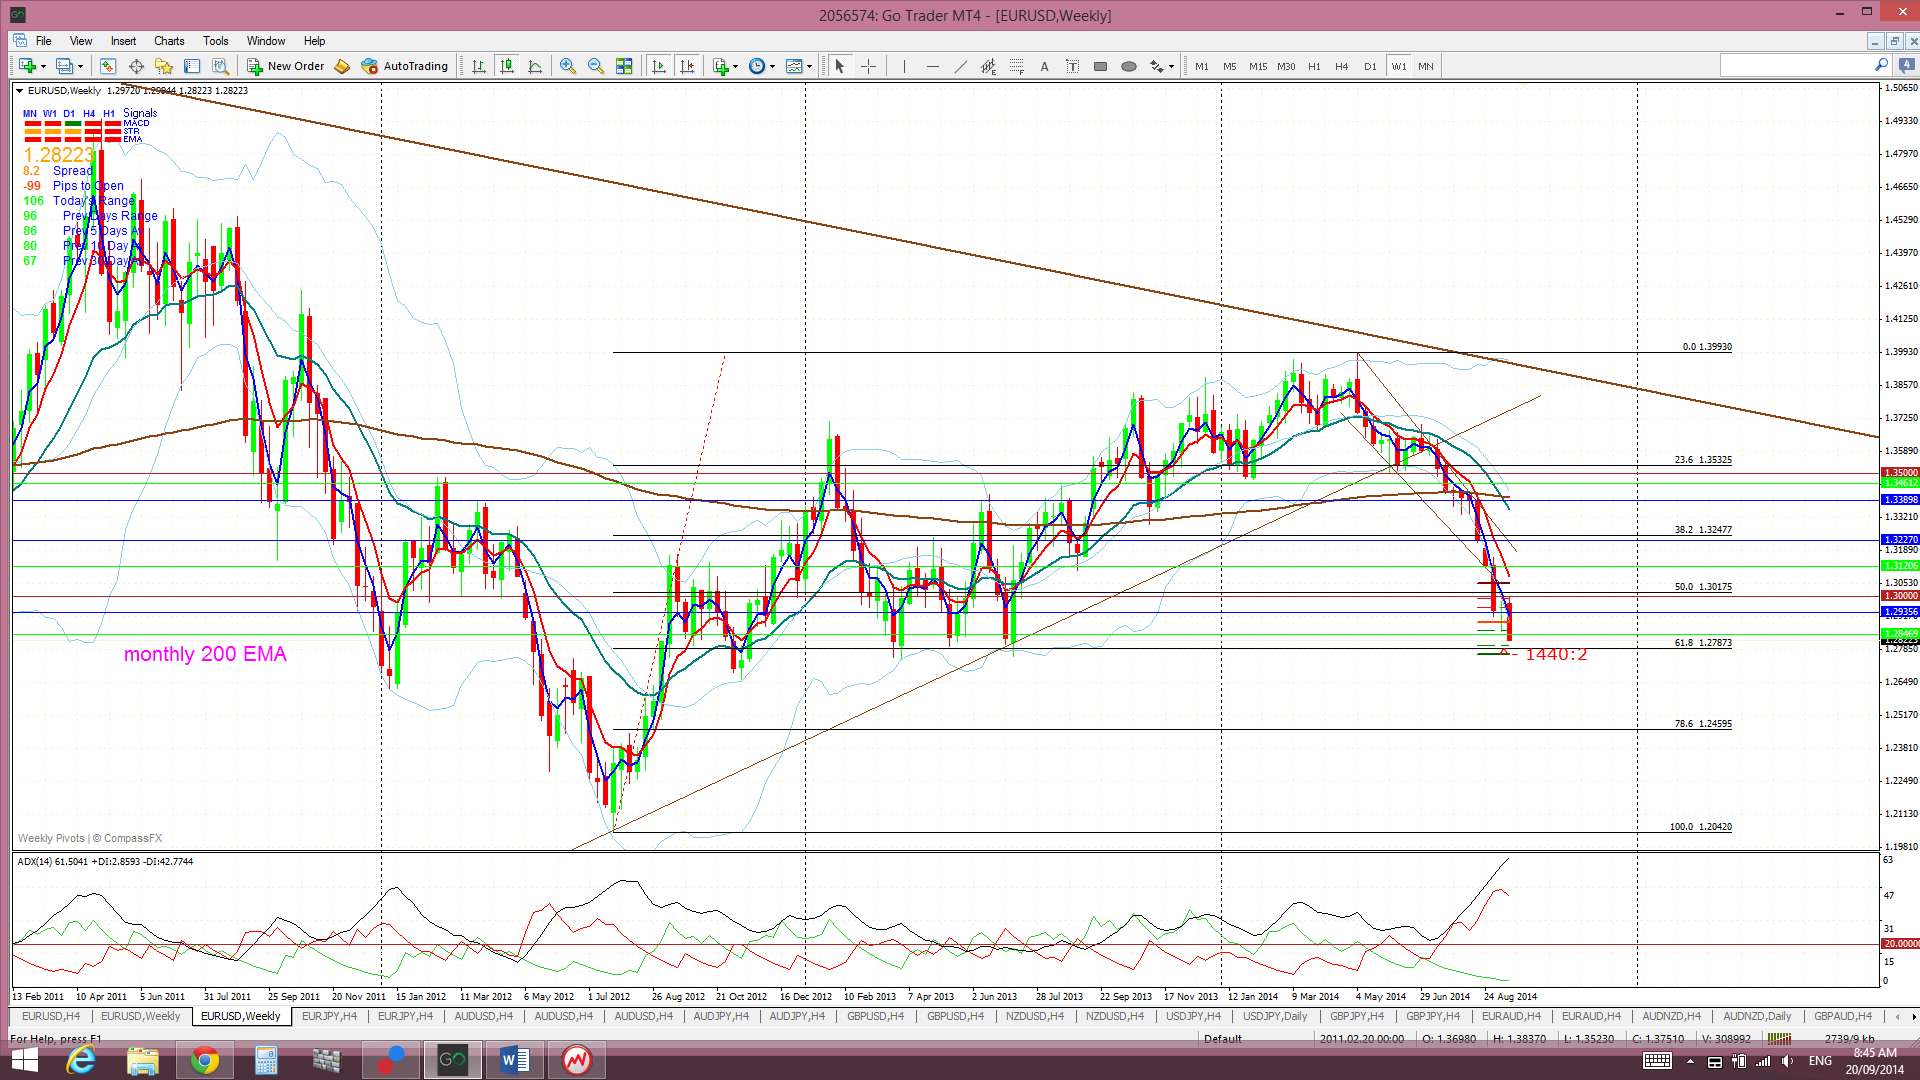
I am wary shorting here just now though as price is sitting right above the important technical support of the 61.8% fib level of this latest bull run. This fib is located just below the 1.28 level. The weekly chart shows just how significant this level has been on the E/U; it has been a major support region over recent years. The other cautionary note remains that the USD index is still struggling to break above major resistance and any potential reversal with this index might actually help to boost the E/U. Thus, I would prefer to wait and see a close and hold below the 61.8% fib support level BEFORE shorting the E/U:
E/U weekly: note the strong support at the 61.8% fib level:
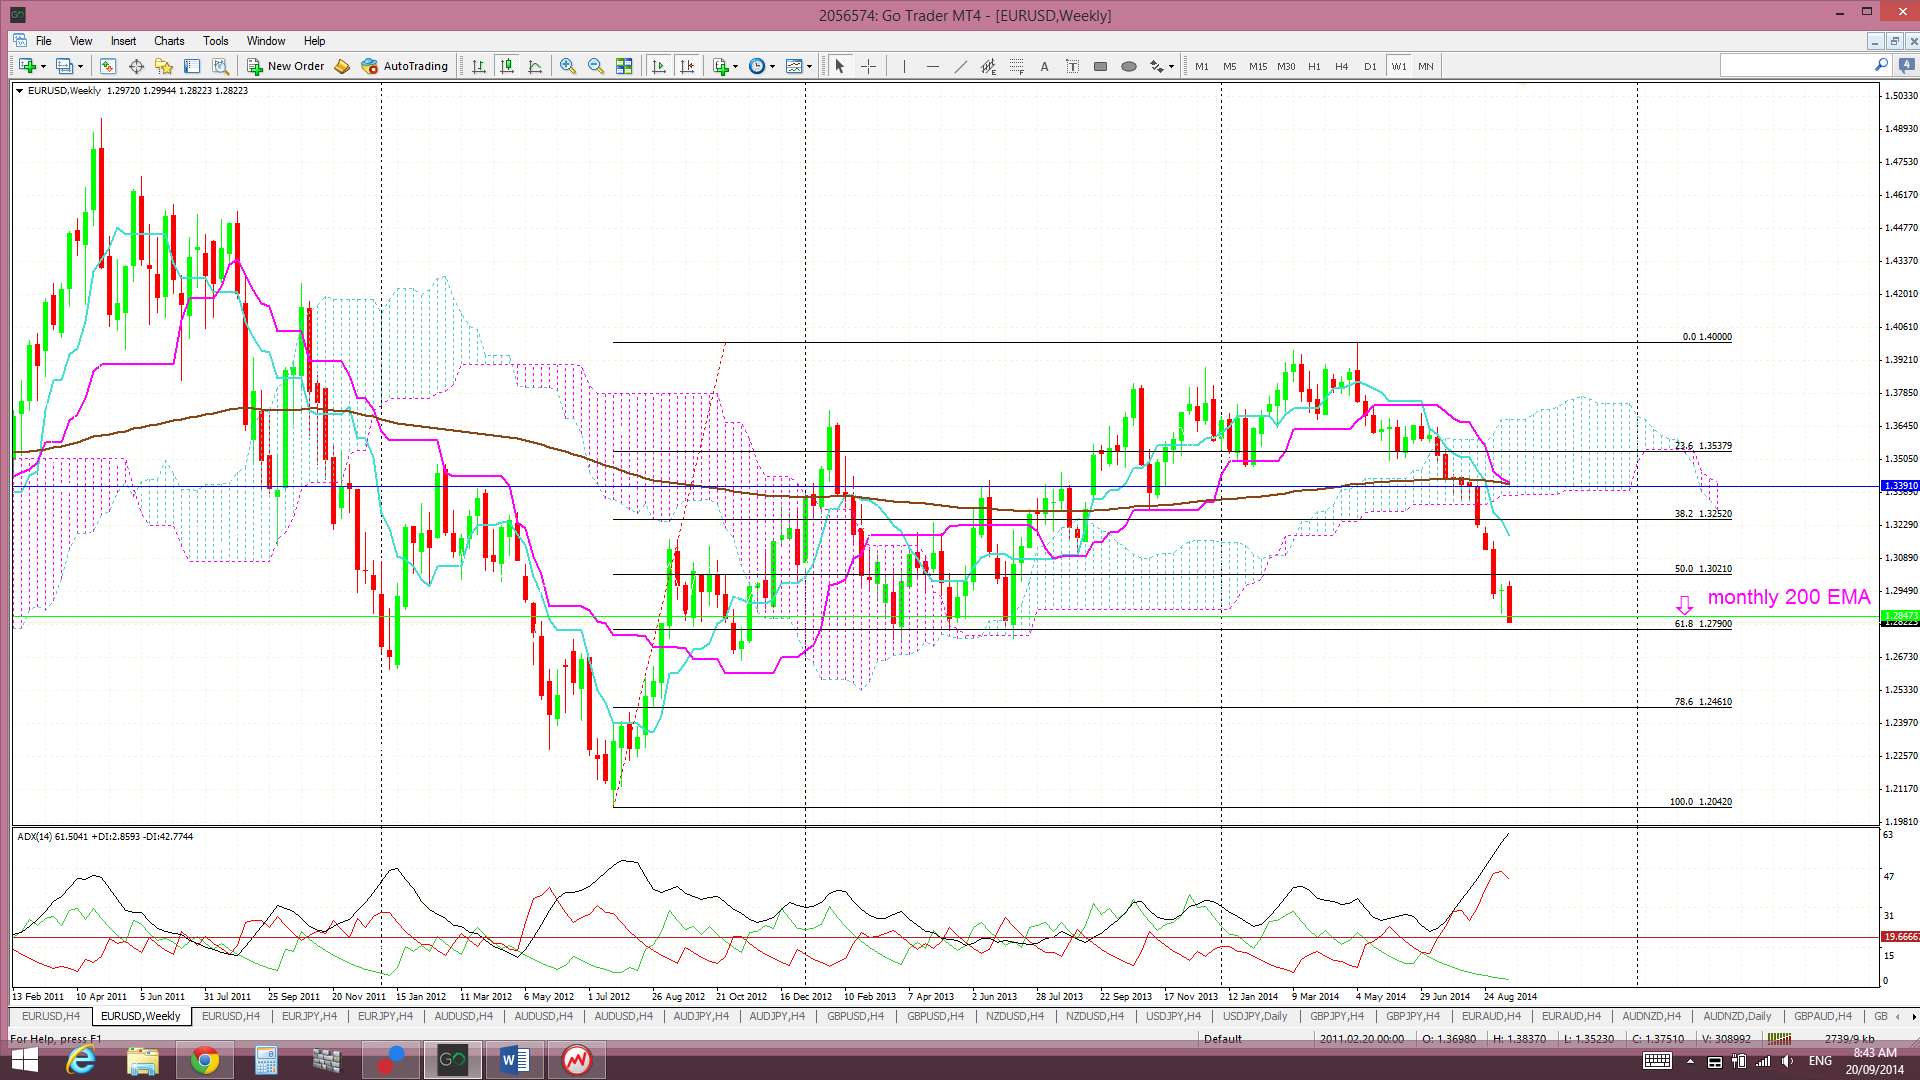
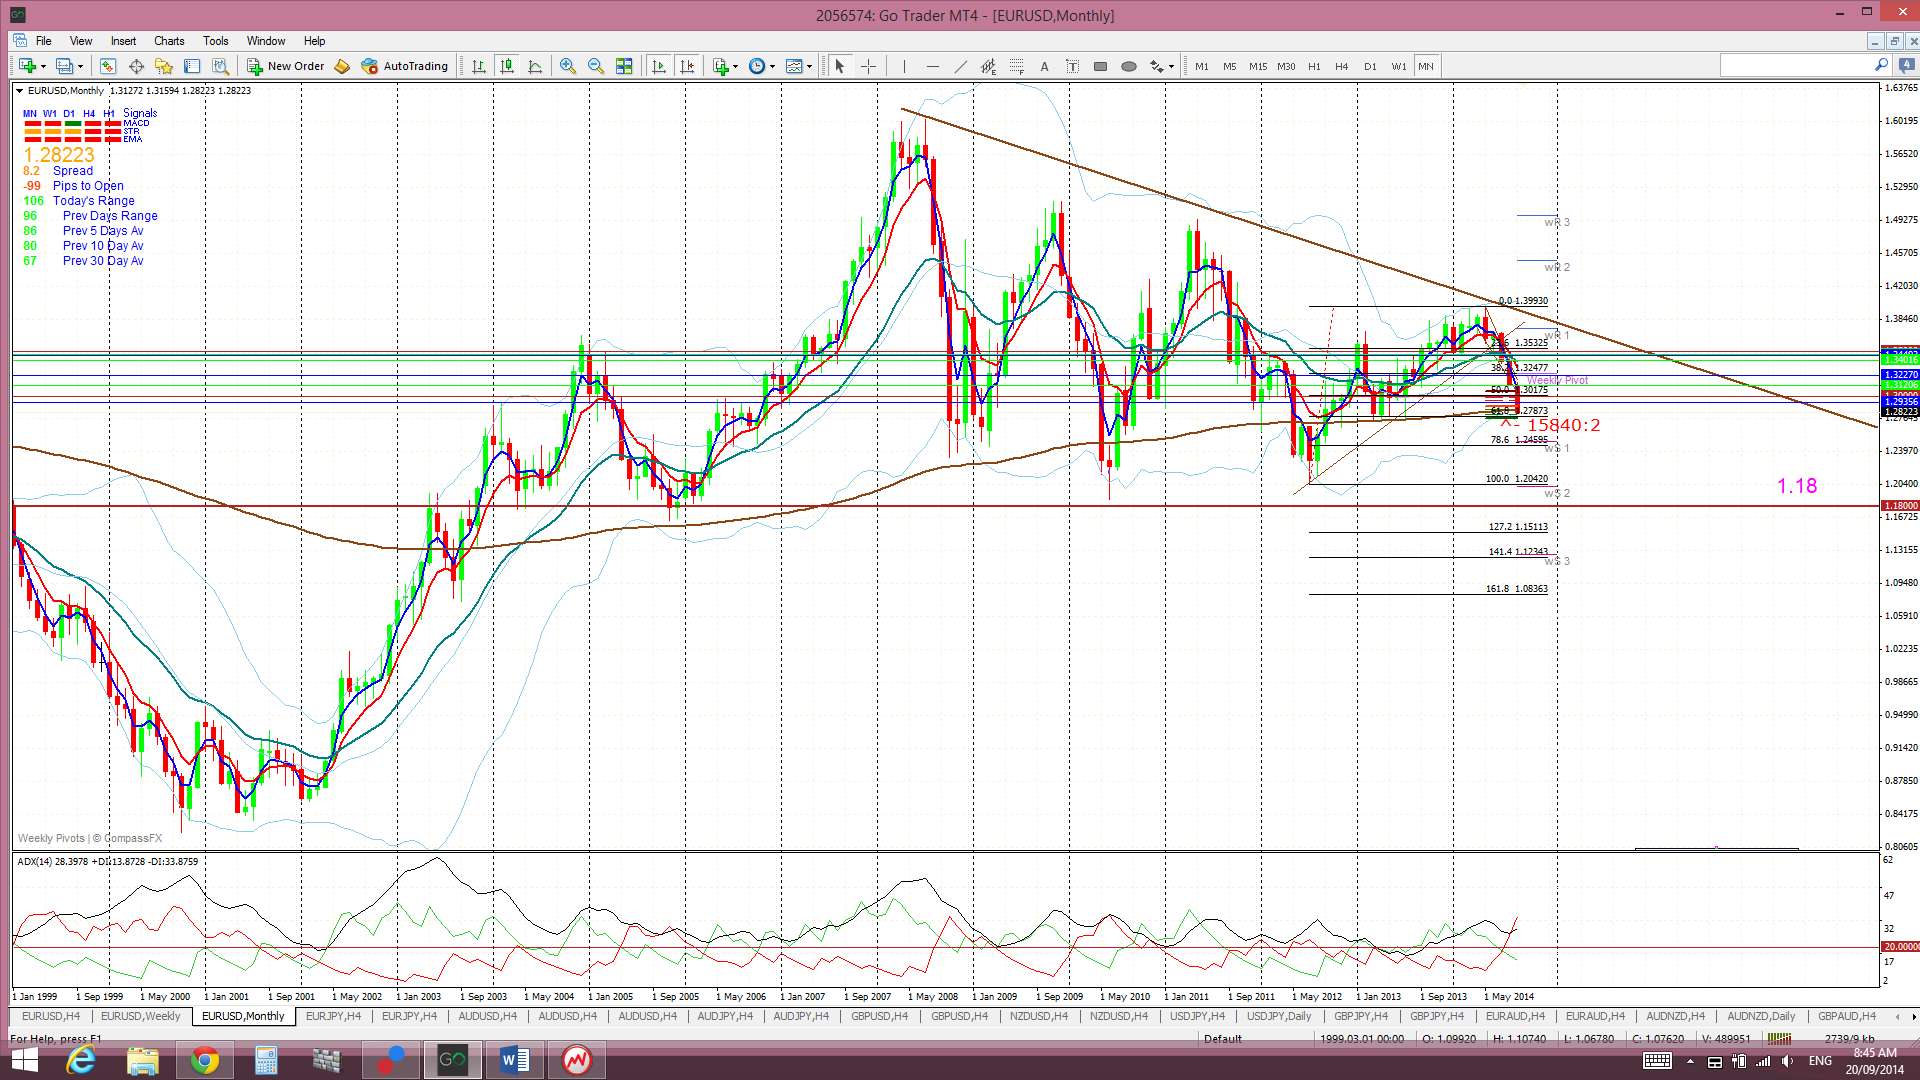
I posted an article about the E/U on Thursday and this can be found through the following link. In this article I mentioned how I’m now seeing the E/U in more of a descending triangle on the monthly chart. Thus, any break and hold below the this 61.8% fib, near 1.28, would have me taking a ‘short’ with a target being down at this bottom triangle trend line near 1.18. That would be some move but would most likely need the USDX to make a bullish breakout from its own monthly triangle pattern.
Price is still trading below the Ichimoku Cloud on the 4hr, daily chart, weekly and monthly charts which is bearish.
The weekly candle closed as a bearish engulfing candle.
- There is a new TC signal on this pair BUT I will wait for a close and hold below the 61.8% level.

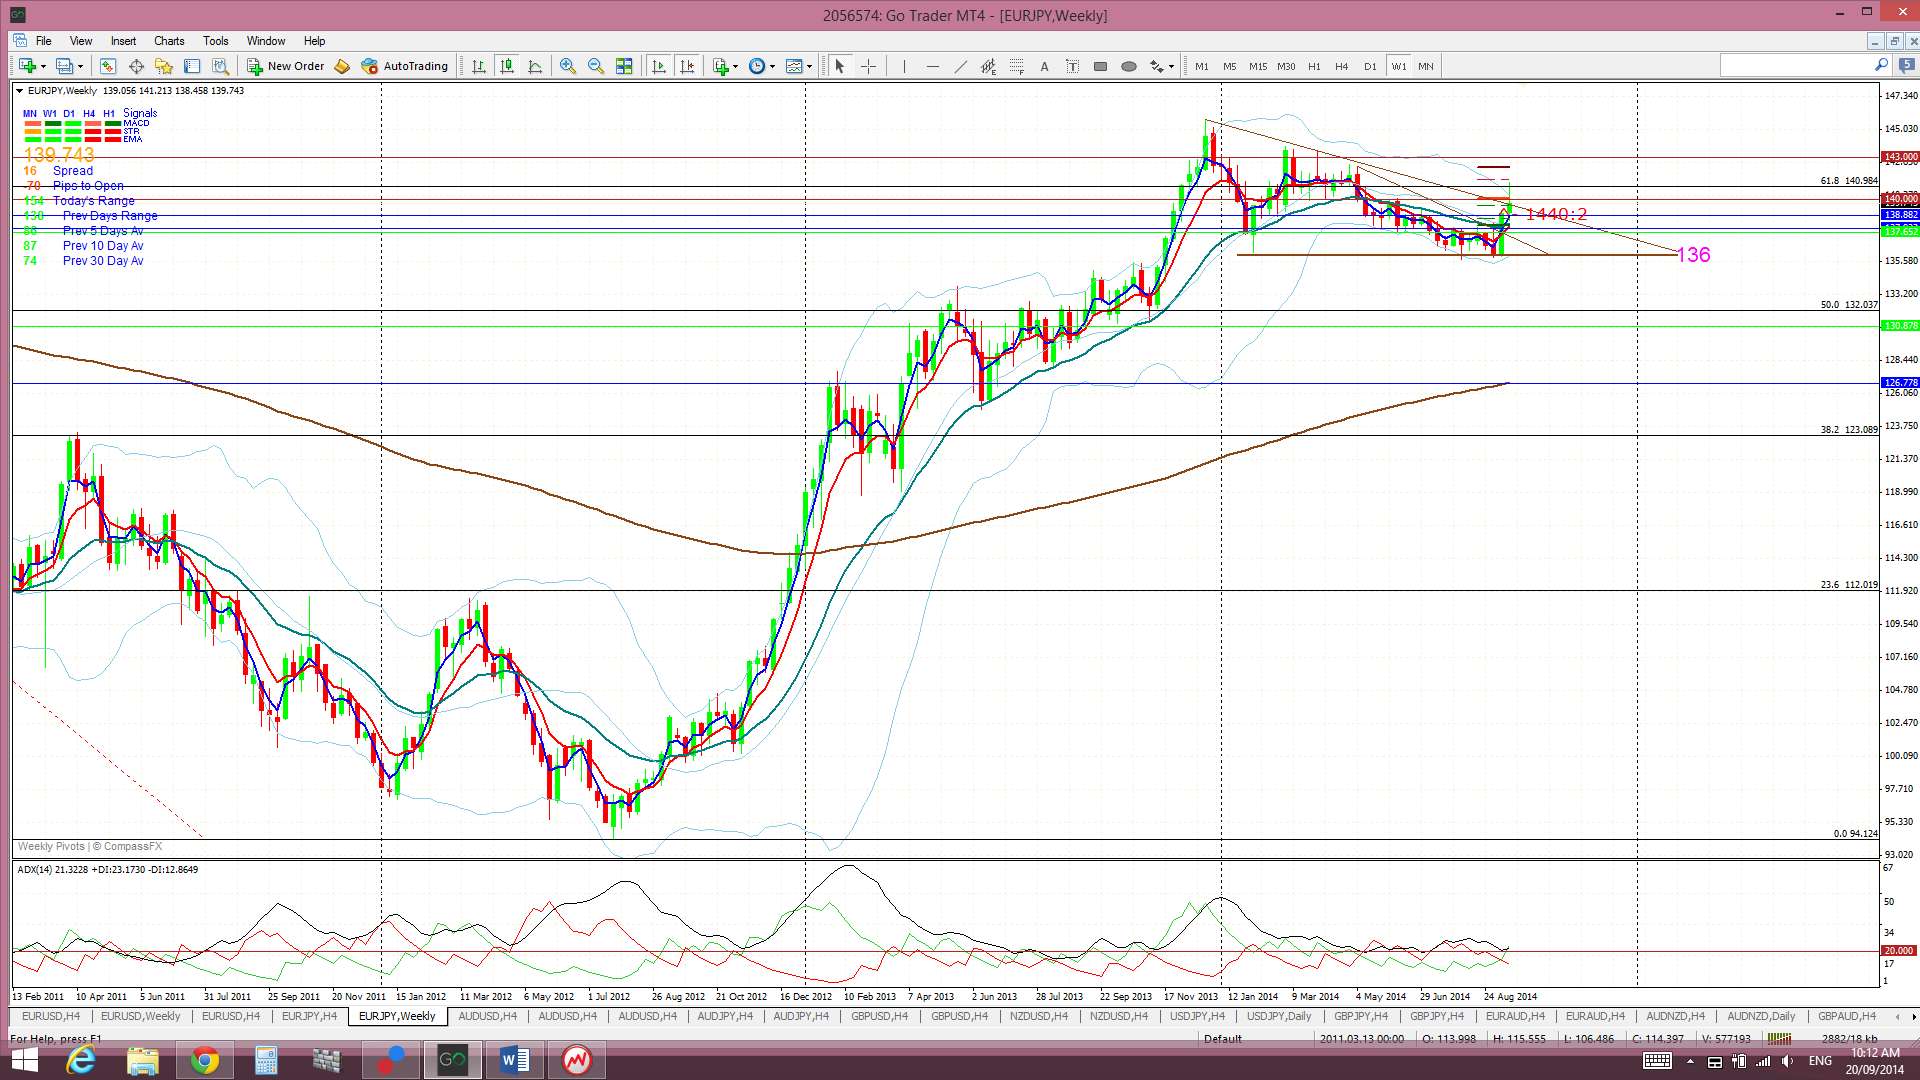
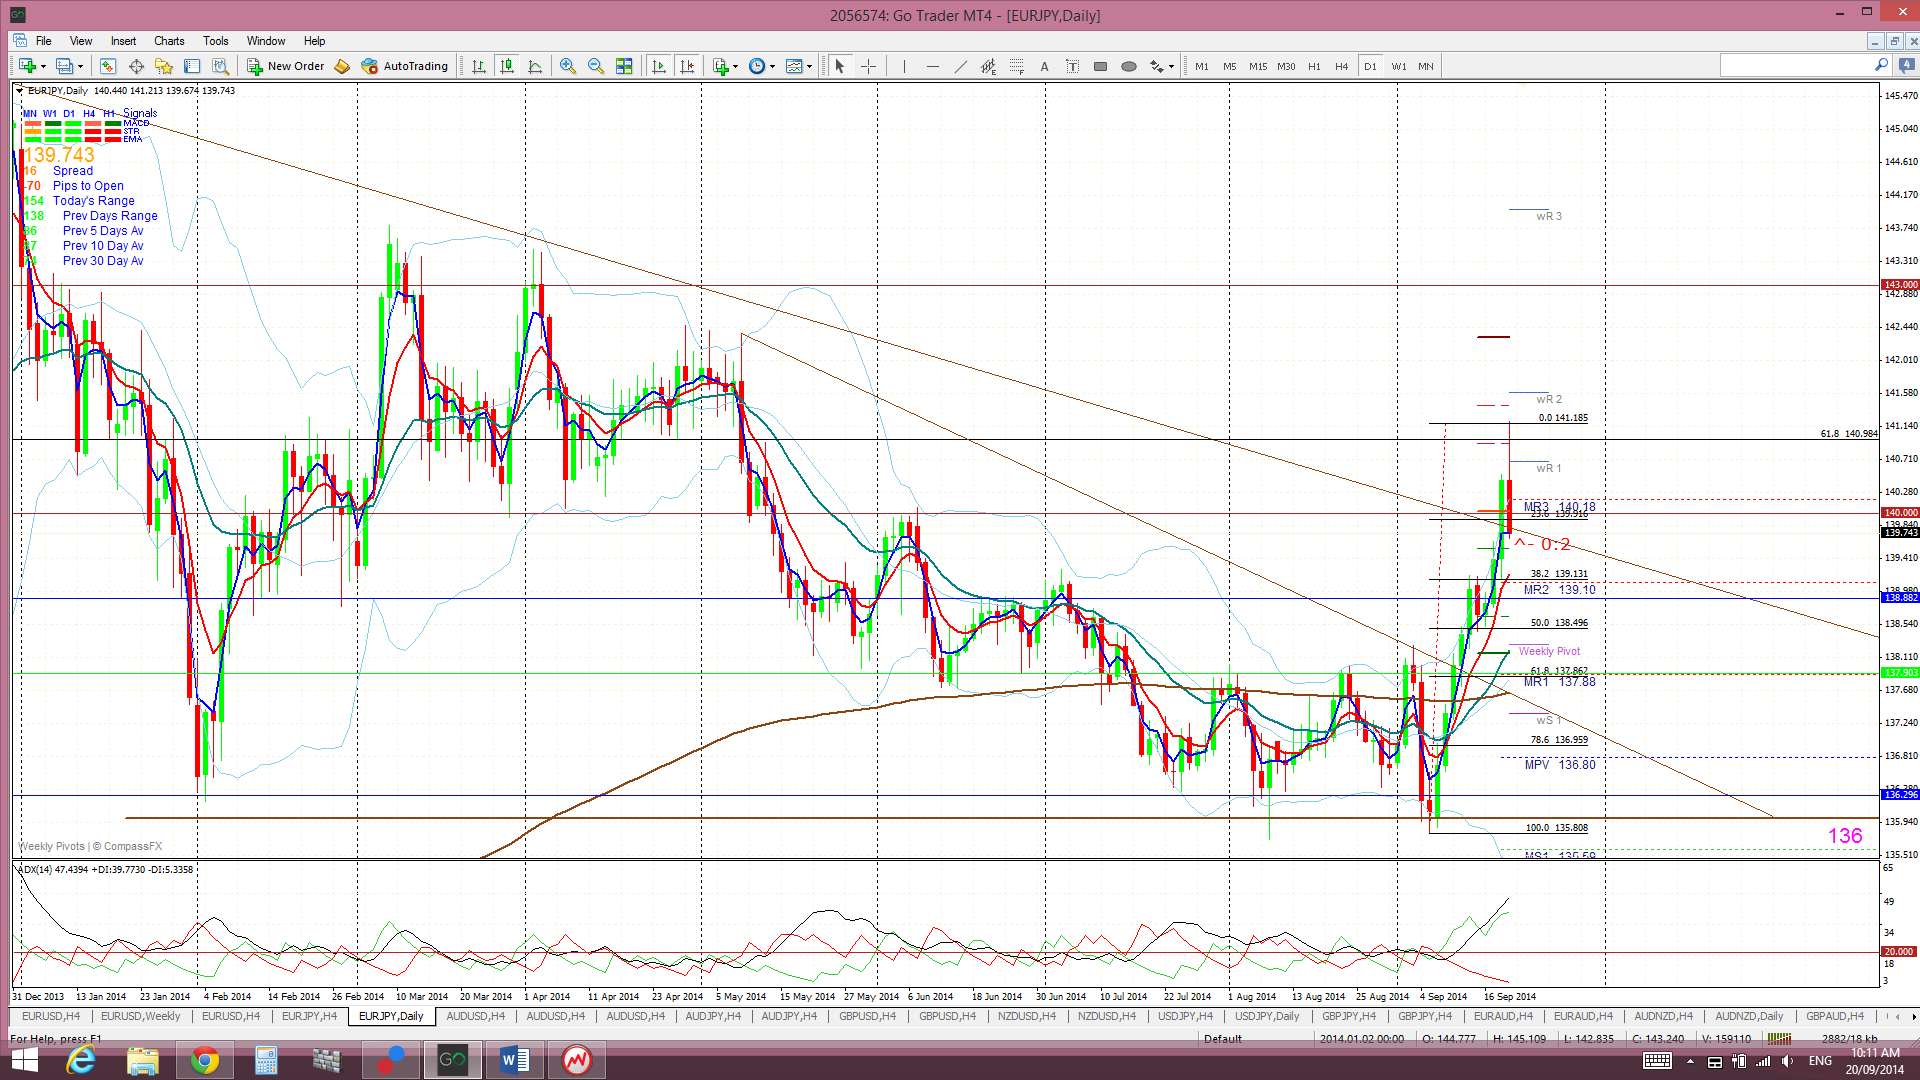
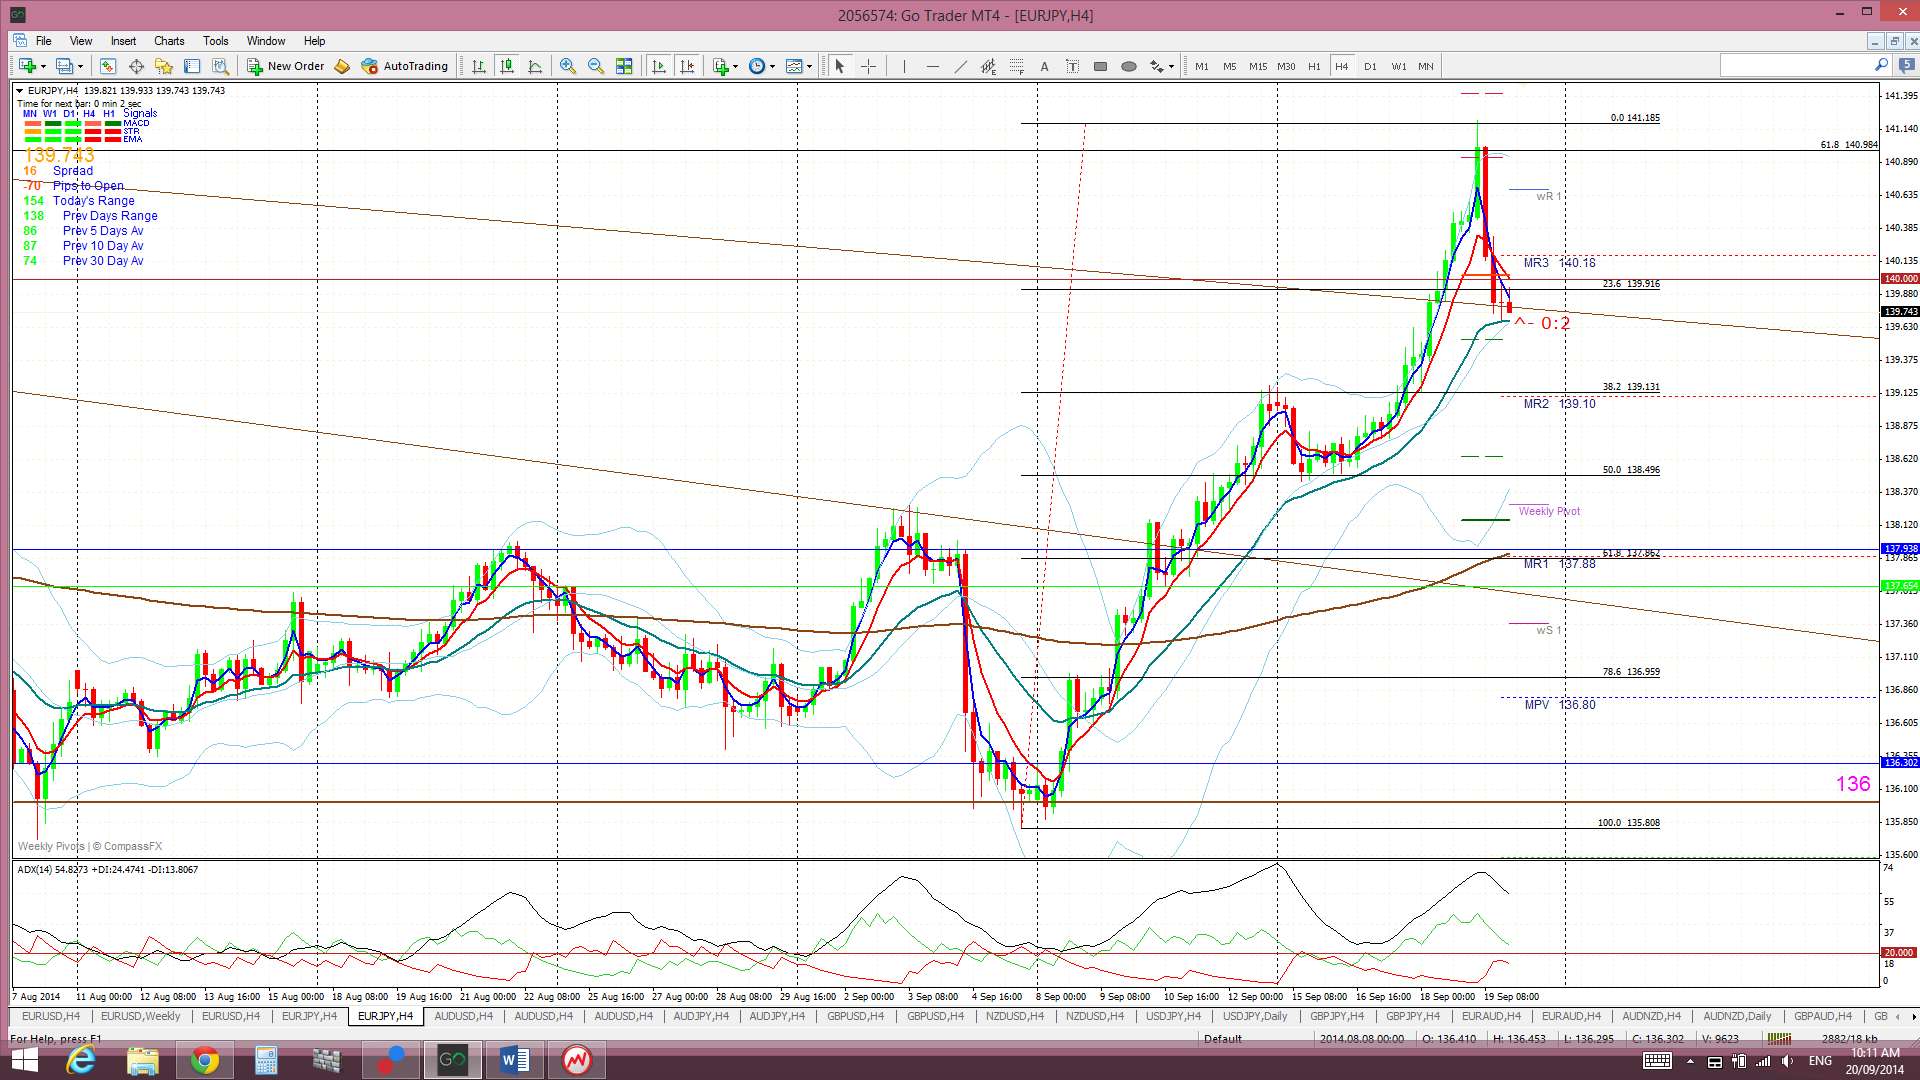
E/J: The E/J continued its rally after bouncing up off the 136 support in the previous week and it has now run for around 500 pips since then. The previous week’s breakout from the daily chart’s triangle pattern continued and this move delivered up to 160 pips.
The E/J has now also broken up and out from weekly chart’s descending triangle pattern which had been giving E/J charts the ‘Bull Flag’ appearance that I have been seeing here for some months now. A hold above this weekly triangle trend line would suggest bullish continuation.
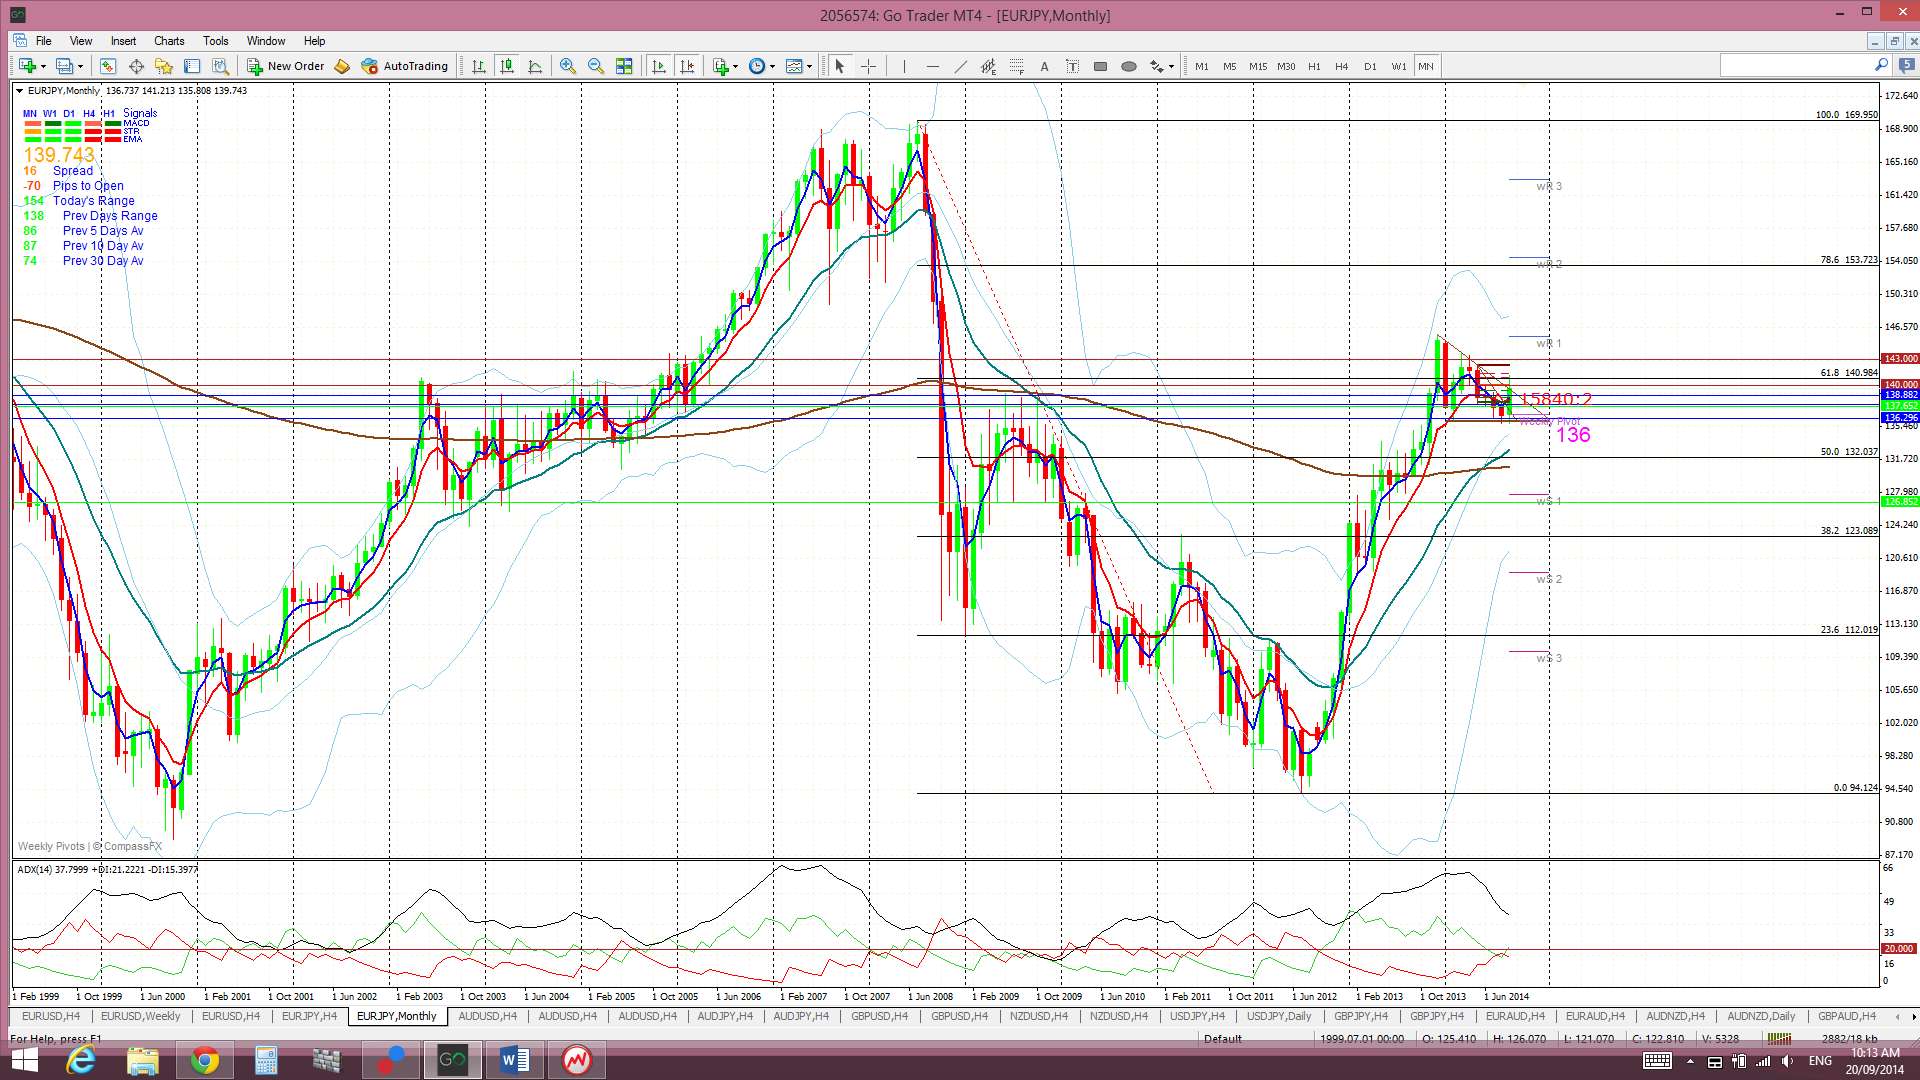
Following on from this weekly triangle breakout the E/J then spent much of Friday negotiating the next major resistance level in its path. This being the 61.8% fib of the 2008-2012 bear move, near the 141 level, and a pivotal level for this pair. The E/J failed to move above this resistance though and pulled back to test the broken triangle trend line. Whilst I would be expecting that this triangle trend line might support price here I do see potential for a deeper pull back. I note that a 61.8% fib pull back of the recent bull move would bring price down to near the previous daily chart triangle trend line, the weekly pivot, the daily 200 EMA and the 4hr 200 EMA and the combined effect of these key S/R levels might act as a magnet for price. Much of the previous rally up from 136 seems to have been fueled by the U/J bull run. Any pause or pull back on the U/J, along with the EUR weakness that crept in late last week, might help to see the E/J give back some of its recent gains and test the 61.8% fib.
Any new close and hold above the 141 level though would suggest a trend reversal and bullish continuation. I would expect the 78.6% fib, up at the 154 region, would be the next ultimate target for any such move.
Price is still trading above the Cloud on the 4hr, daily chart, and monthly chart and at the top of the Cloud on the weekly chart. The November and December candles were the first to close above the resistance of the monthly Ichimoku Cloud since 2008.
The weekly candle closed as a small bullish candle with a long upper shadow.
- I’m watching for any new TC signal on this pair, the triangle trend lines and the 141 / 61.8% fib level.
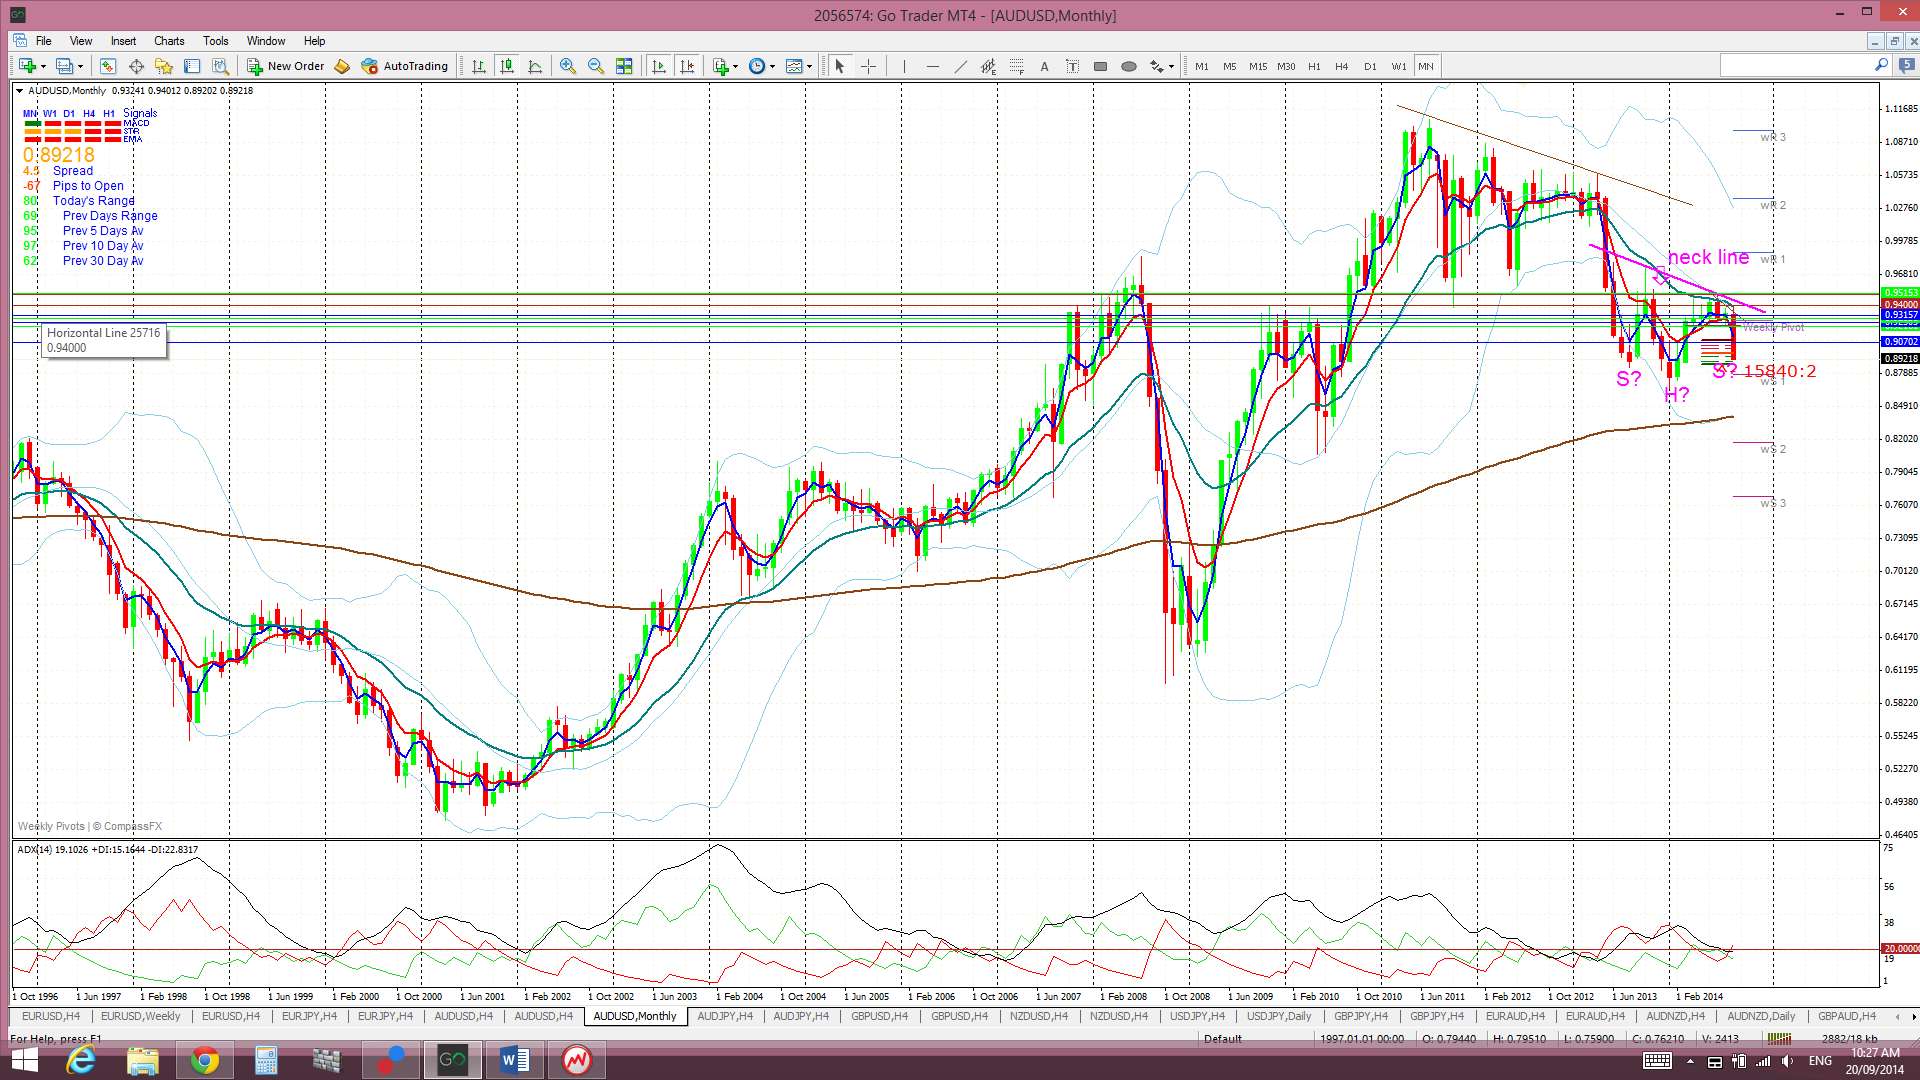
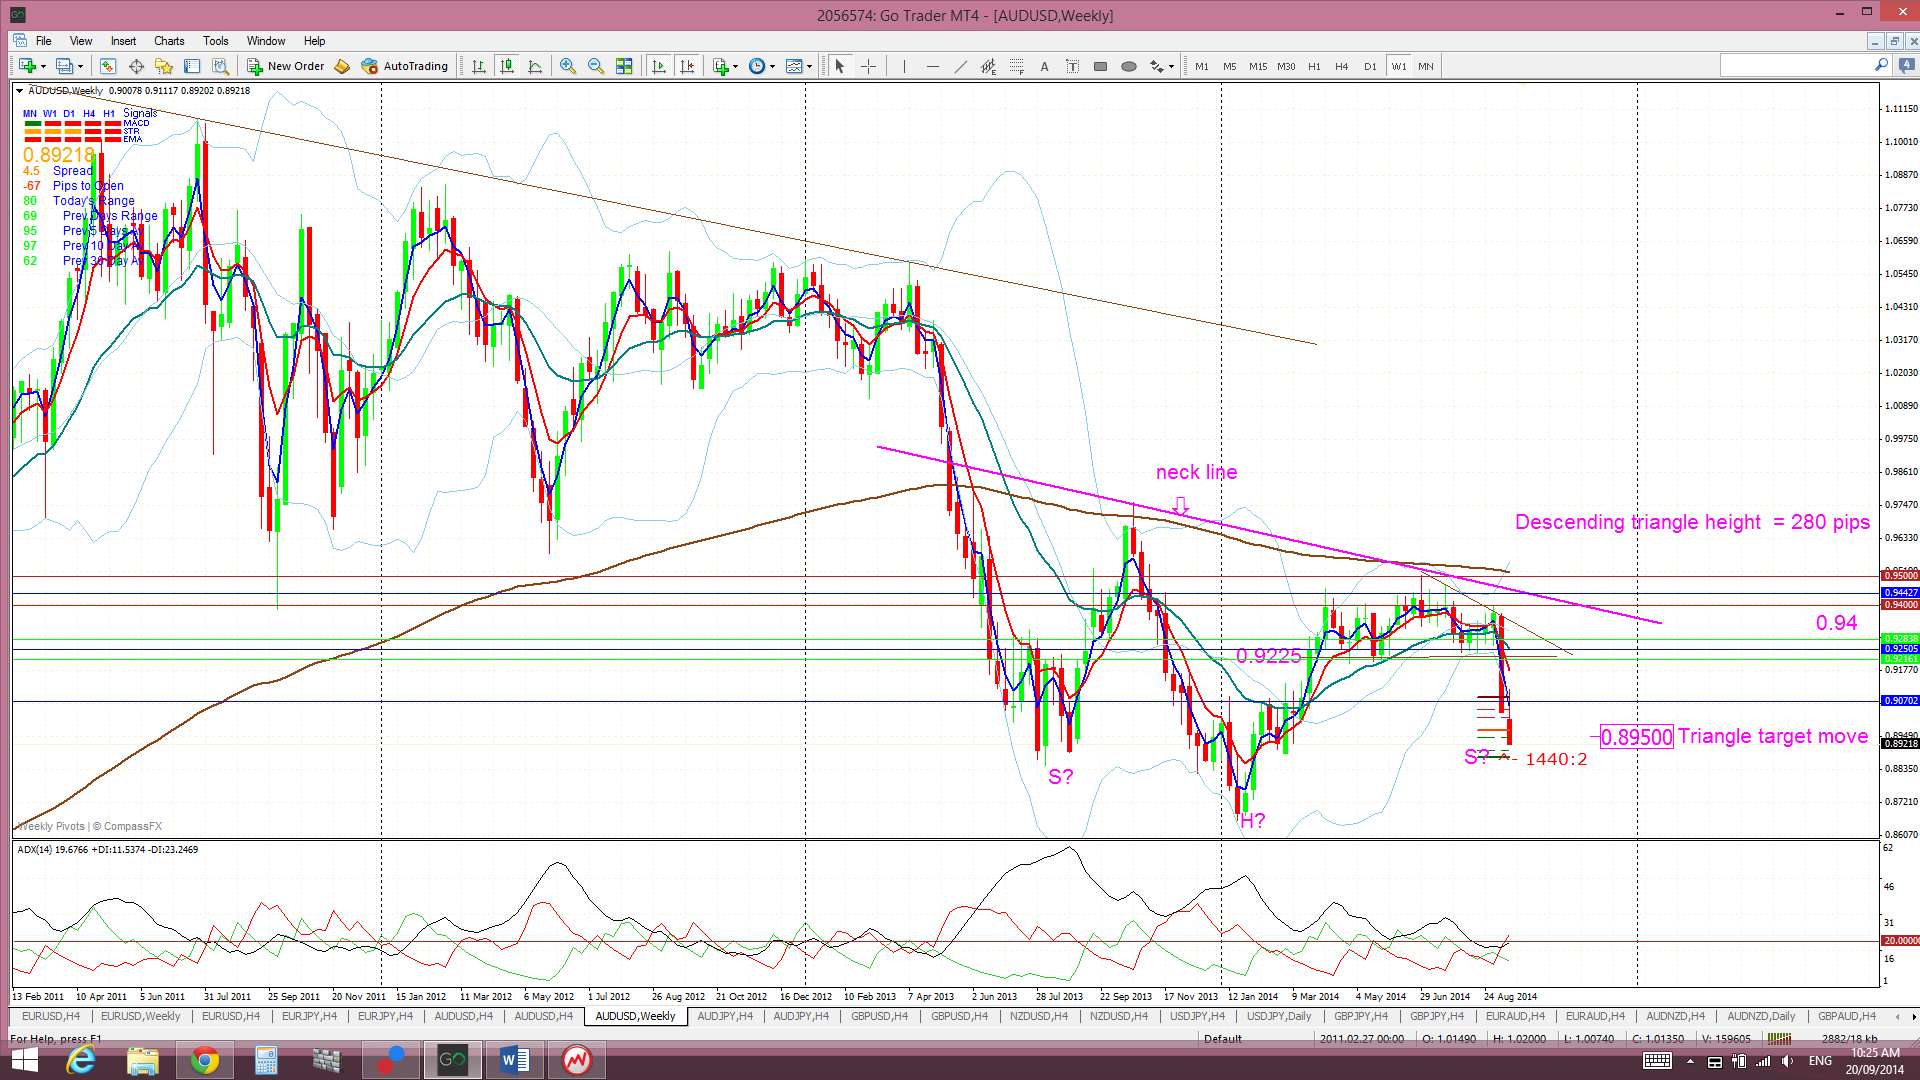
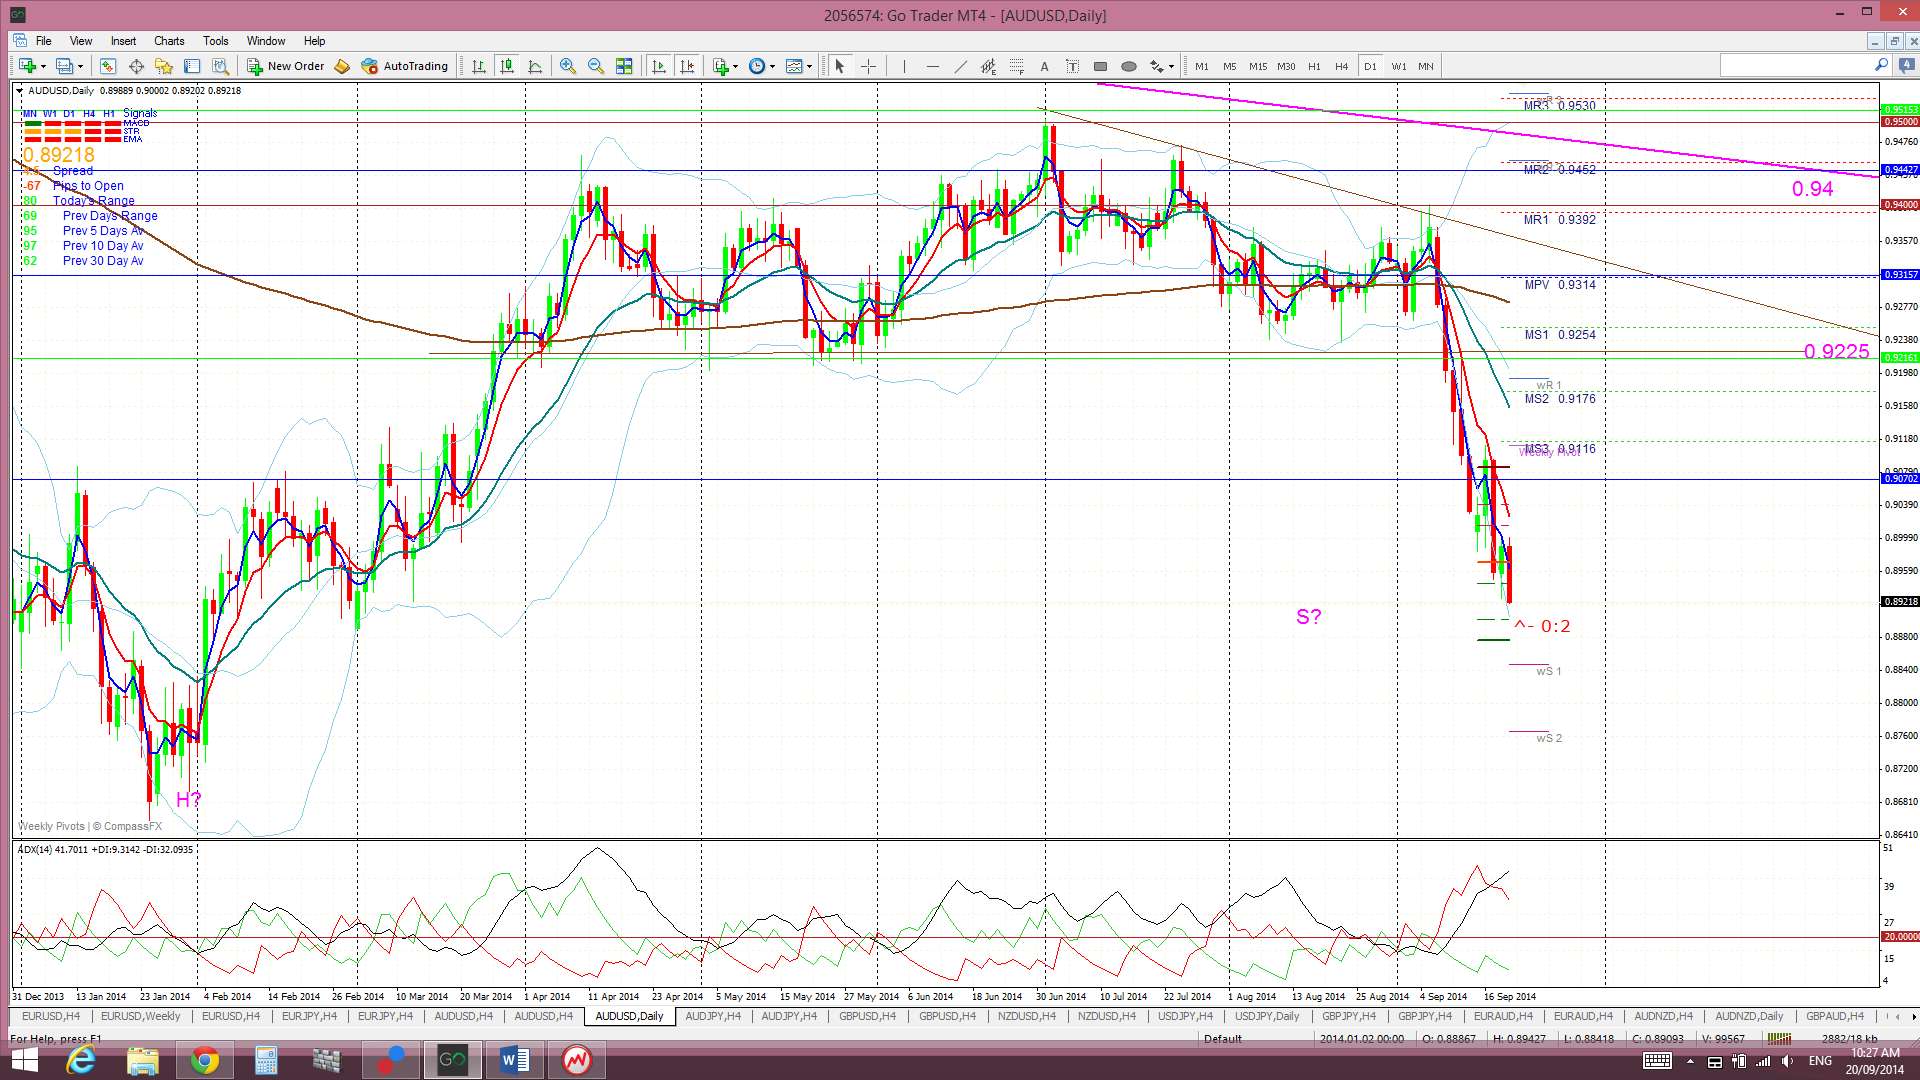
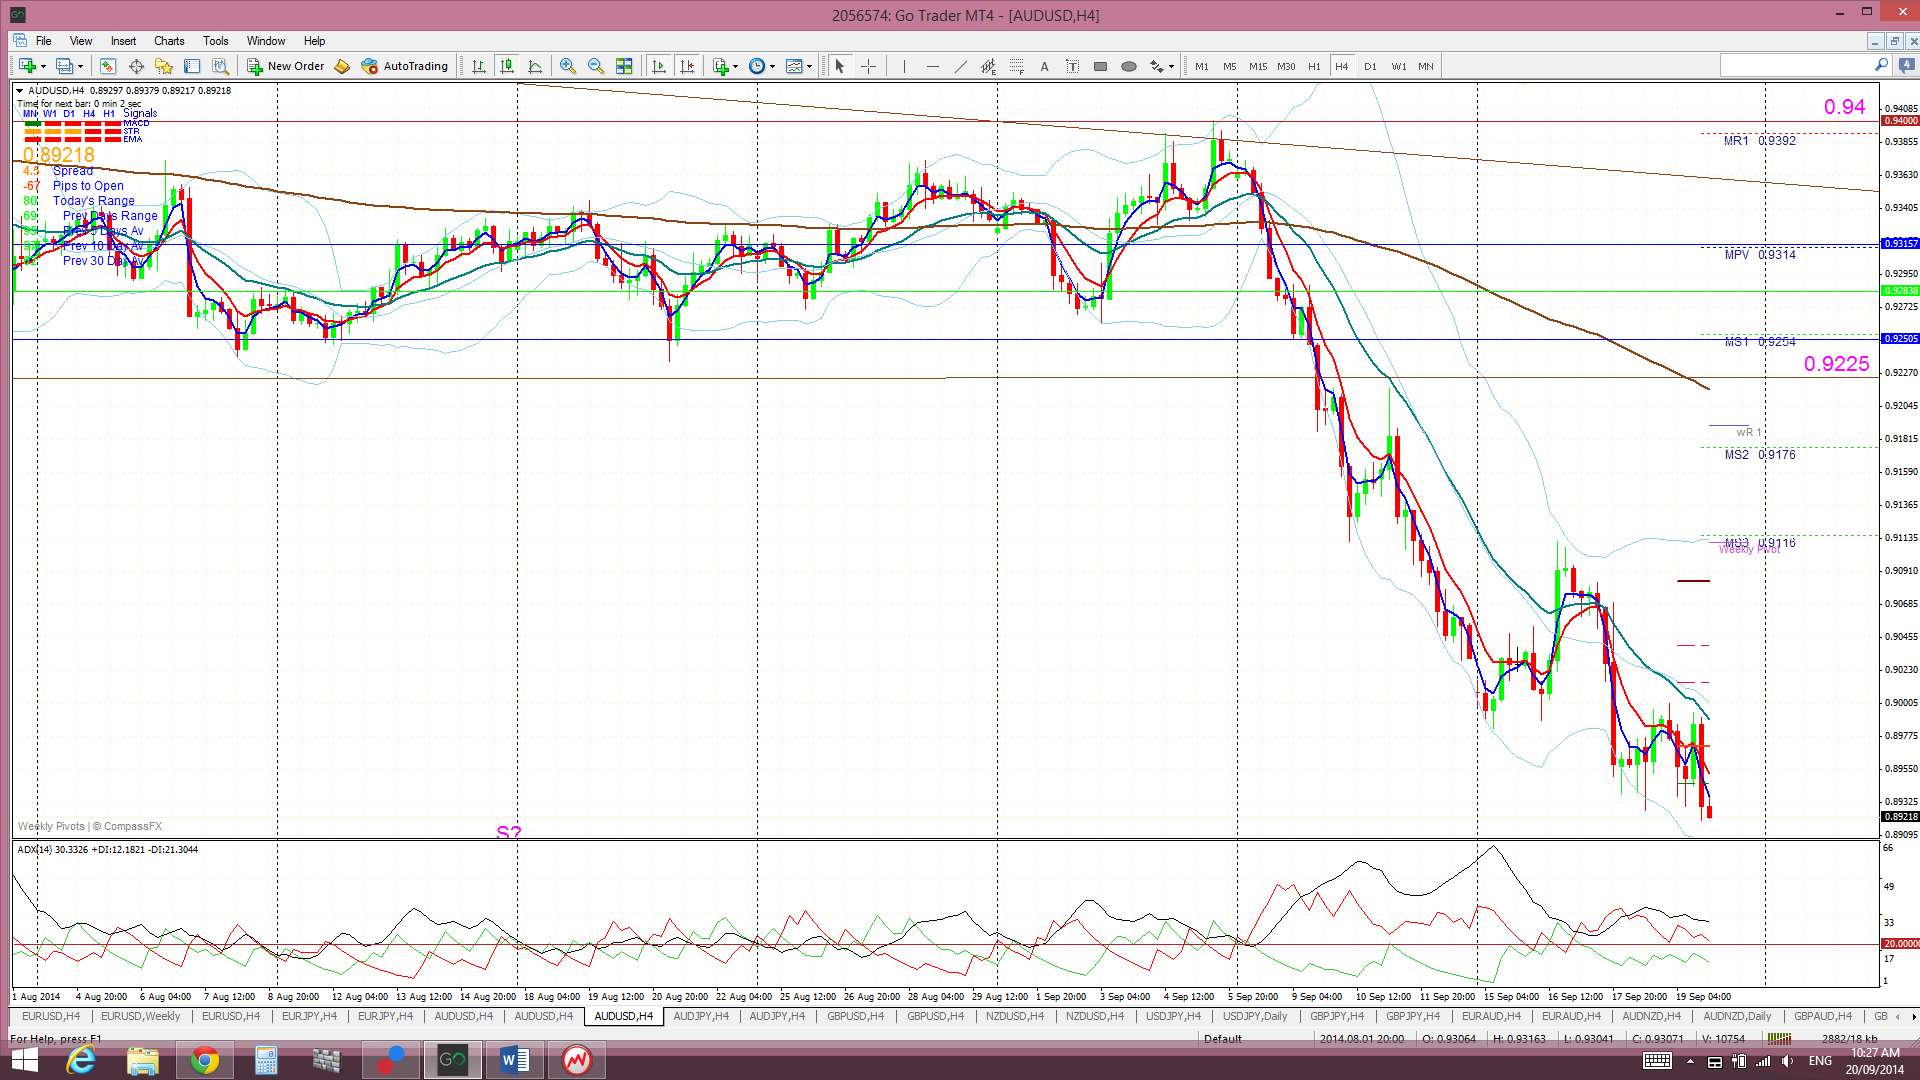
A/U:  The A/U had a bearish week and completed the daily chart’s descending triangle breakout pattern giving the full pip quota of 280 pips. Â
Descending triangle pattern: This bearish move has completed with a full haul of 280 pips. The height of the triangle was about 280 pips. Thus, the expected follow through move below the 0.9225 trend line was for 280 pips as well. This gave a target near the 0.895 level and the bearish move peaked last week down just below this level.
It is worth noting that the weekly chart has a developing bullish ‘inverse H&S’ pattern forming and I will be watching for any new USD weakness that would help to support this bullish pattern here.
Price is still trading below the Cloud on the 4hr chart, daily and weekly charts and in the middle of the Cloud on the monthly chart.
The weekly candle closed as a bearish candle.
- I’m watching for any new TC signal on this pair.
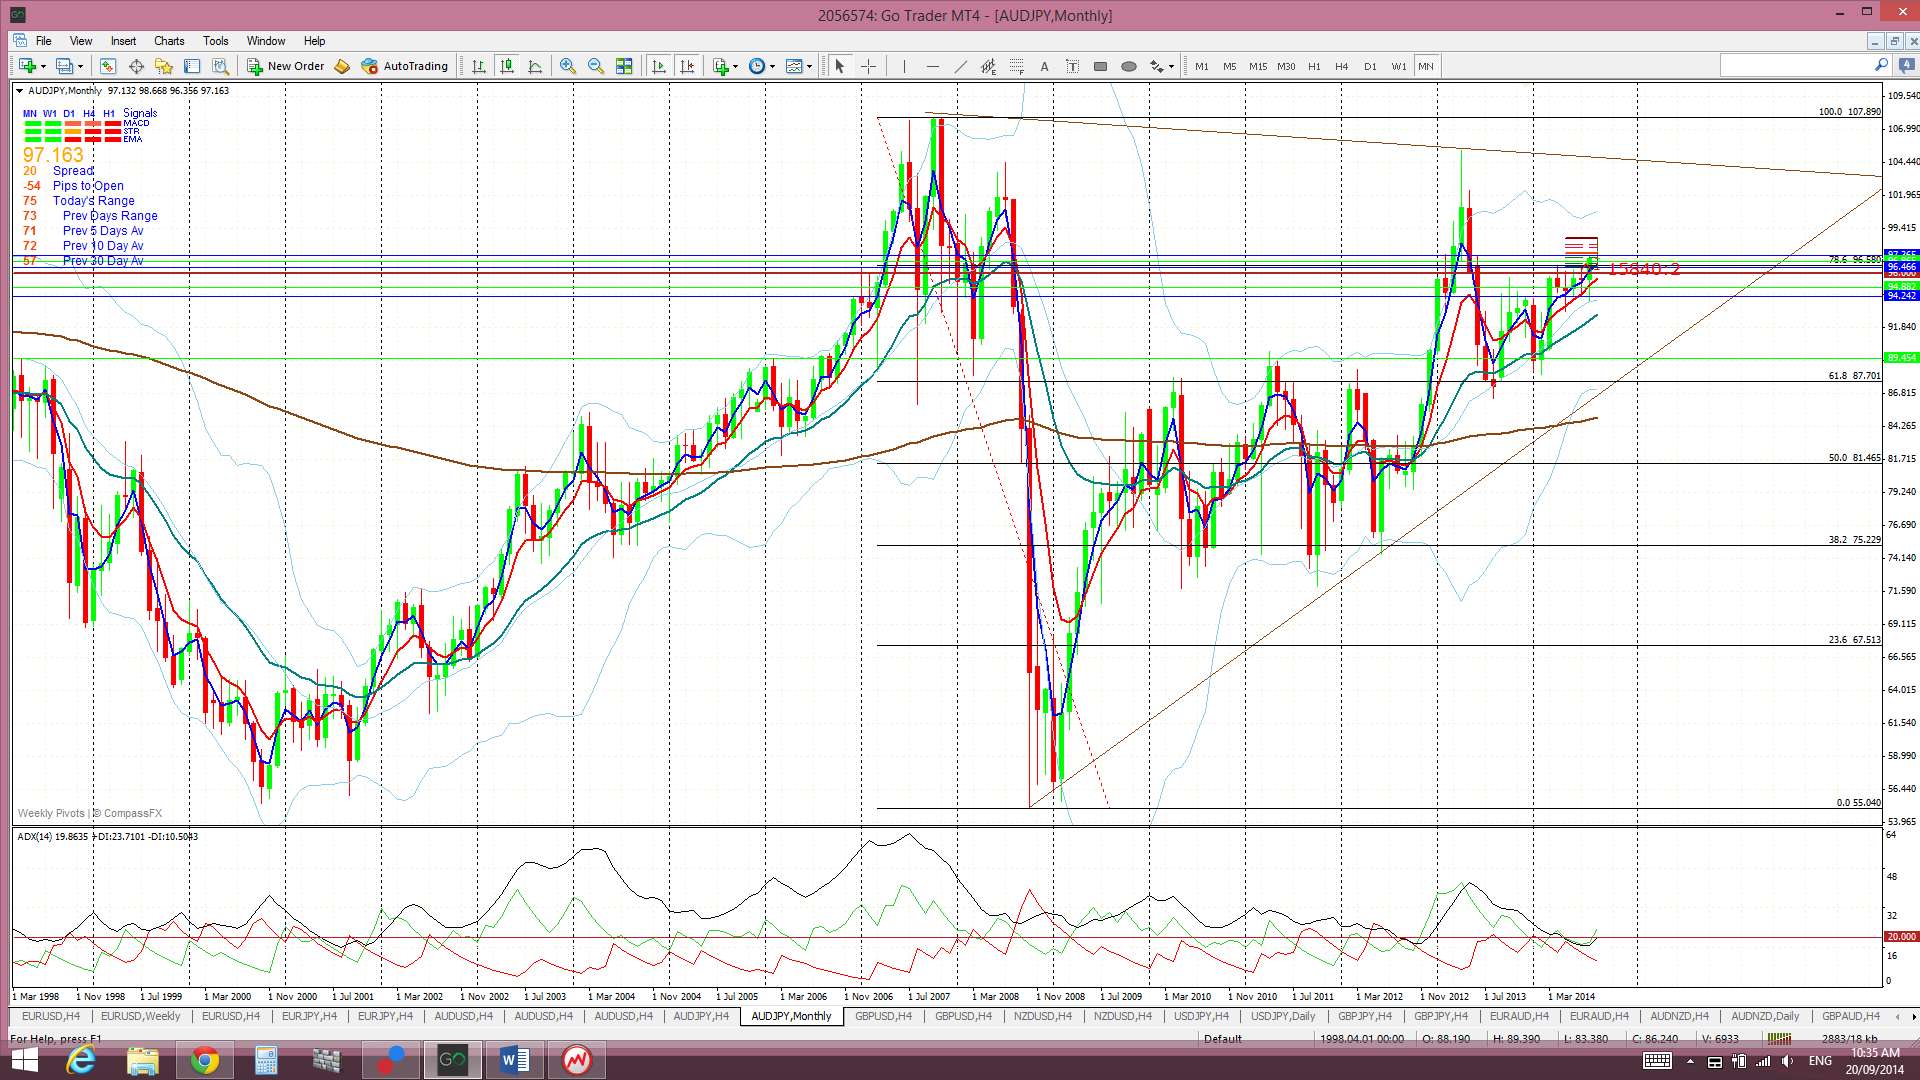
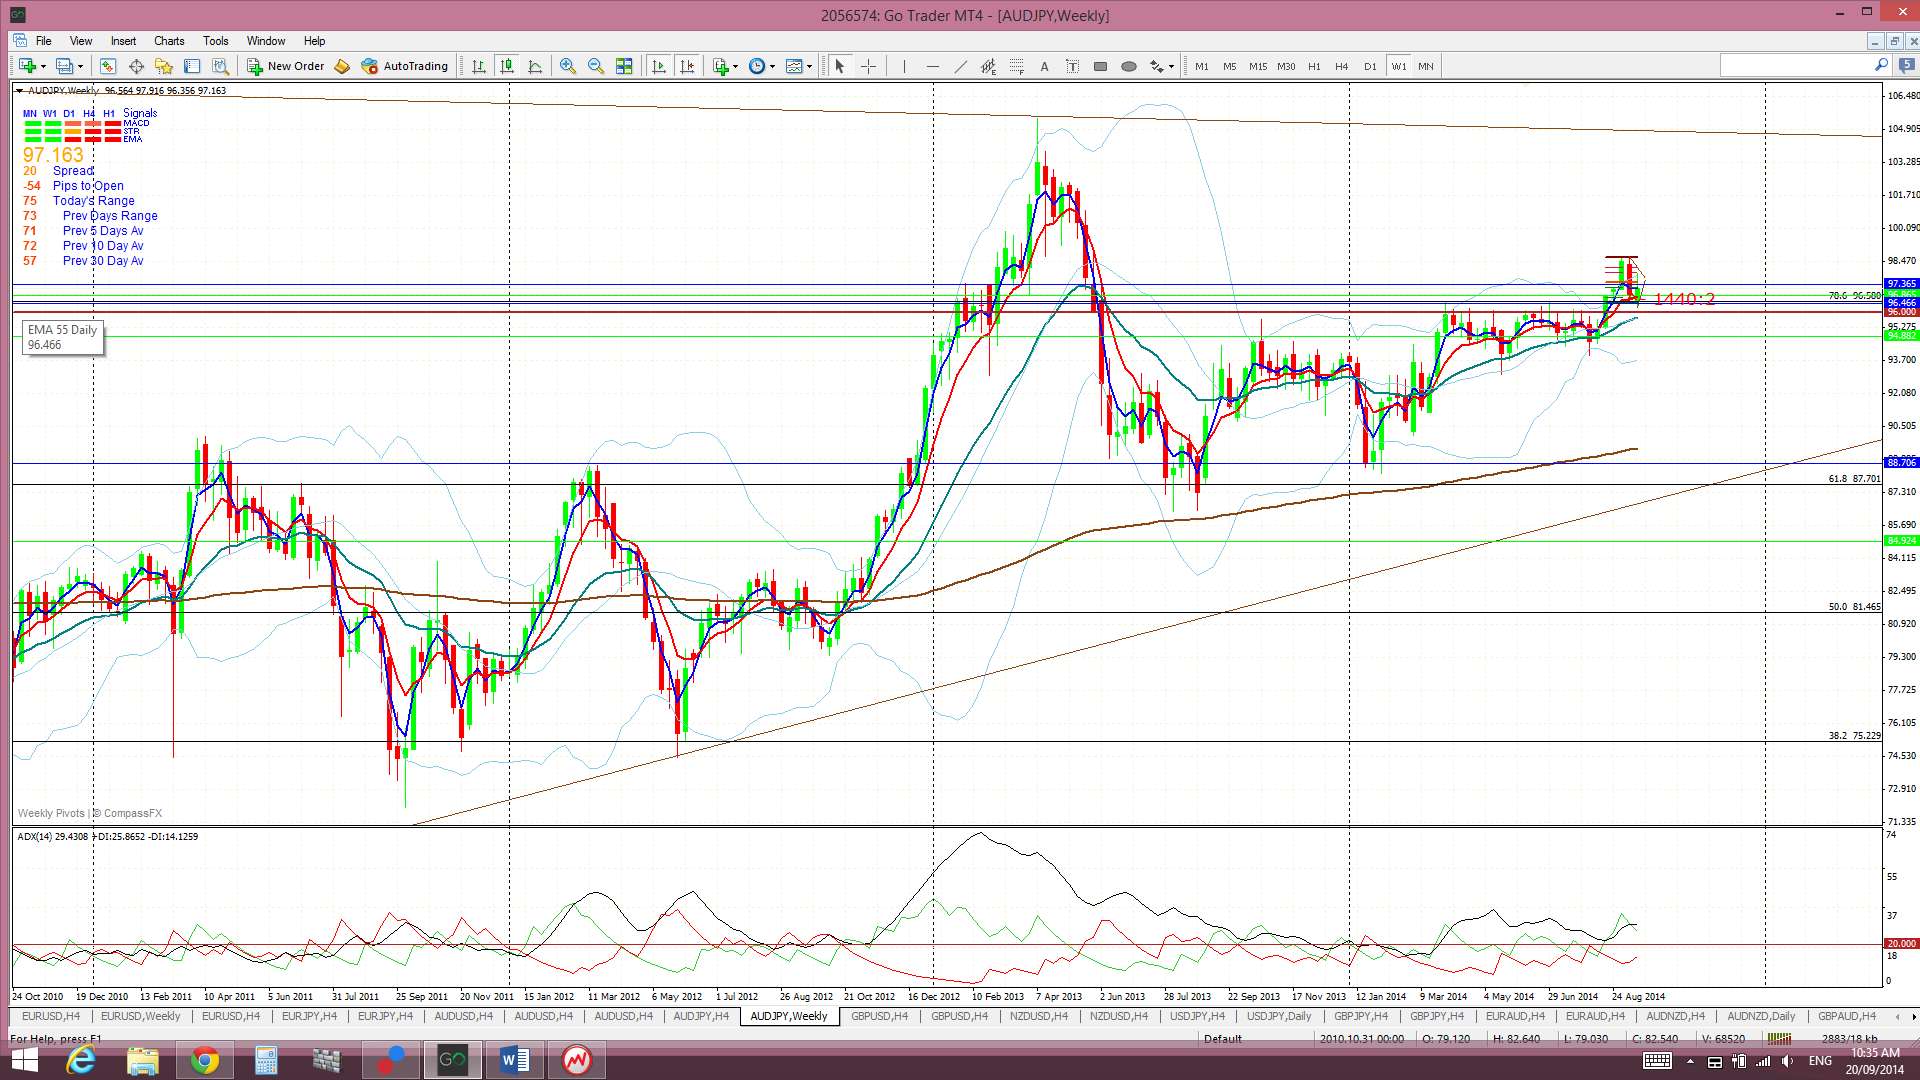
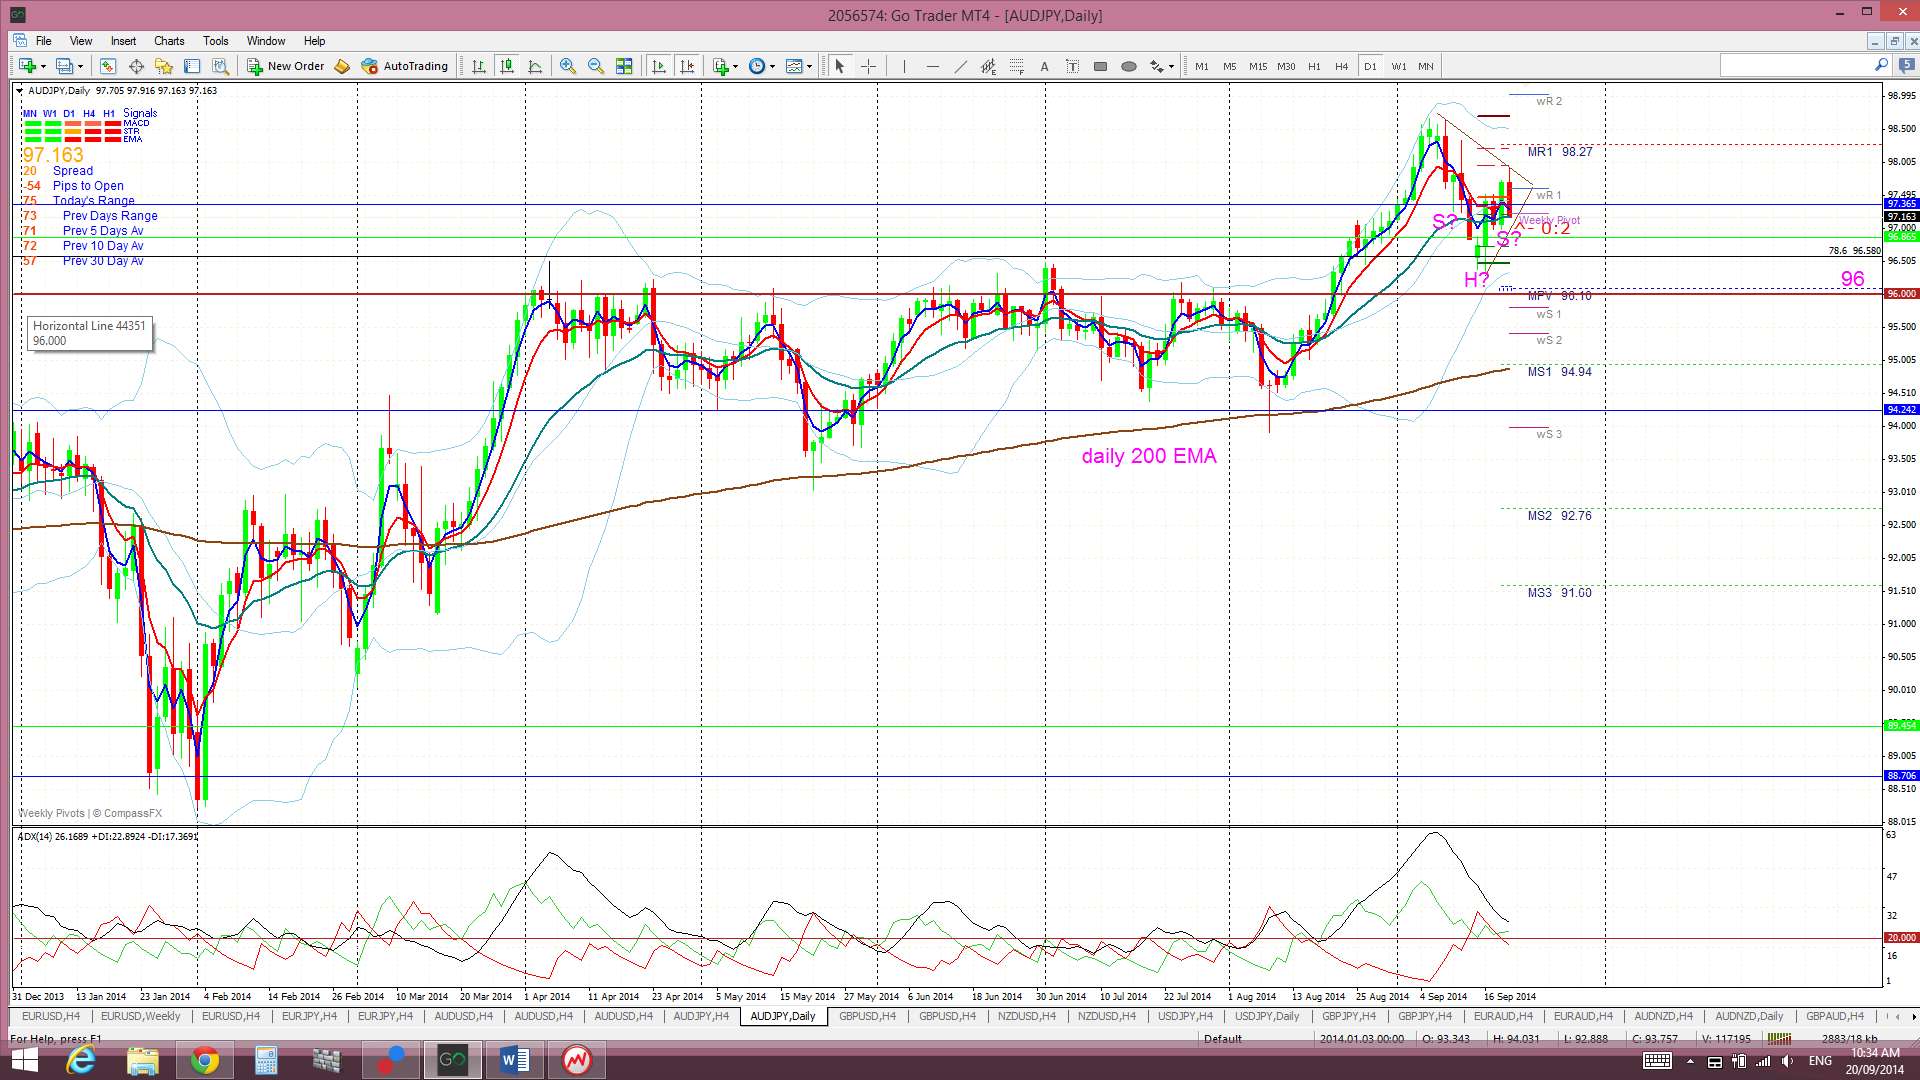
A/J: I had thought the A/J would pull back to test the 96 region and it did so to within 35 pips. Price chopped higher after touching this low though and triggered a new TC signal to long on Friday. This was short lived though and price subsequently pulled back.
The 4 hr chart shows price setting up within a symmetrical triangle pattern and with a possible bullish ‘inverse H&S’ slant to this view as well. I will be watching for trend line breaks here to guide me about the next move but I still think the 96 could be tested again here soon.
Price is back trading below the Cloud on the 4hr chart but above on the daily, weekly and monthly charts.
The weekly candle closed as a small bullish candle.Â
- I’m watching for any new TC signal on this pair, the triangle trend lines and the 96 level.

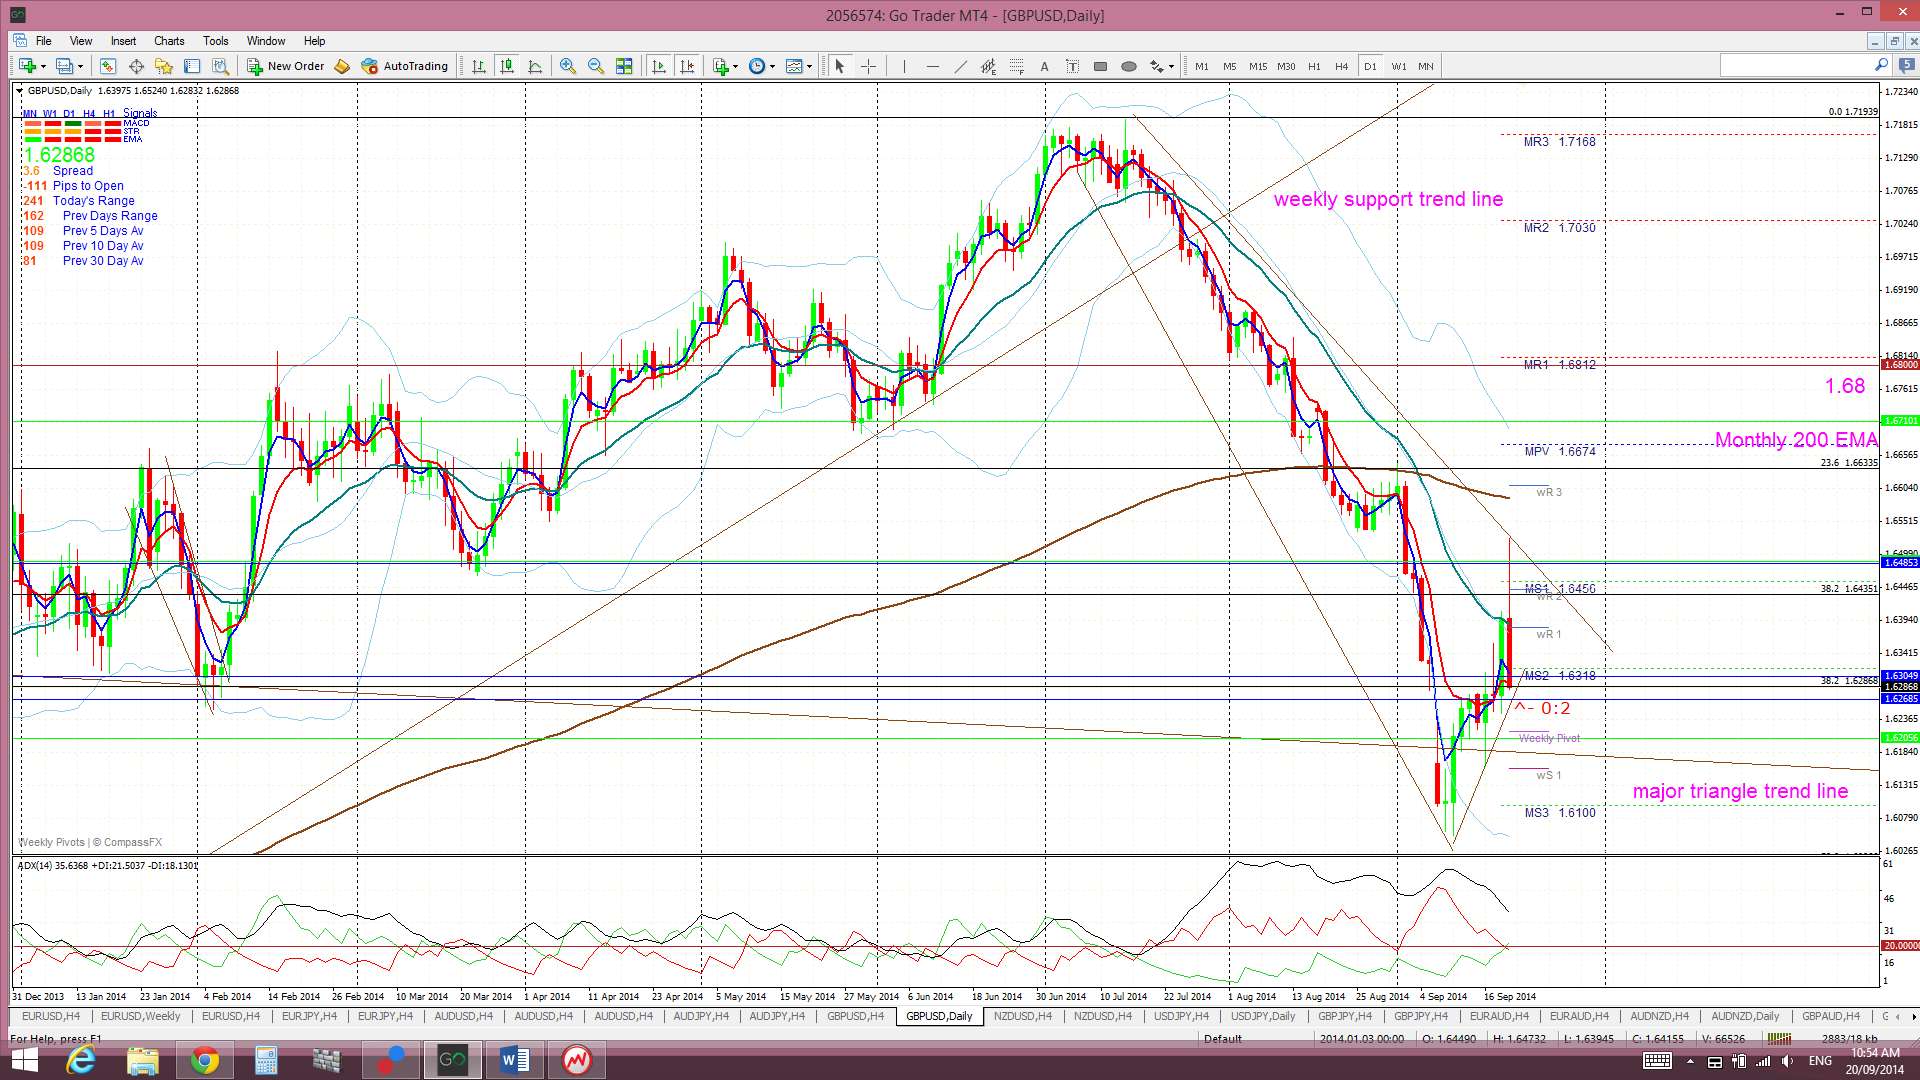
G/U: The Cable chopped higher last week on thoughts that the Scottish Referendum would return a NO vote. A new TC signal to LONG was received here on Friday and this gave up to 120 pips before reversing. The 4hr chart shows that price peaked up at the 78.6% fib of the recent bear move and near the 4hr 200 EMA.
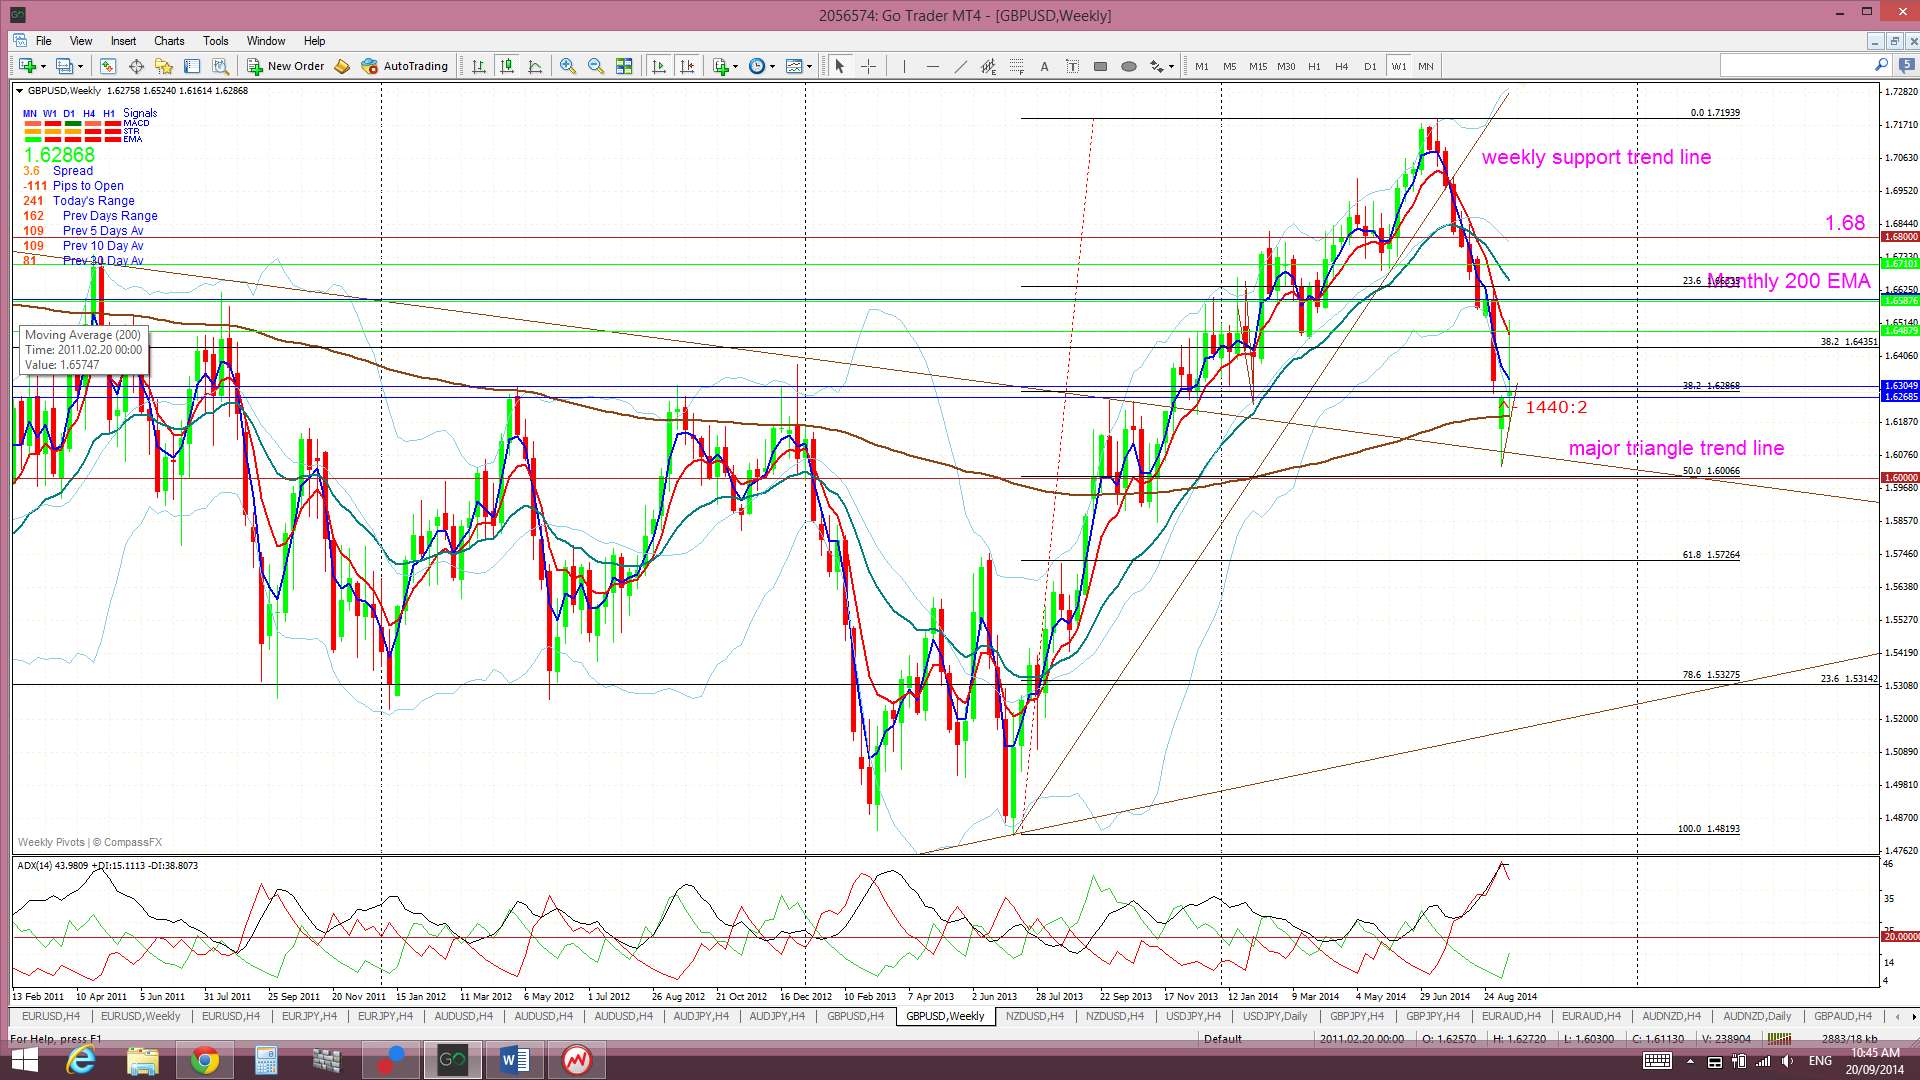
There have now been two bullish weekly candles in a row but that is no guarantee we will see bullish continuation. Much will depend on the USDX and whether this index retreats or breaks through the resistance level it is currently negotiating. A bullish USD will put pressure on the Cable. However, the daily Cable chart shows price now forming up in what looks like, to me at least, a bullish broadening descending wedge!
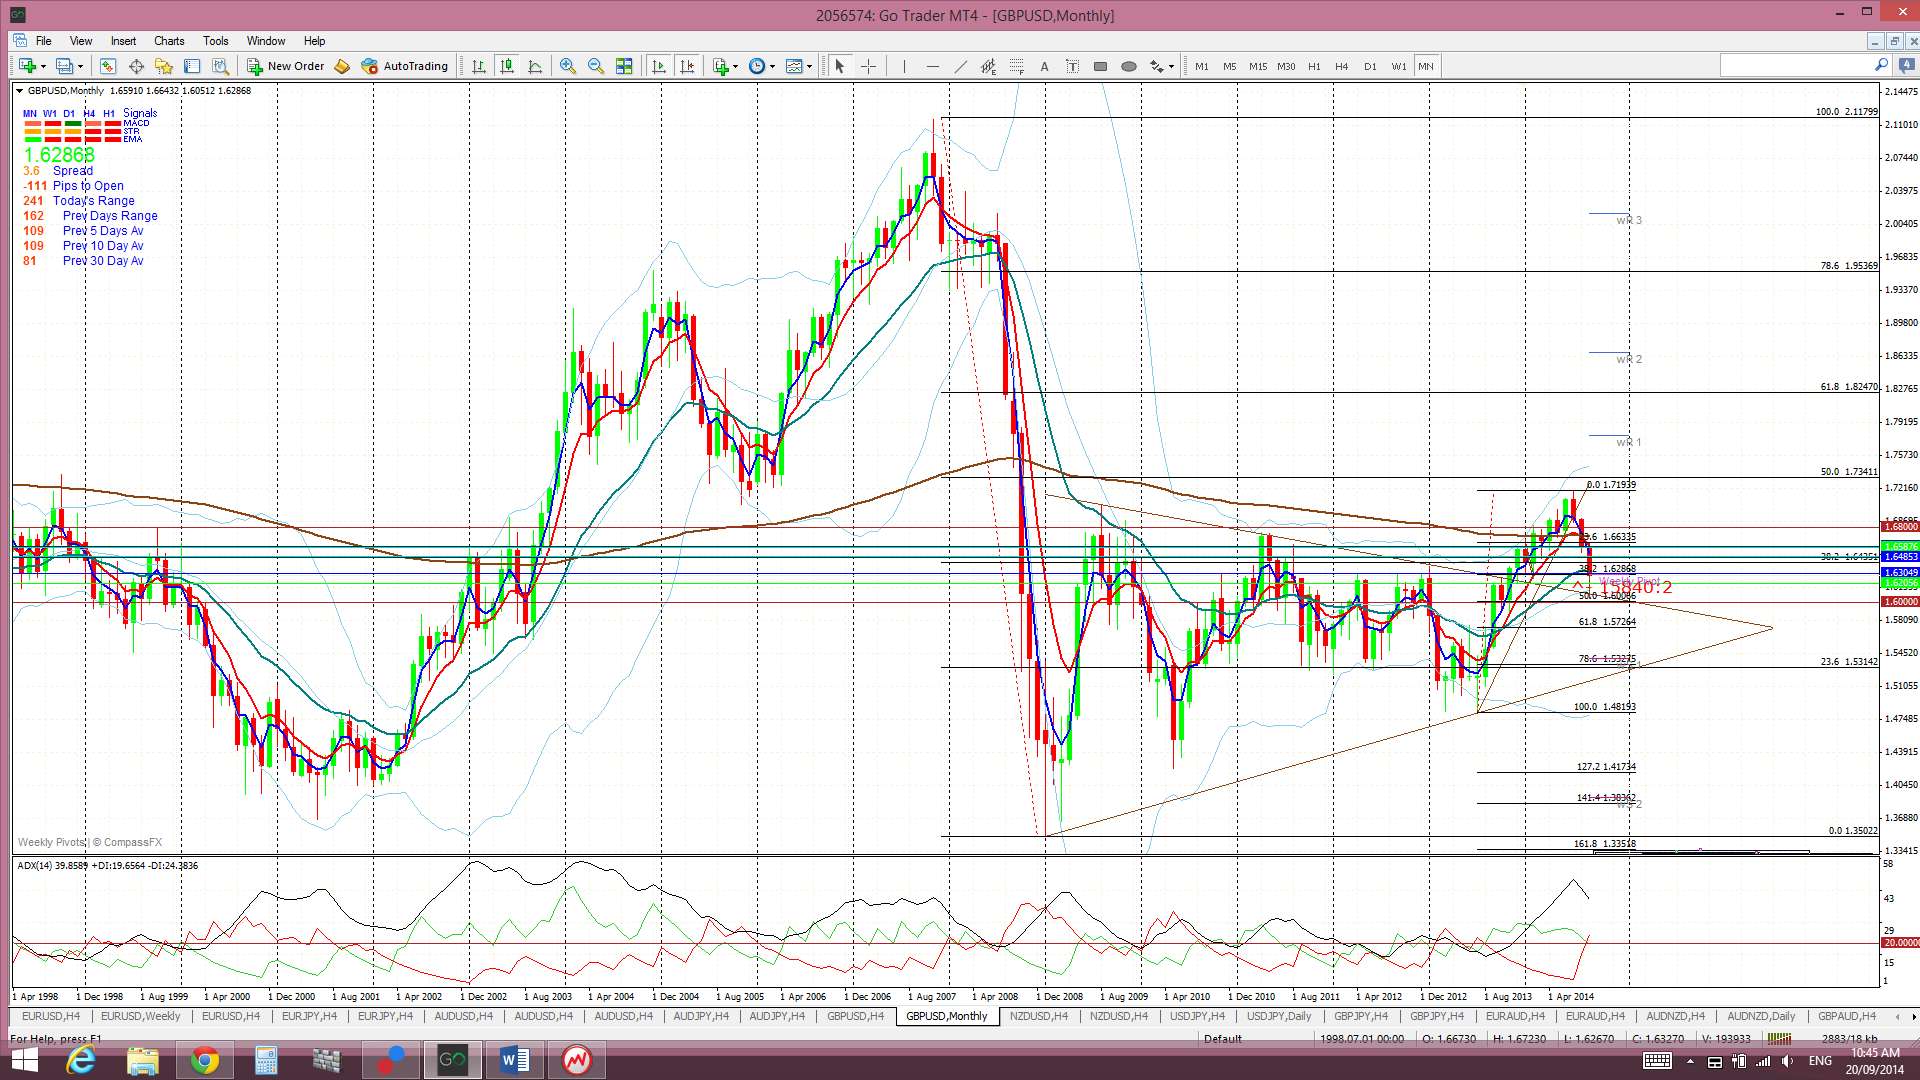
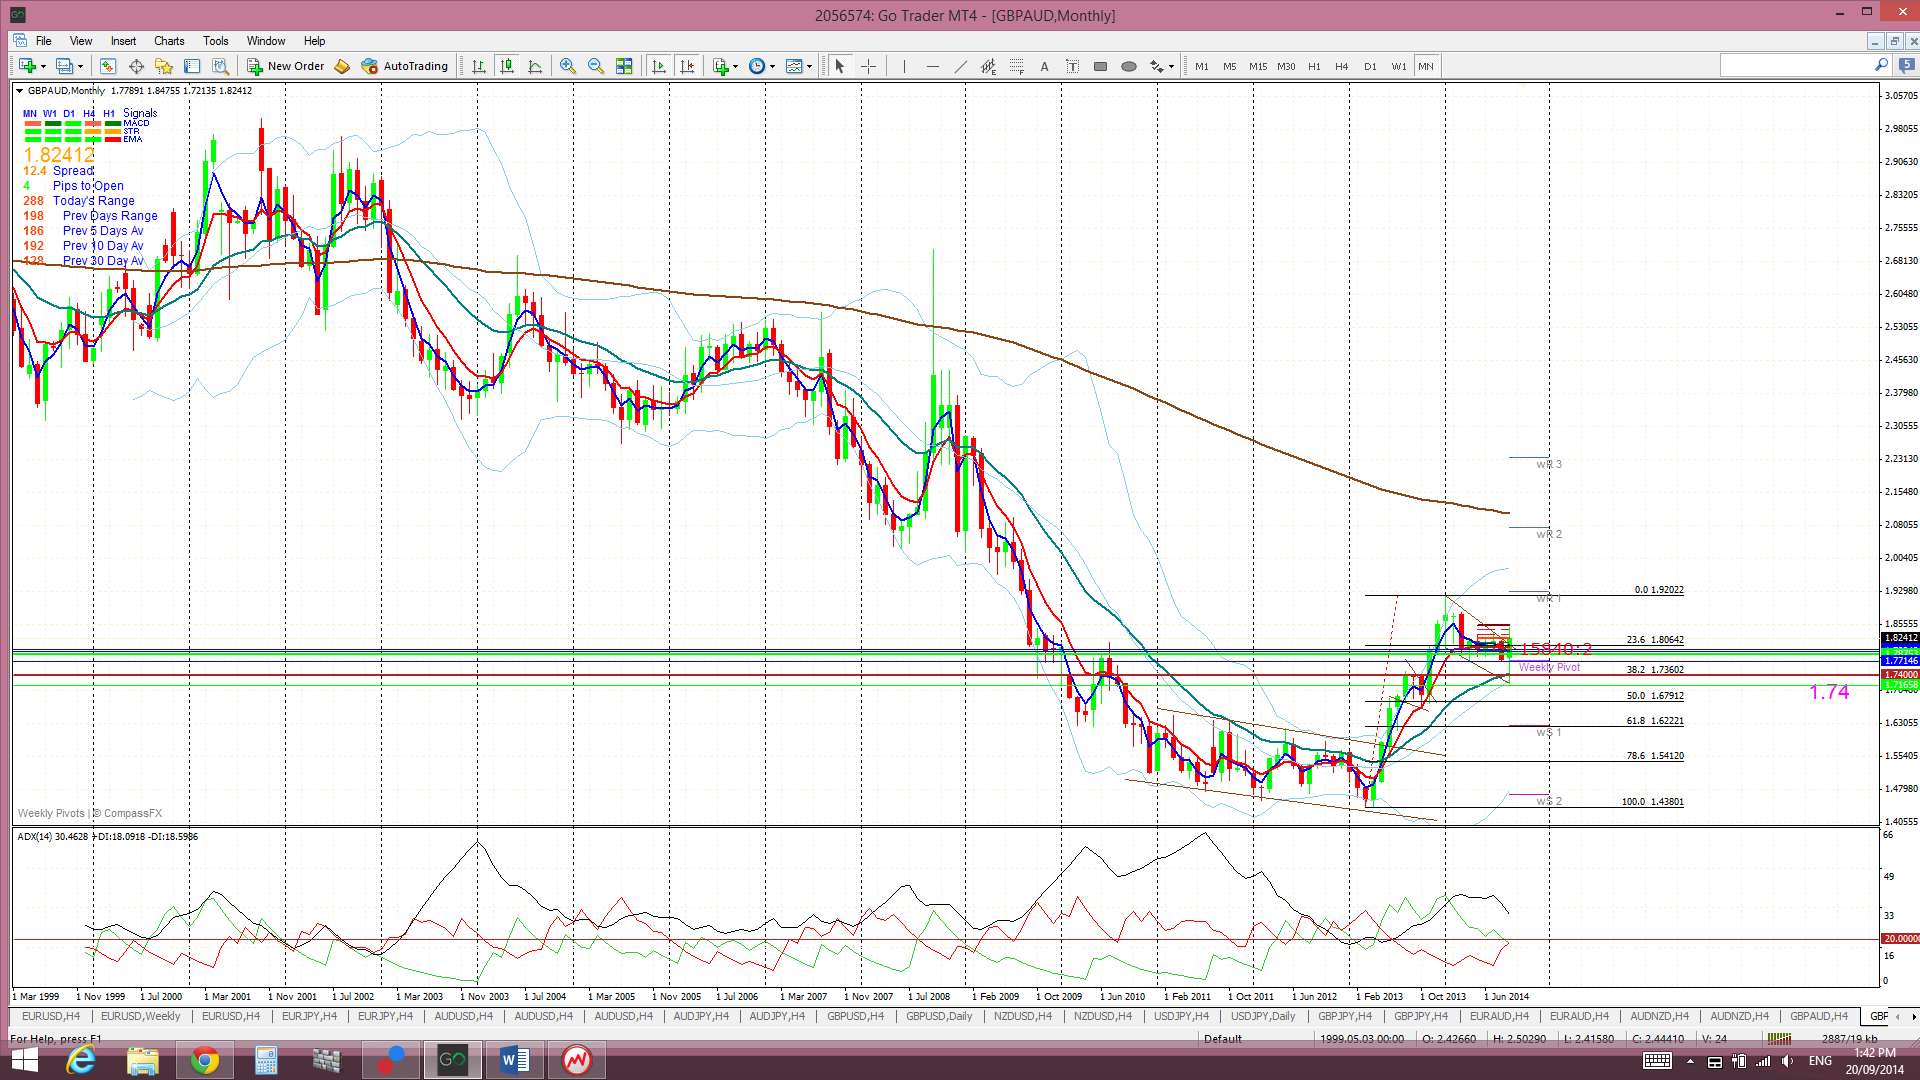
Bullish targets for any return back above the monthly 200 EMA: This level remains a key level to watch here and any new move back above this level would be quite bullish. It is important to remember that February was the first monthly close above this S/R level since September 2008 and, also, the highest monthly close since the bear move of 2007-2009. These were major achievements. A possible target for any continued bullish movement is best determined from the monthly chart. The 50 % fib level of the 2007-2009 bear move is up at around the 1.73 region and the 61.8 % fib is at the 1.82 region. Both of these levels might be possible profit targets. The 61.8% fib level is still about 2,000 pips away.Â
Price is trading above the Cloud on the 4hr chart, below on the daily chart and in the Cloud on the weekly and monthly charts.
The weekly candle closed as an indecisive long legged Doji candle.
- I’m watching for any new TC signal on this pair and the wedge trend lines.

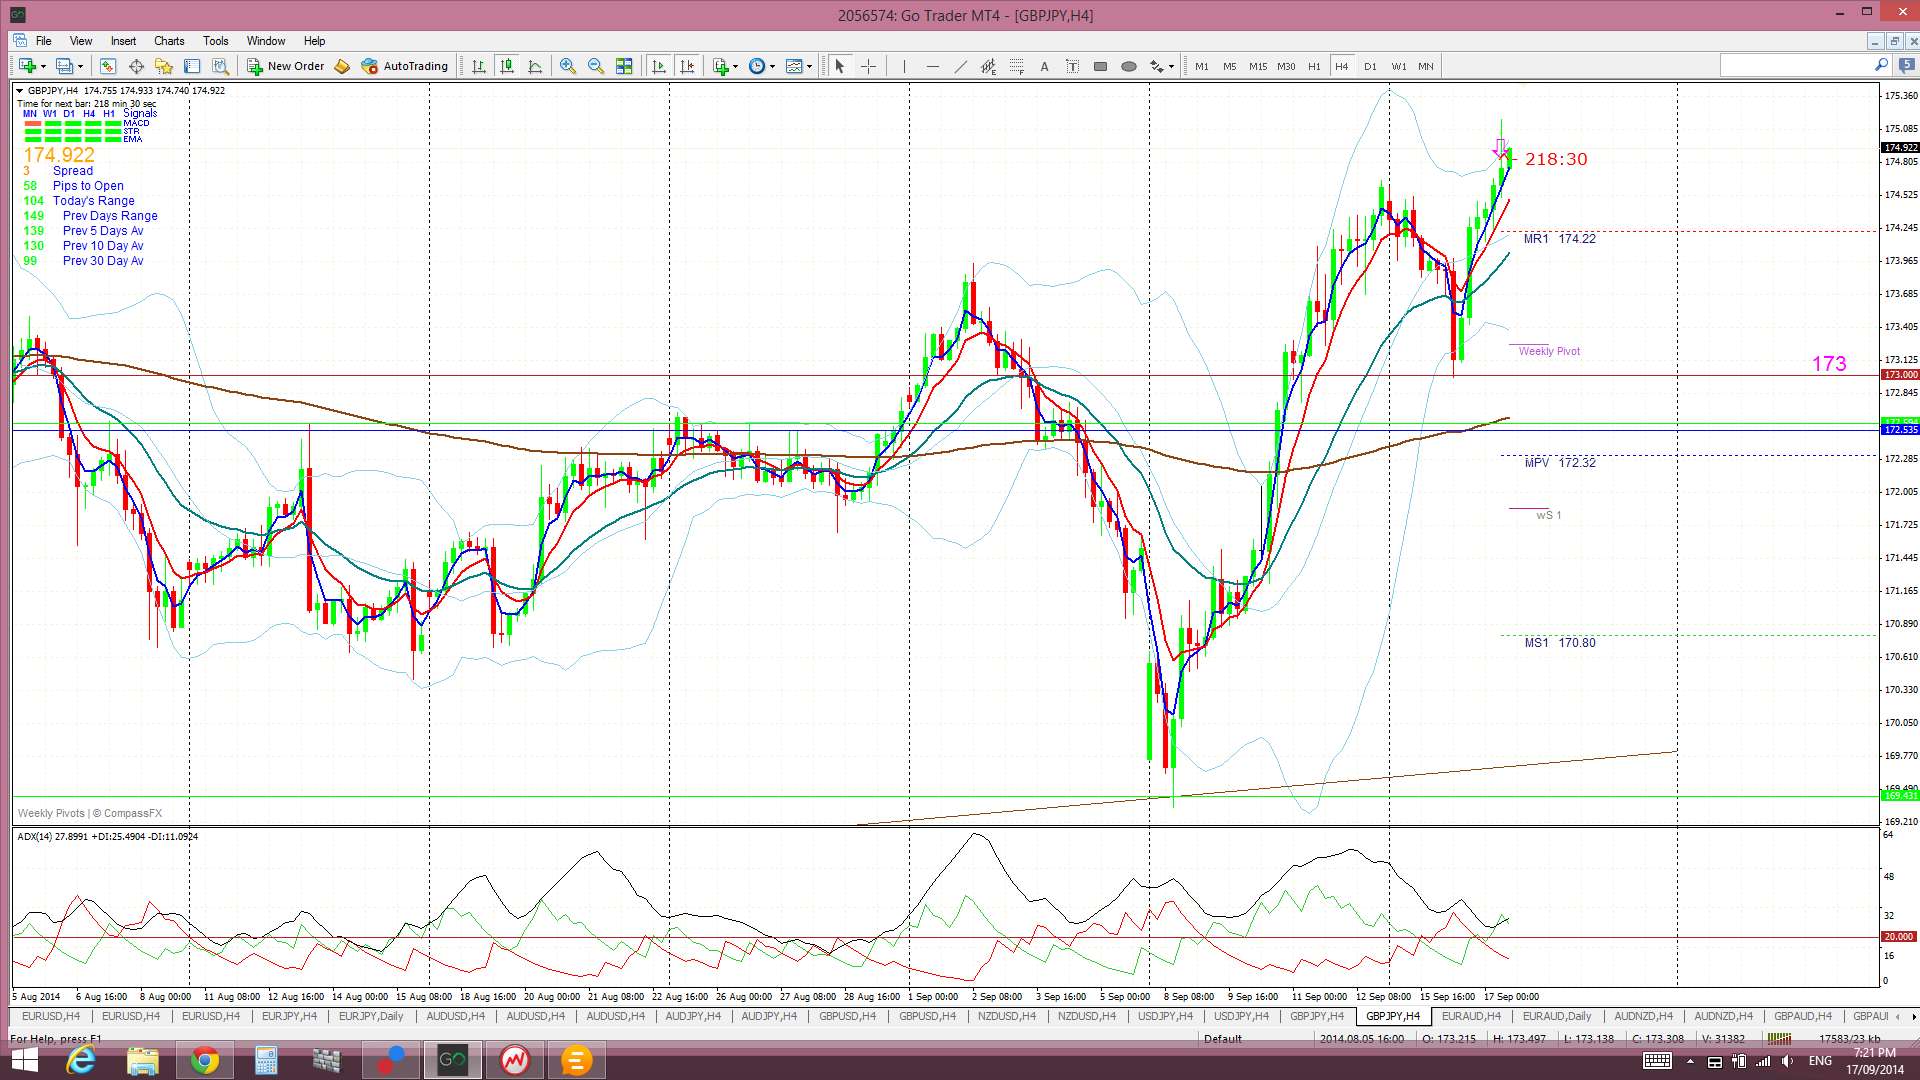
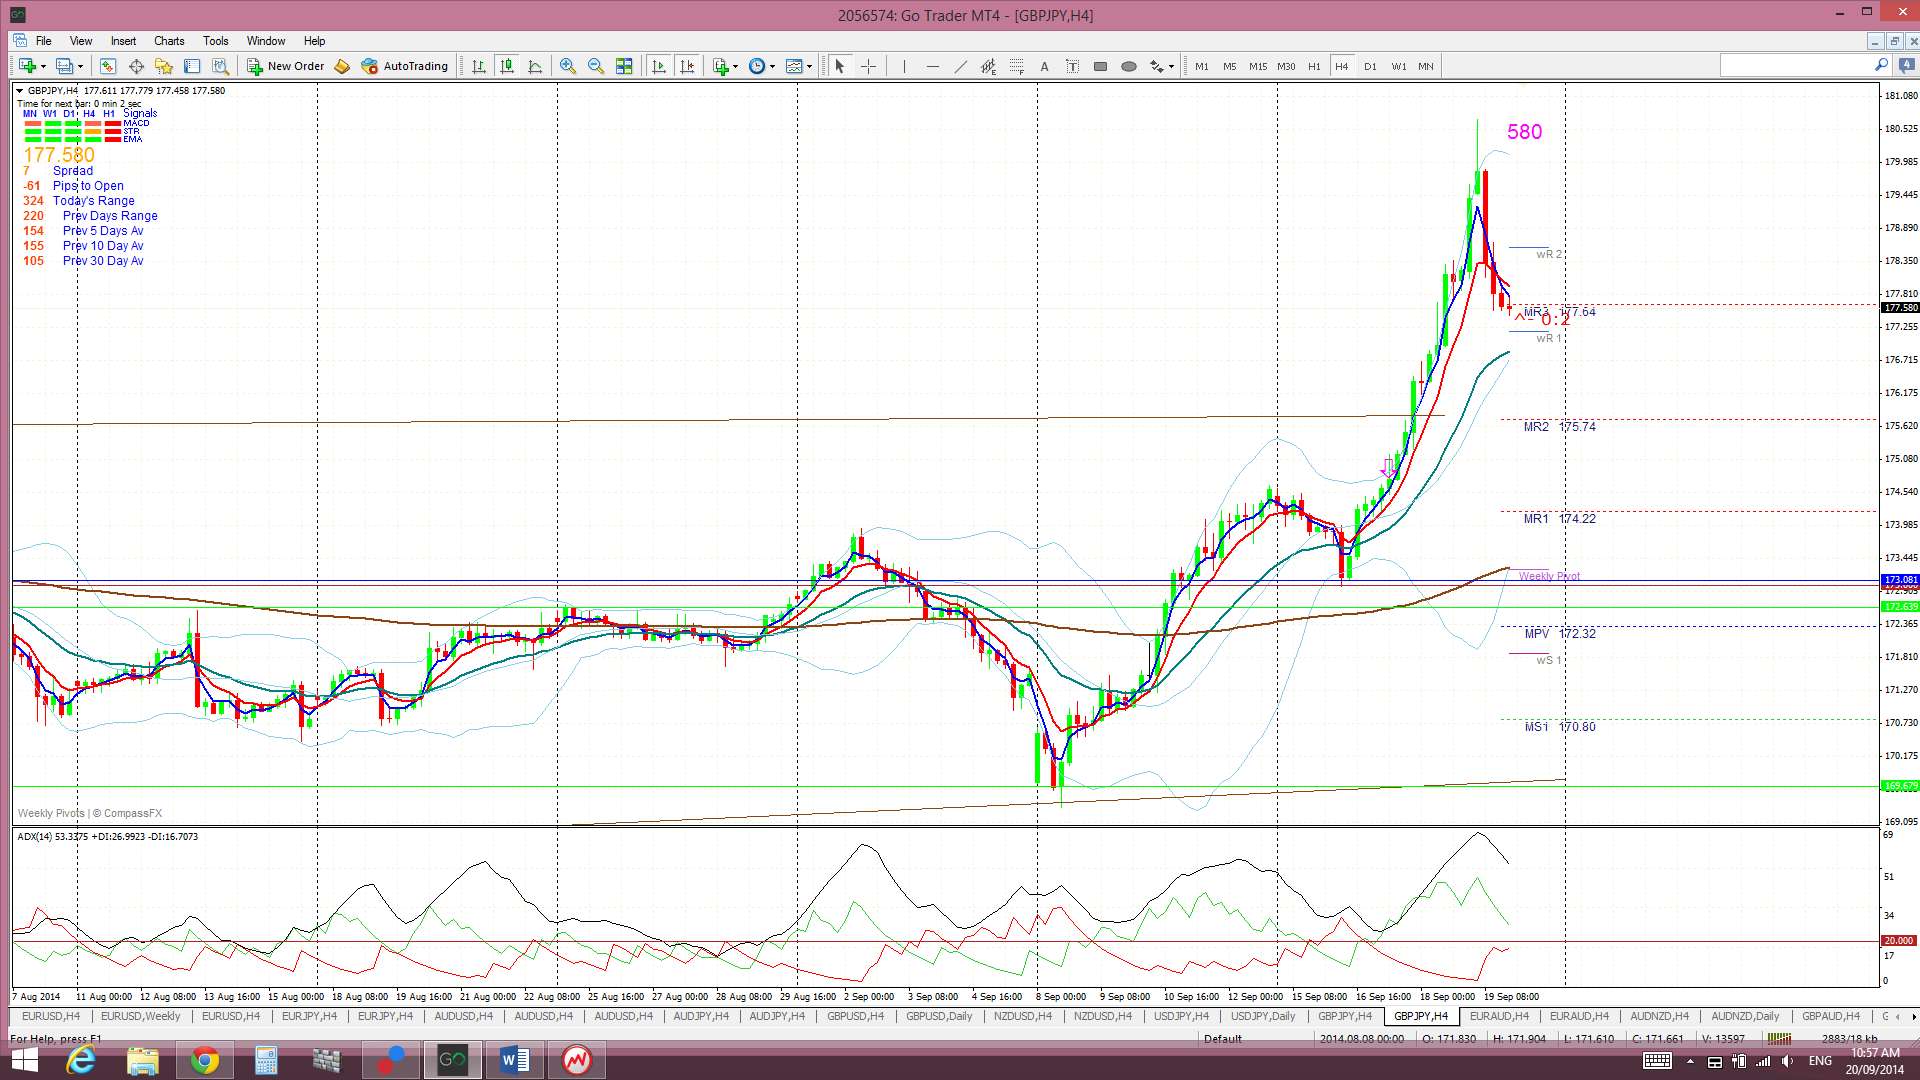
GBP/JPY: The GBP/JPY drifted lower to start the week and pulled back to test the key 173 level. I had suggested in my w/e update last week that a technical long entry from 173 might pose a reasonable trade and that it did! Price rallied over 700 pips up from the 173 bounce! Without me I might add!  Â
This rally also triggered a new TC signal on Wednesday that delivered up to 580 pips before closing off on Friday!  This was the chart of the GBP/JPY that I posted when the TC signal came through on my Wed 7am candle. The chart was posted just after the candle closed:
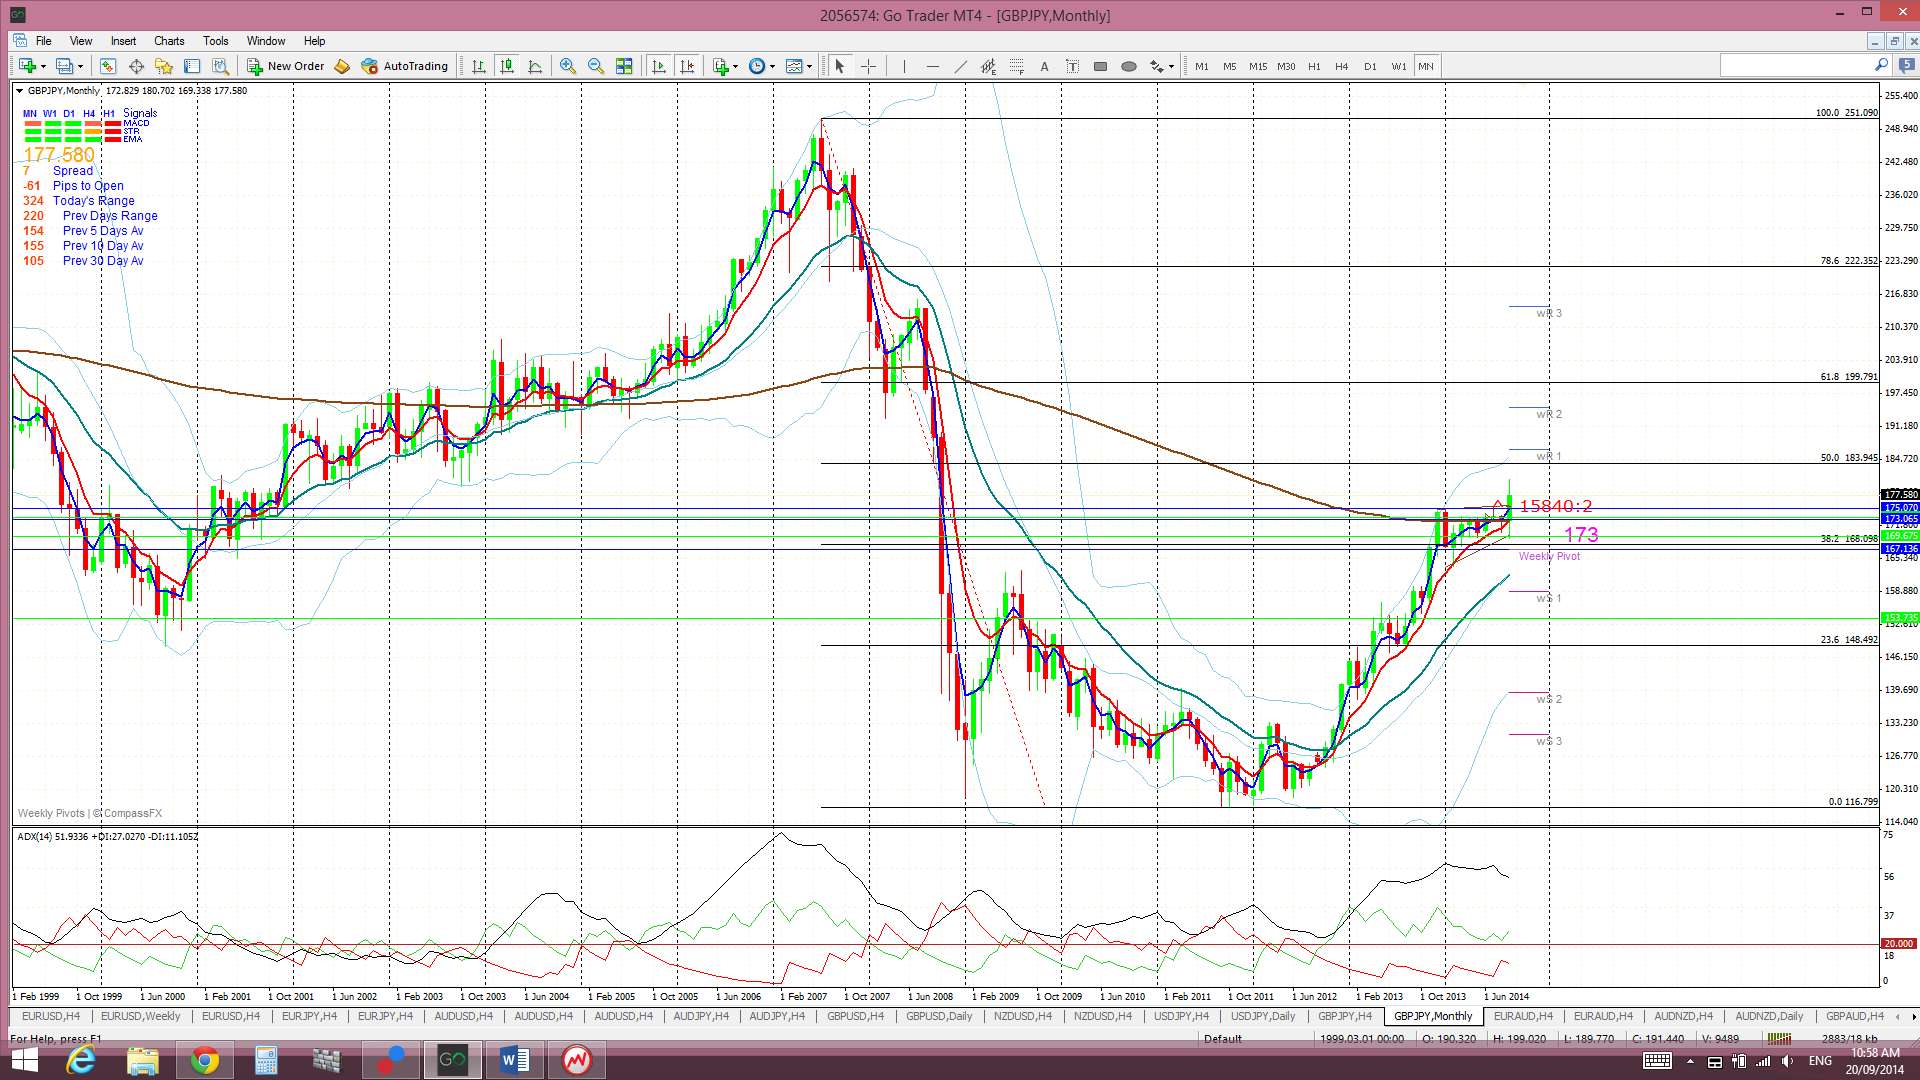
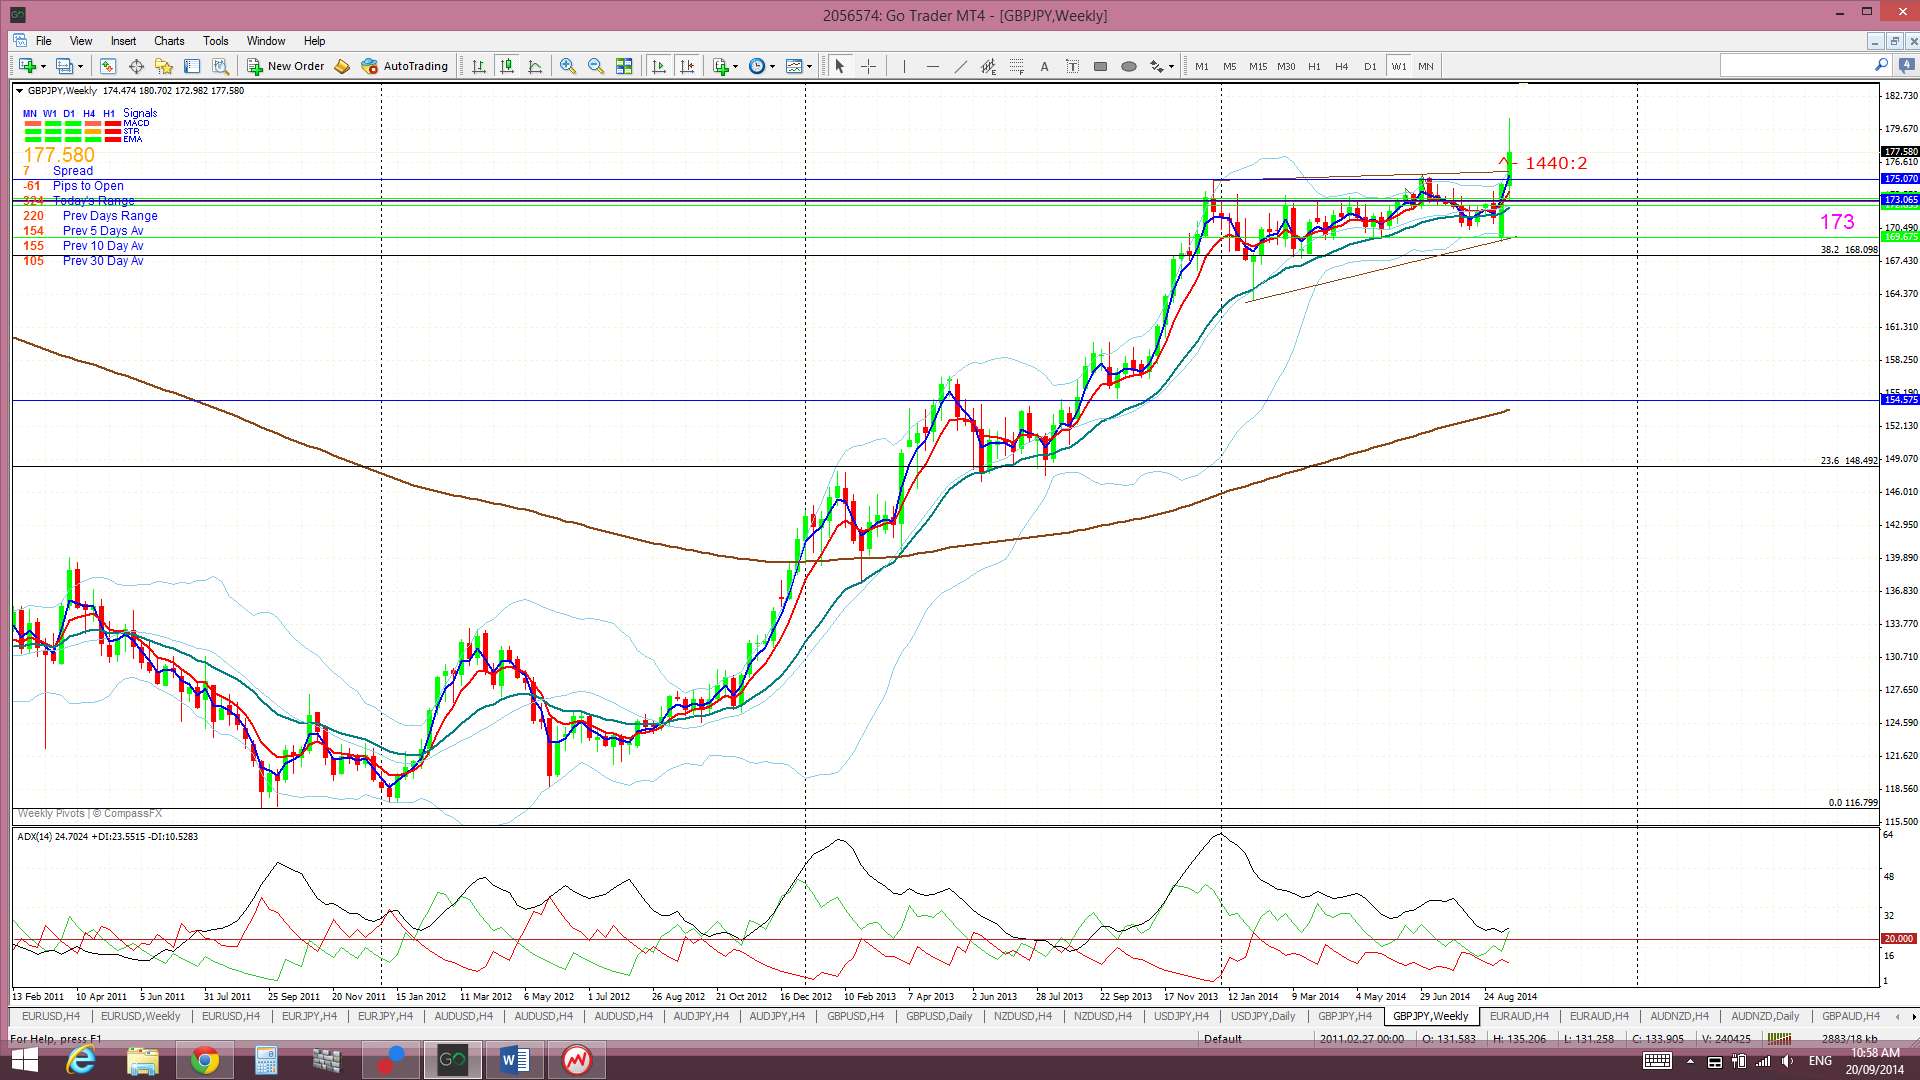
This rally also resulted in a bullish breakout from the weekly Flag pattern that I have had on my charts here for some weeks now. However, I would not be surprised to this breakout trend line tested before any potential continuation.
Price is still trading above the Ichimoku Cloud on the 4hr, daily, weekly and monthly charts.
The weekly candle closed as a bullish candle.
- I’m watching for any new TC signal on this pair and the Flag trend lines.

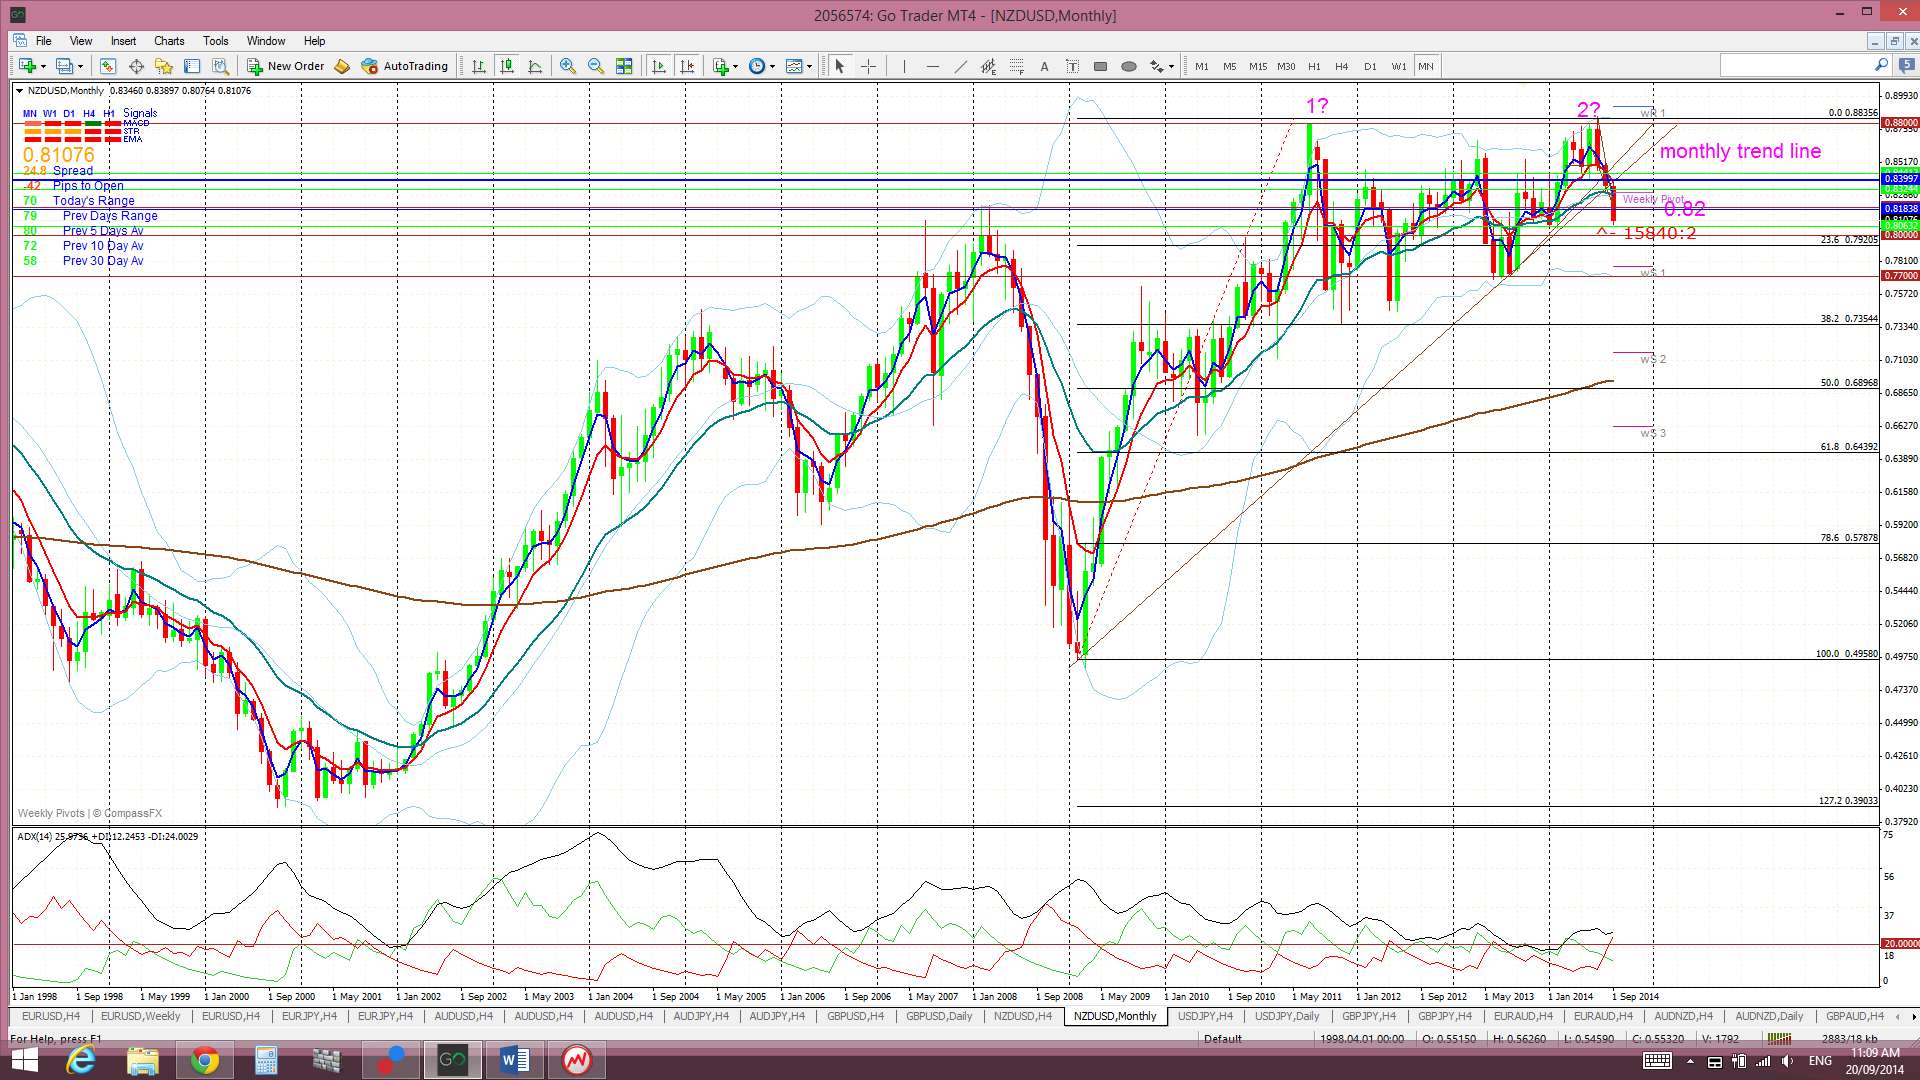
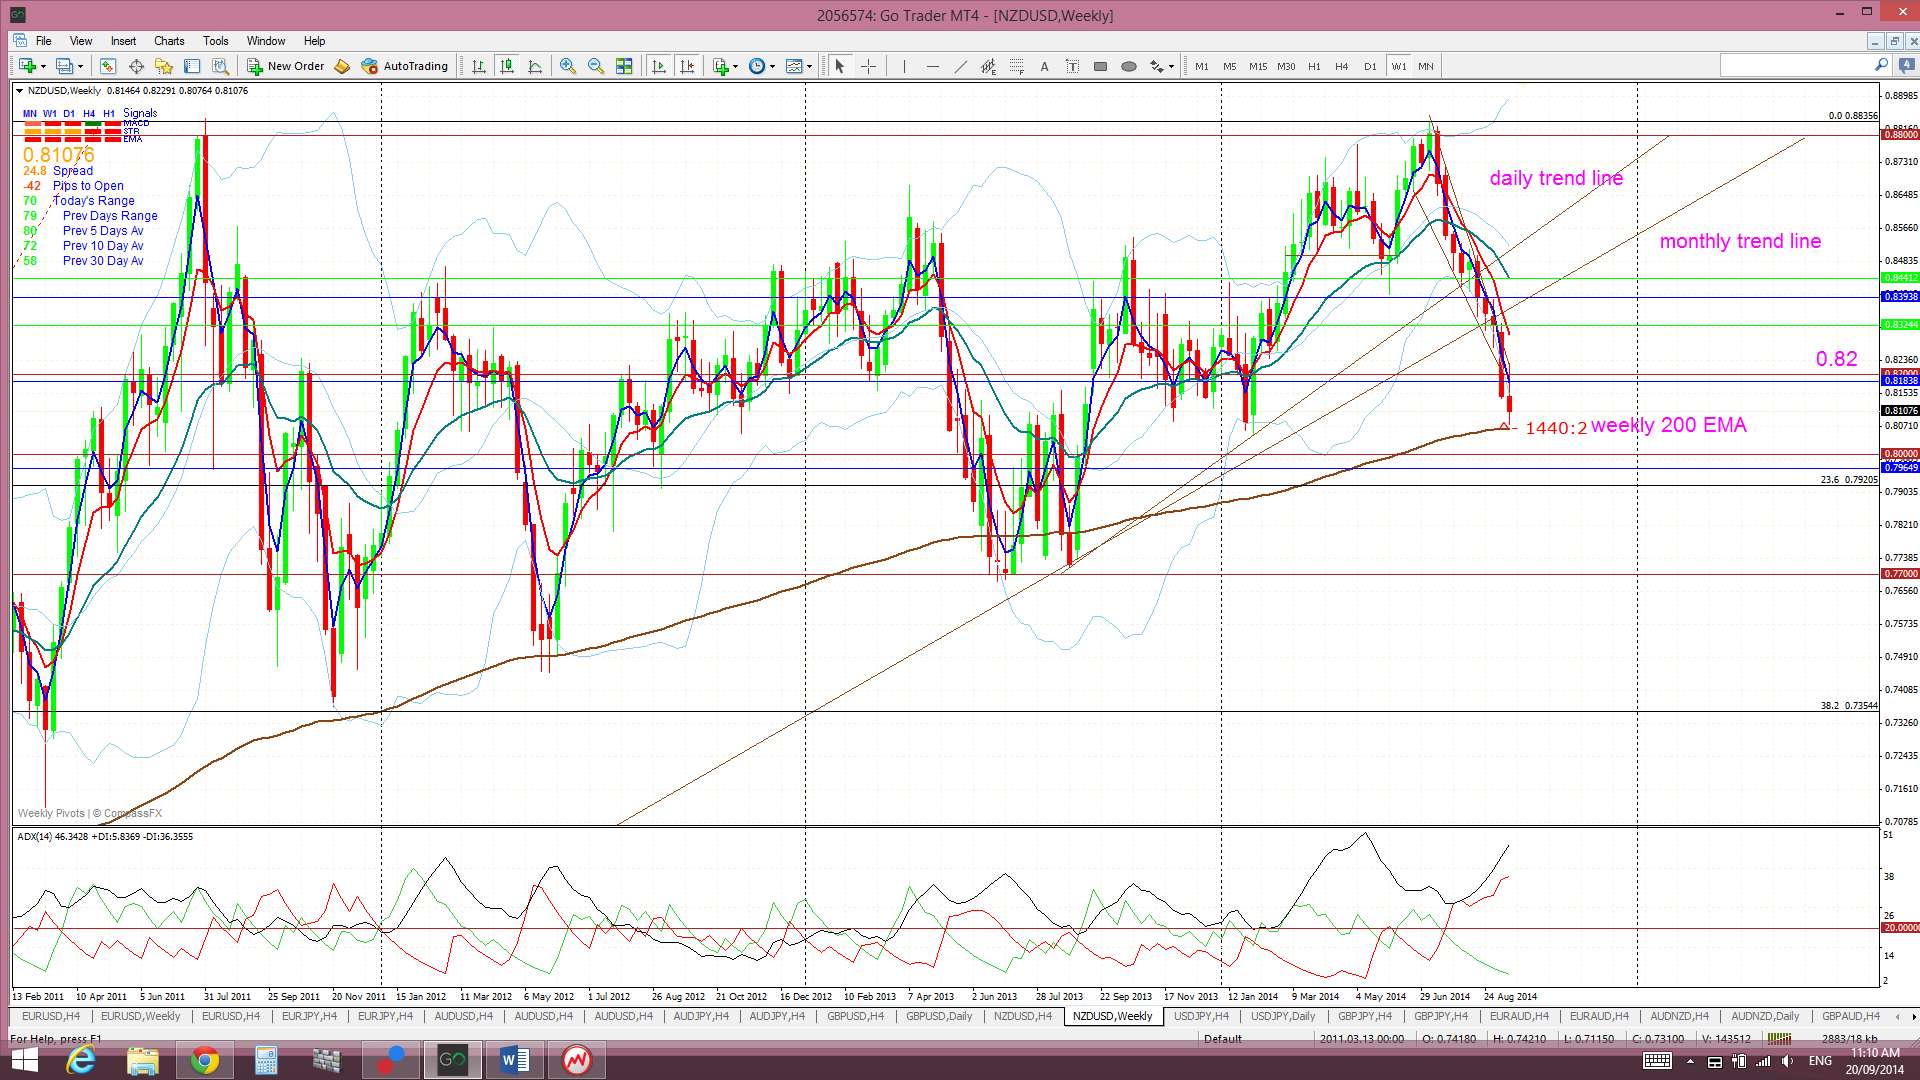
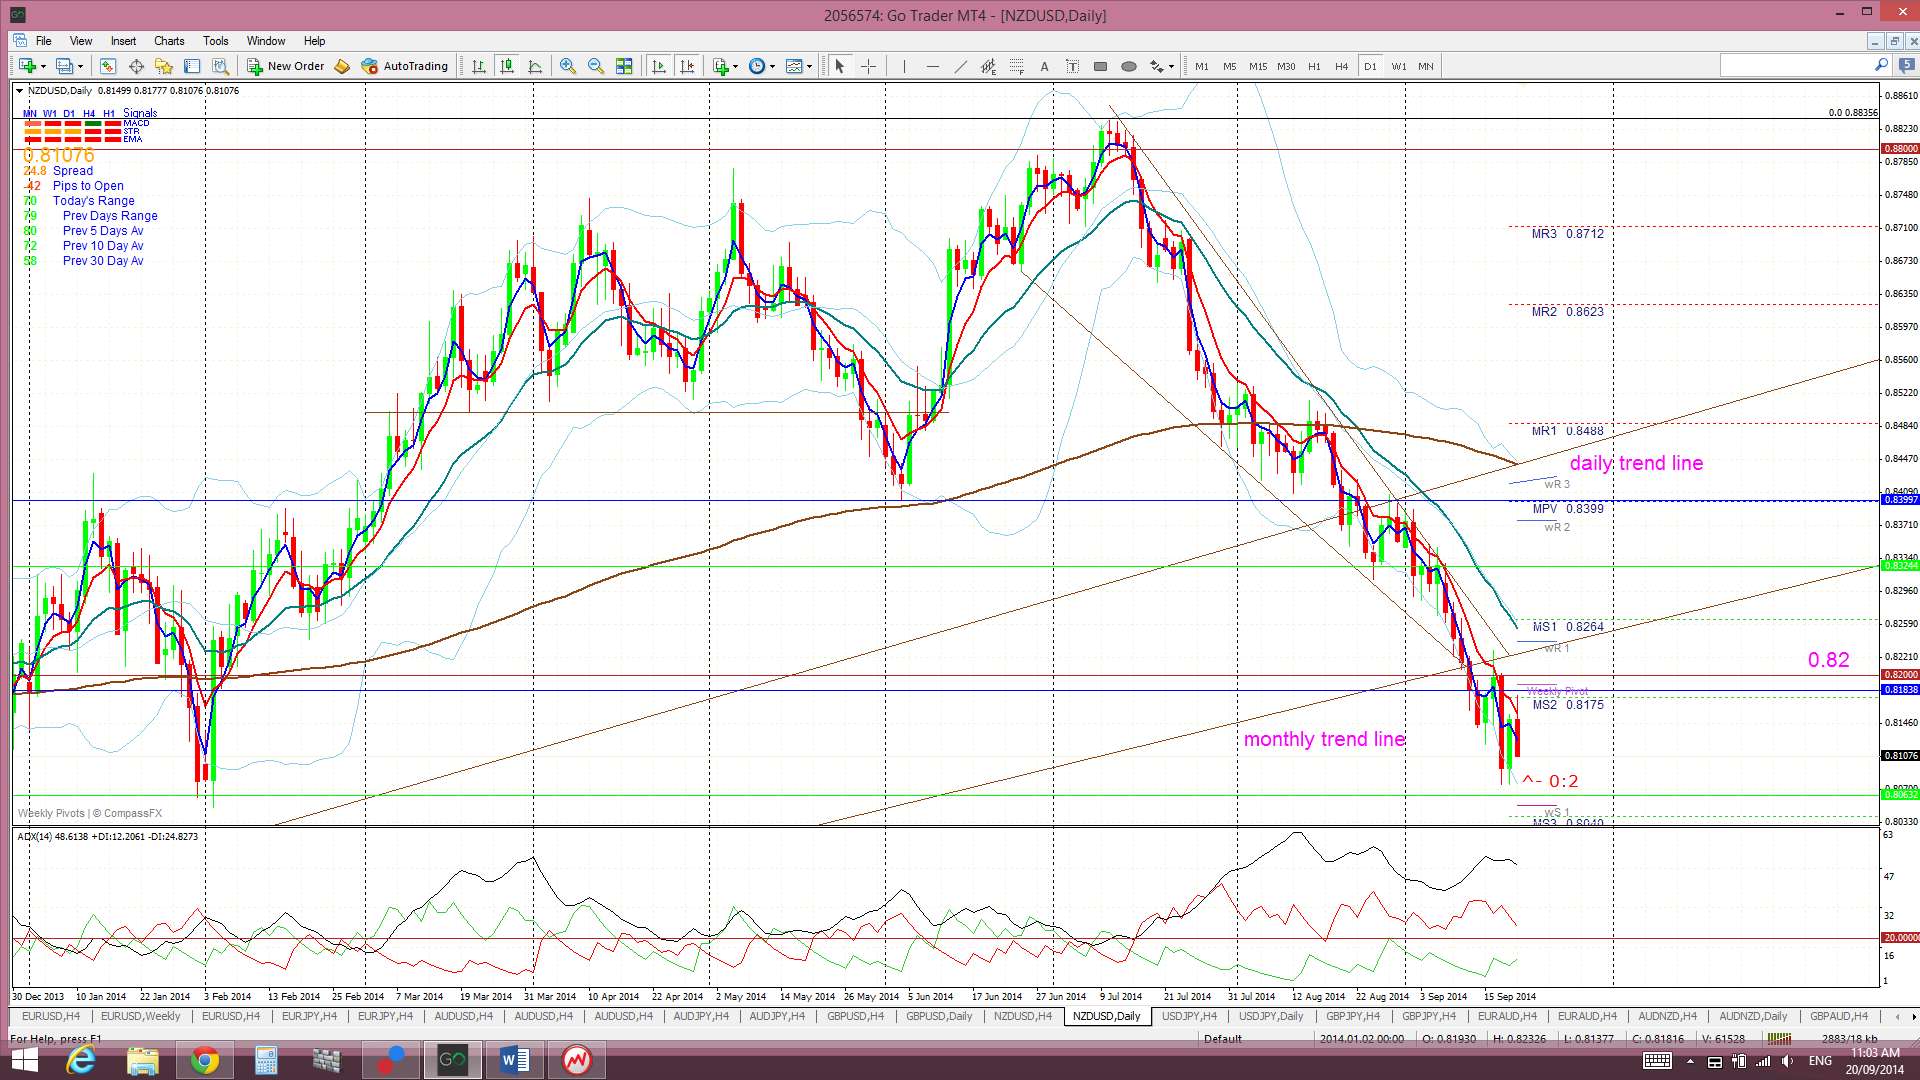
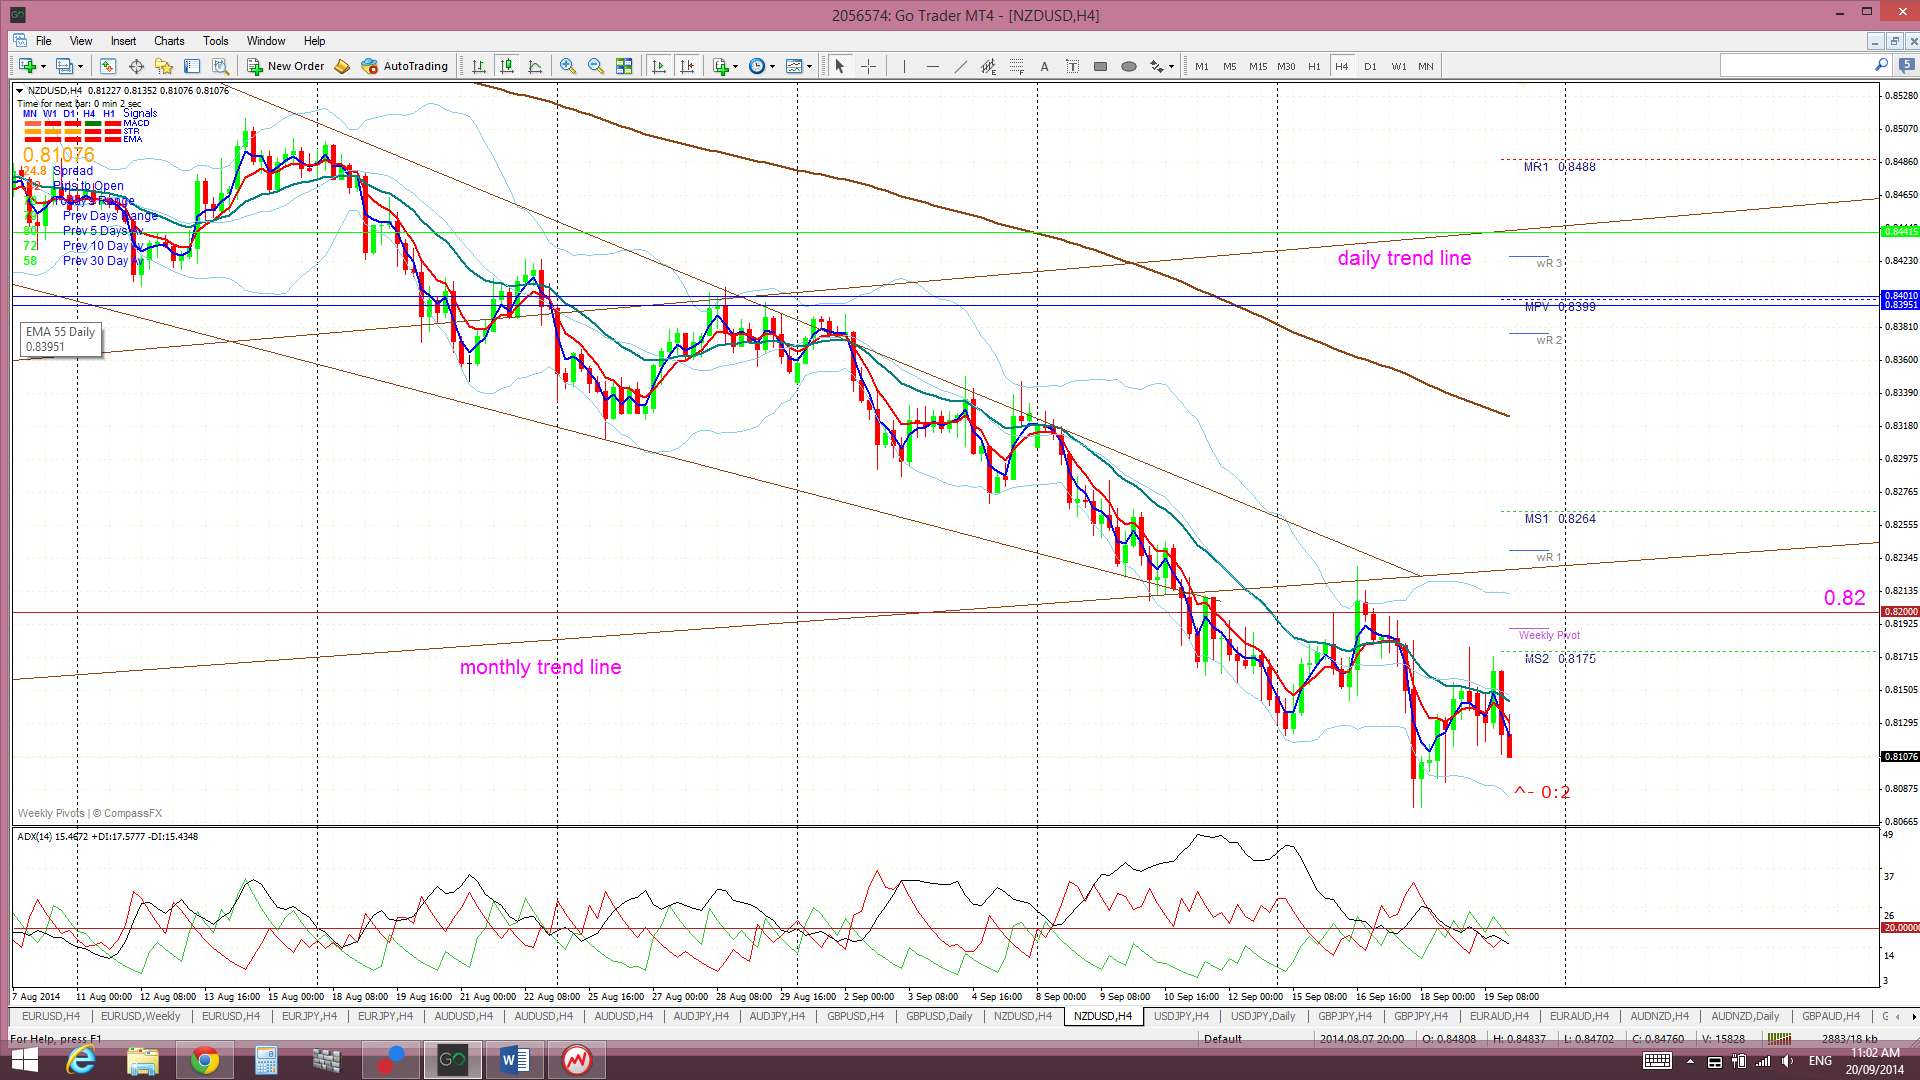
Kiwi: NZD/USD: The Kiwi chopped sideways last week under the key 0.82 level and monthly support trend line in the lead up to this weekend’s NZ Parliamentary Election but it did find some support from the weekly 200 EMA.Â
Price is still trading below the Ichimoku Cloud on the 4hr, daily and weekly charts but above on the monthly chart.
Placing fibs on the monthly chart shows that possible targets for any bearish follow through might include the:
- 23.6% fib near 79.
- 38.2% fib near 73.5
- 50% fib near 70 and the monthly 200 EMA.
The weekly candle closed as a bearish candle with long upper and lower shadows reflecting the indecision here.
- I’m watching for any new TC signal on this pair, the 0.82 level, the monthly support trend line and the weekly 200 EMA. I will revise this pair again after the election result.
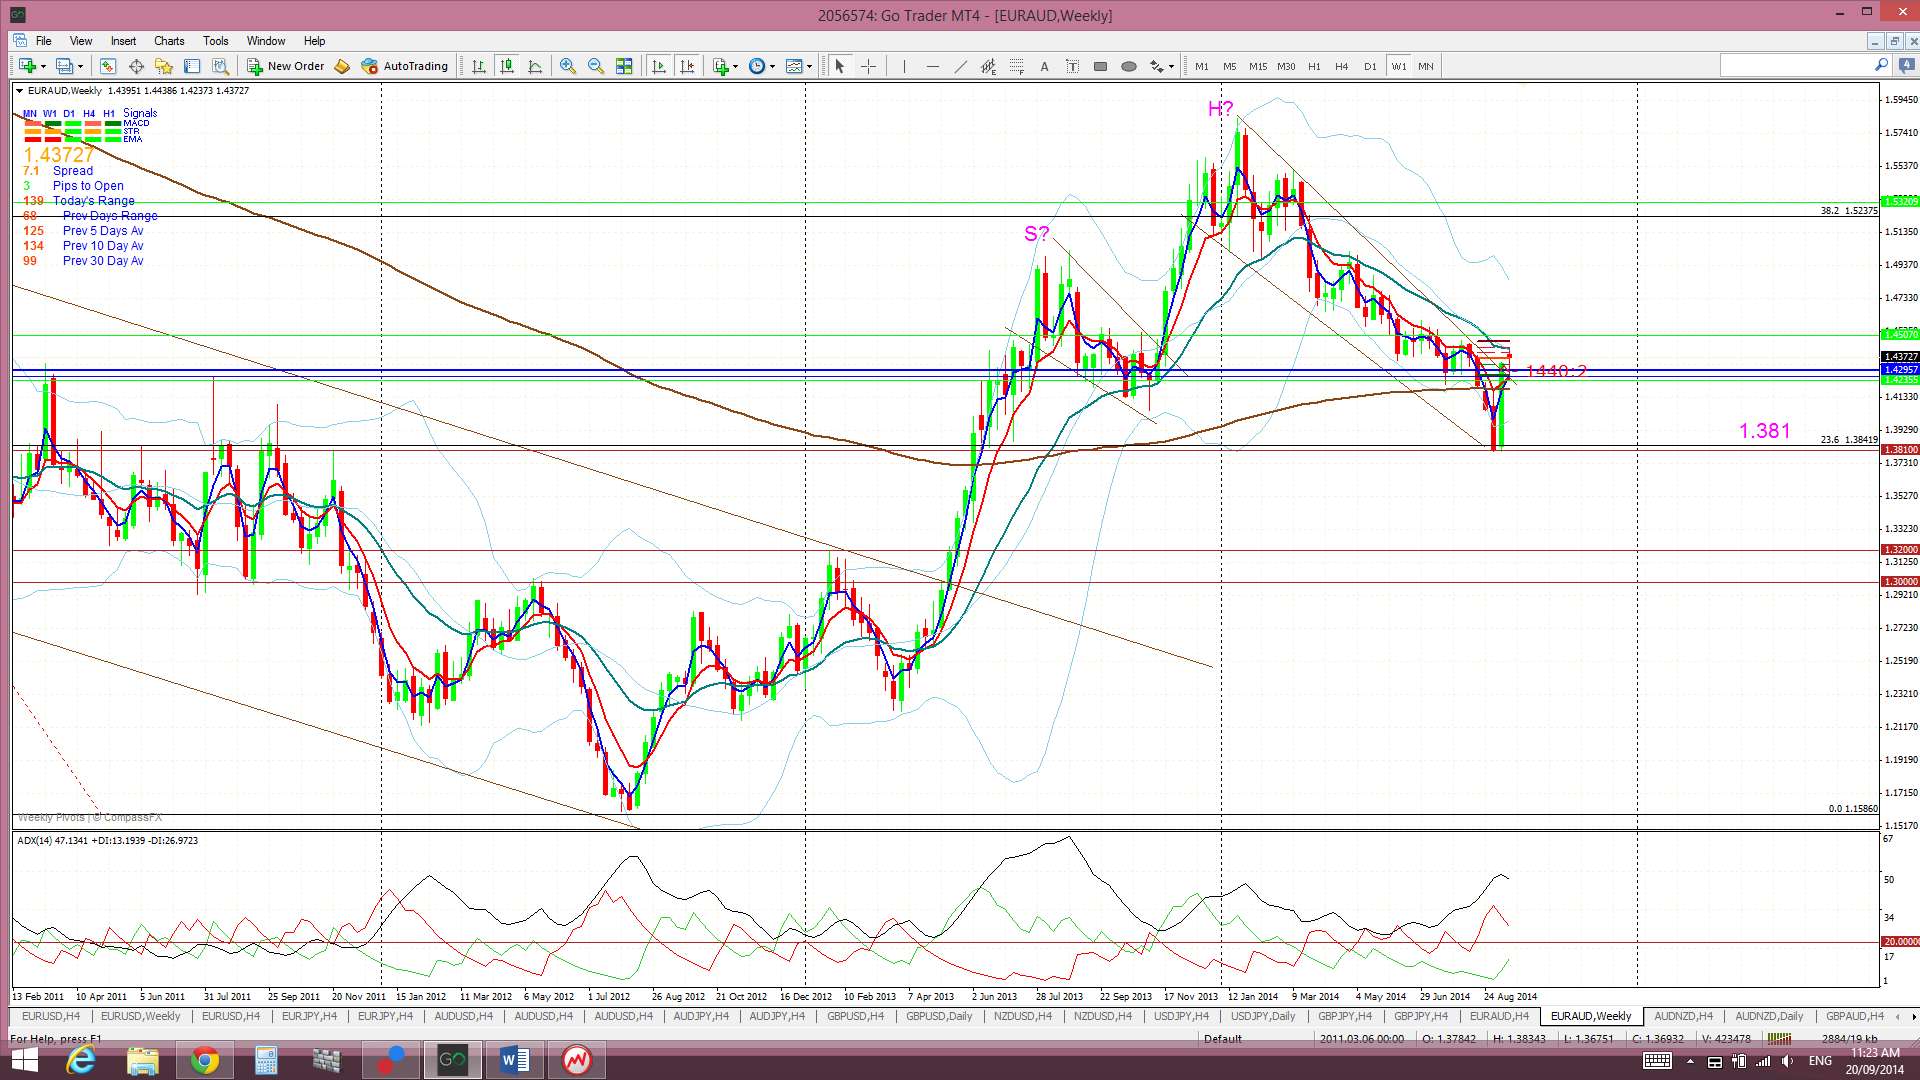
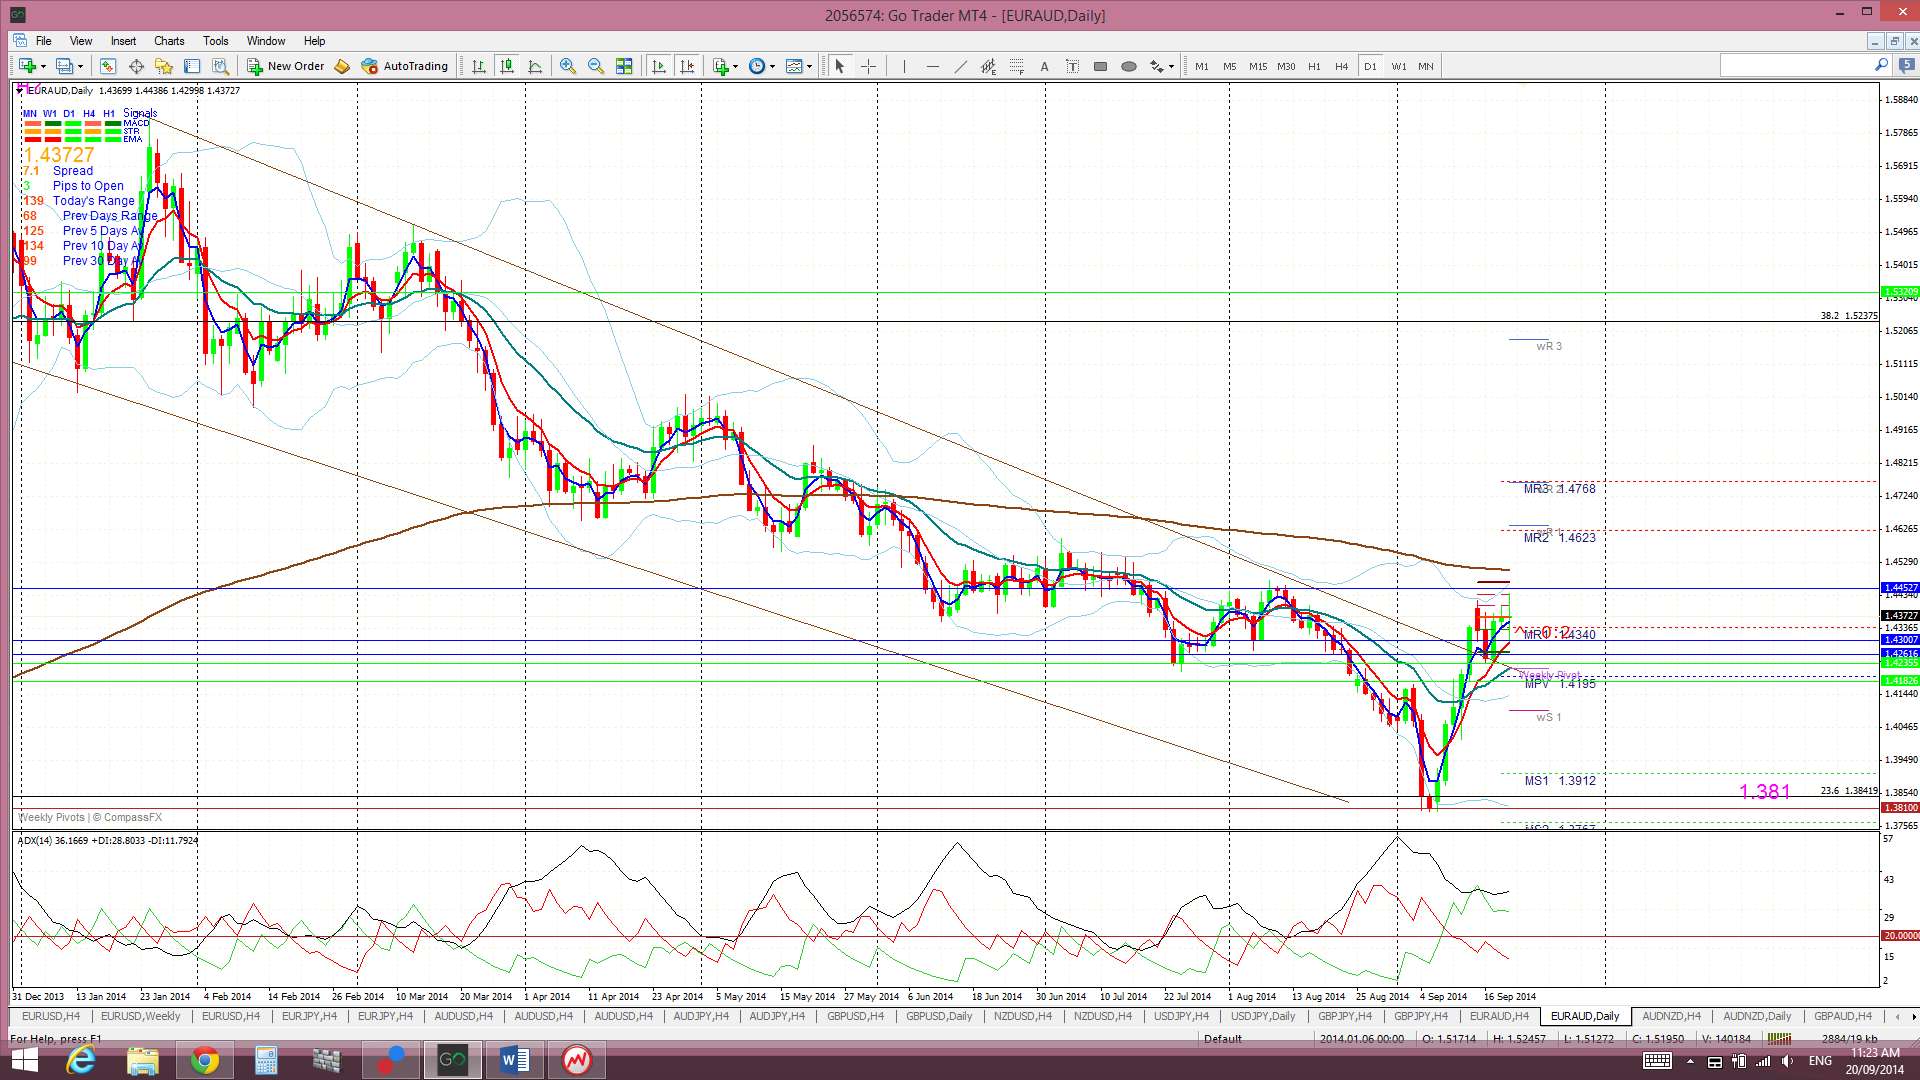
EUR/AUD: This pair was choppy for much of last week following on from the previous week’s bullish trading channel breakout.
This bullish move ties back in with the possible H&S that I thought might be building on the weekly chart.
The E/A is still trading above the Cloud on the 4hr chart but just below on the daily chart.
The weekly candle closed as a bearish coloured ‘SpinningTop’ candle.
- I’m watching for any new TC signal on this pair.


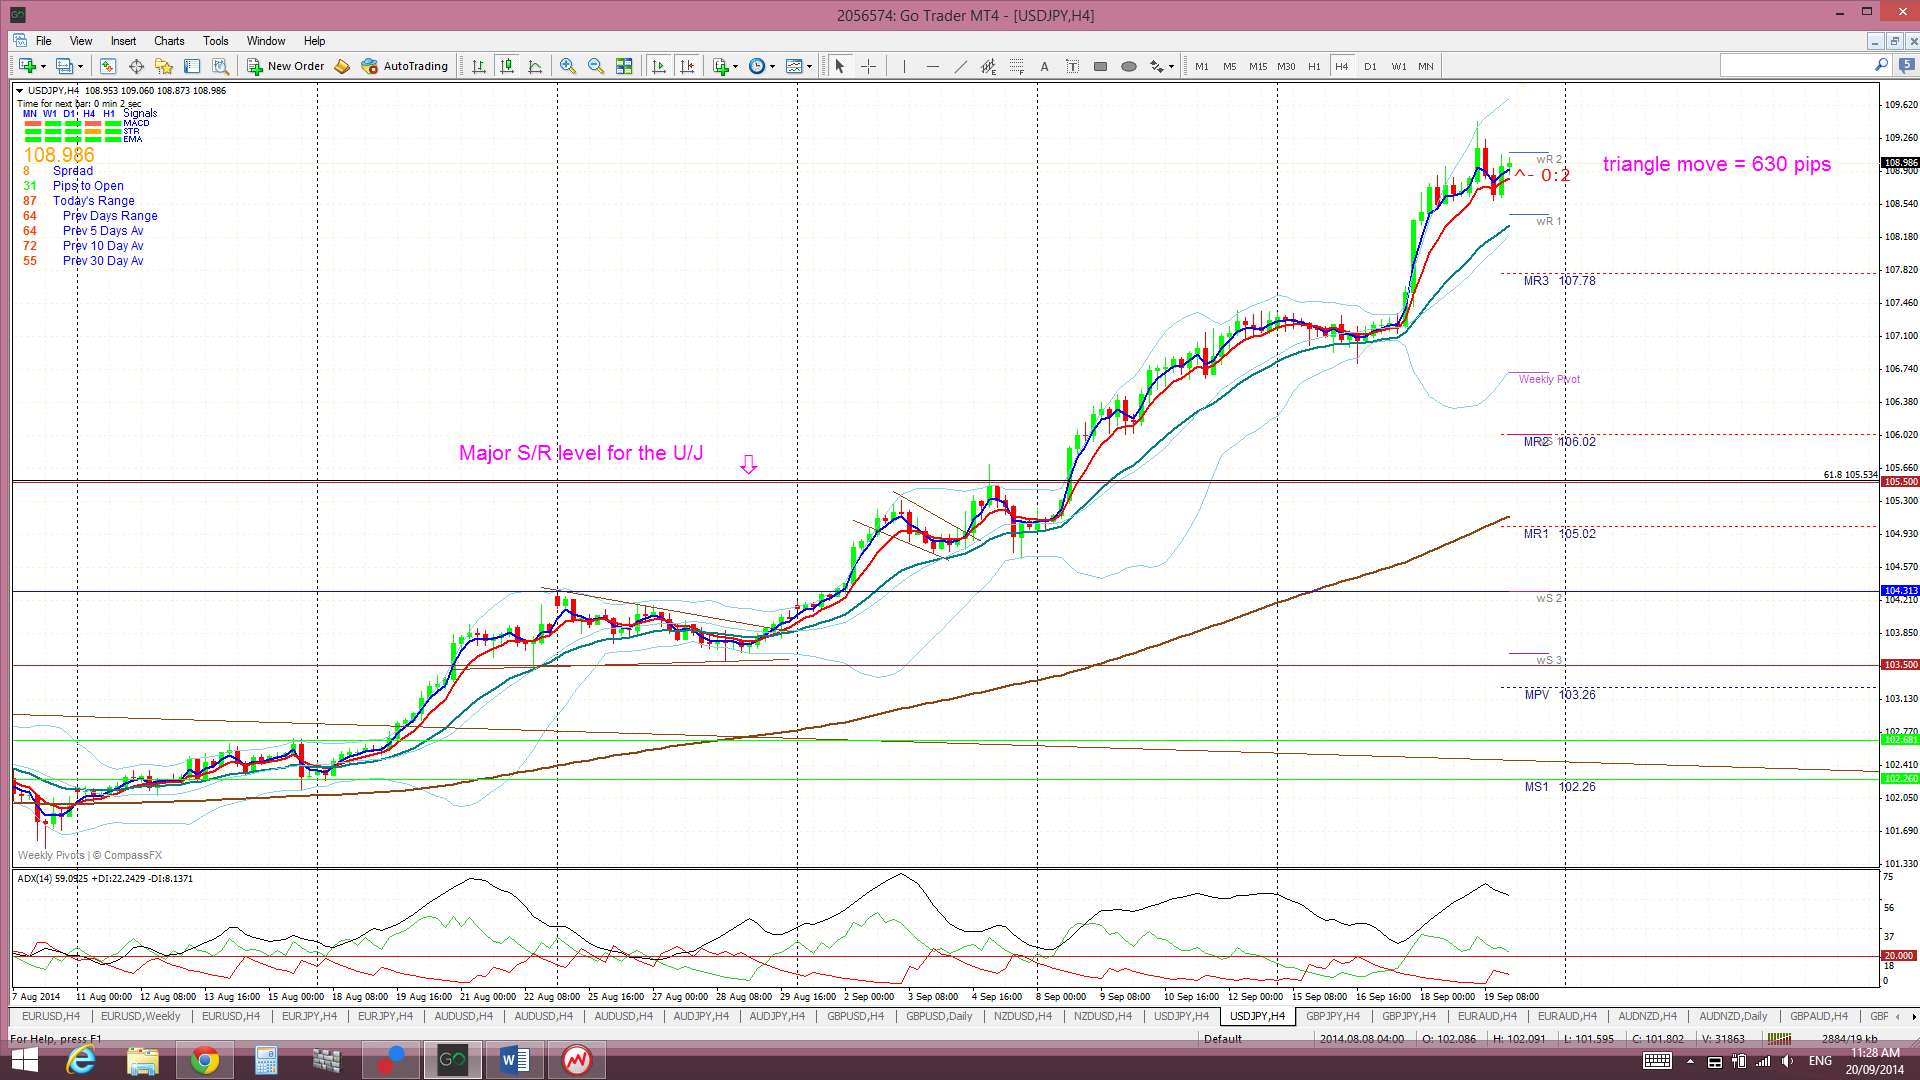
The Yen: U/J: The U/J had yet another bullish week and the parabolic move since the weekly chart’s bullish triangle breakout move continues. This technical move has now delivered over 630 pips. I don’t consider this activity is sustainable over the long term and still believe that the 61.8% fib level at 105.5 could be tested again, even if there is to be bullish continuation. The 61.8% fib of any move is a major technical level and, as such, this might be tested.
Price is still trading above the Cloud on the 4hr, daily, weekly and monthly charts which is bullish though so any pull back might be brief. November was the first monthly candle close above the Ichimoku Cloud since mid-2007 and the bullish hold above the monthly Cloud continues to be noteworthy.
The weekly candle closed as a large bullish candle and just below the 109 level. Any new hold and close above 109 would suggest bullish continuation though and I would then expect that the 78.6% fib, up near 113.7, might be the next level to be tested.
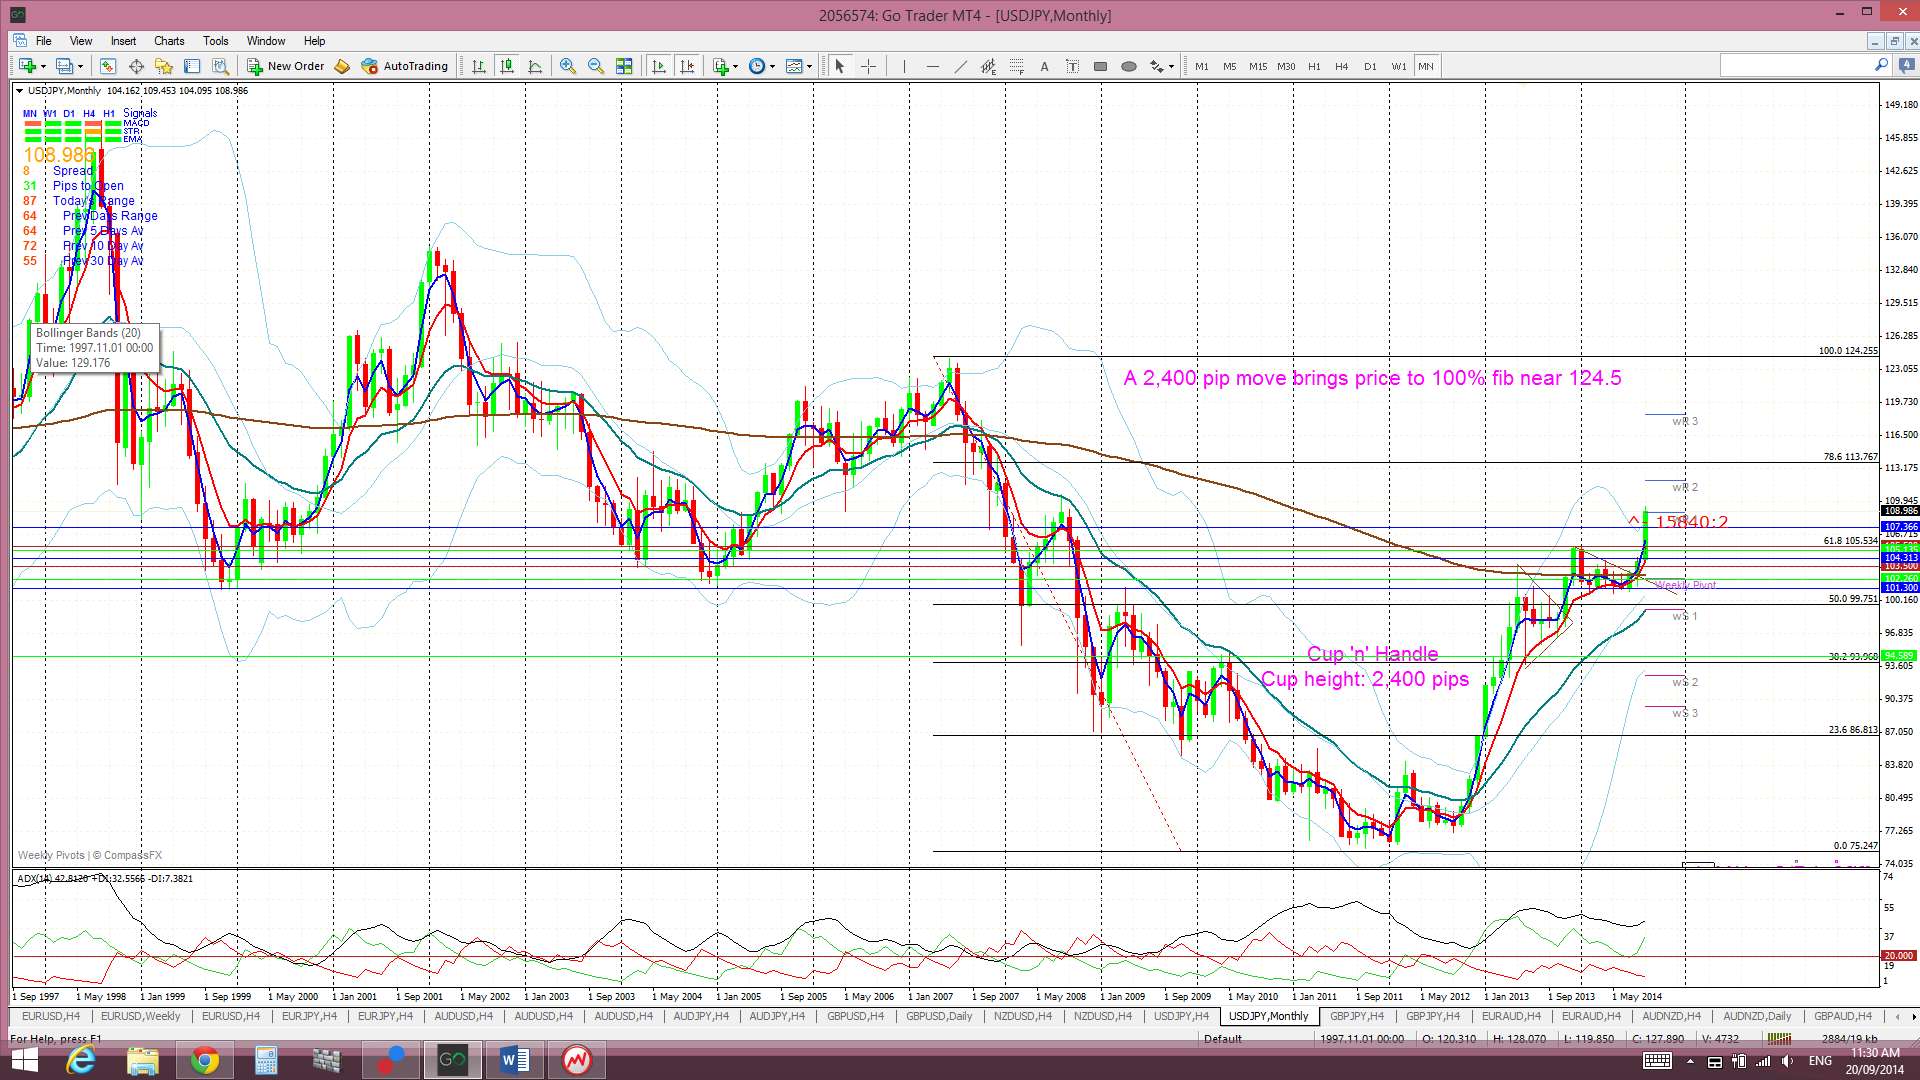
Weekly Chart Bullish Cup’ n’ Handle pattern: I am still seeing this pattern building on the weekly chart and the recent weekly chart triangle breakout supports the continued development of this pattern. The theory behind these patterns is that the height of the ‘Cup’ pattern is equivalent to the expected bullish move from the ‘handle’ breakout. The height of the Cup for the U/J weekly chart is around 2,400 pips. The interesting point here is that a 2,400 pip bullish move up from the ‘Handle’ would put price up near the 124 level. This level is the last major swing high for the U/J from back in 2007 and represents the 100% fib pullback for the move down in 2007 to the lows of 2012. Possible targets along the way include the 61.8% fib retrace level at the 105.5 region and the 78.6% fib up near the 112 region.
- I’m watching for any new TC signal, the 105.5 level and the 109 level.


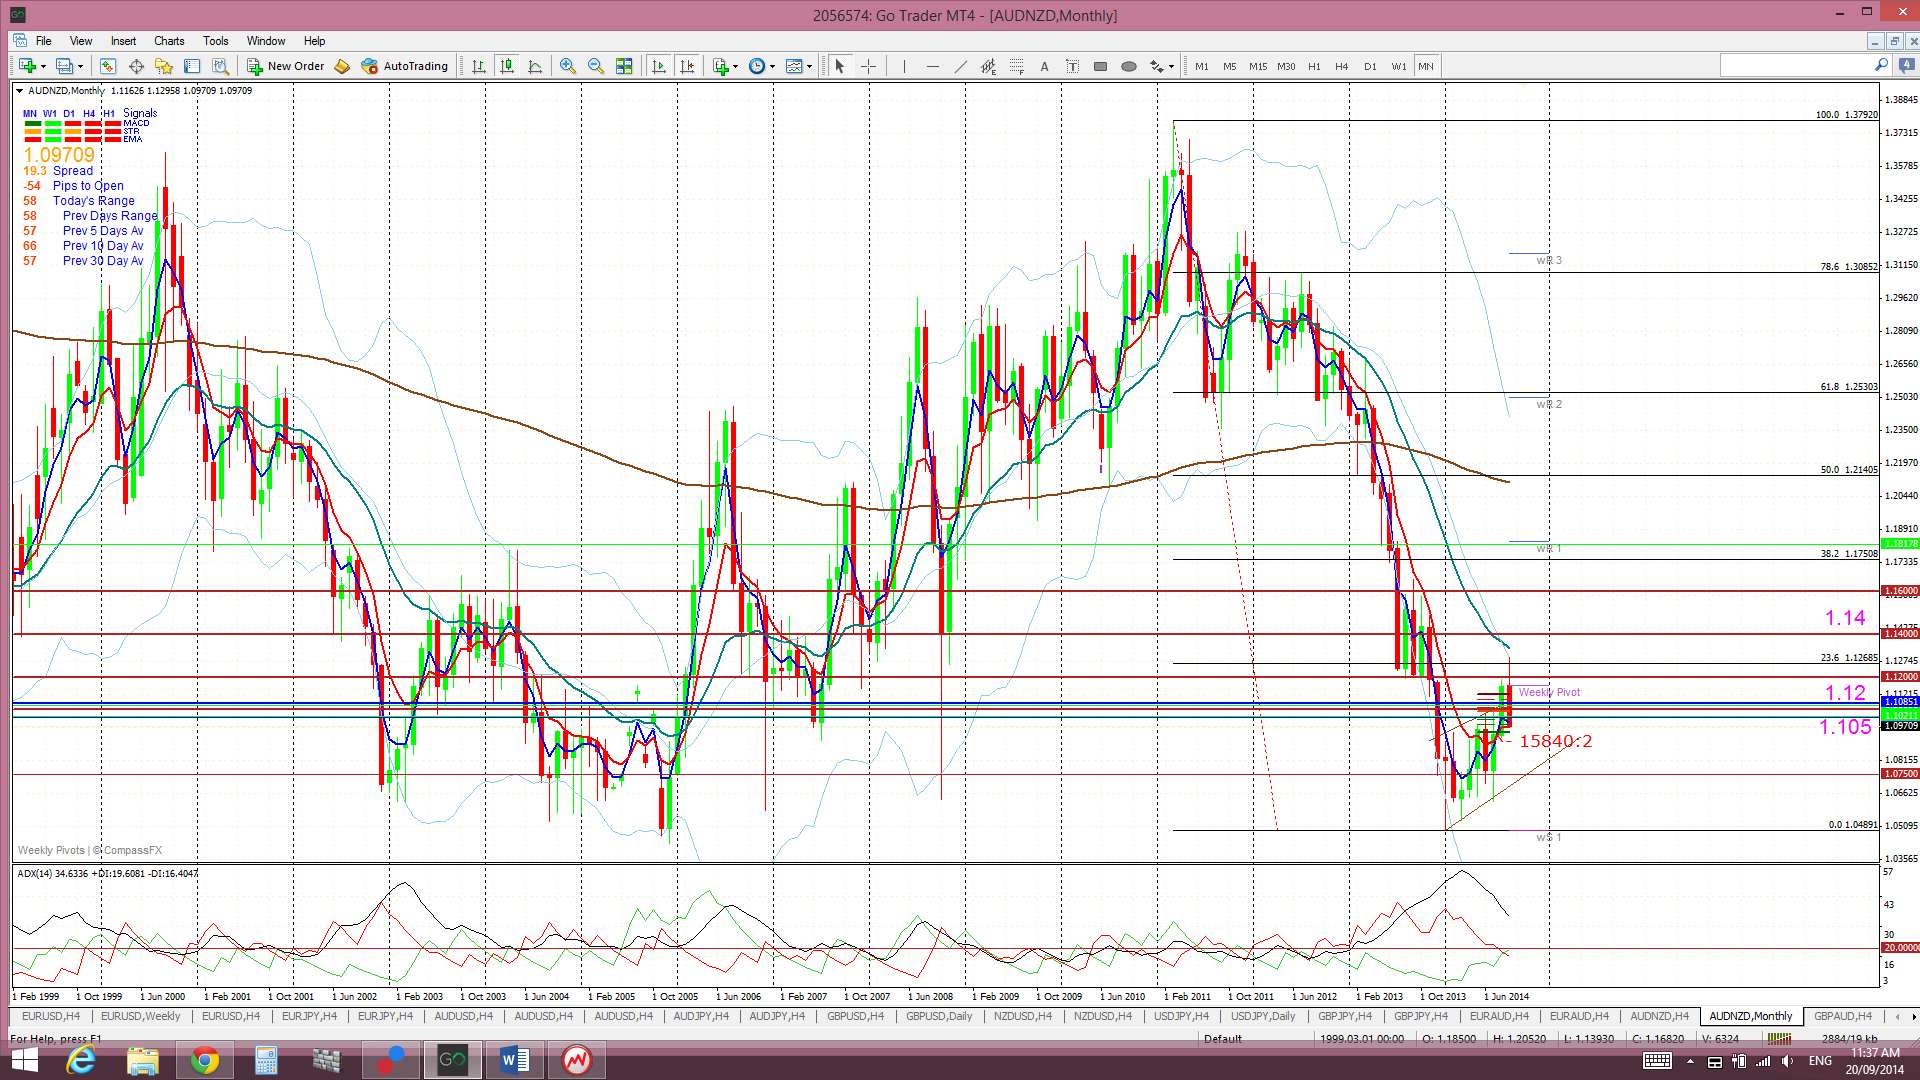
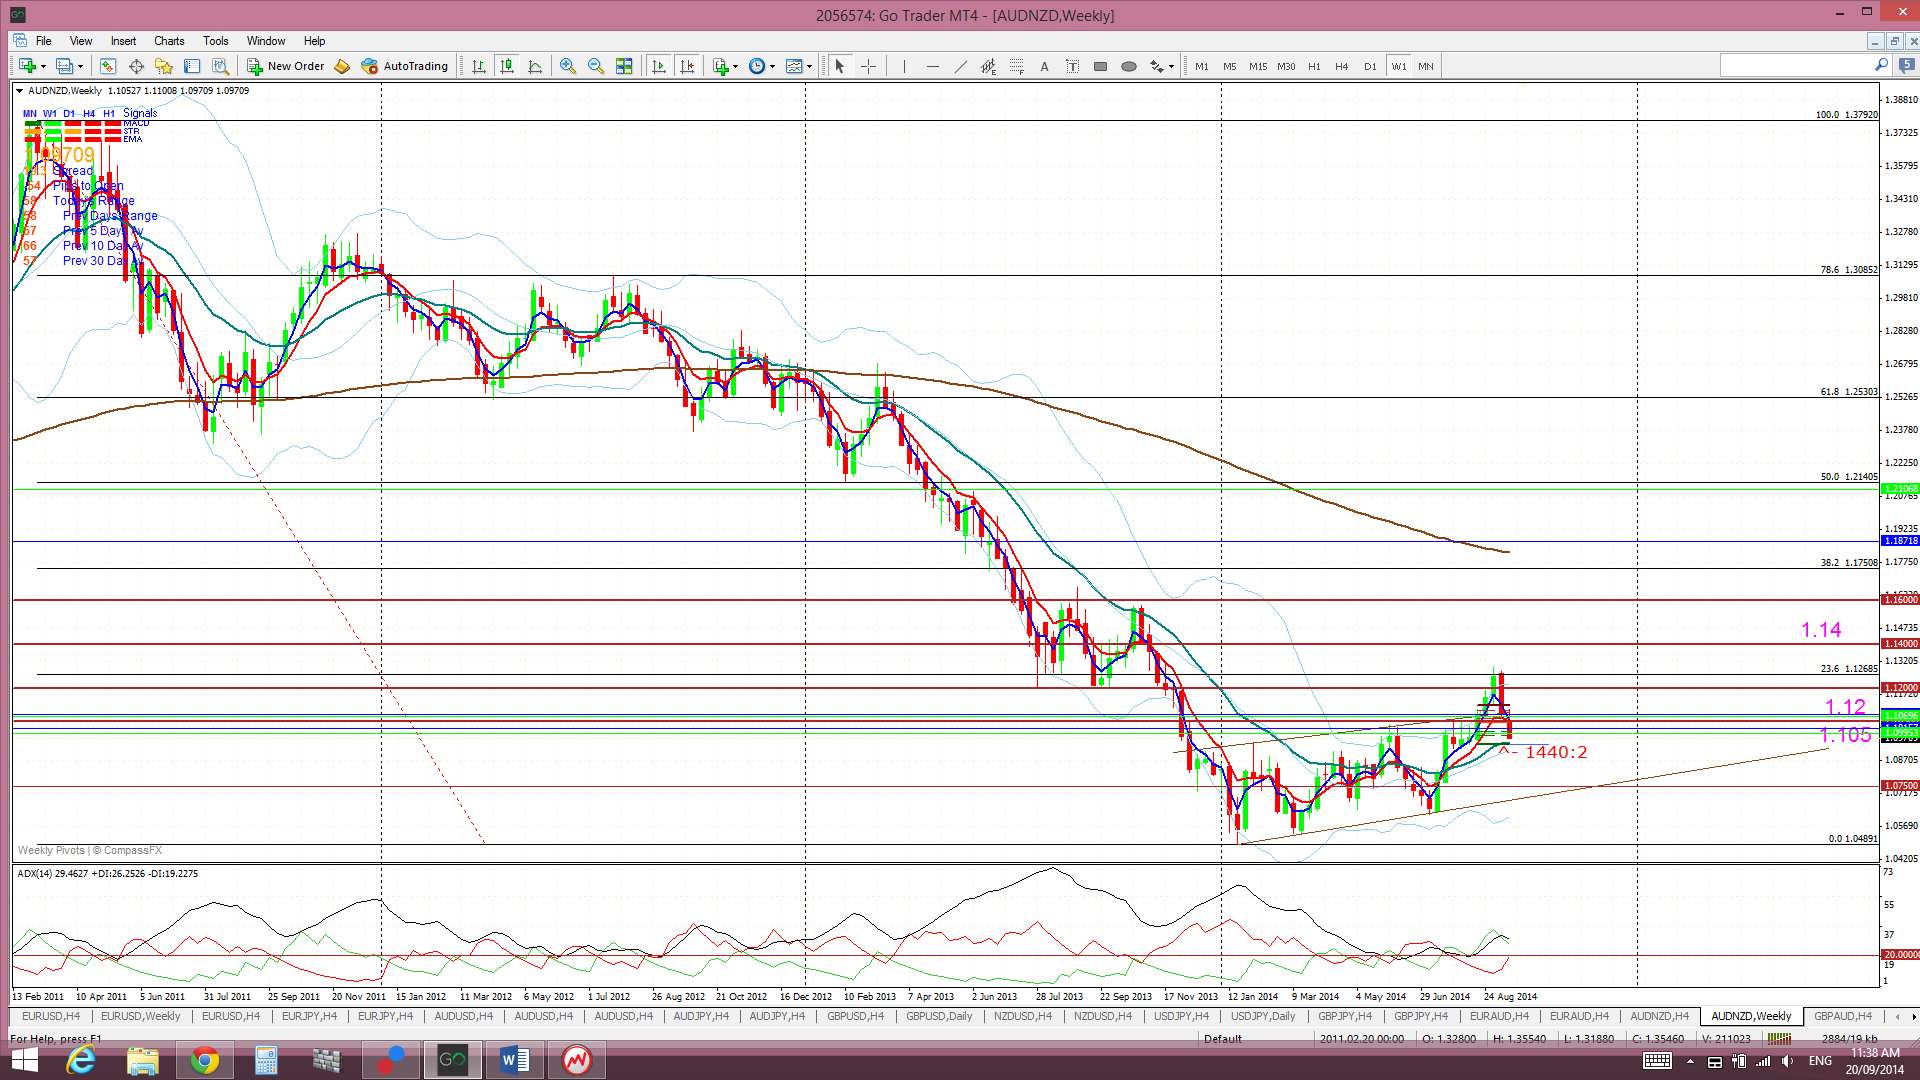
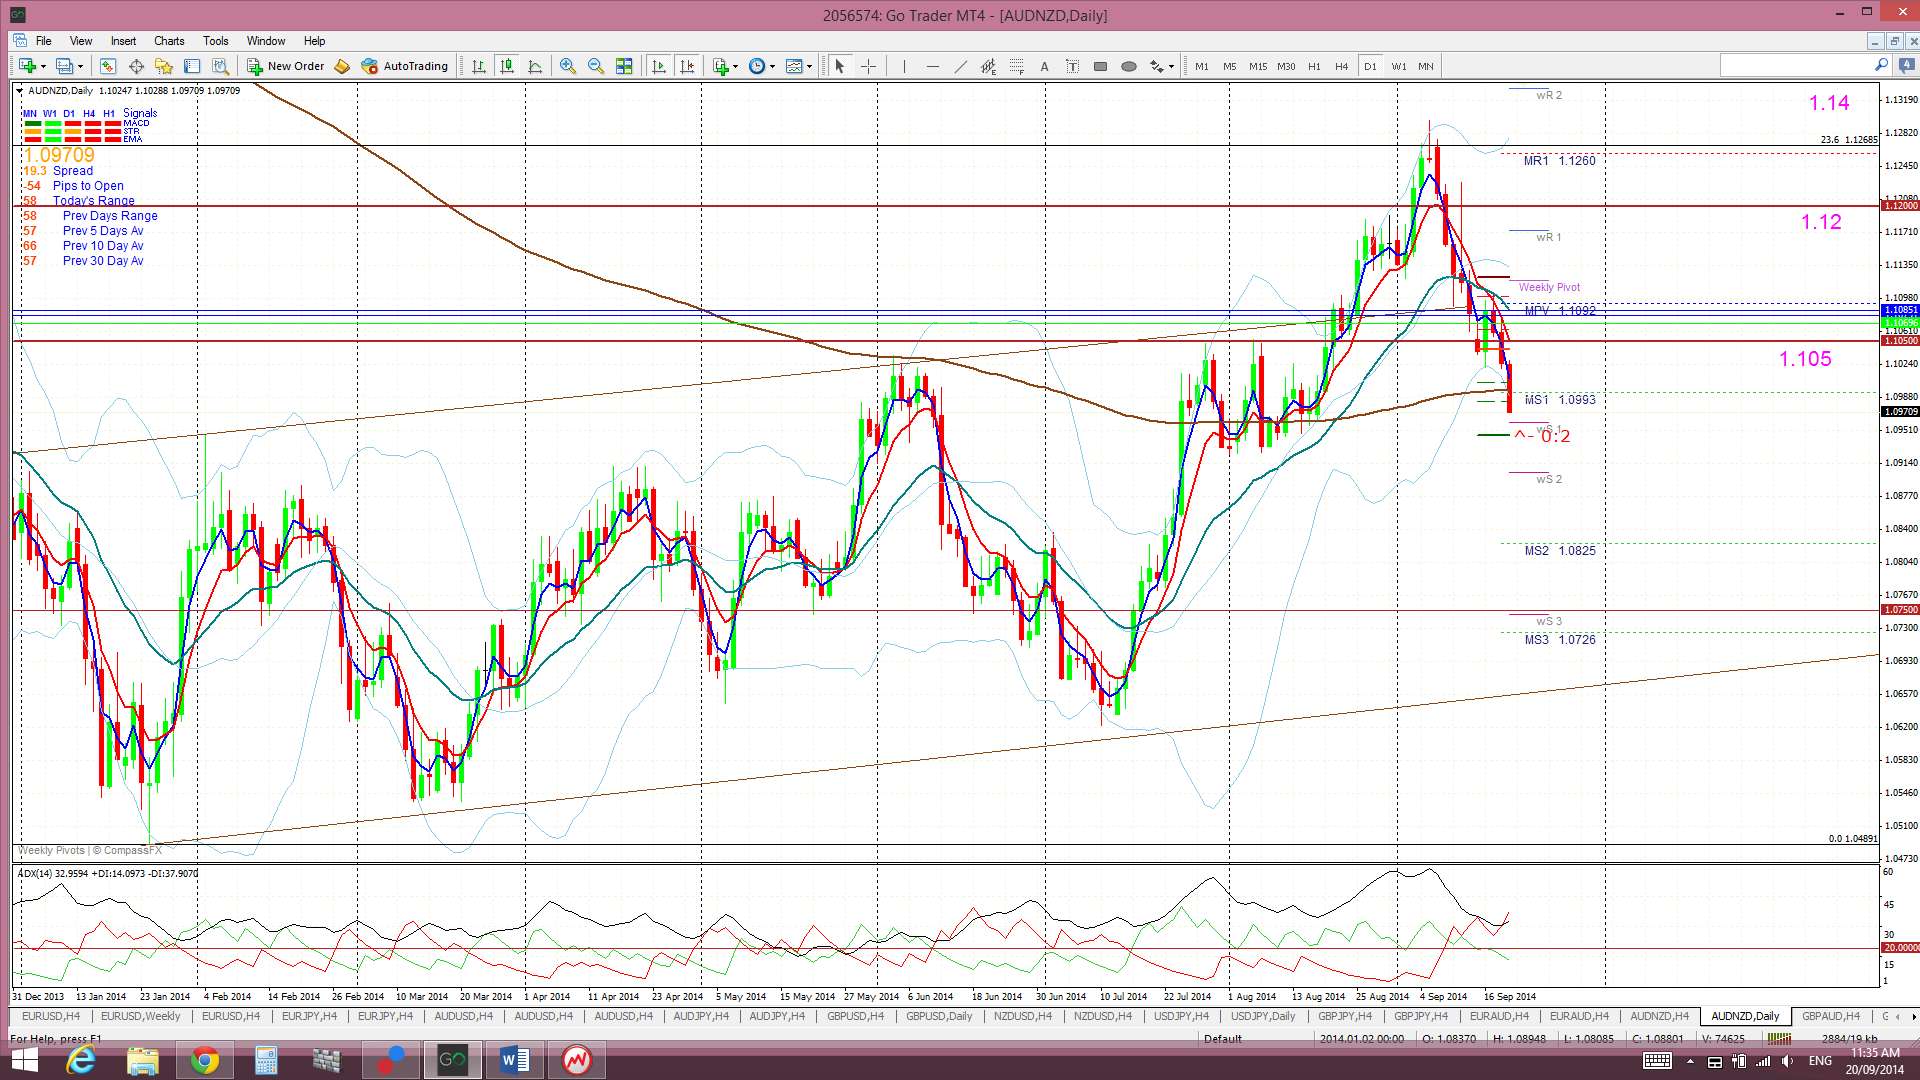
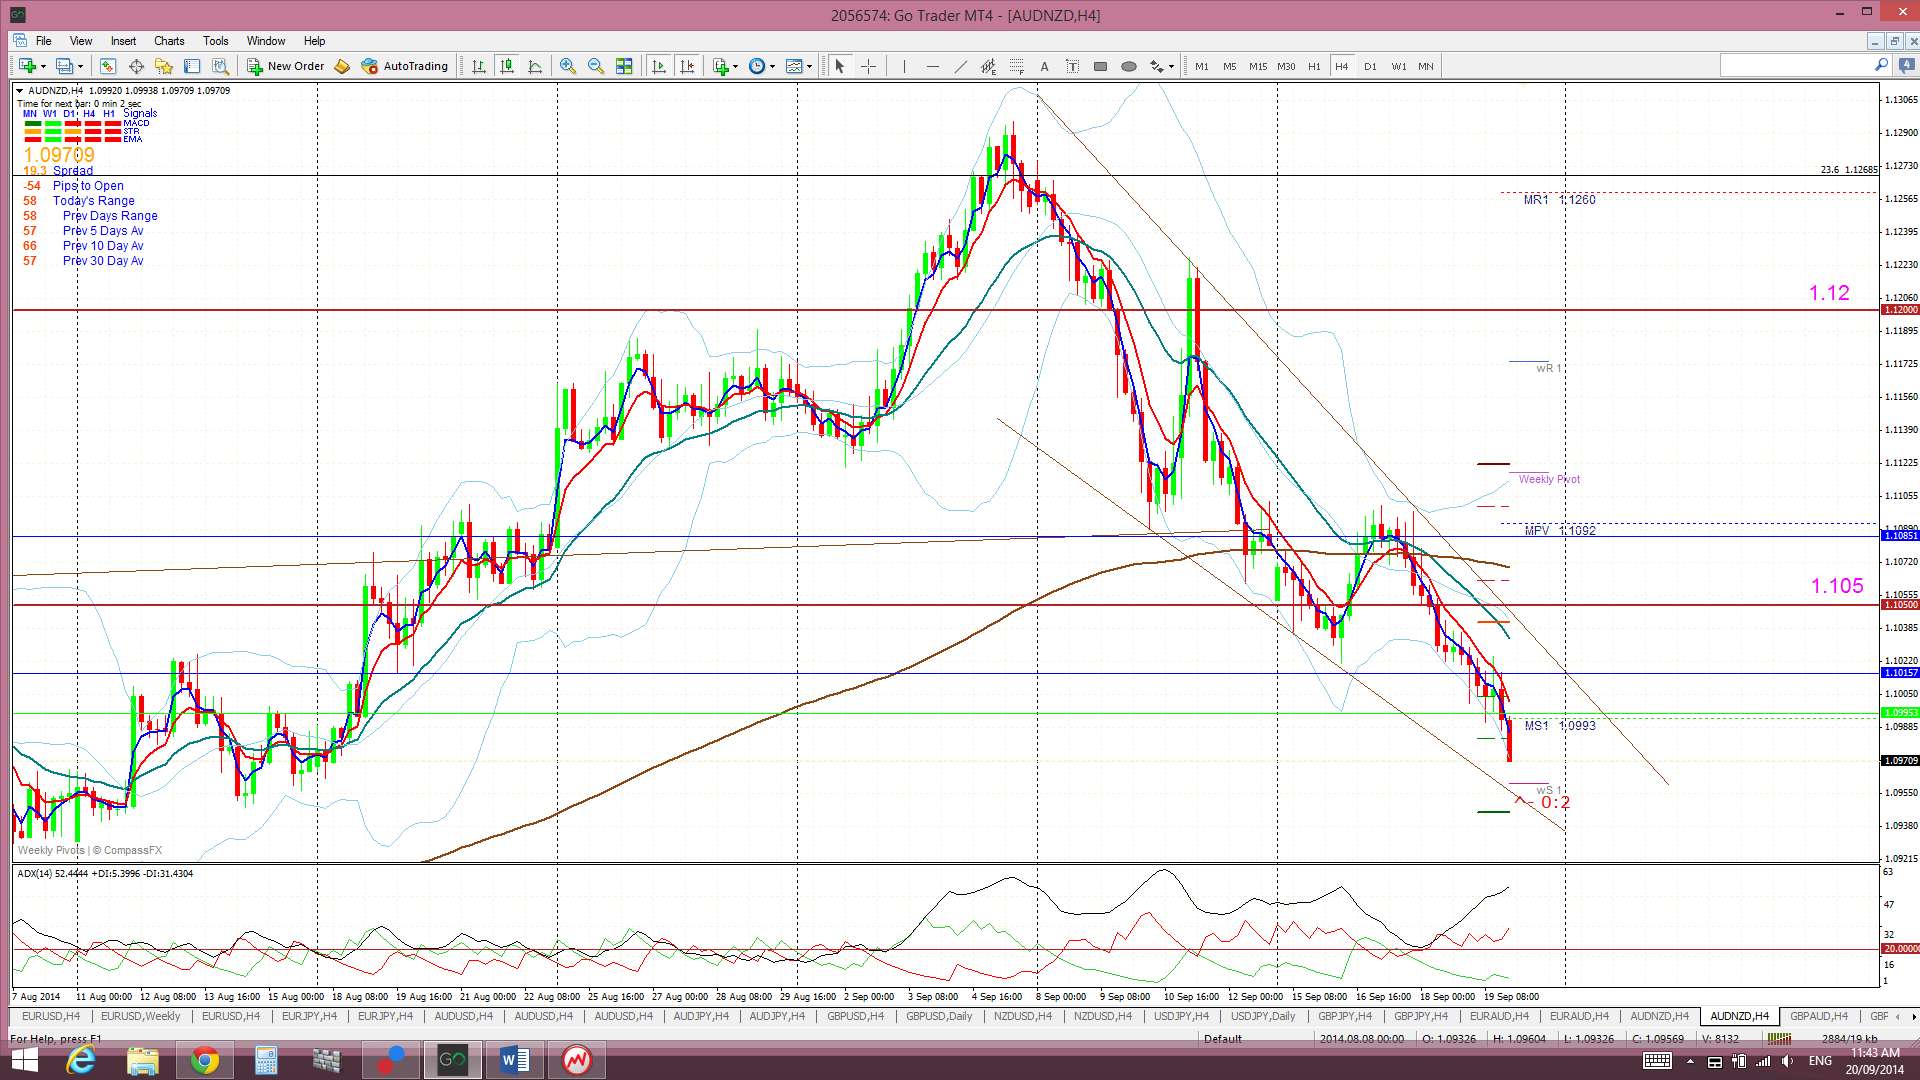
AUD/NZD: Price chopped around either side of the 1.105 support level to start last week but then fell back below the 1.105 by Friday. I suspect this choppiness might continue until after the NZ election.
The AUD/NZD is still trading below the Cloud on the 4hr chart but above on the daily chart which suggests choppiness.
The weekly candle closed as a bearish candle.
I am seeing the 4hr chart setting up with a possible bullish descending wedge though so I’ll keep an eye on the trend lines here.
- I’m watching for any new TC signal, the 1.105 level and the wedge trend lines.
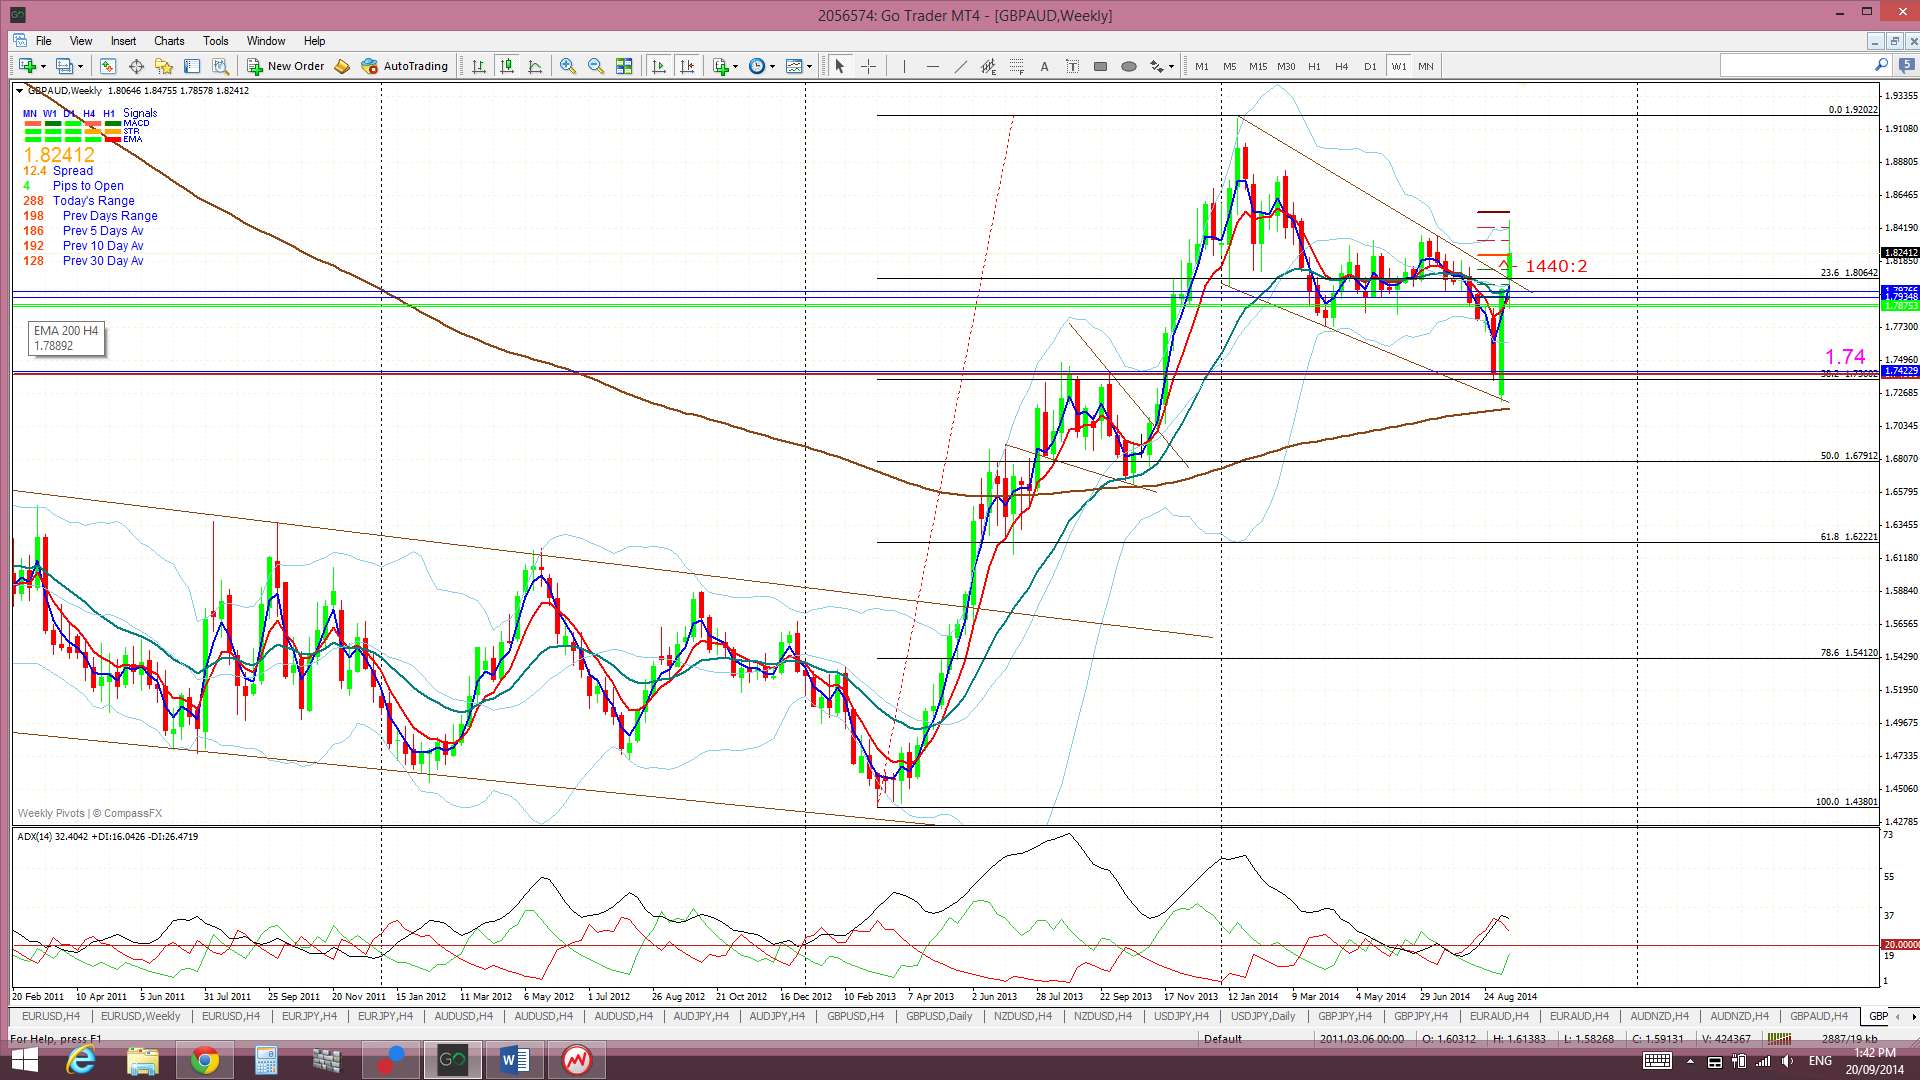
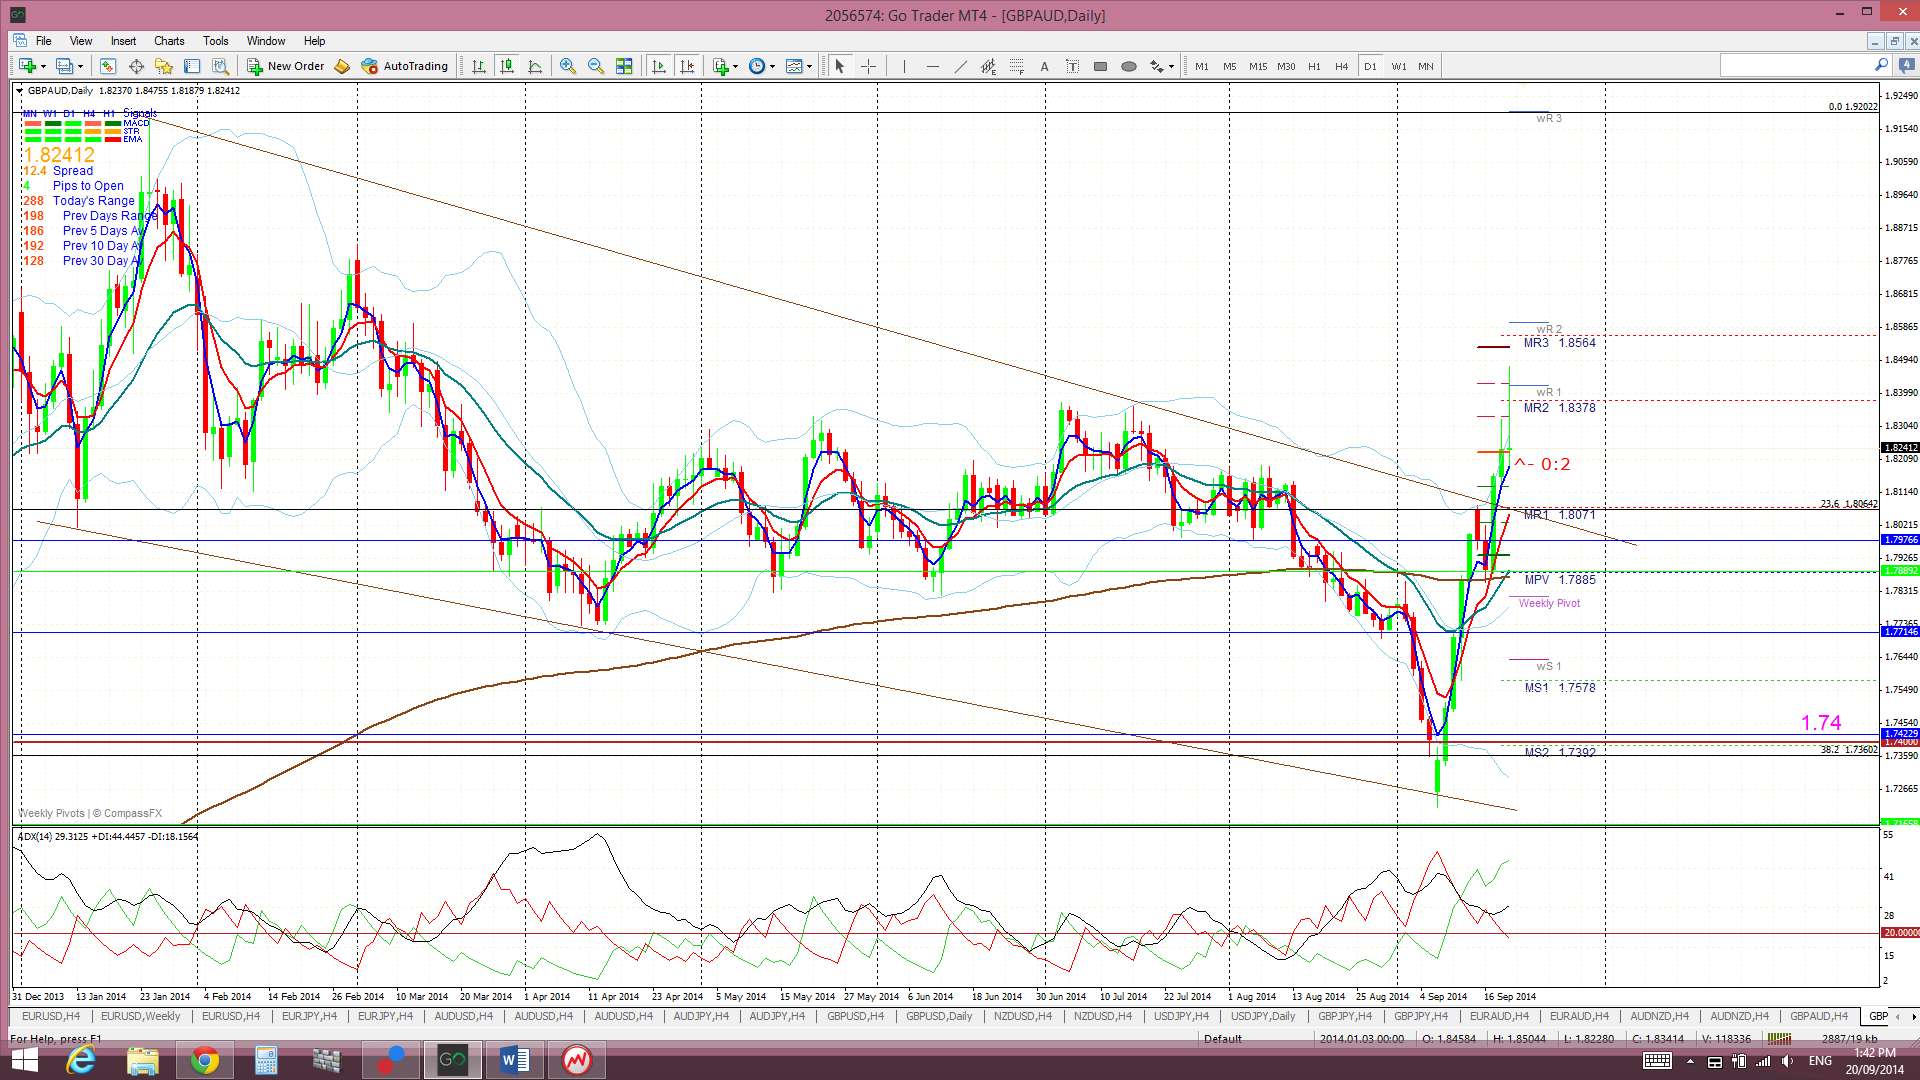
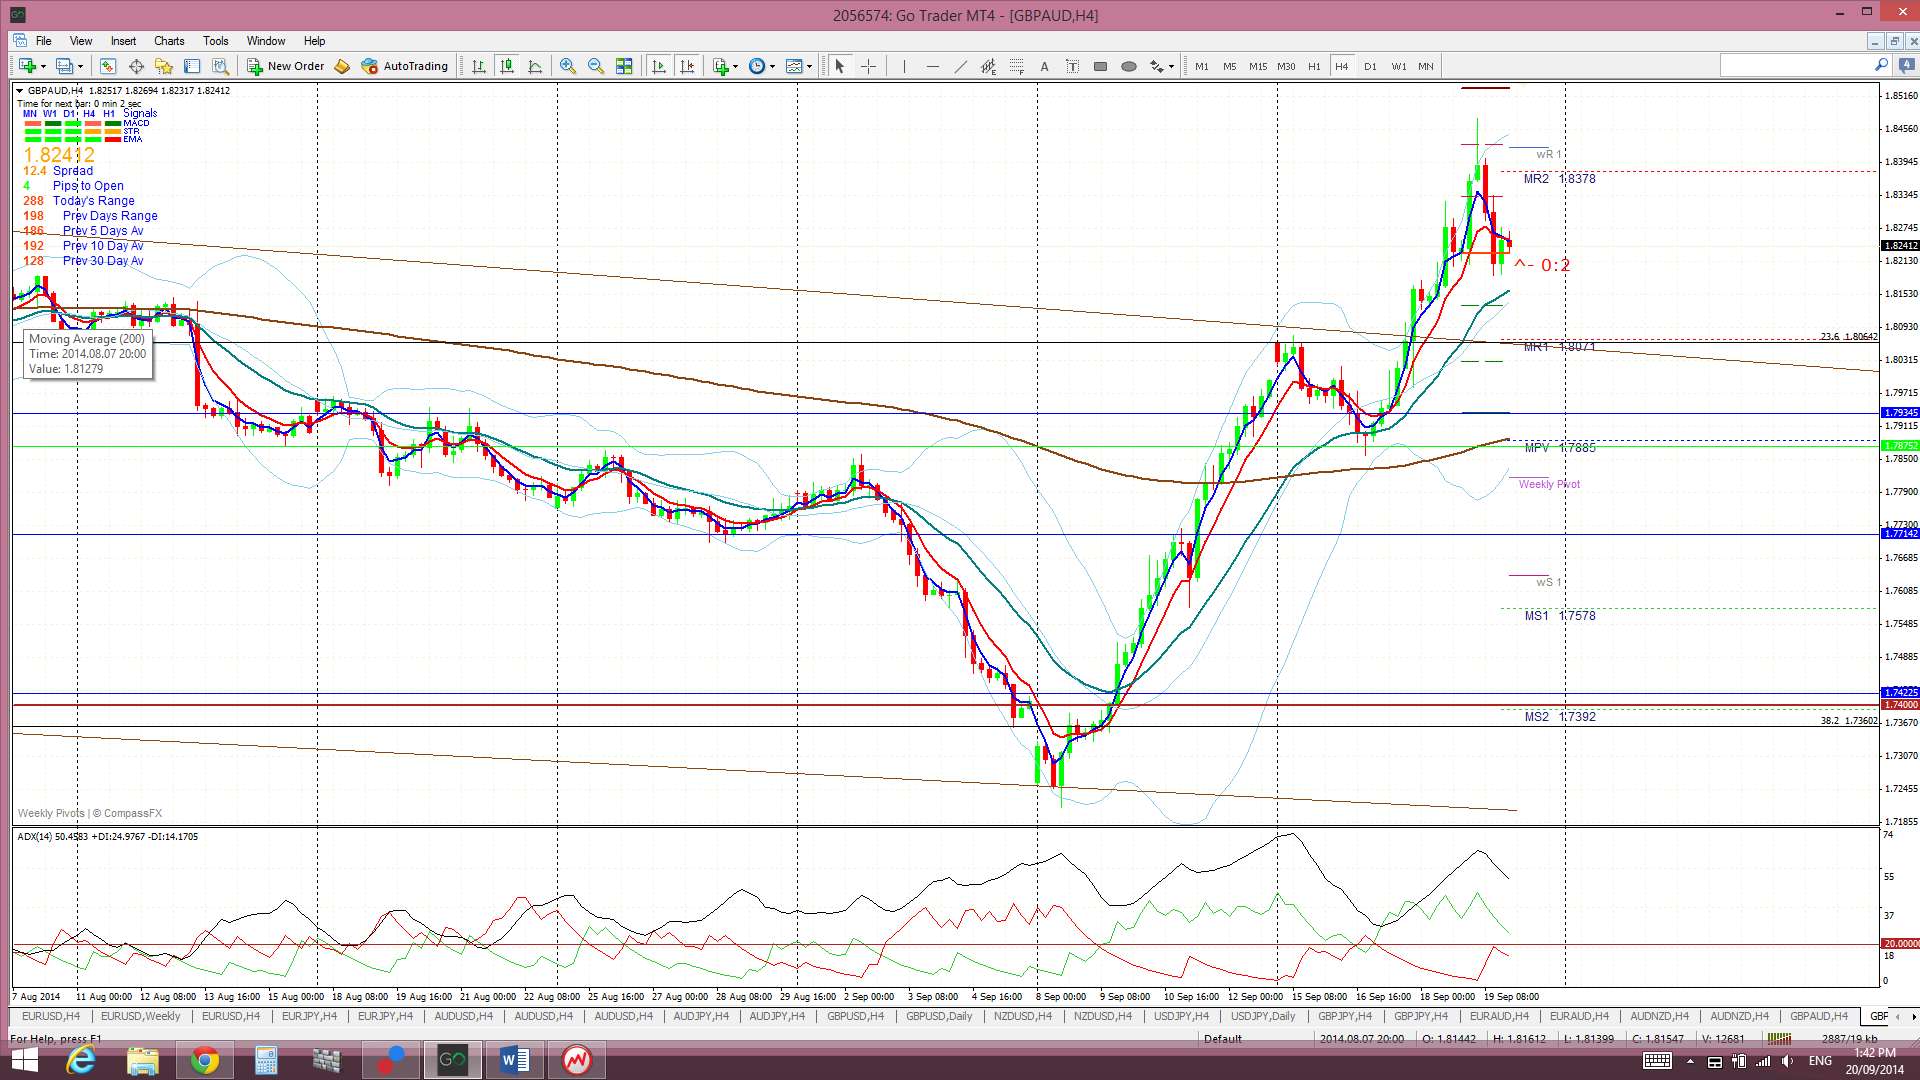
GBP/AUD: This pair made a bullish breakout from the trading channel during last week. Any hold up and out from this channel would support a continuation move.
Price is now trading above the Ichimoku Cloud on the 4hr and daily charts which is bullish.
The weekly candle closed as a bullish candle.
- I’m watching for any new TC signal and the trading channel trend lines.
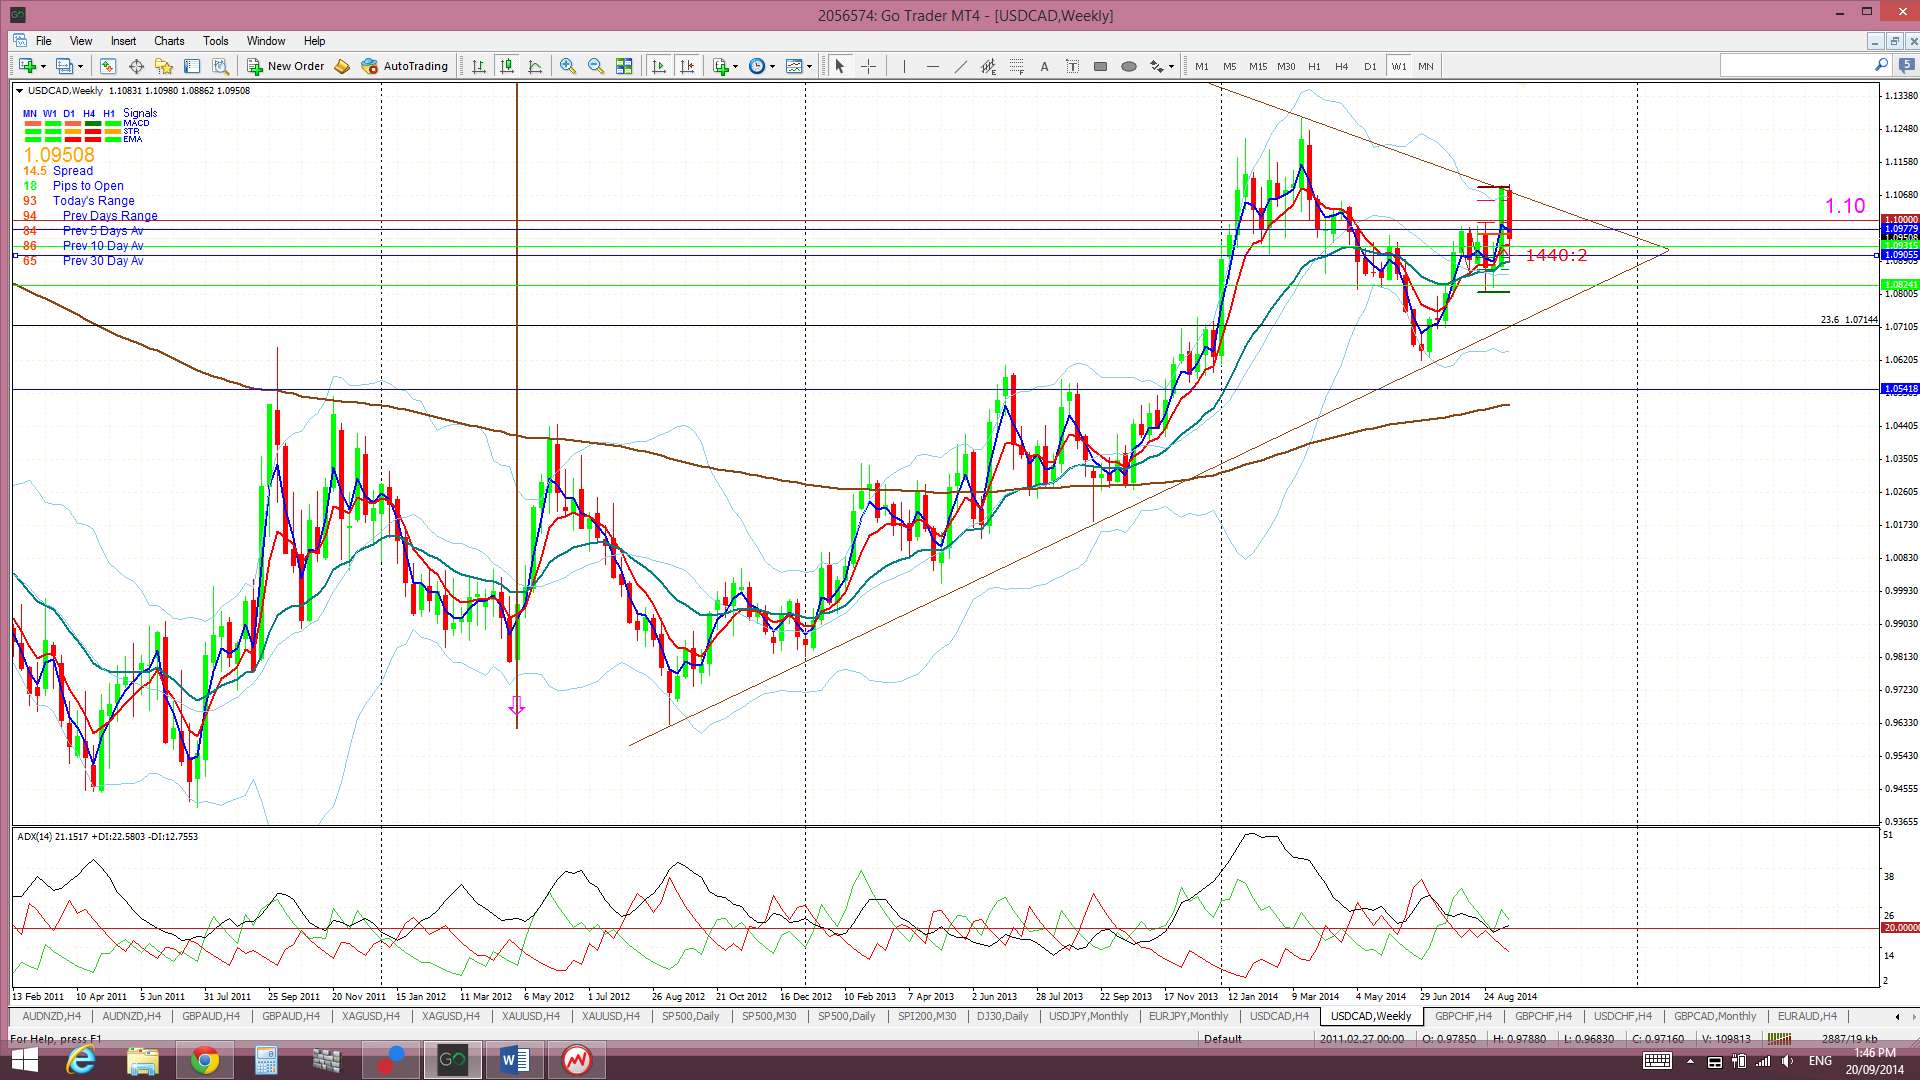
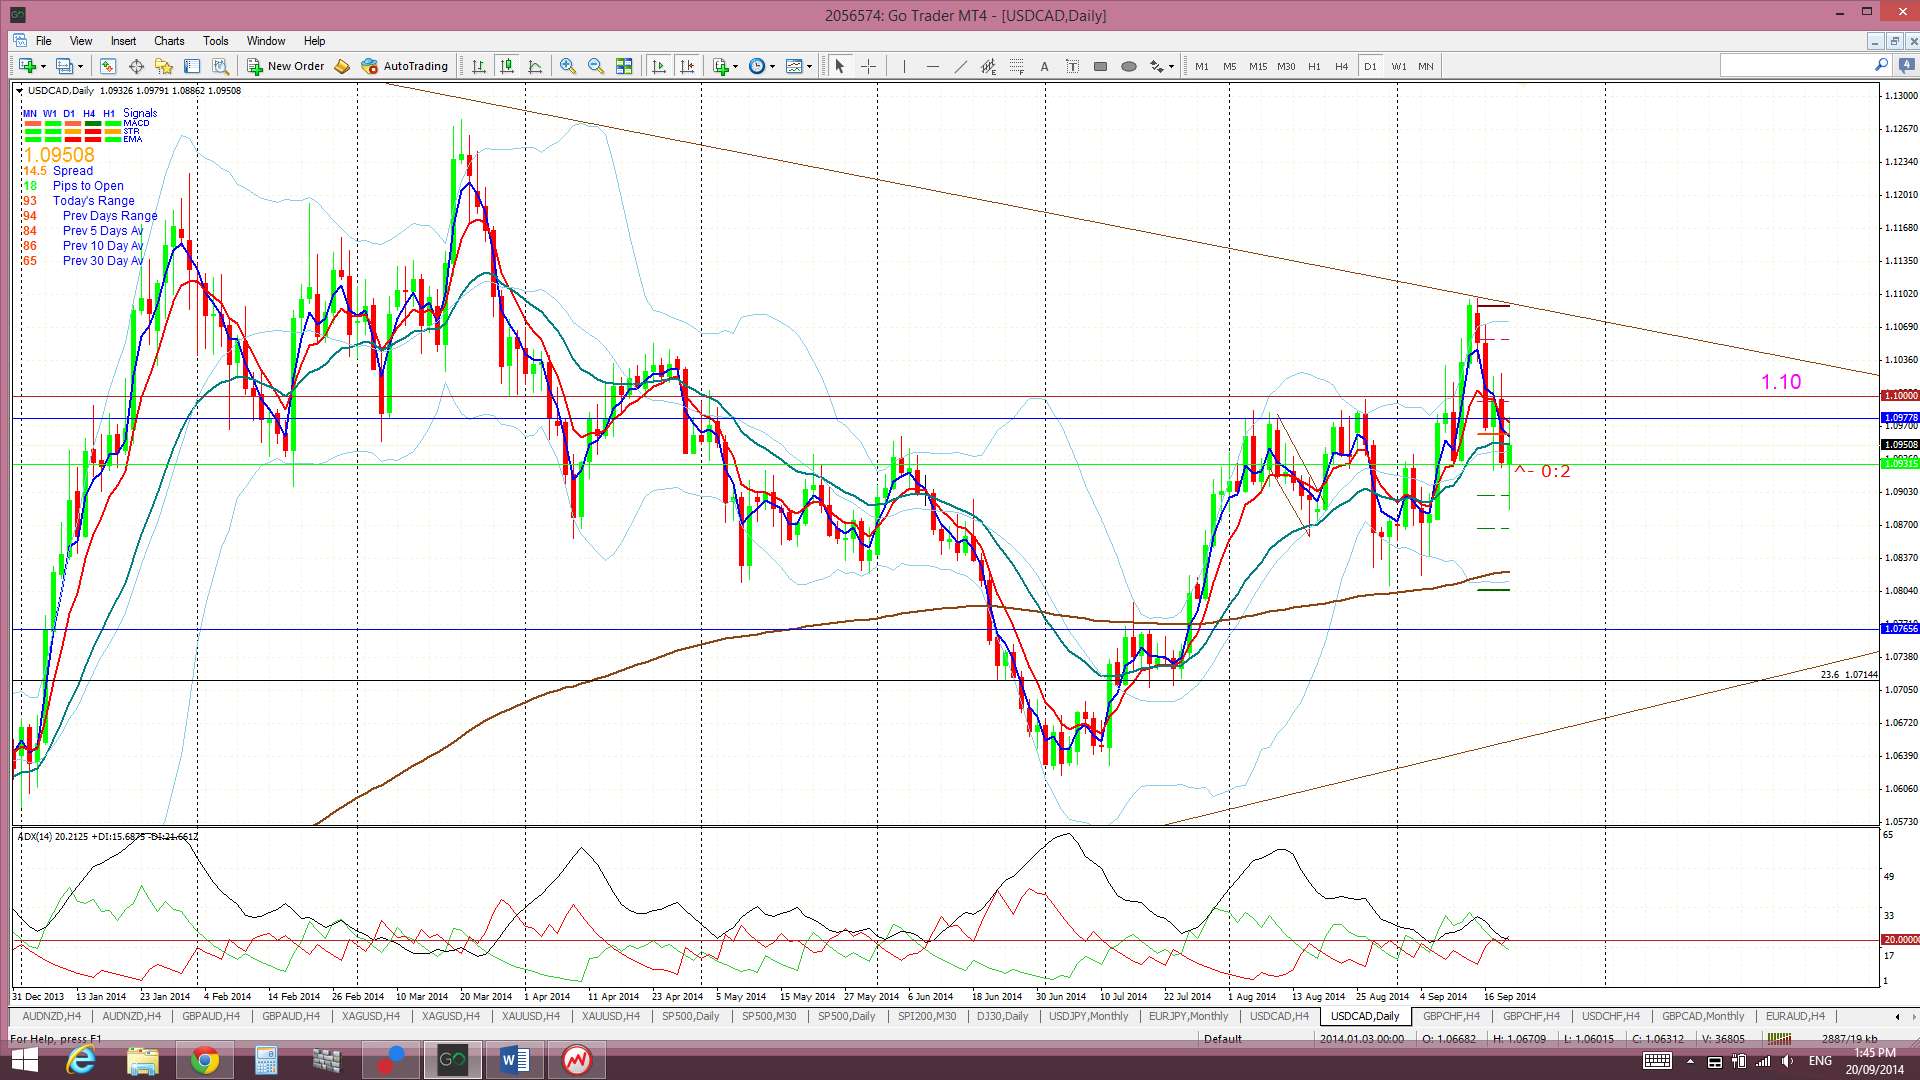
USD/CAD: The USD/CAD opened the week just under the monthly chart’s bear triangle trend line but soon retreated from this major technical high and fell back below the key 1.10 level as well. Mixed CAD data on Friday saw this pair remain choppy.
This pair continues edging closer towards the apex of a major monthly chart triangle pattern that could deliver up to 2,500 pips in any breakout move.
Triangle breakout target: There is a 2,500 pip triangle breakout move brewing on the monthly chart. This 2,500 pip figure is evaluated from the height of the triangle. I have used the triangle height from the beginning of the bull trend line, as shown in the monthly chart below. The height of the triangle is around 2,500 pips and, thus, this would be the expected move from any breakout action. This is where it gets interesting! Extrapolating a bullish move from this triangle places price up at the 61.8% fib level. These fibs levels are popular targets in retracement moves and so this adds some confluence to this as a possible target. The bear trend line of the triangle pattern is now just above current price BUT has been in play since 2001 so may offer some resistance to any potential bullish continuation.
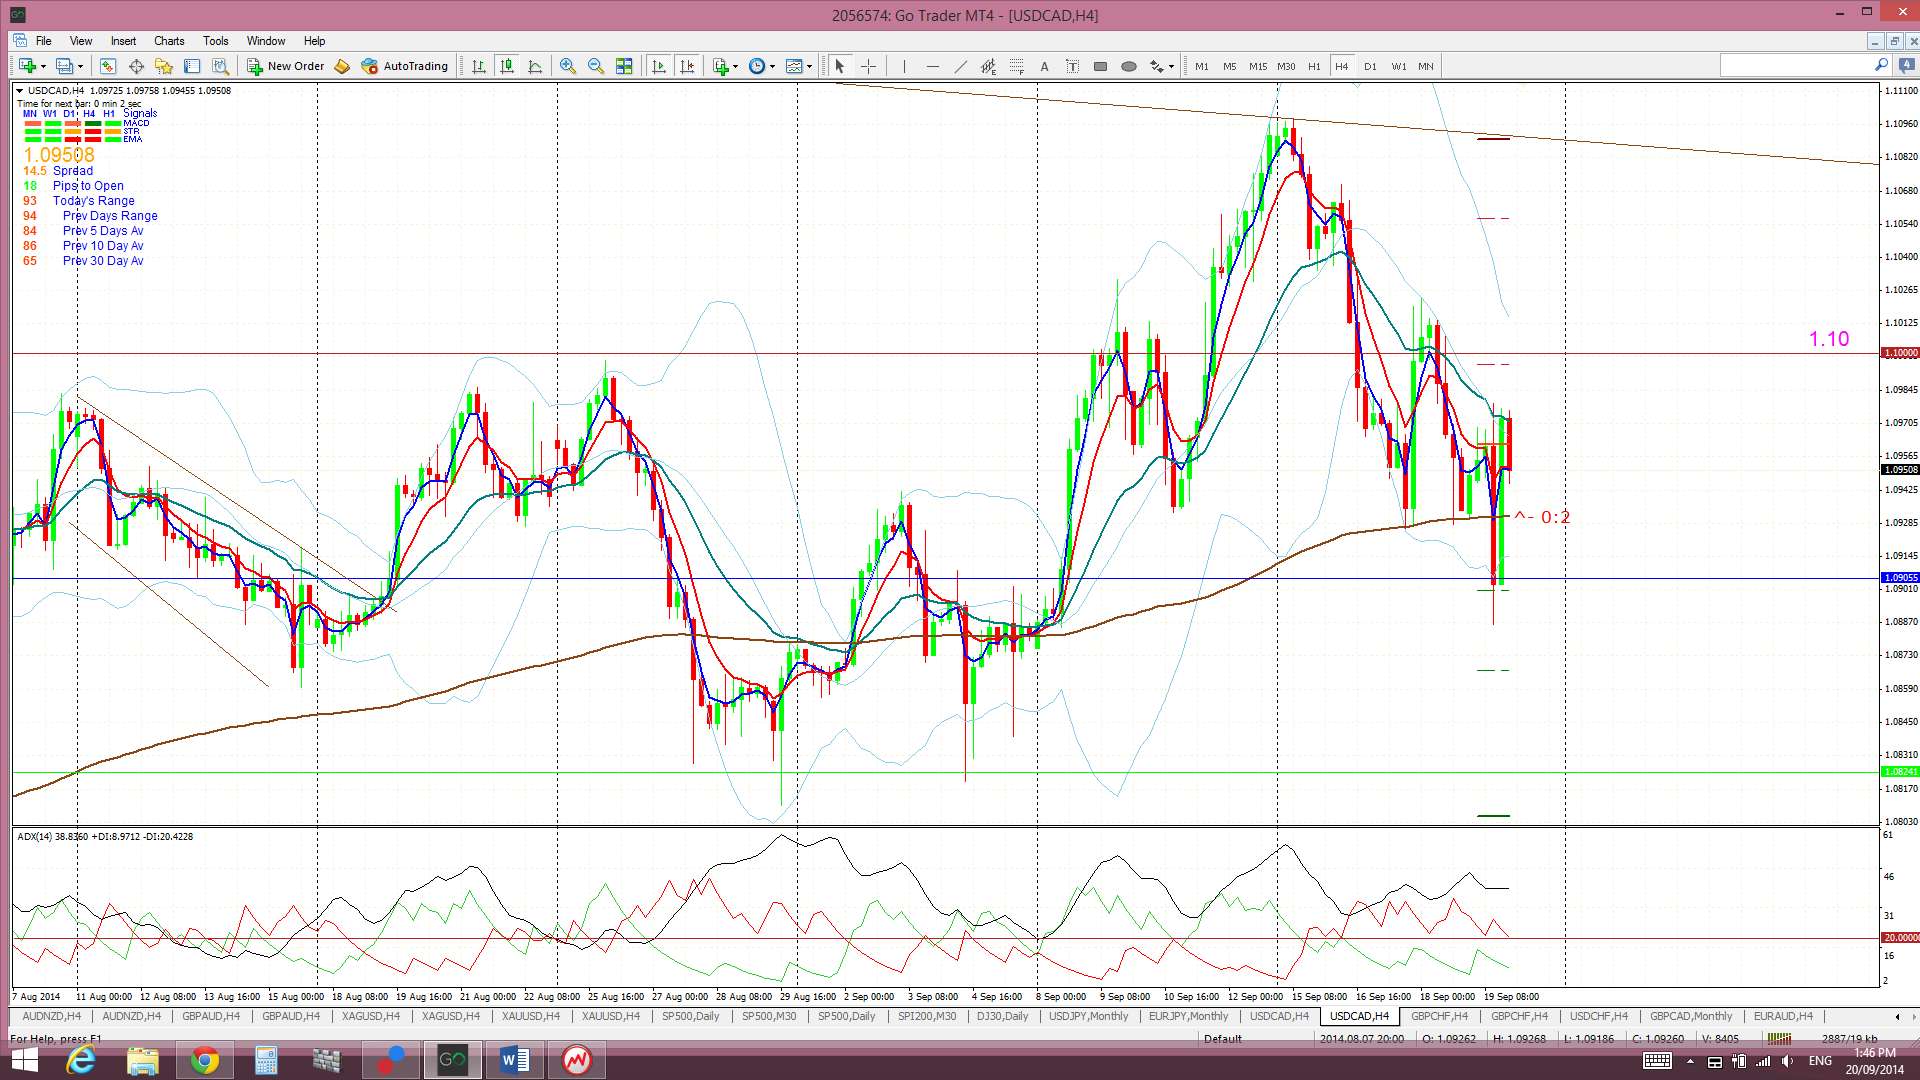
Price is now trading below the Cloud on the 4hr chart and above on the daily charts which suggest more choppiness.
The weekly candle closed as a bearish coloured ‘inside’ candle reflecting this indecision.
- I’m watching for any new TC signal, the 1.10 level and the monthly chart’s triangle pattern.

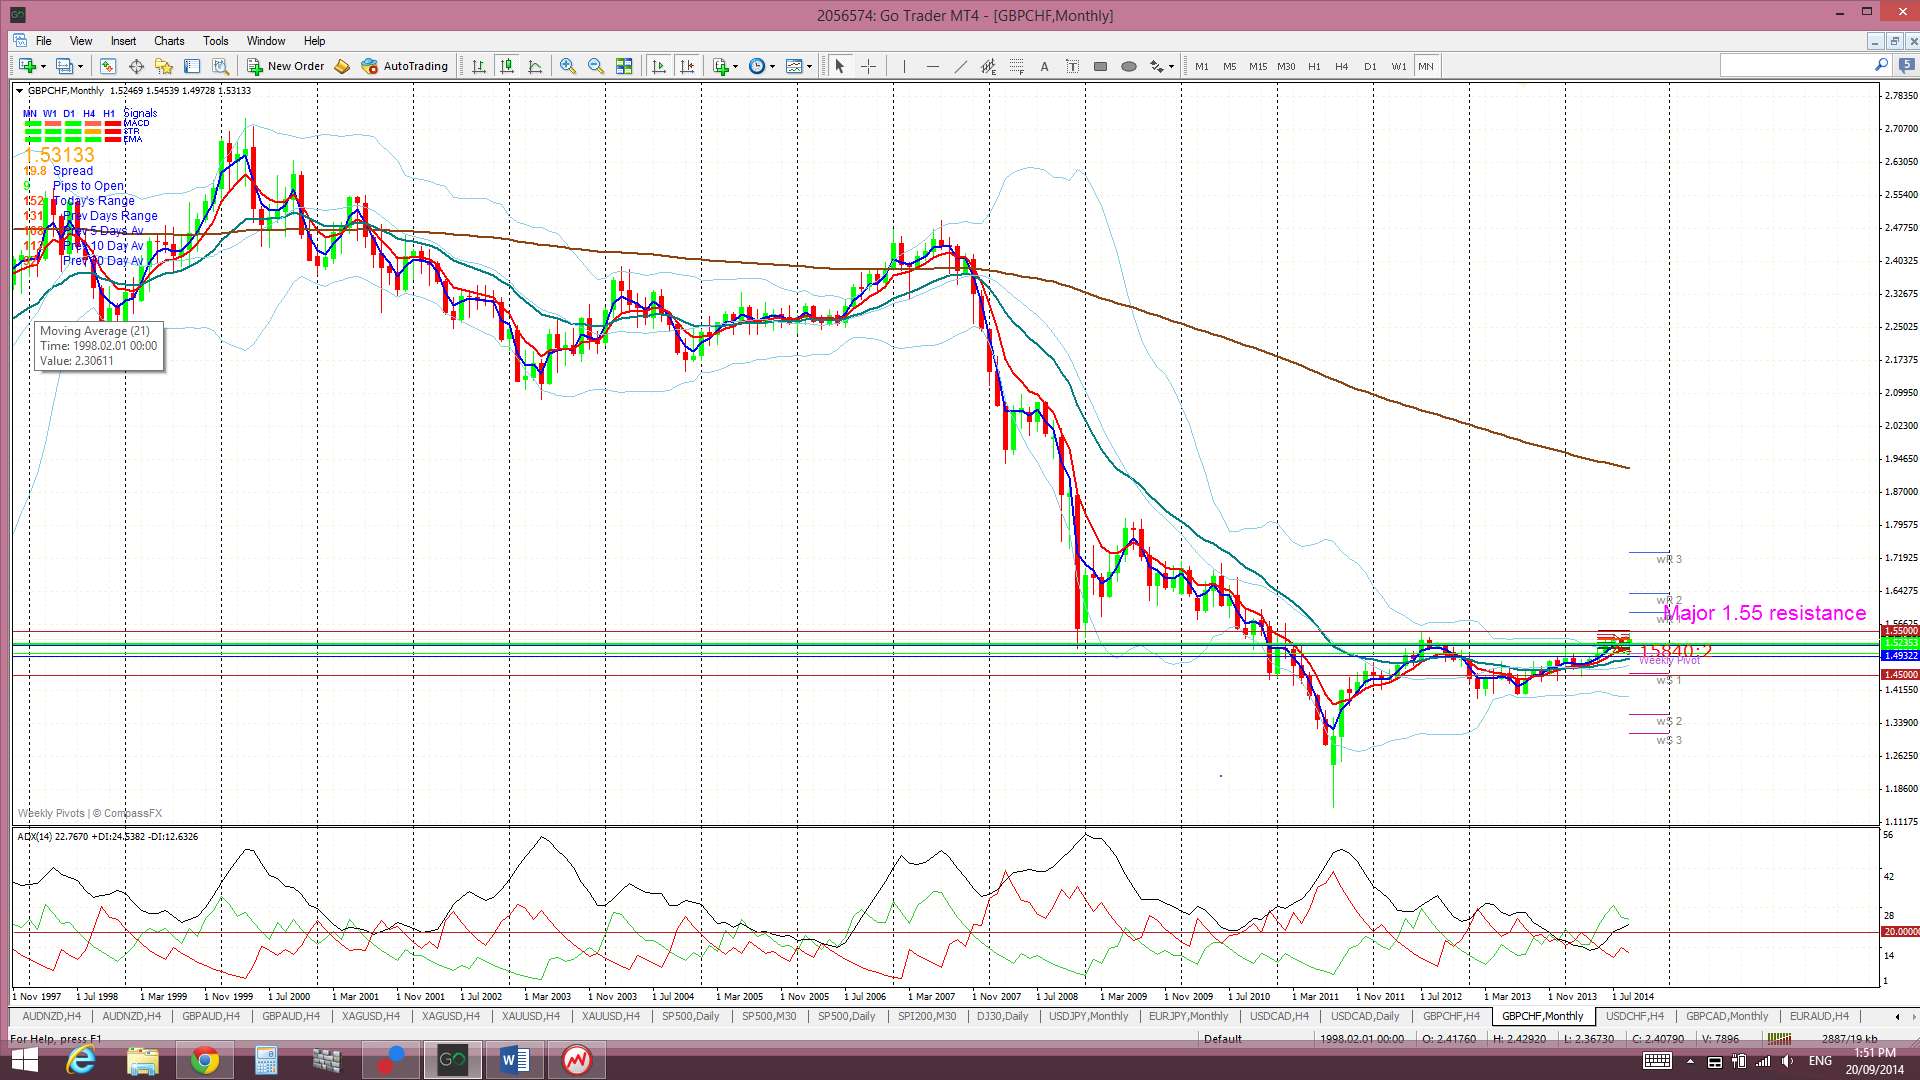
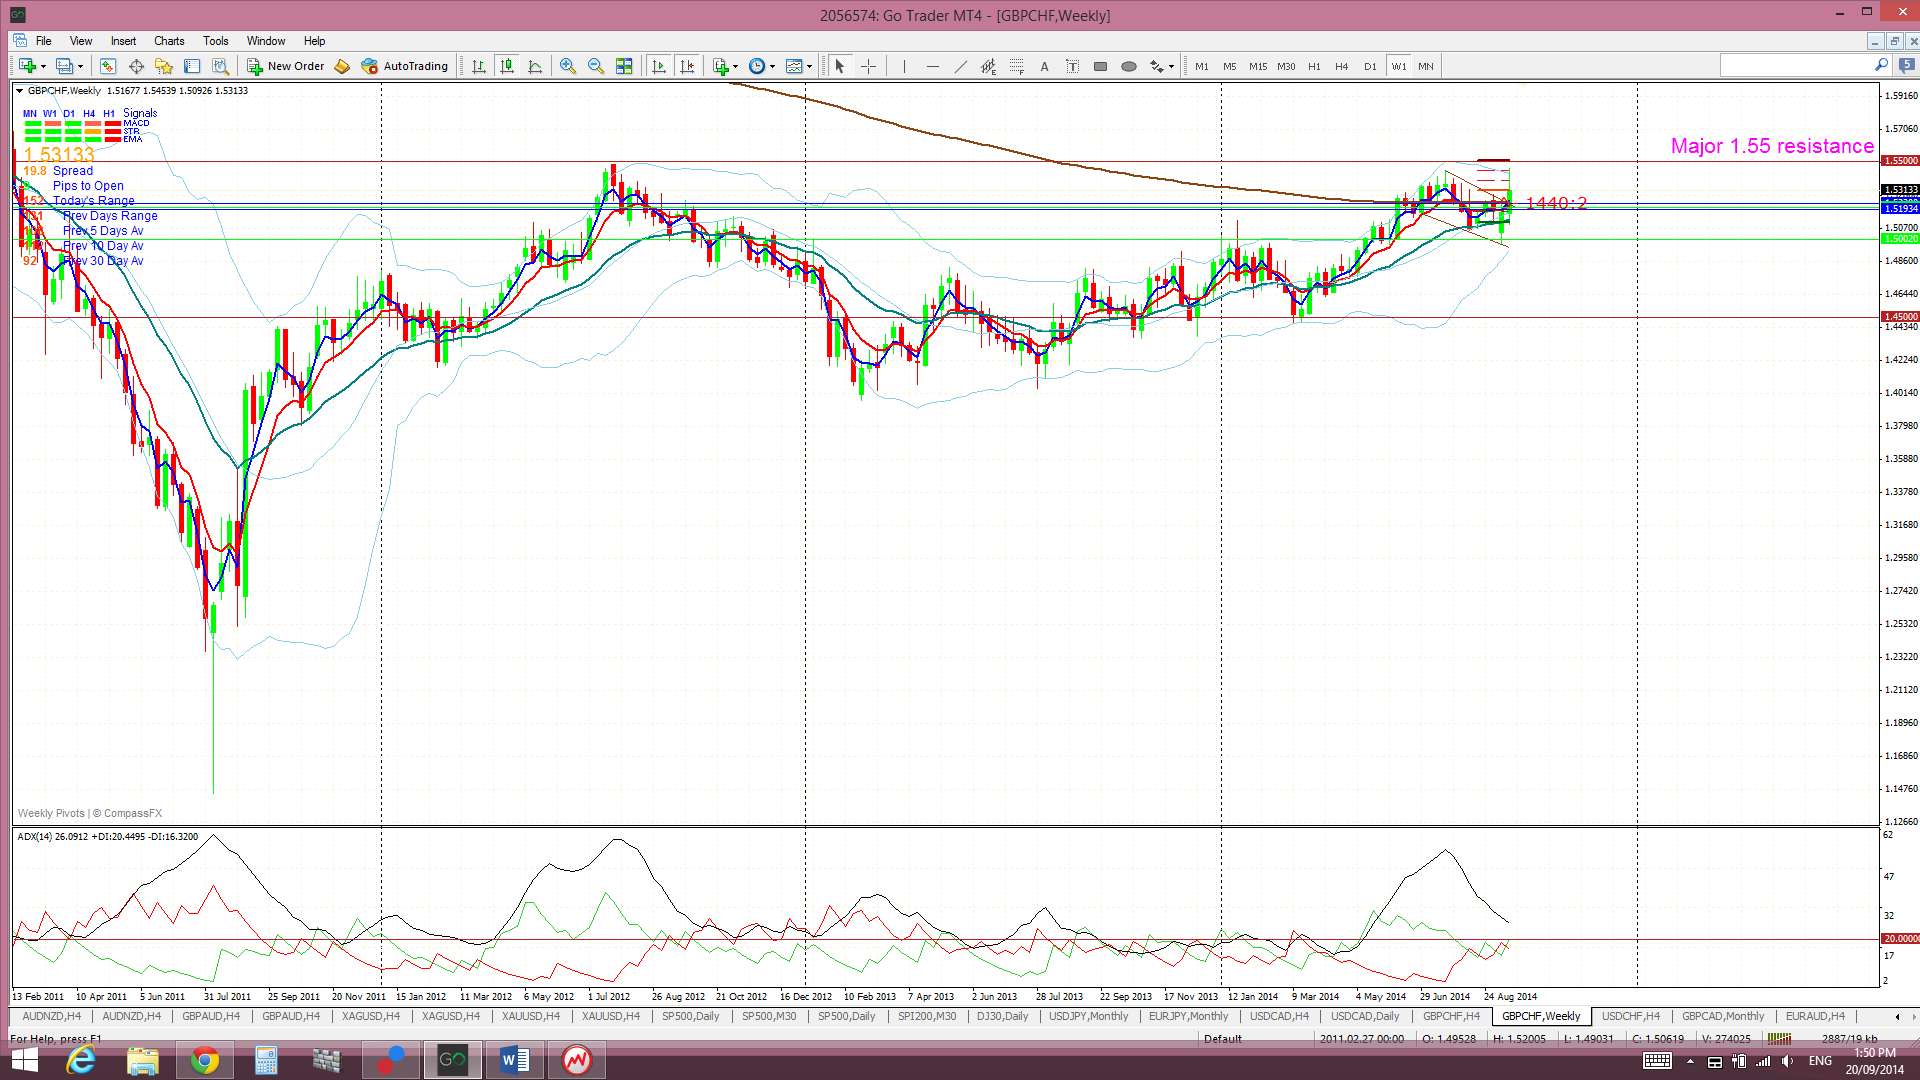
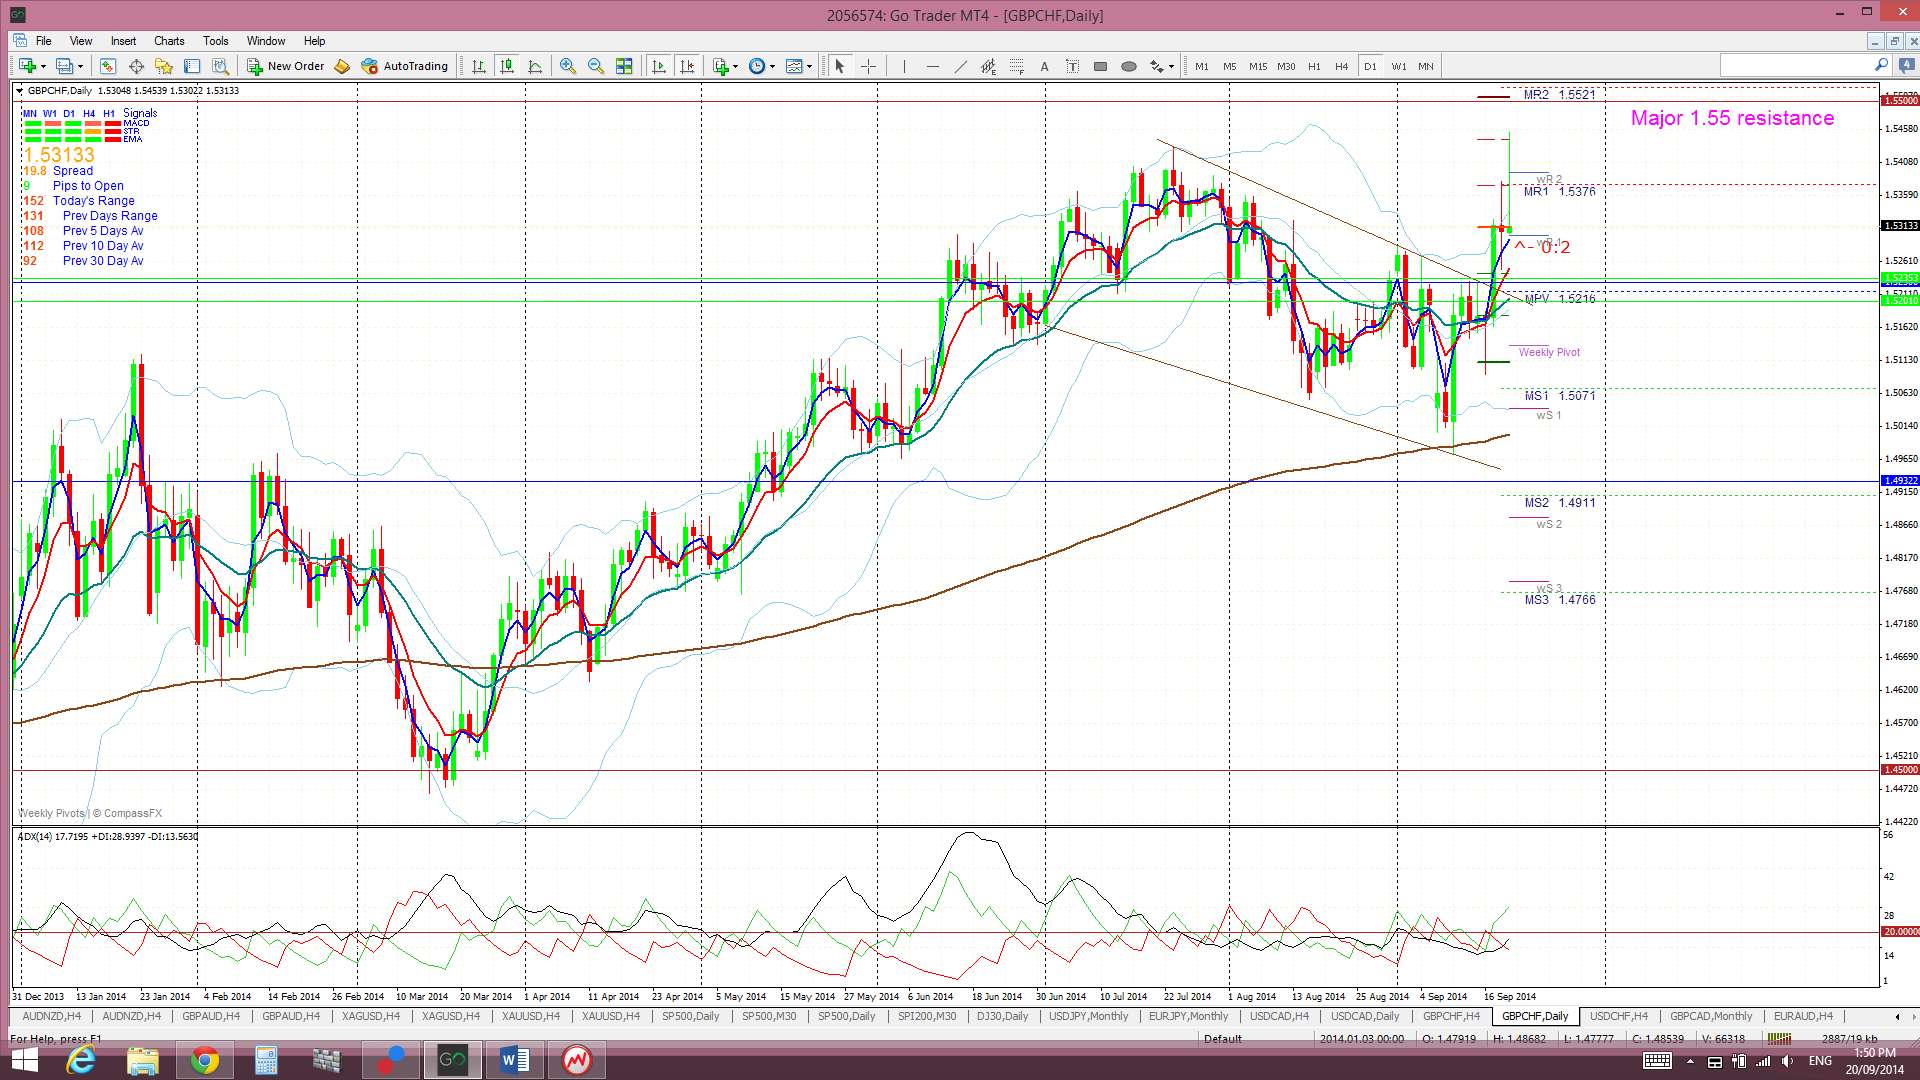
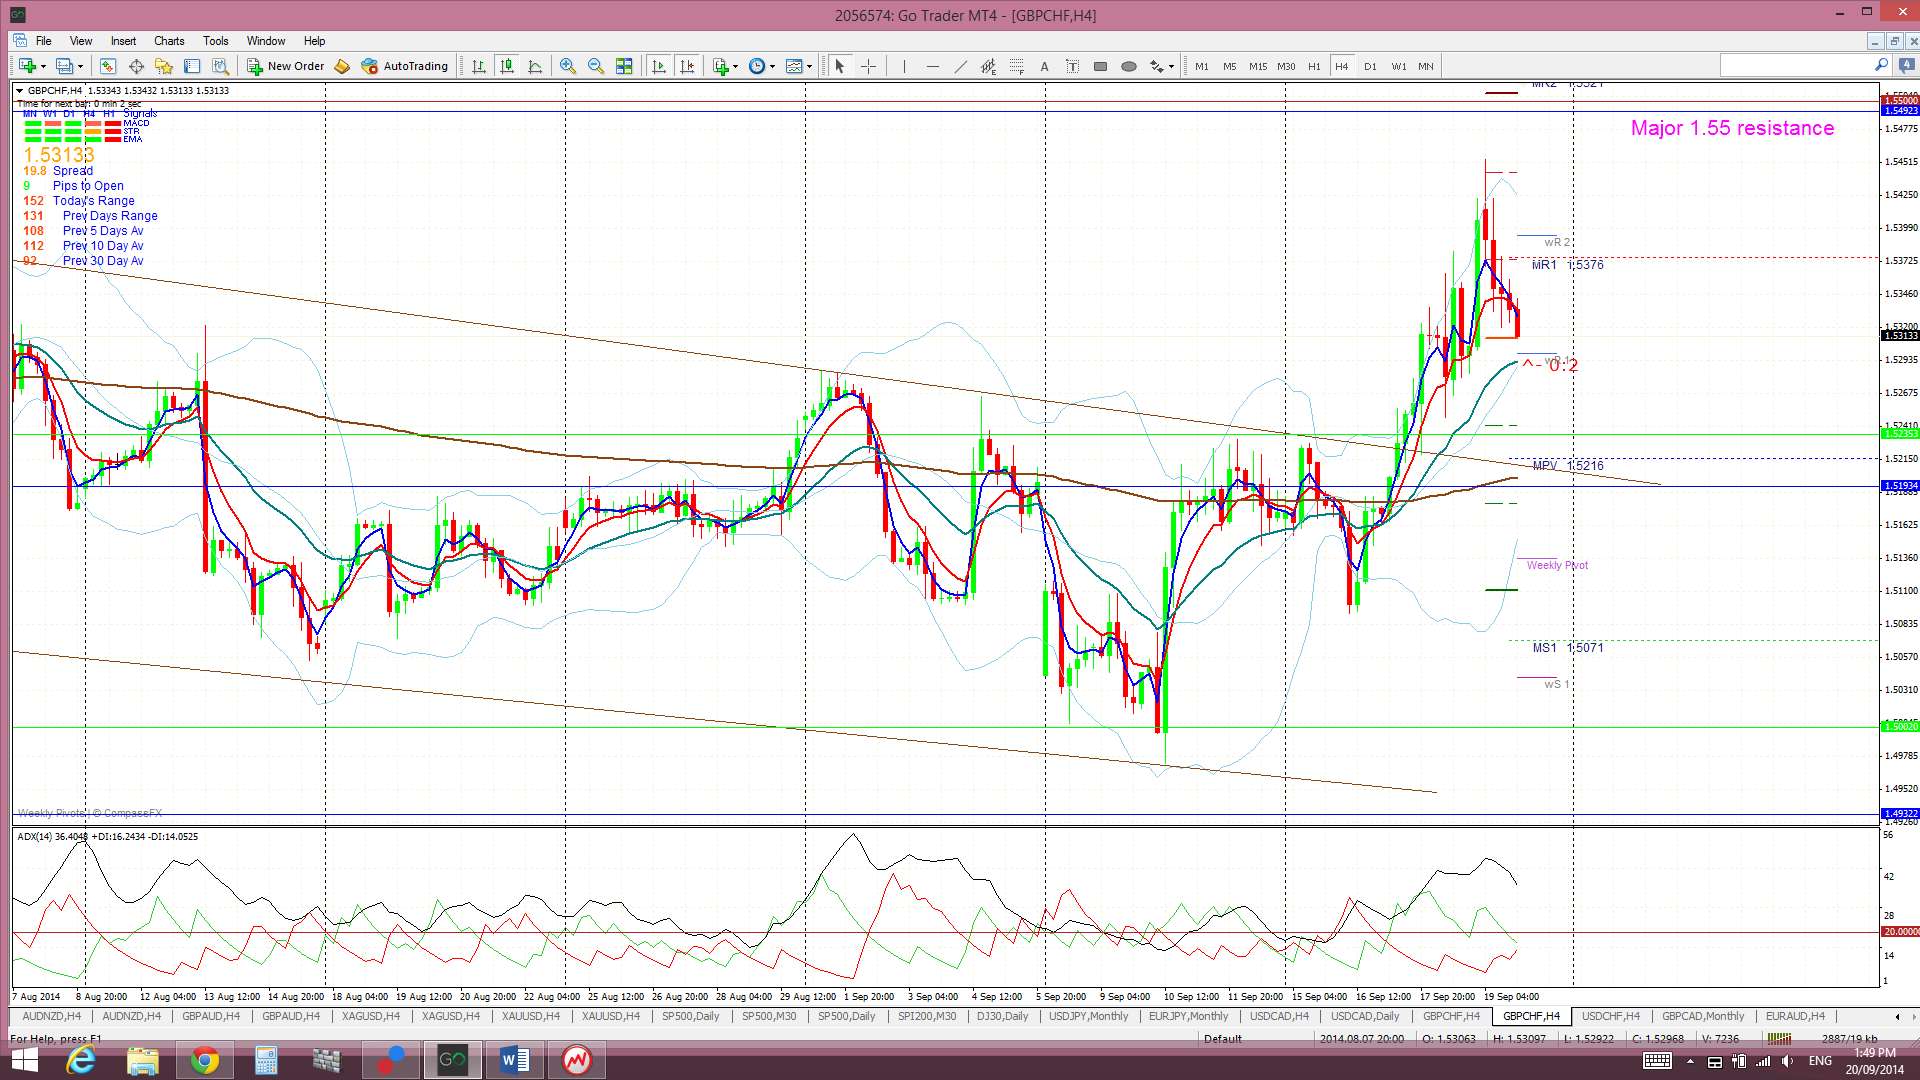
GBP/CHF: The GBP/CHF broke up and out from the daily chart’s Flag pattern last week and this move triggered a new TC signal but it wasn’t valid. This was a pity as the signal went on to deliver up to 220 pips! Price continues chopping back up towards the key 1.55 resistance level and peaked up near there during last week.
The GBP/CHF is now trading just above the 4hr and daily Cloud which is bullish.
I would be expecting price action to become increasing choppy if it nears the 1.55 region as this has been a major S/R level over recent years. Thus, this level would not be given up easily and without some fight. Any close and hold above the 1.55 would be expected to test this level a number of times.
The weekly candle closed as a bullish candle.
- I’m watching for any new TC signal and the 1.55 level.
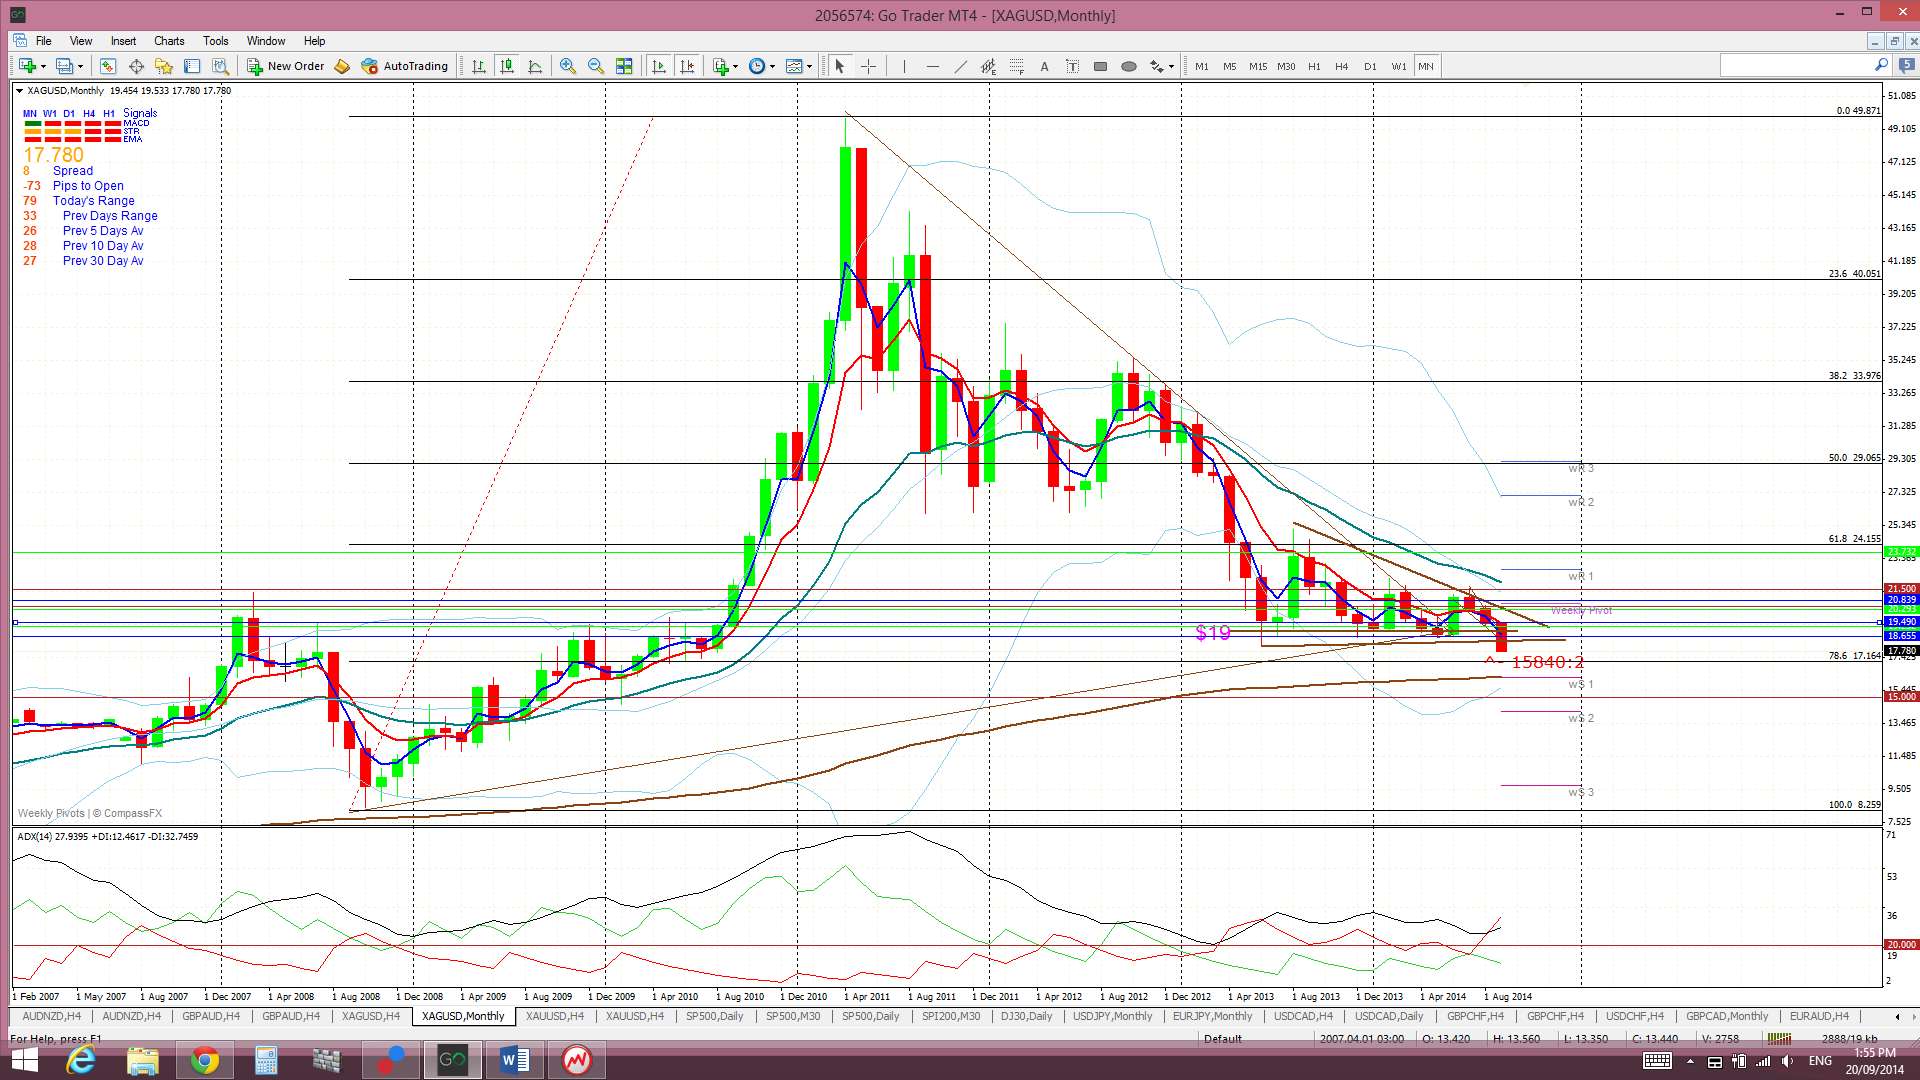
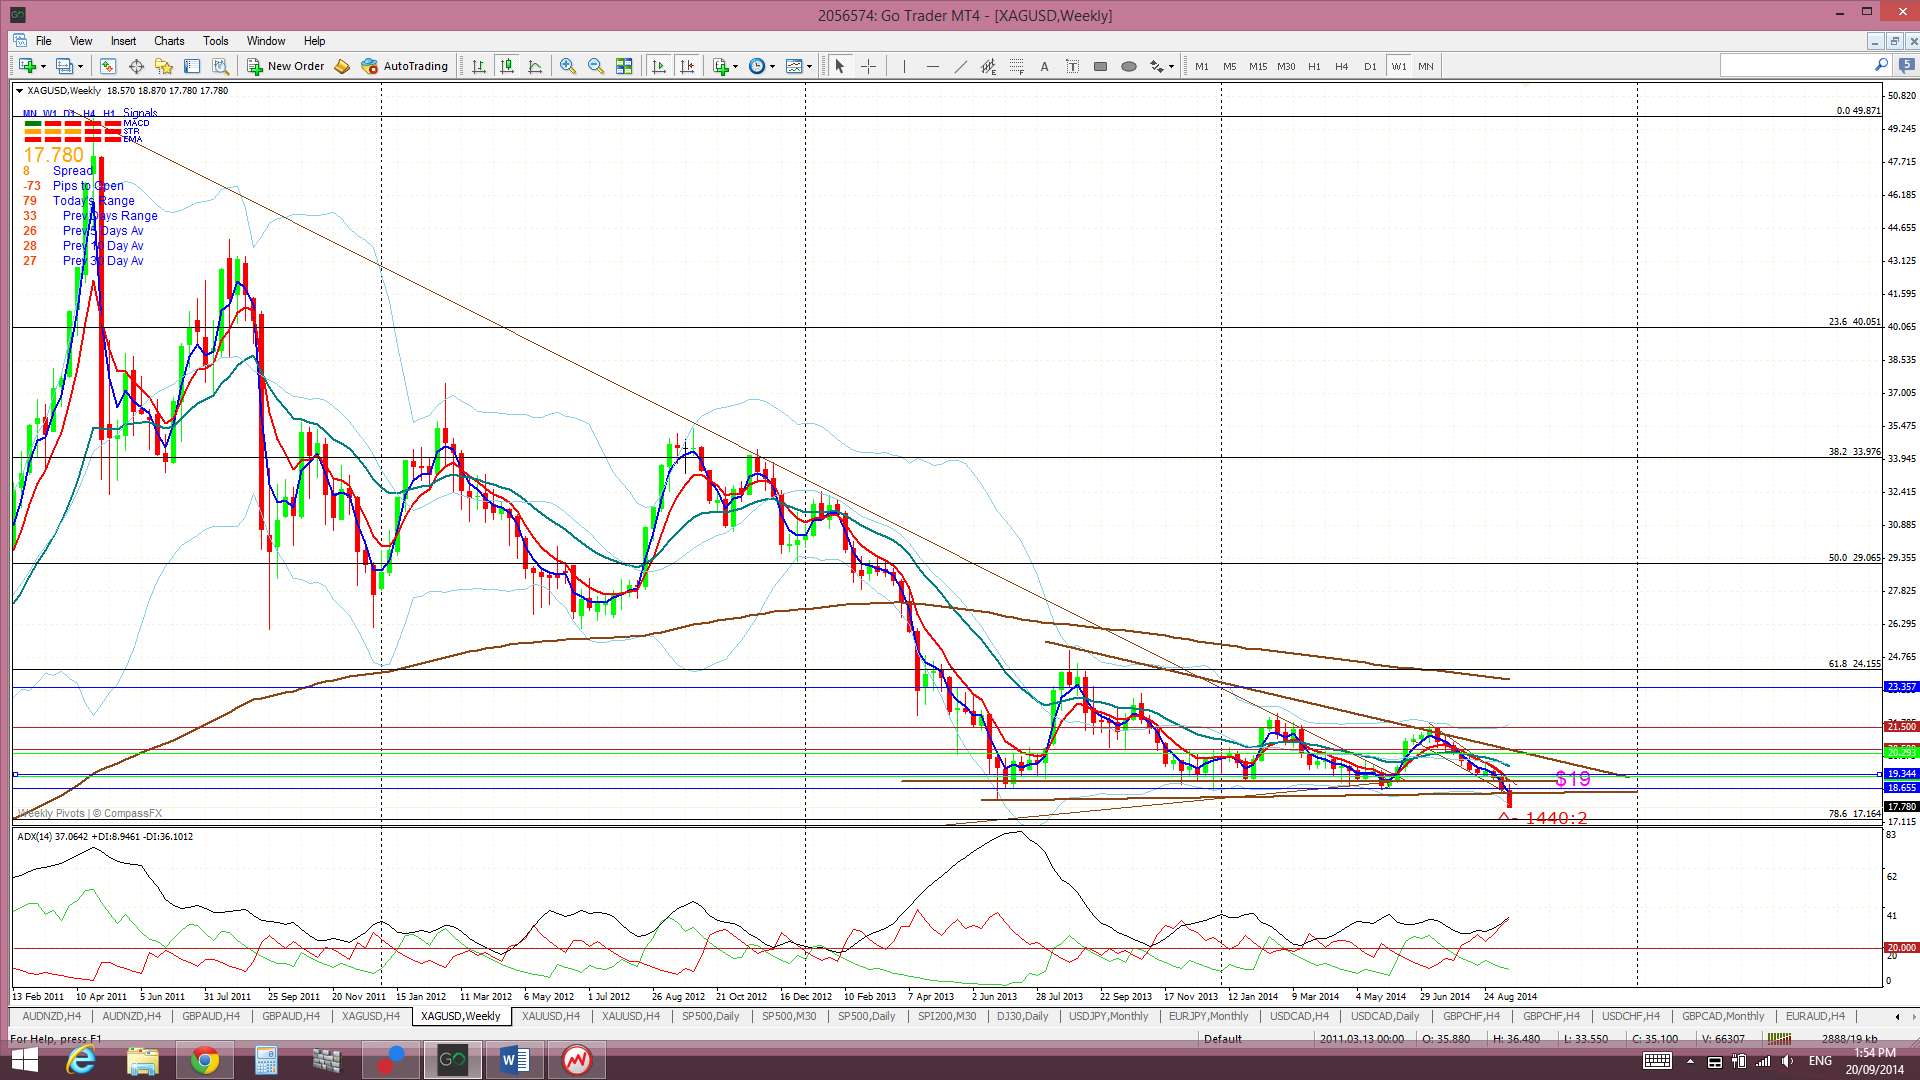
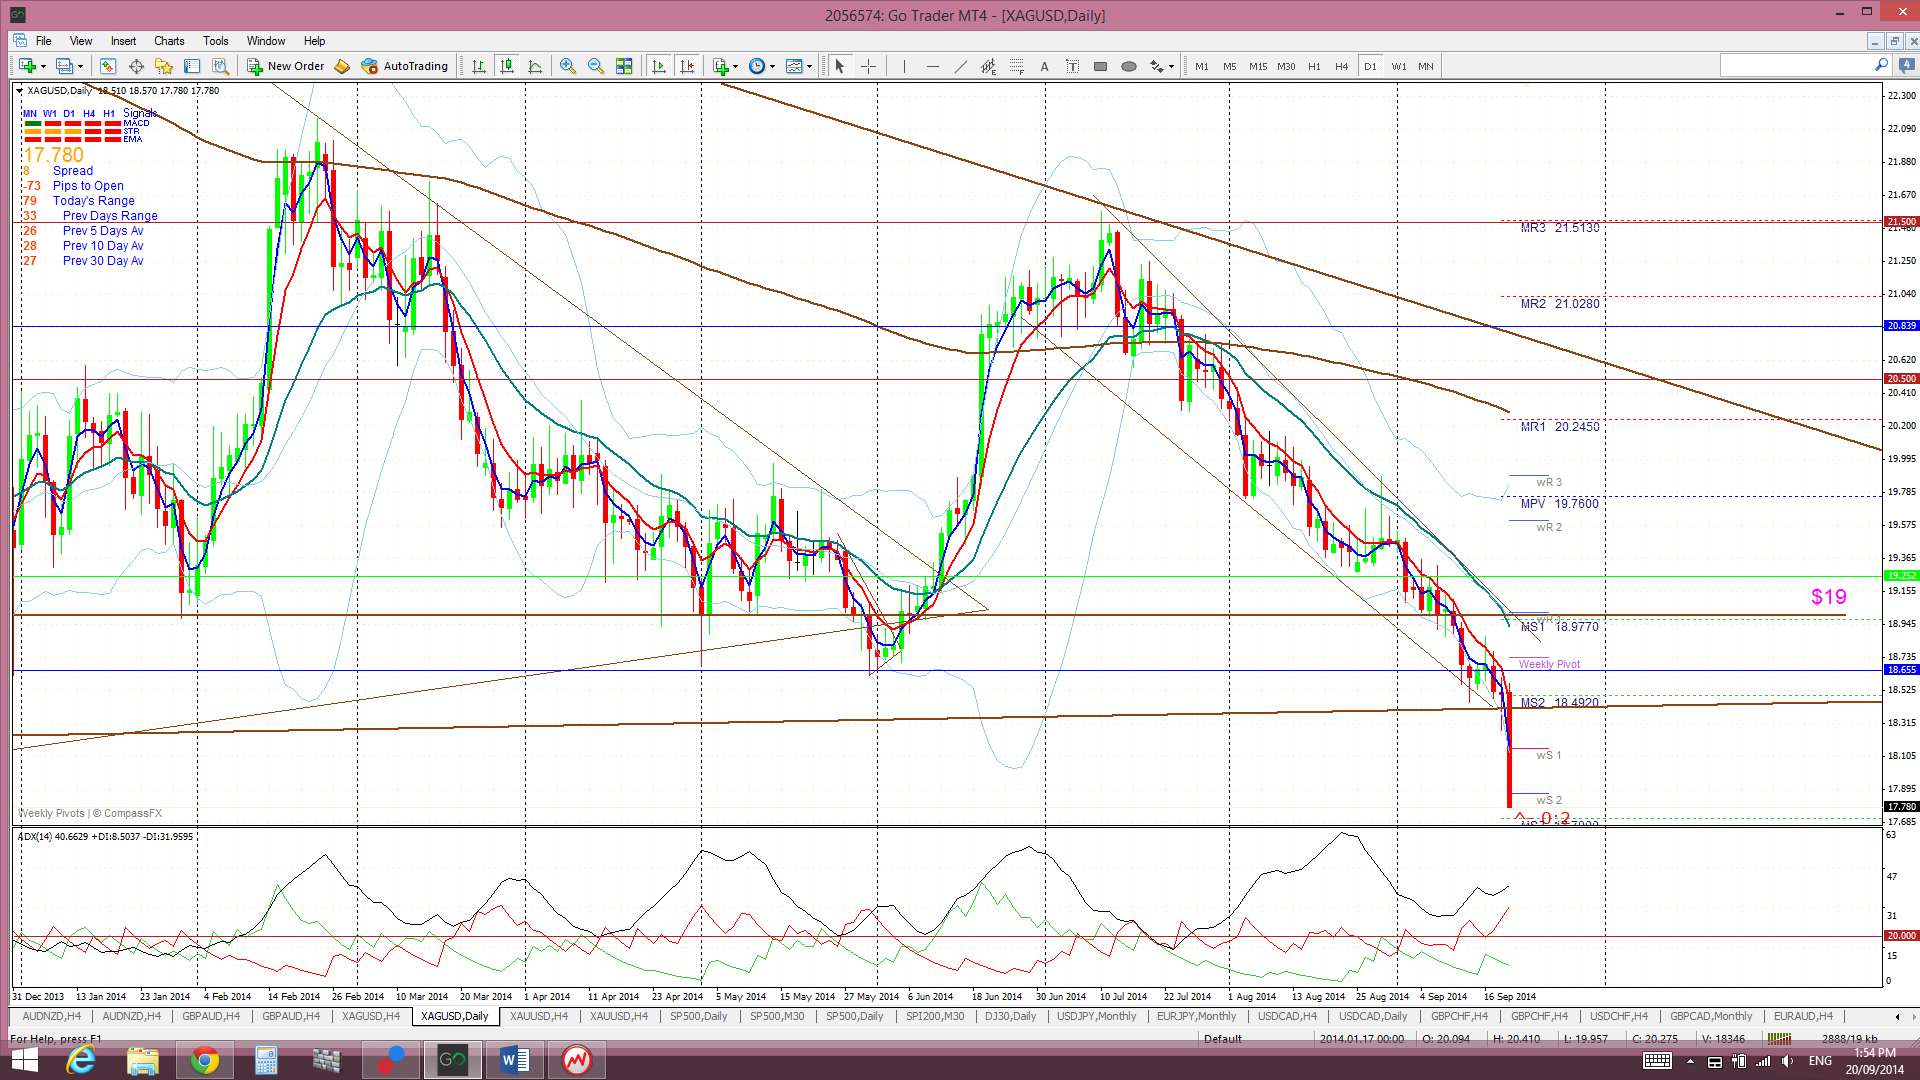
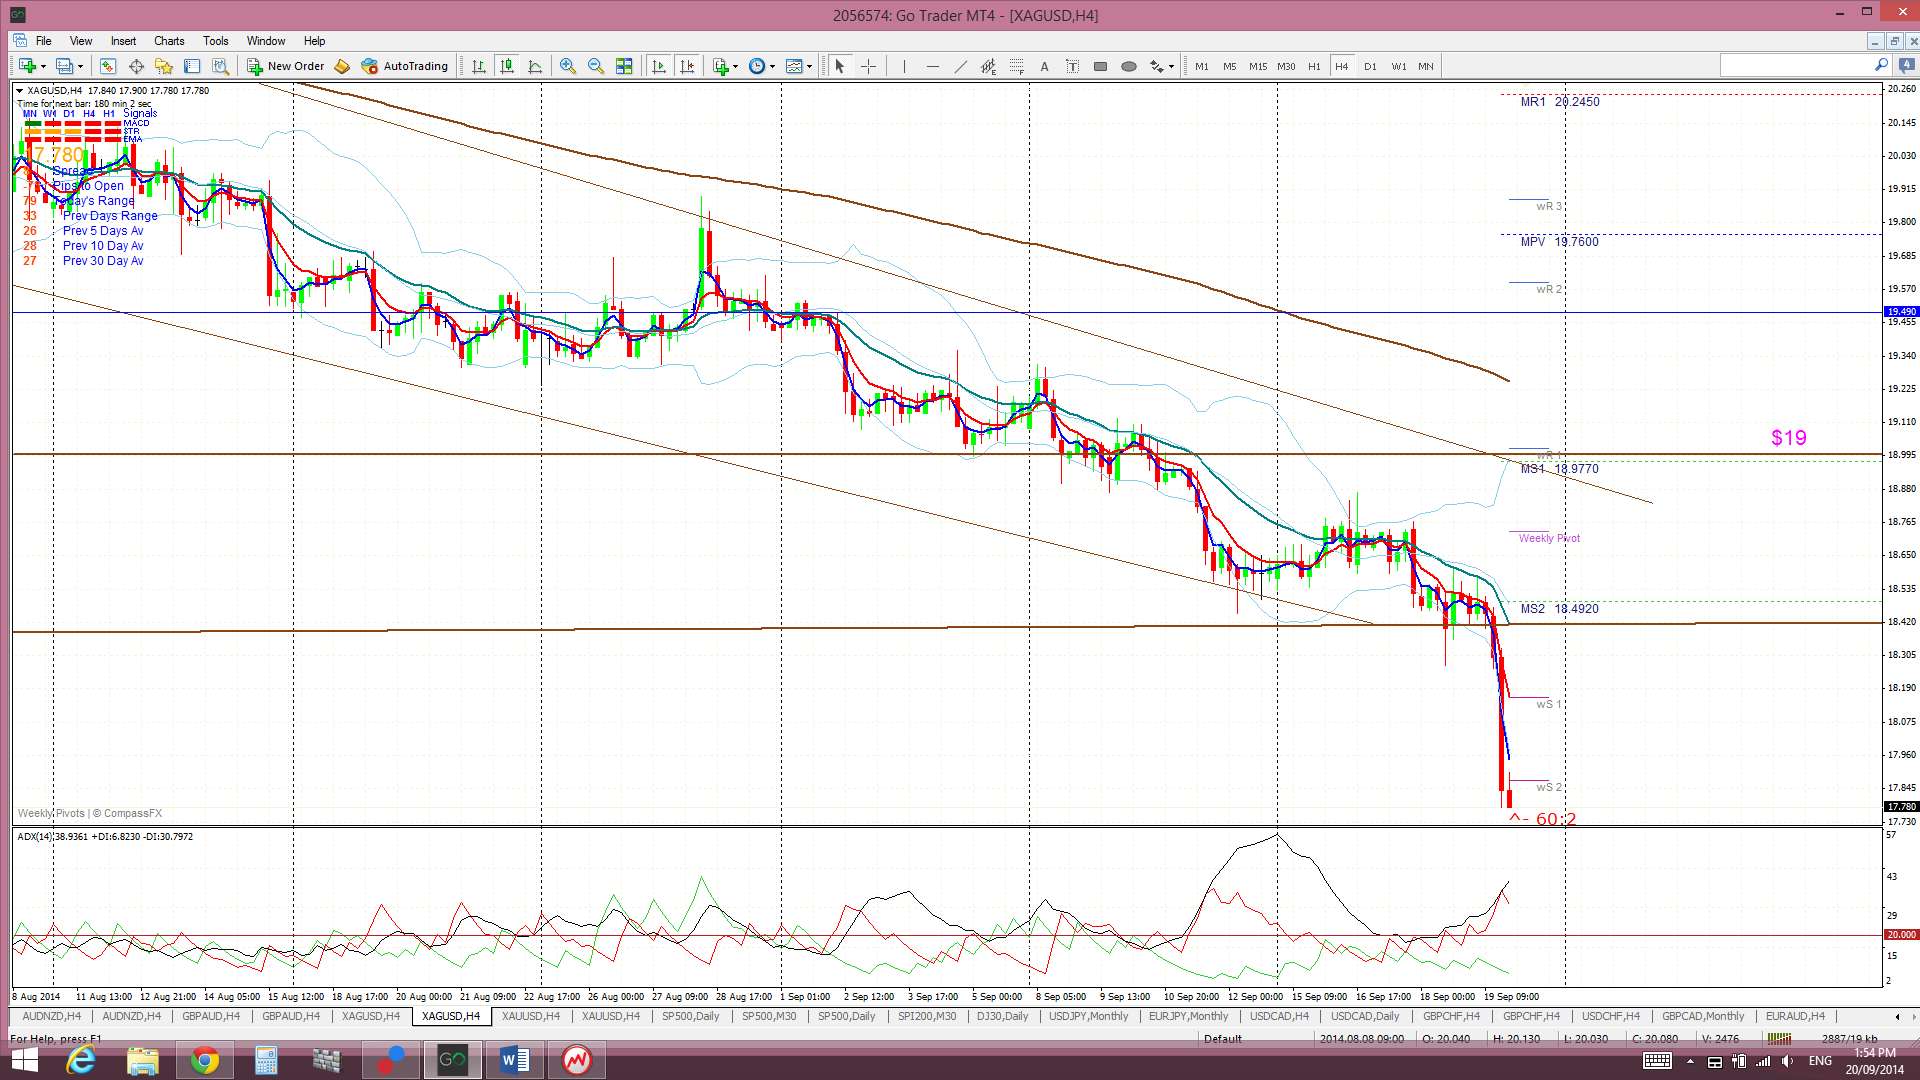
Silver: Silver chopped sideways for much of last week and above a weekly chart triangle support trend line. This struggle seemed to parallel the one that the USD was facing at its major resistance.  Silver suffered heavy losses on Friday though and broke down below the triangle trend line support and also down from within the trading channel.
Th monthly chart shows the support levels below current price:
- the 78.6% fib near $17.
- the monthly 200 EMA near $16
- The $15 level: a previous S/R level.
Silver is still trading below the Ichimoku Cloud on the 4hr chart daily, weekly and monthly charts which is bearish.
The weekly candle closed as a bearish candle.
- I’m watching for any new TC signal and the $15 level.
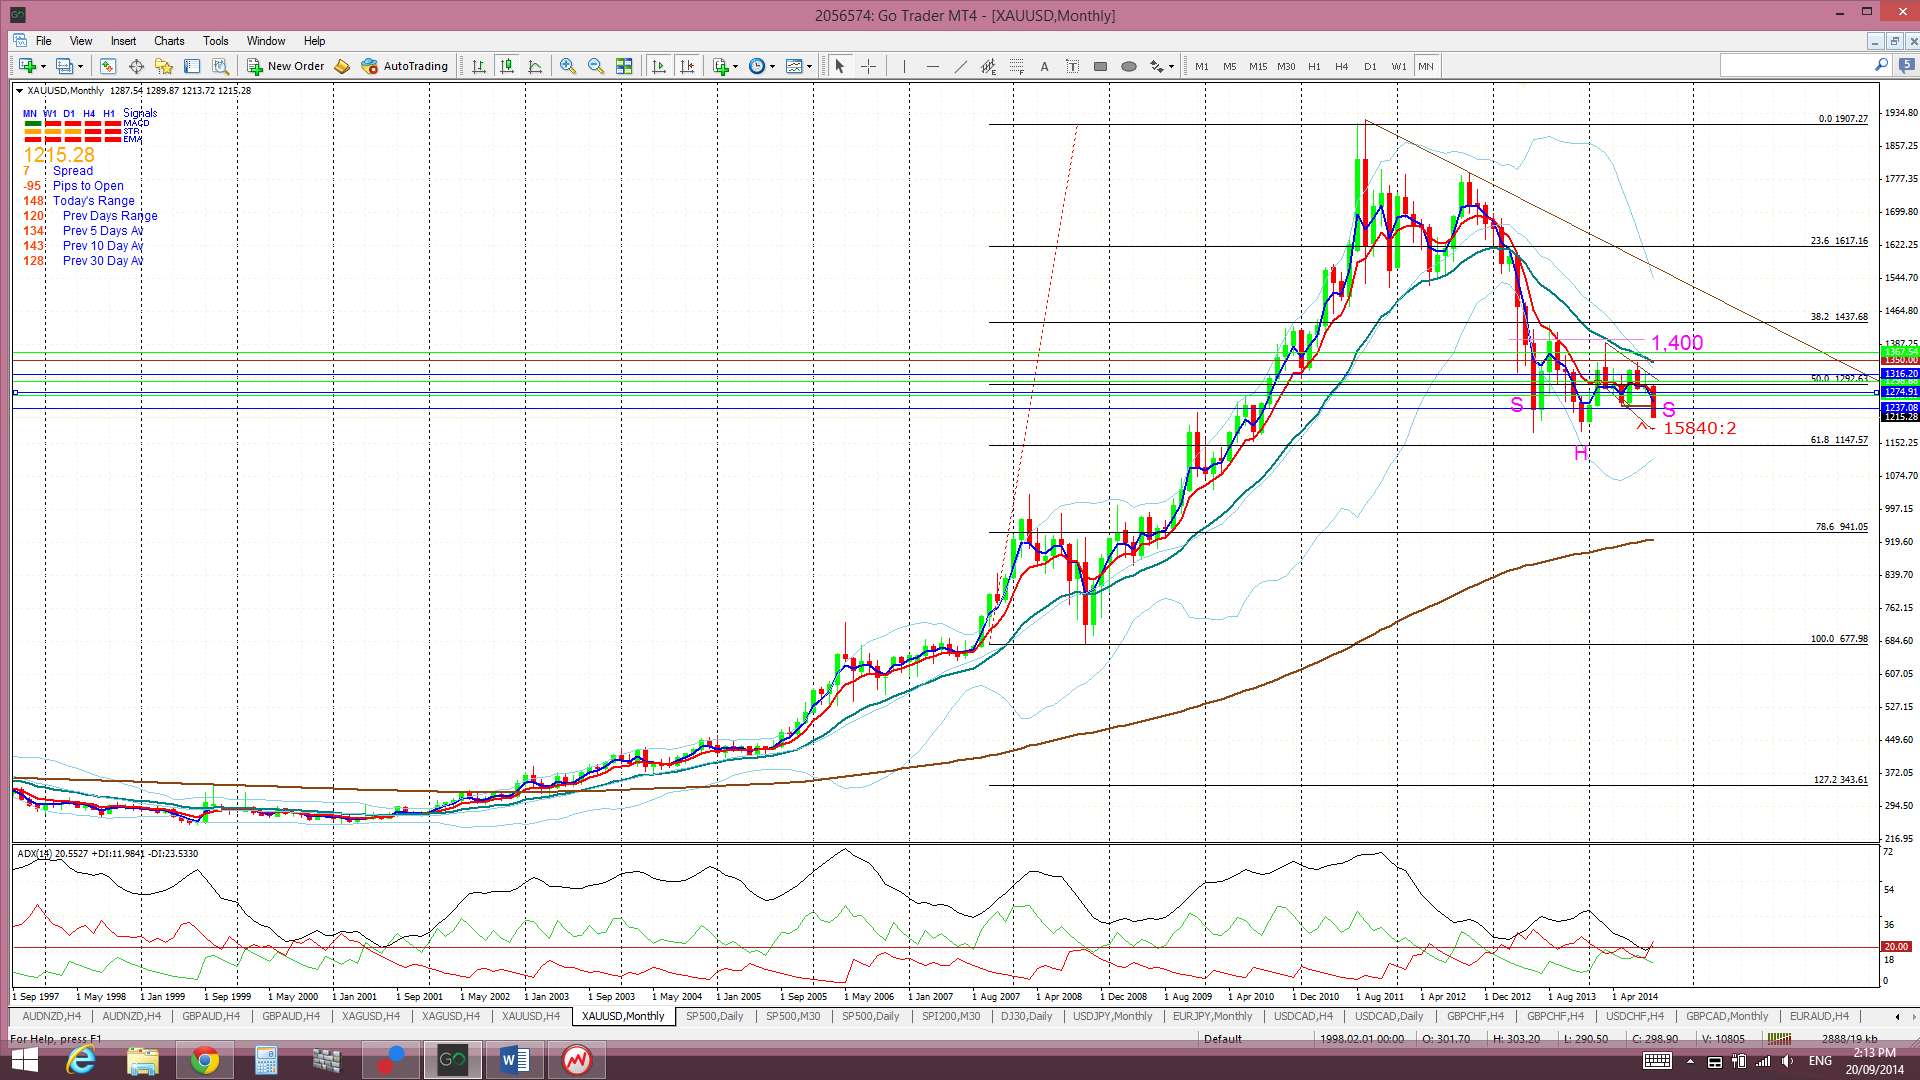
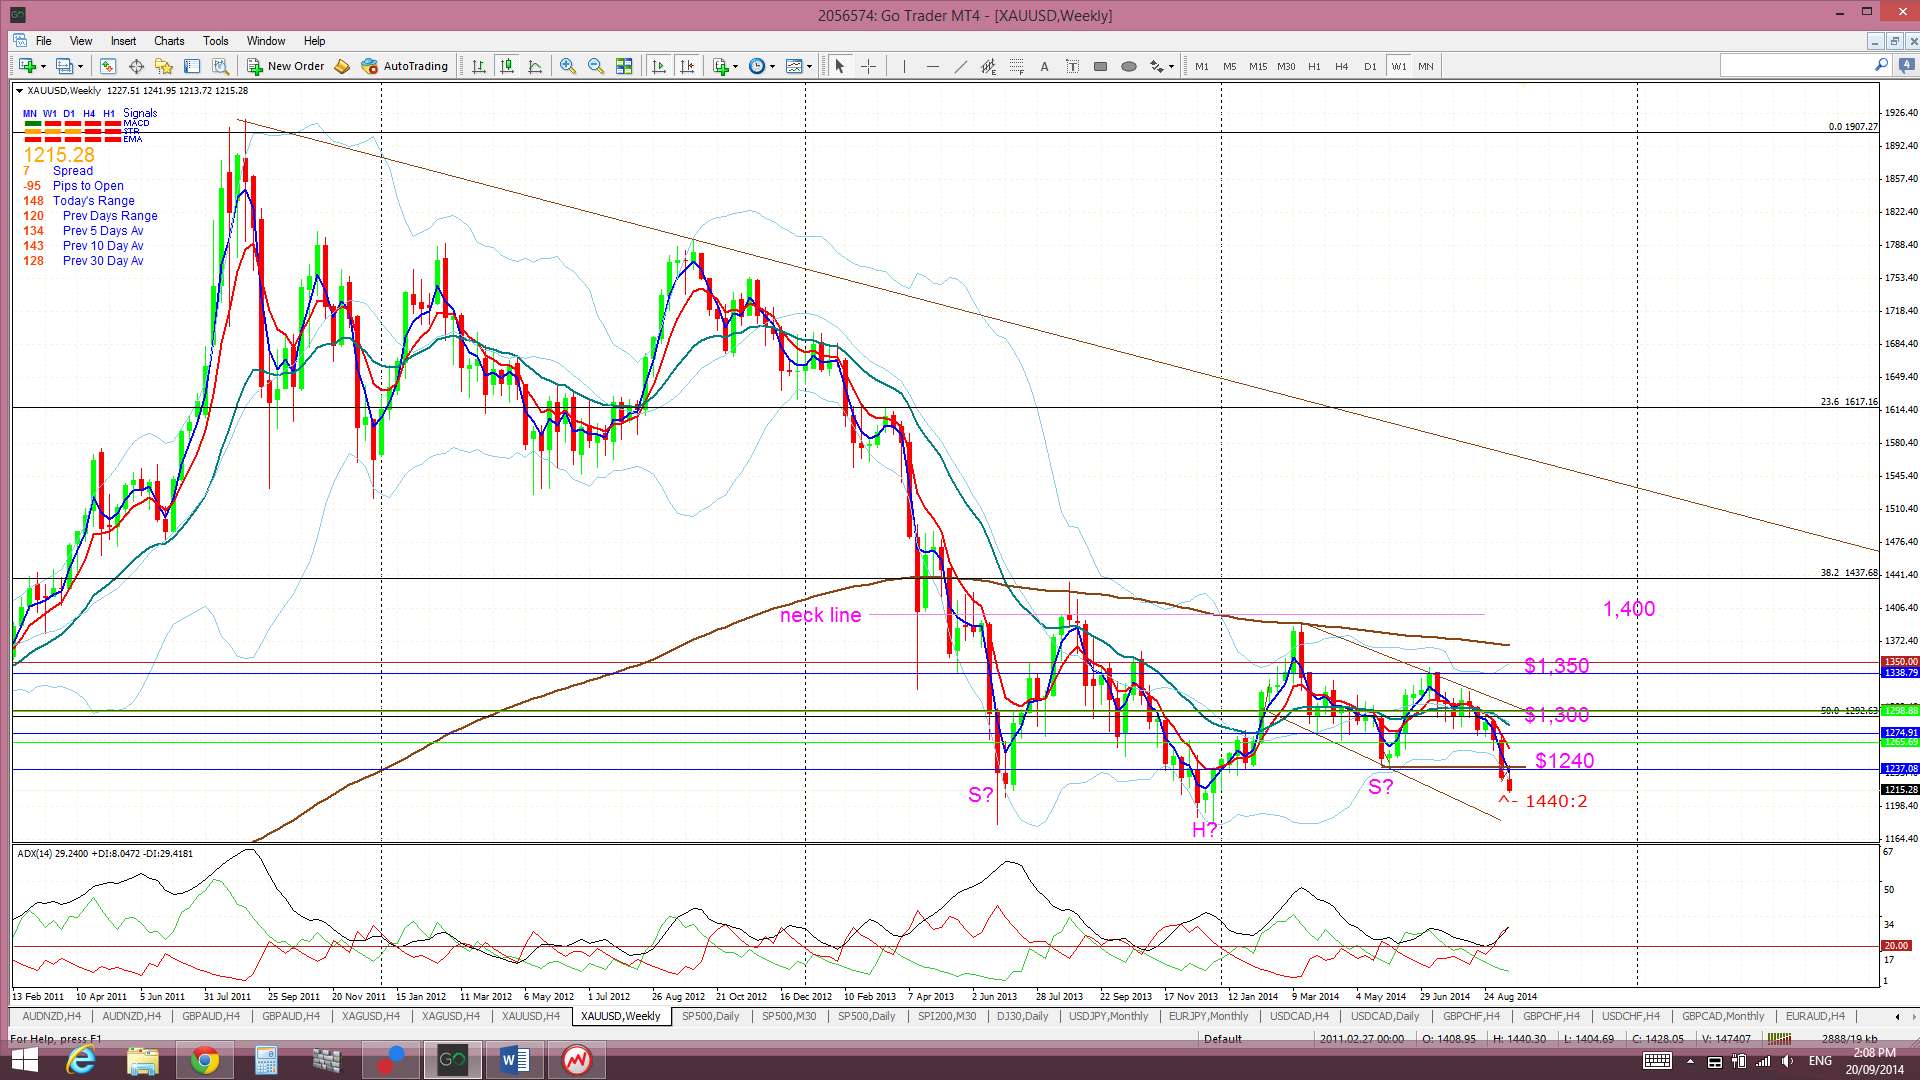
Gold: Gold chopped lower last week as it traded under the $1,240 support level. It broke down from the 4 hr chart’s triangle pattern in a move that gave almost $20.
I am still seeing a possible bullish ‘inverse H&S’ on the monthly/weekly charts though. This would probably depend on which way the USD index heads next though as it is currently trading under major resistance. Gold traders should keep an eye on the USDX.
Gold is still trading below the Ichimoku Cloud on the 4hr, daily, weekly and monthly charts which is bearish.
The weekly candle closed as a bearish candle.
- I’m watching for any new TC signal on this pair.


The post USD still running the FX show: Trade Week Analysis 22/09/14 appeared first on www.forextell.com.