The USD/JPY is trading higher today and is pushing up towards a daily chart triangle trend line and may be about to try for a breakout. Any bullish continuation here may have the U/J complete its 2,400 pip Cup ‘n’ Handle pattern but another similar pattern, worth almost 5,000 pips, may be forming up here. I don’t expect that I’m the only one sitting back and assessing this whilst releasing a quiet….’hmmmm’!
U/J 4hr: there is an open TC signal here that is up about 40+ pips but the trend line above price action is the level to watch:

U/J daily: a daily candle close above this trend line would support a triangle breakout. The height of the triangle is worth about 600 pips and this could be the expected follow through move on any successful breakout move:

U/J weekly: this is just another triangle pattern in the wake of many others:
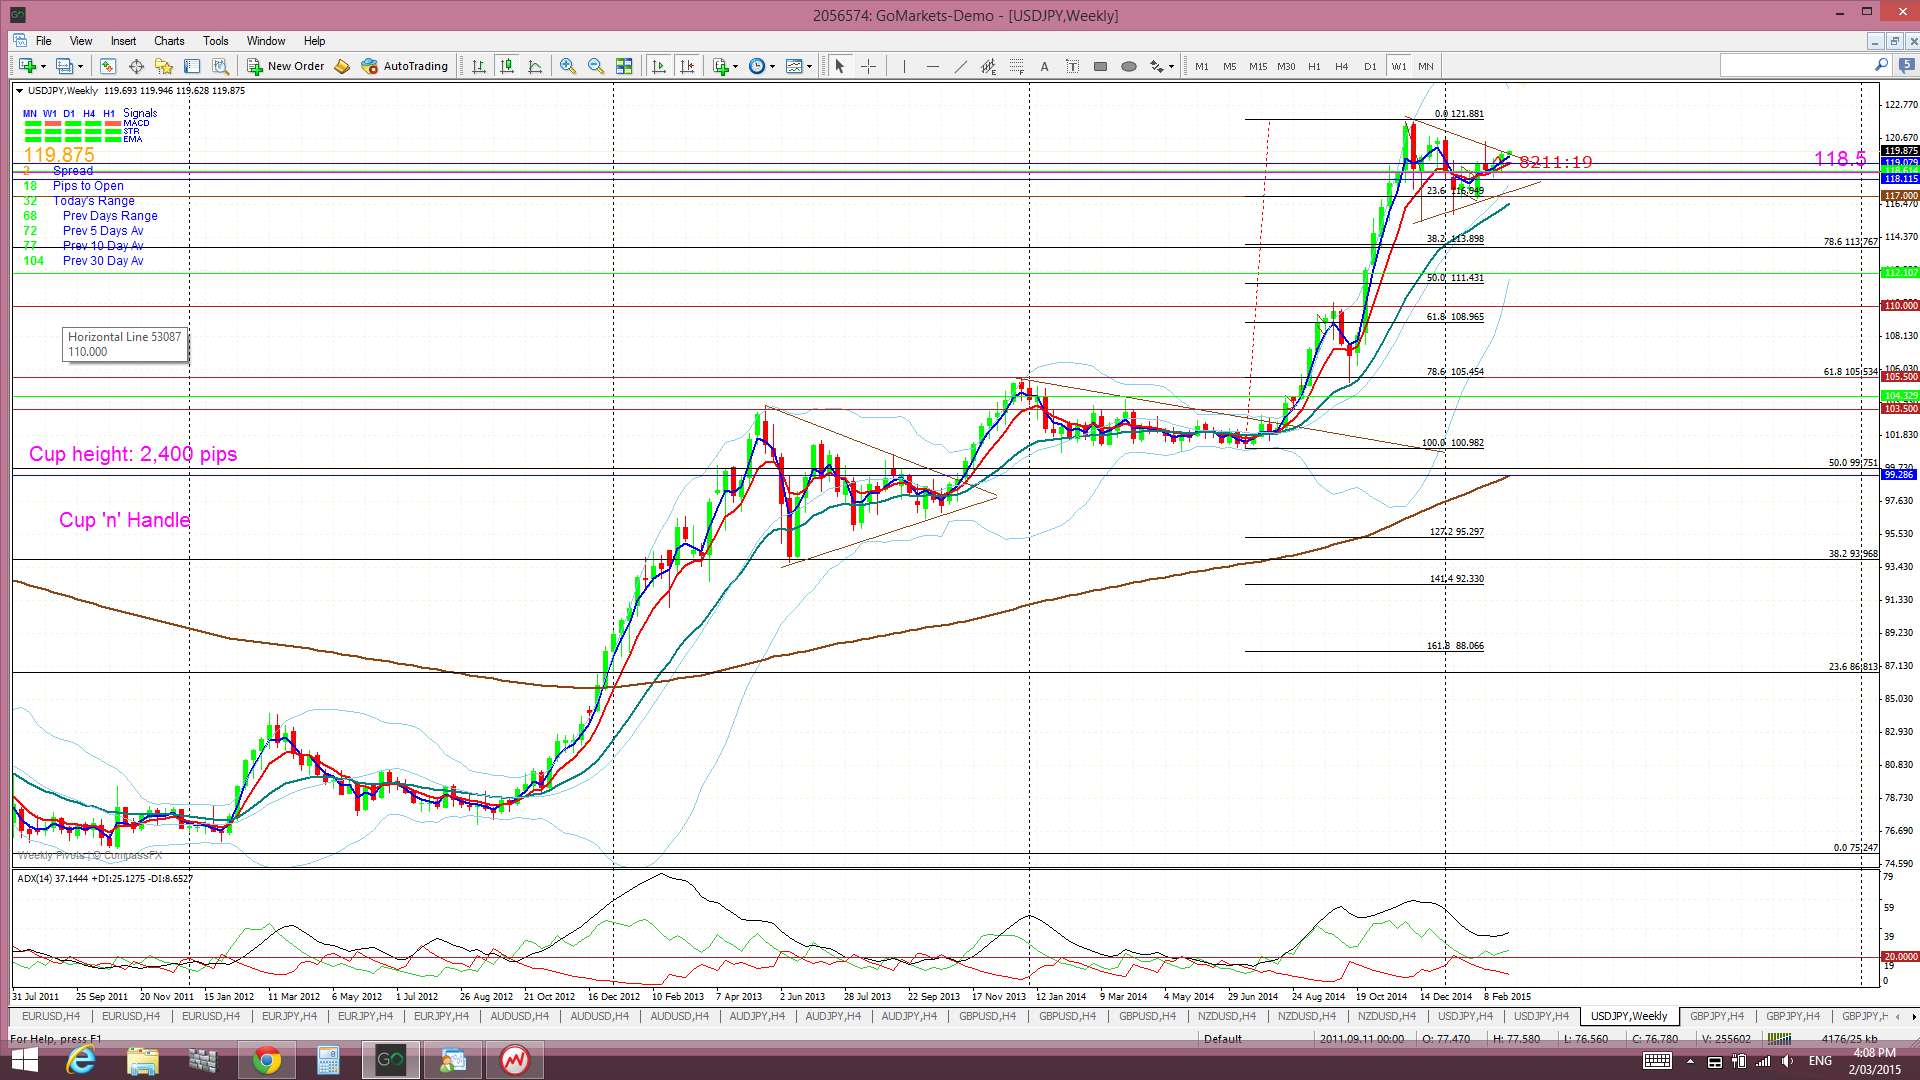
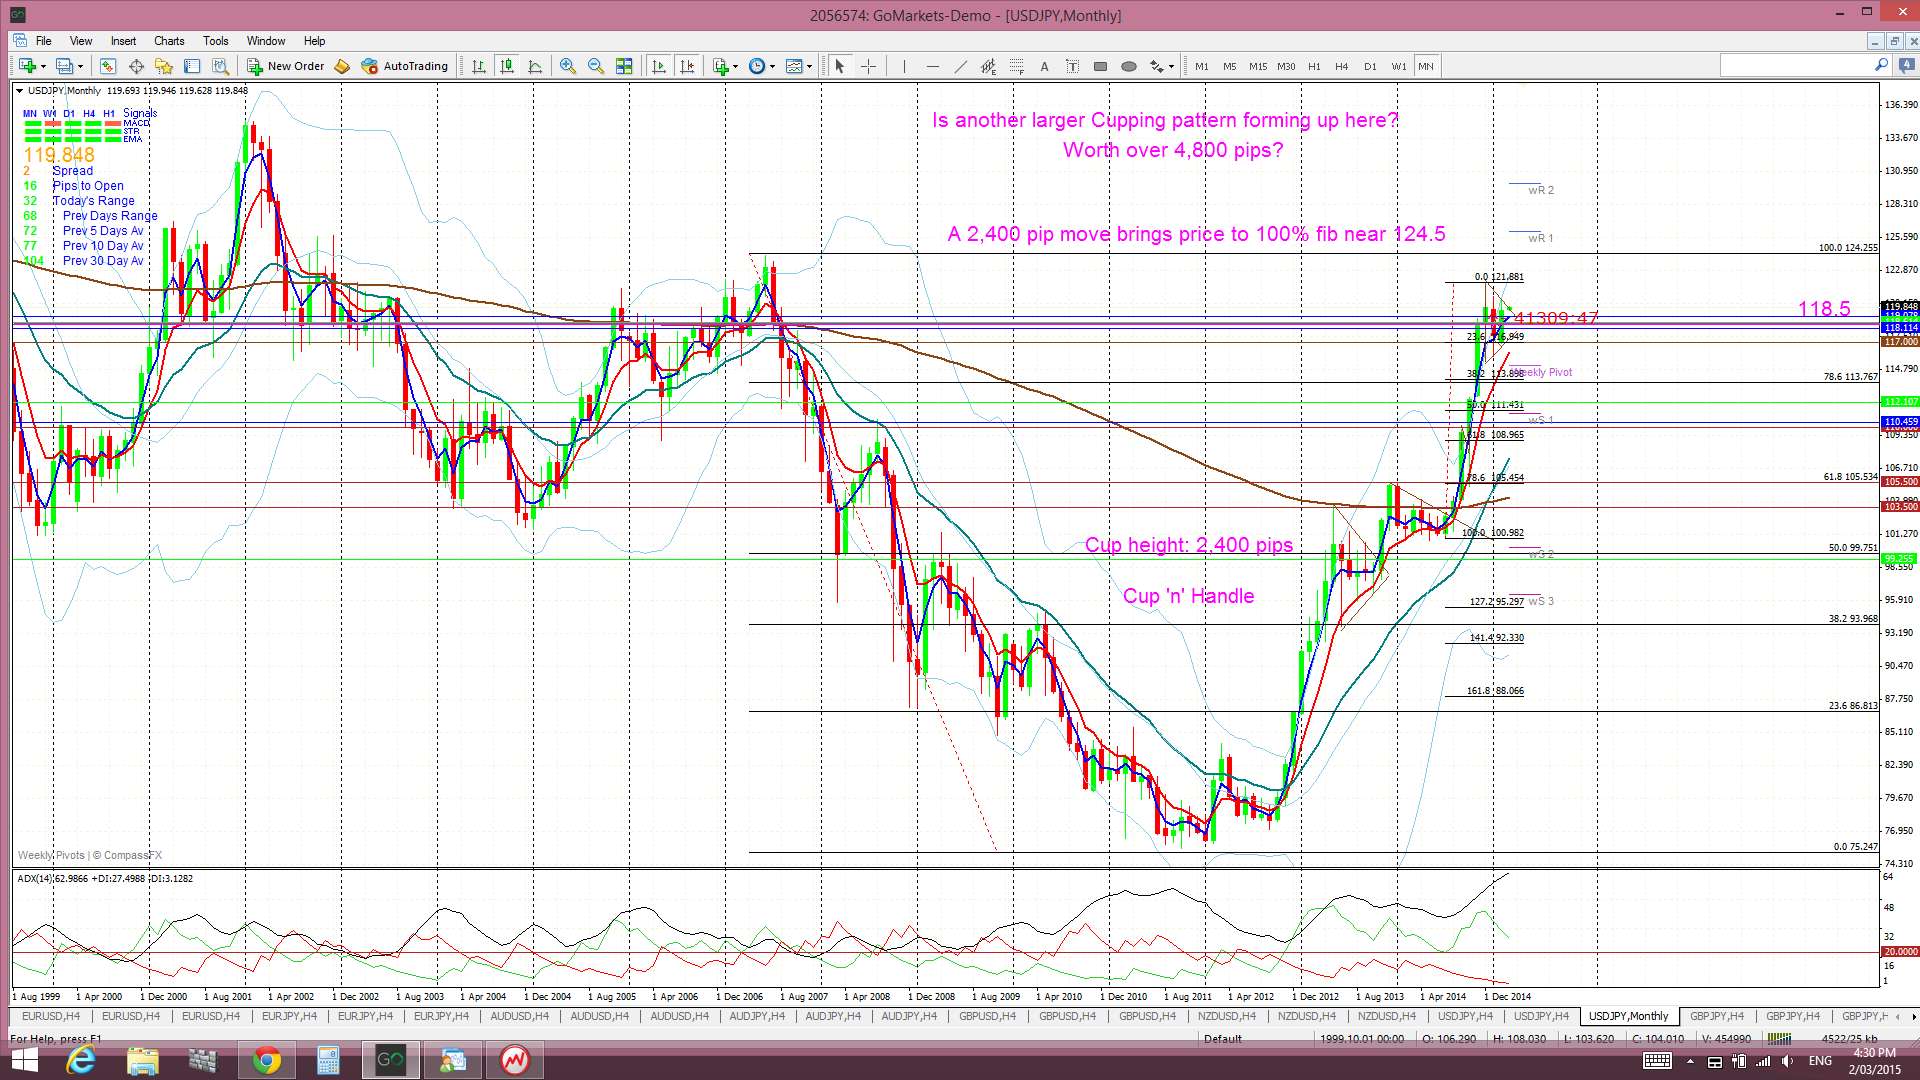
U/J monthly: it is worth noting that a 600 pip triangle breakout would bring the U/J up to my monthly chart’s Cup ‘n’ Handle pattern target of 2,400 pips. To think that so may scoffed at this pattern all those months ago! The standout pattern now is that any completed 2,400 pip Cup ‘n’ Handle pattern may then form up into another, larger Cupping pattern. There is no ‘Handle’ activity yet but, if this was to form up, then this pattern would be worth around 4,800 ~ 5,000 pips on any subsequent breakout move. This ties in with what I’m seeing in the ‘tea leaves’ for stocks as well. I do like confluence.
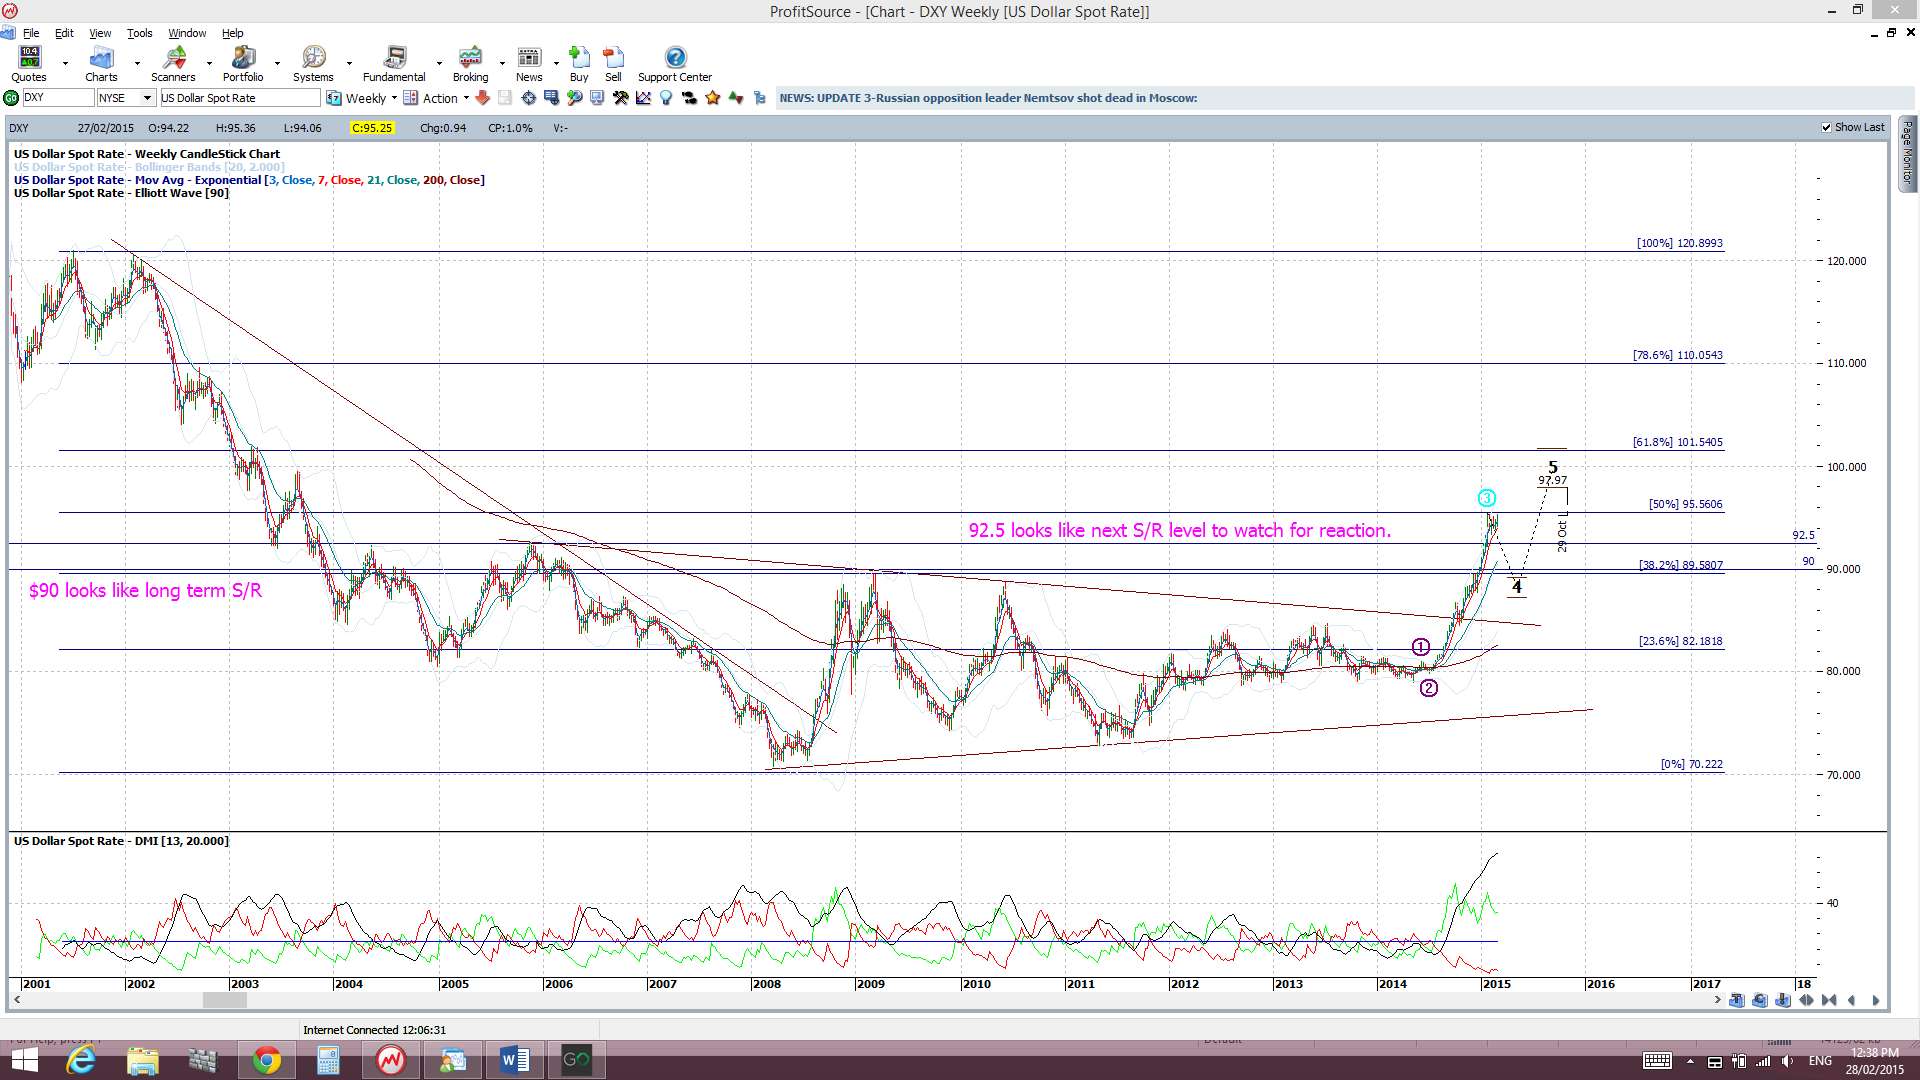
The fortunes of the USD/JPY may lie with the USD index though and this is currently trying to negotiate a ‘Double Top’ at 95.50. A break and hold above 95.50 would support the move on the U/J:
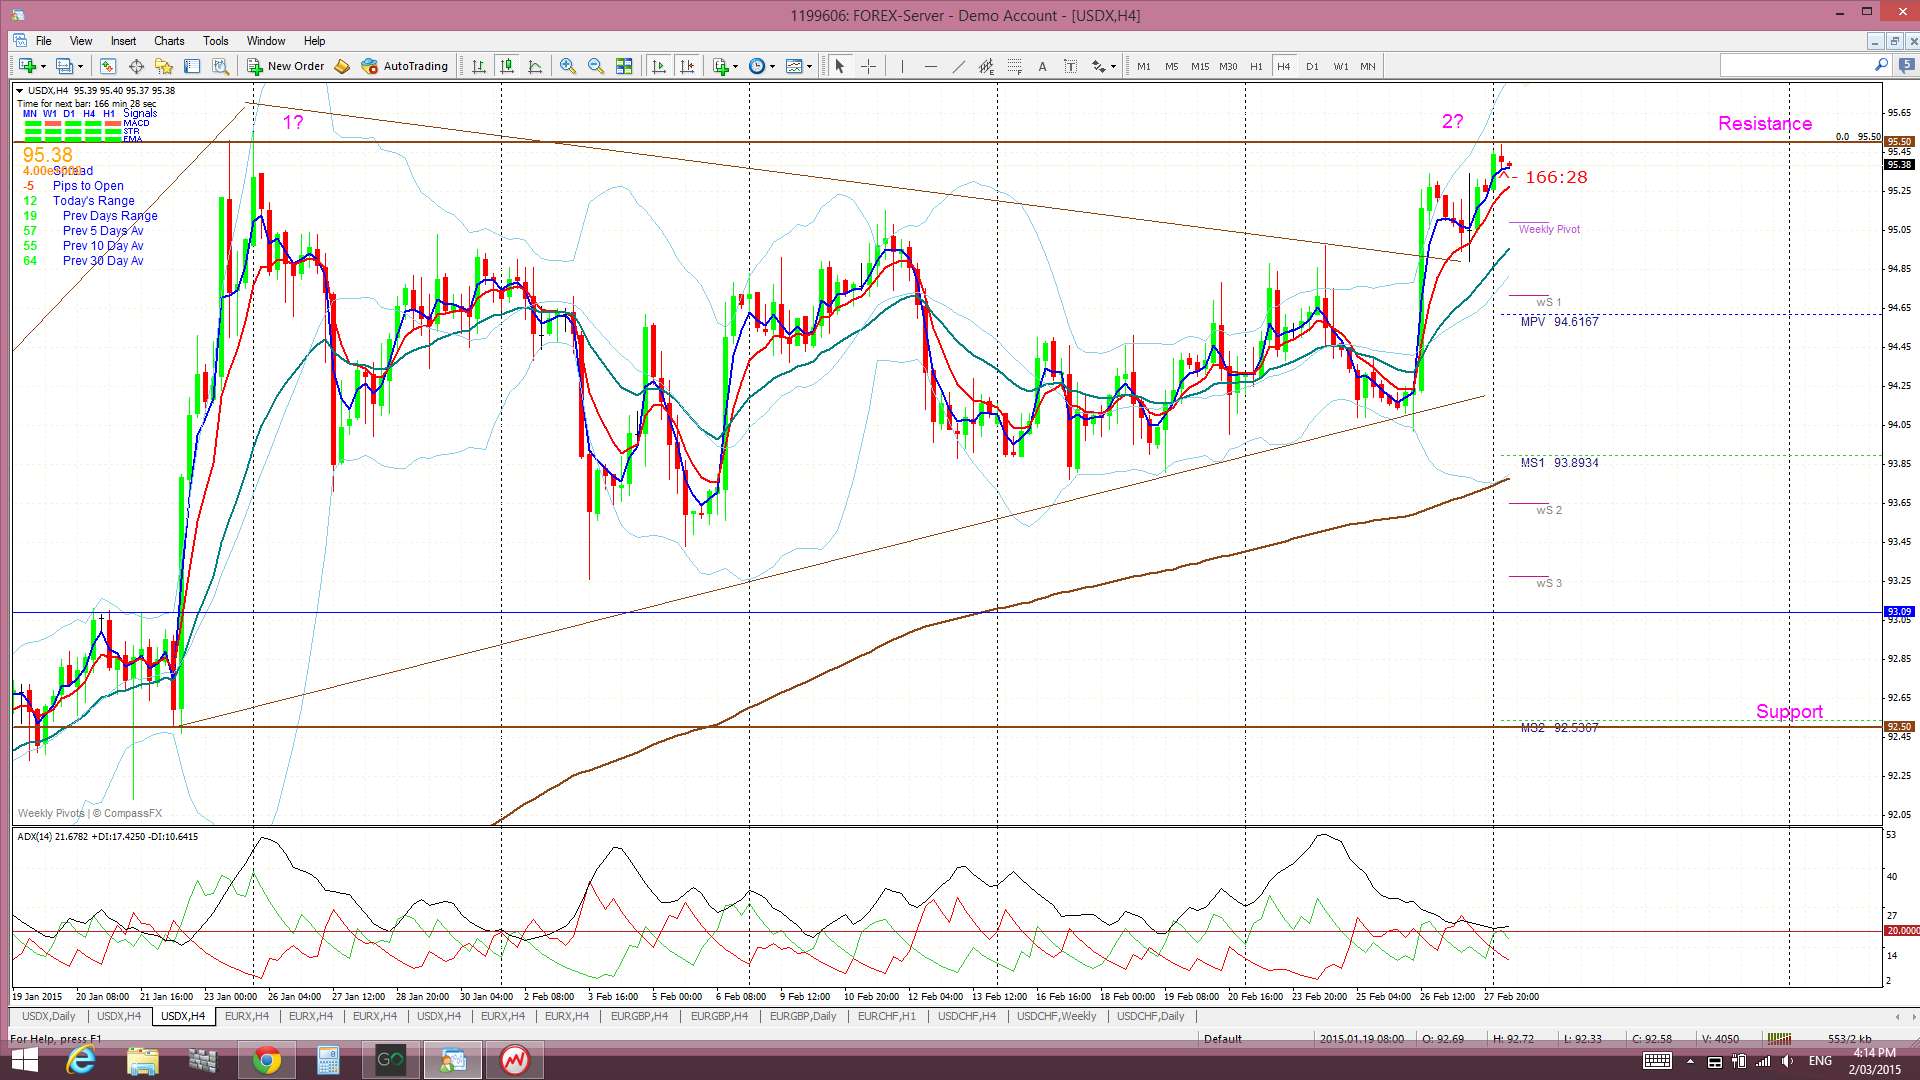
USDX 4hr: 95.50 is major resistance to be negotiated so as to avoid a bearish ‘Double Top’:
USDX weekly: the rise here has been relentless and, so, the 95.50 level is pivotal:
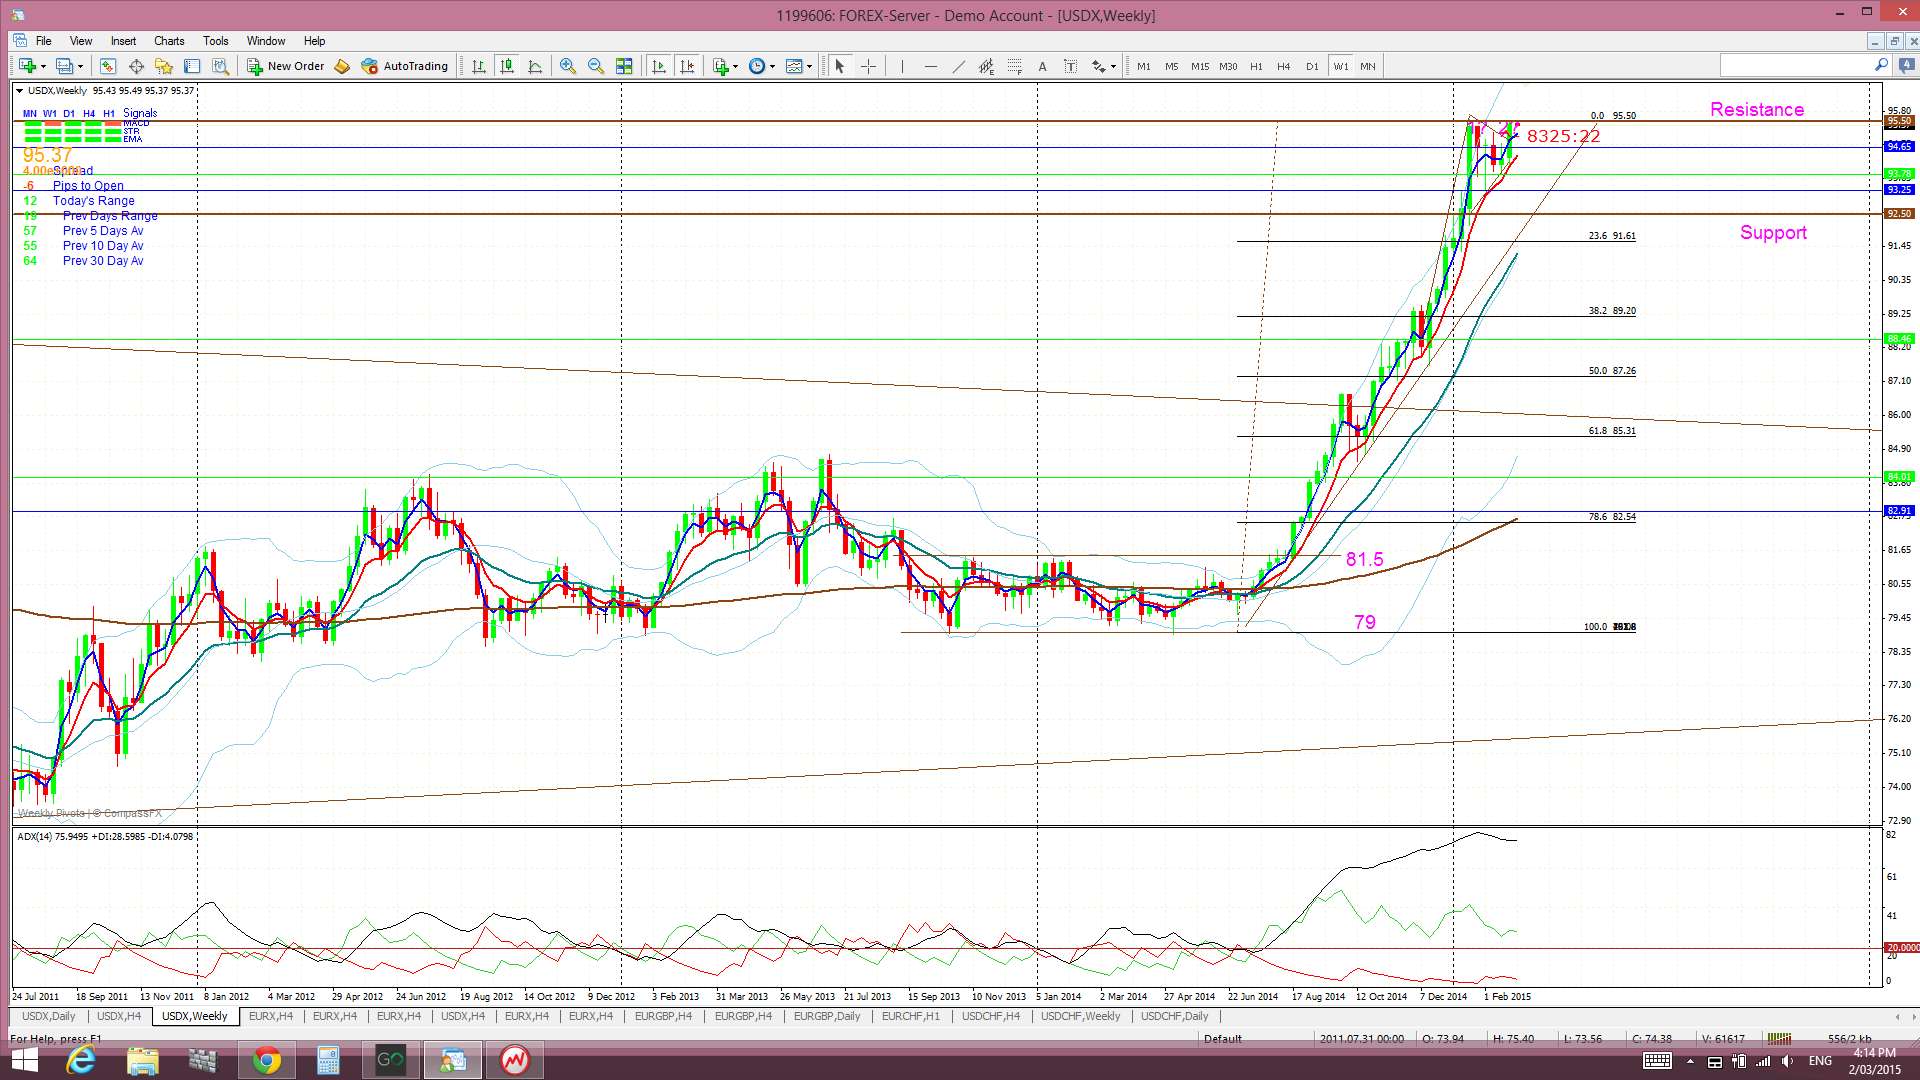
USDX weekly (from my charting platform): this chart shows the significance of 95.50 as it represents the 50% Fibonacci level of the 2002-2008 bear move. Any break and hold above this 50% Fib level at 95.50 would suggest continuation to the 61.8% Fib up near 101.5:
Summary:
Watch for any U/J daily-chart triangle breakout to support a possible 600 pip continuation move.
Any completion of the monthly chart’s 2,400 pip Cup ‘n’ Handle pattern may lead to a subsequent 4,800+ pip Cup ‘n’ Handle pattern.
The success of this bullish venture on the U/J may come down to whether the USDX can break and hold above the 95.50 level and so this index is worth monitoring here too.
The post USD/JPY: a chart to make you go ‘hmmm’! appeared first on www.forextell.com.