USDX
Monthly: The new March candle is currently printing a large bullish candle AND is trading above the key 95.50 level.
Profit Source Monthly chart: This monthly chart shows that the recent triangle breakouts, on the monthly and weekly time scales, suggest bullish continuation. The break above 95.50 this week would also support this. The 50% Fib retracement of the monthly chart’s 1984-2008 huge bear move is up near 120 and this has been a previous reaction zone. One could safely assume price might target this level over the longer term IF bullish momentum continues. After that, the 61.8% Fib near 130 would seem to be the next obvious port of call:
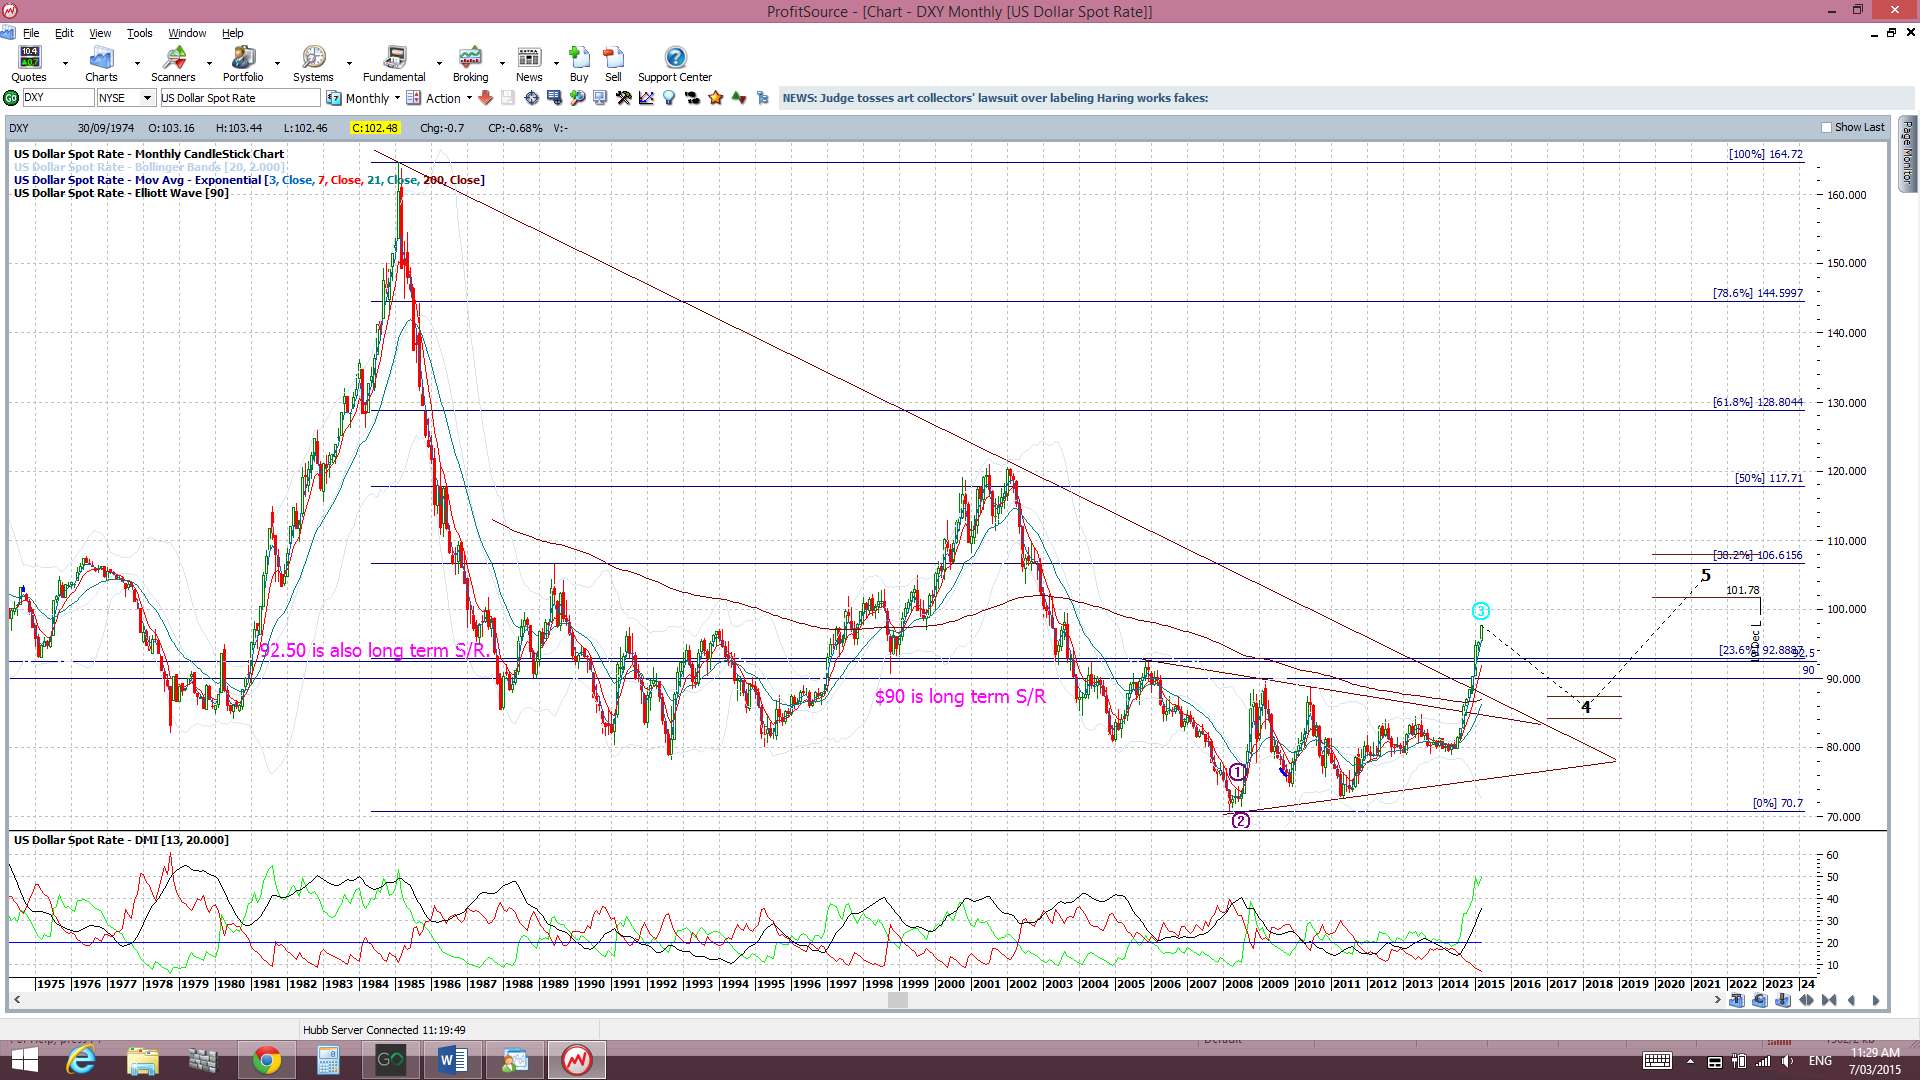
NB: I’d like to thank the guys at Hubb for sourcing more data for my USD index Profit Source charts. Previously, the data only went back only as far as 1991 but, with some extra sourcing, they managed to track back to 1987. With a little more prodding though they managed to source back even further and access back to 1975! A HUGE ‘thank you’ Paul from moi! I only wish they hosted the EUR index as well but, sadly, not.
MT4 Monthly Chart:

Monthly Ichimoku: The new March candle is trading well above the monthly Cloud.
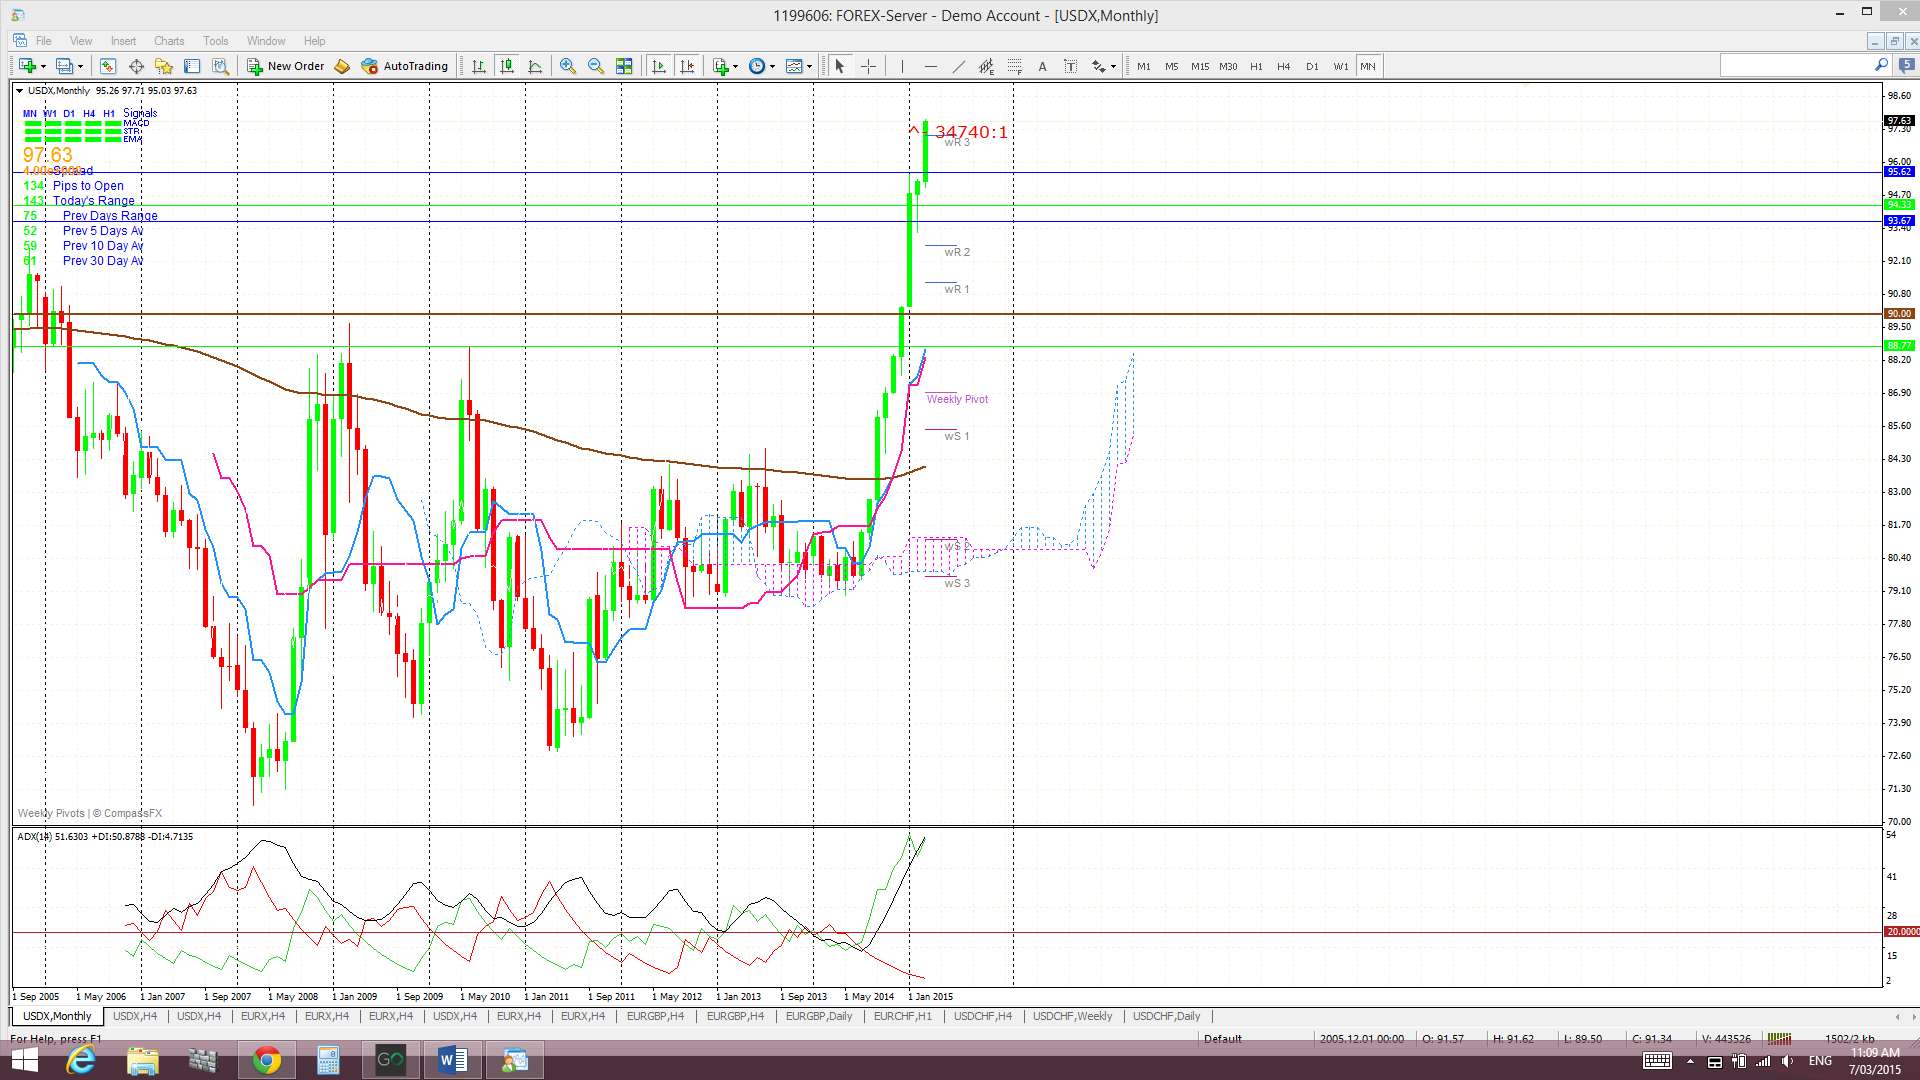
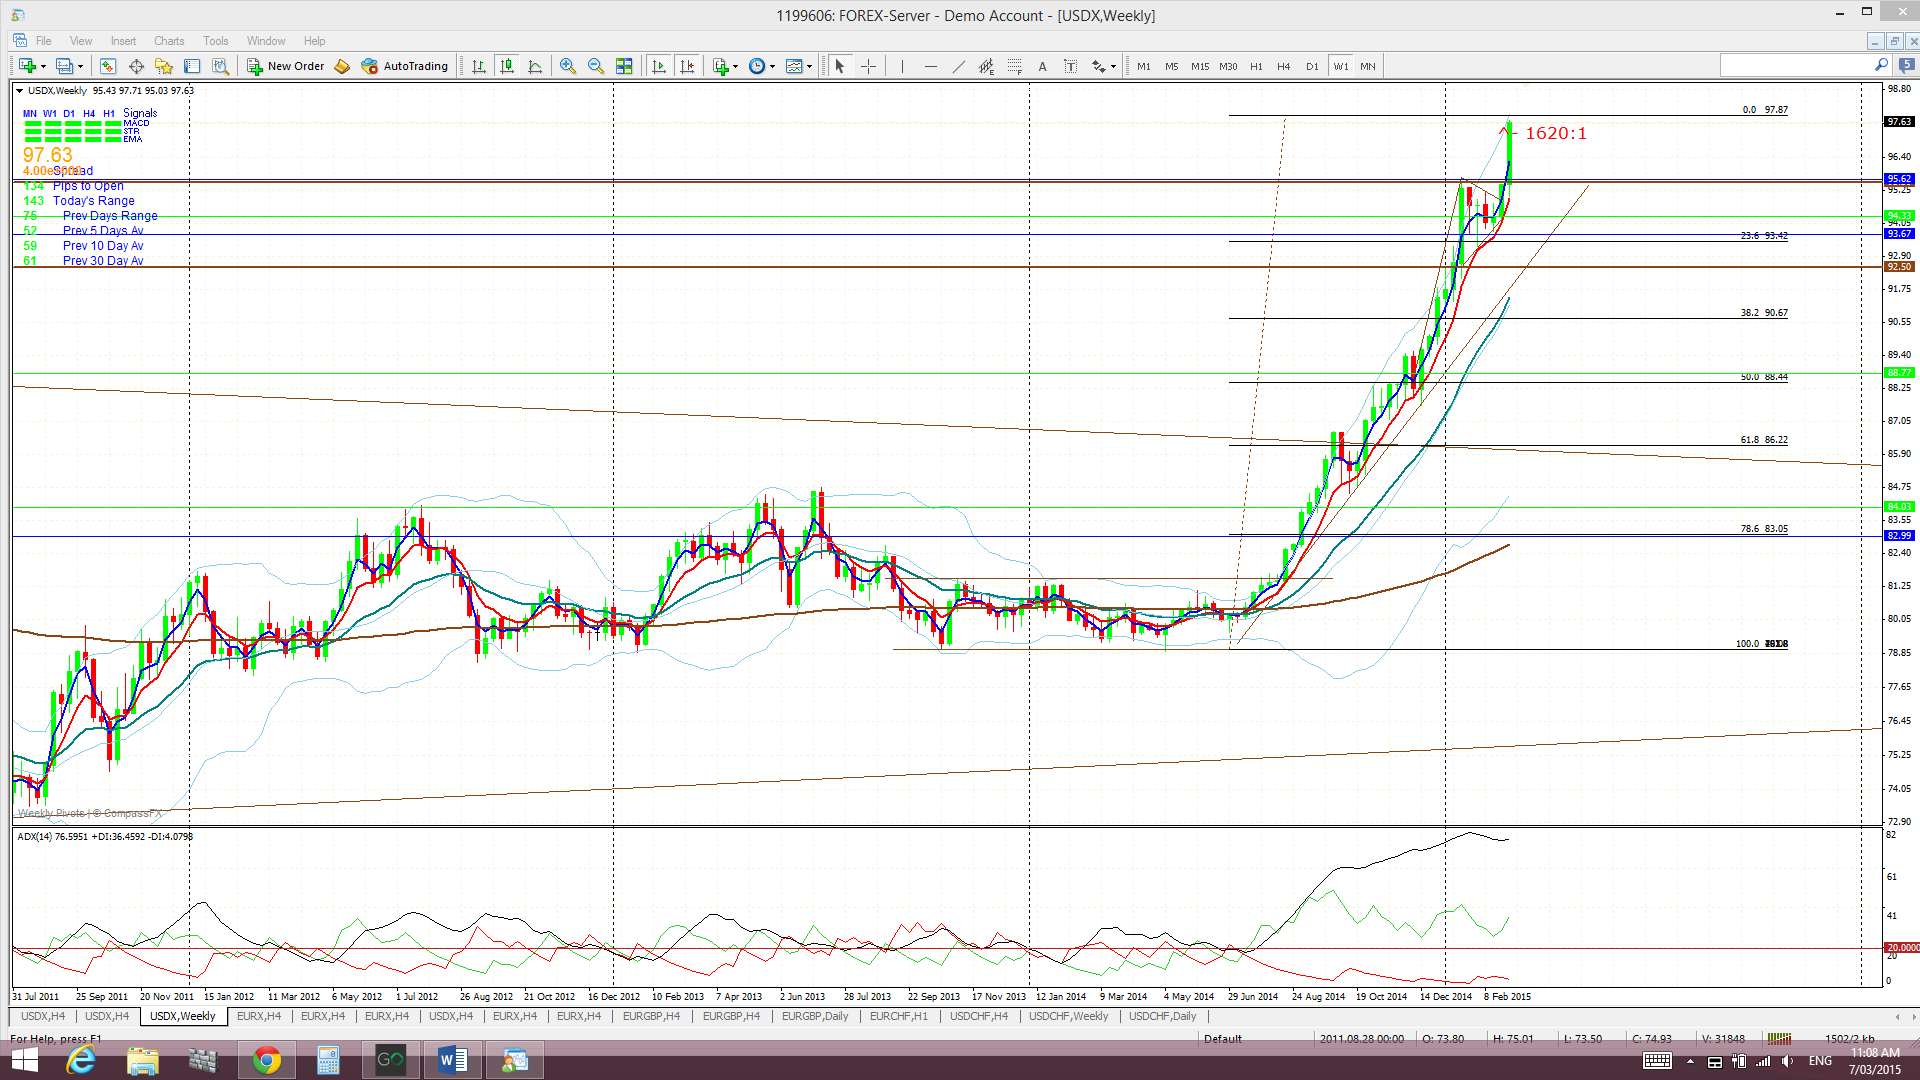
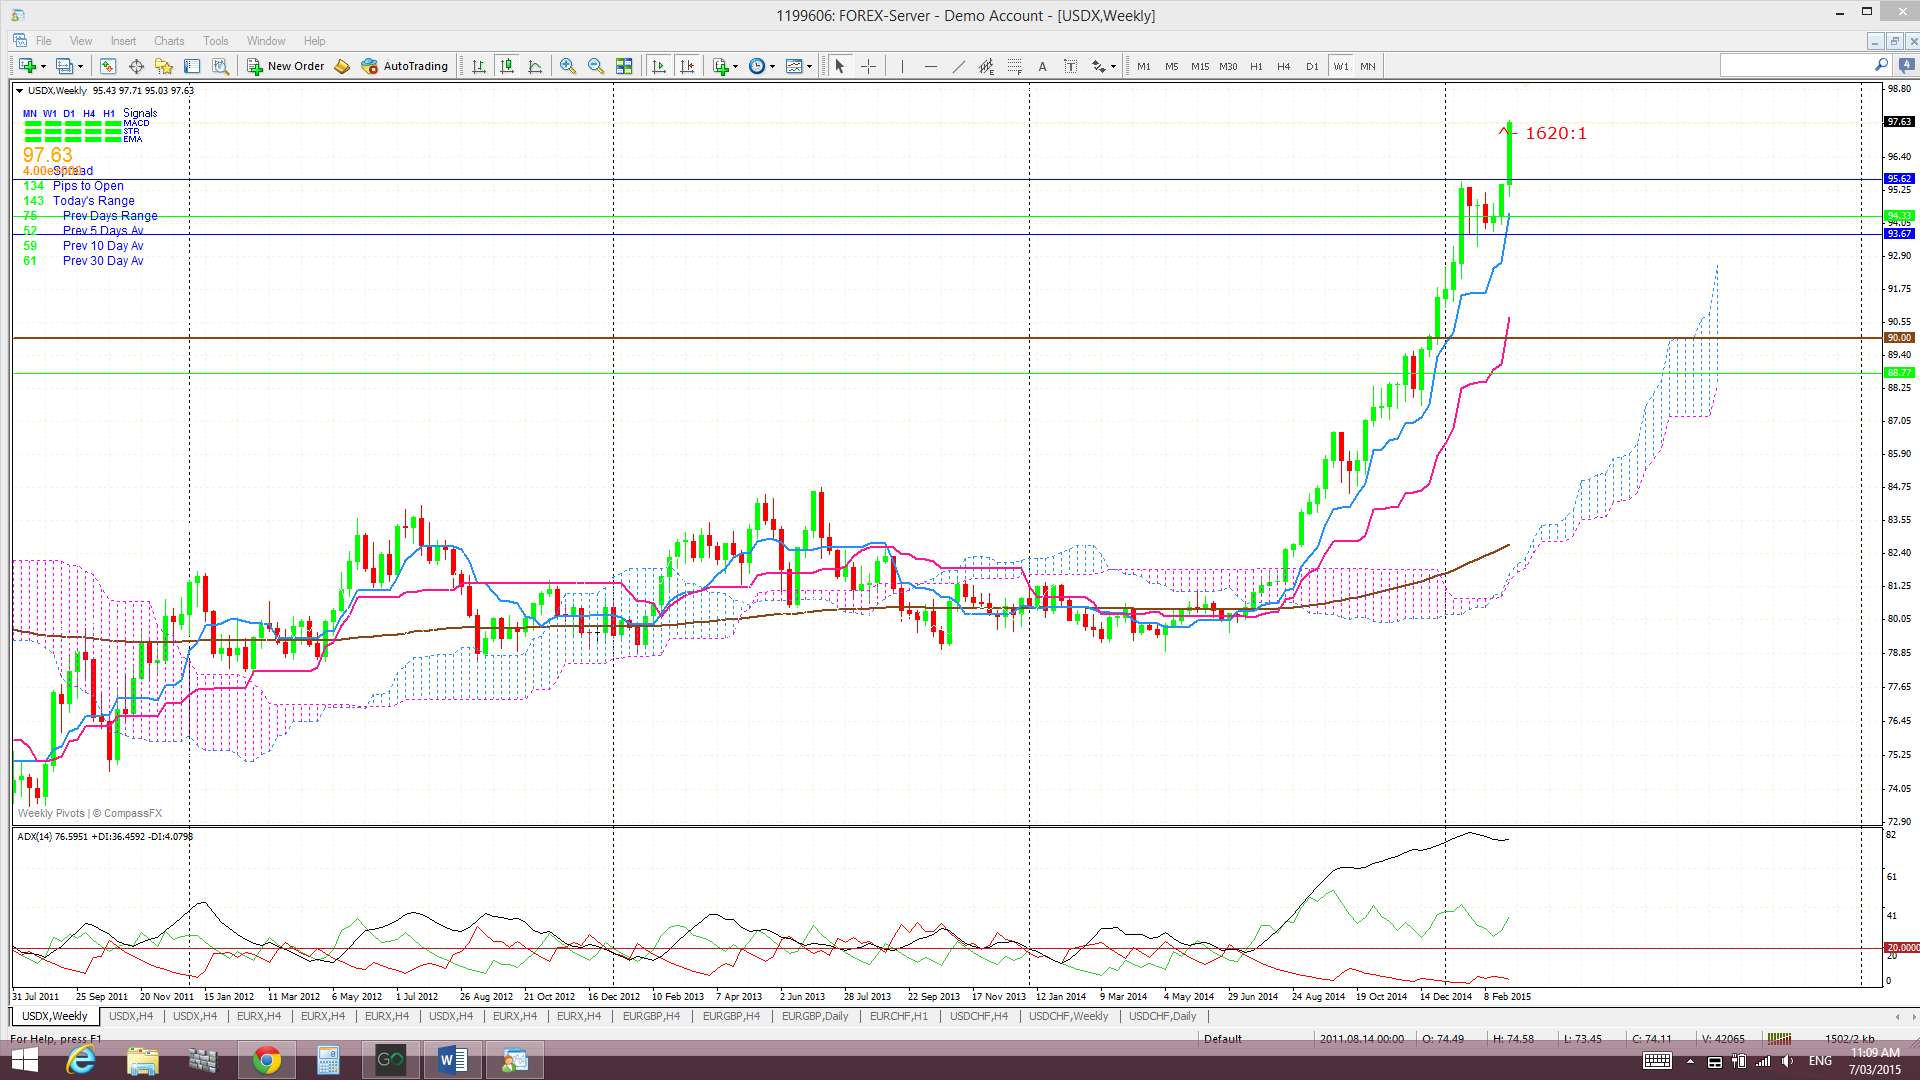
Weekly: Last week’s candle closed as a large bullish candle AND above the key 95.50 level. This weekly break above 95.50 supports the ‘Bull Flag’ scenario and undermines the bearish ‘Double Top’. An obvious next target for any continuation would be the 61.8% Fib of the 2002-2008 bear move that is up near 101.5 ( see on the Profit Source chart). However, it is still worth keeping note of the fact that any 61.8% pull back of the most recent bull run would bring price down to near the broken trend line of the monthly chart’s triangle pattern (see on the MT4 chart).
MT4 chart:
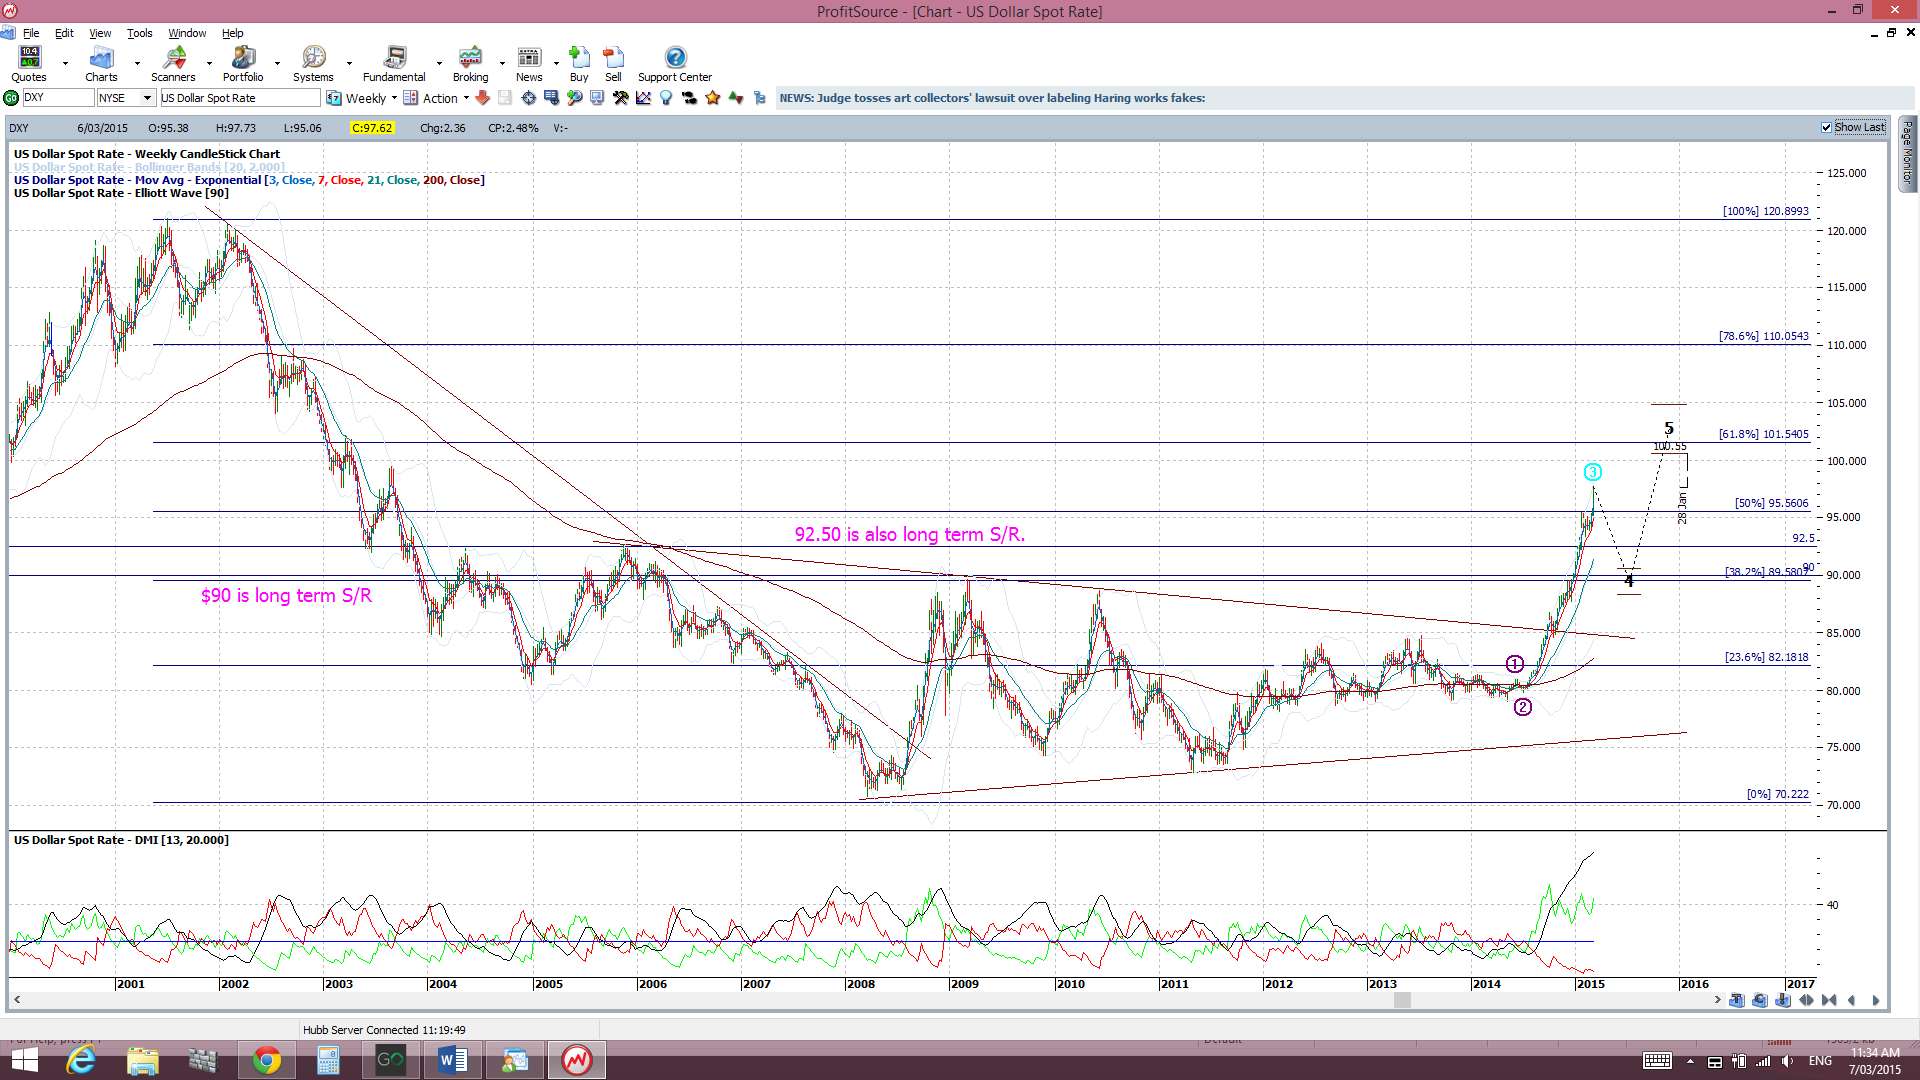
Profit Source Chart: Price has broken up through the 50% Fib at 95.50 and looks set to head towards the 61.8% Fib near 101.50:
Weekly Ichimoku: The weekly candle closed trading well ABOVE the weekly Cloud.
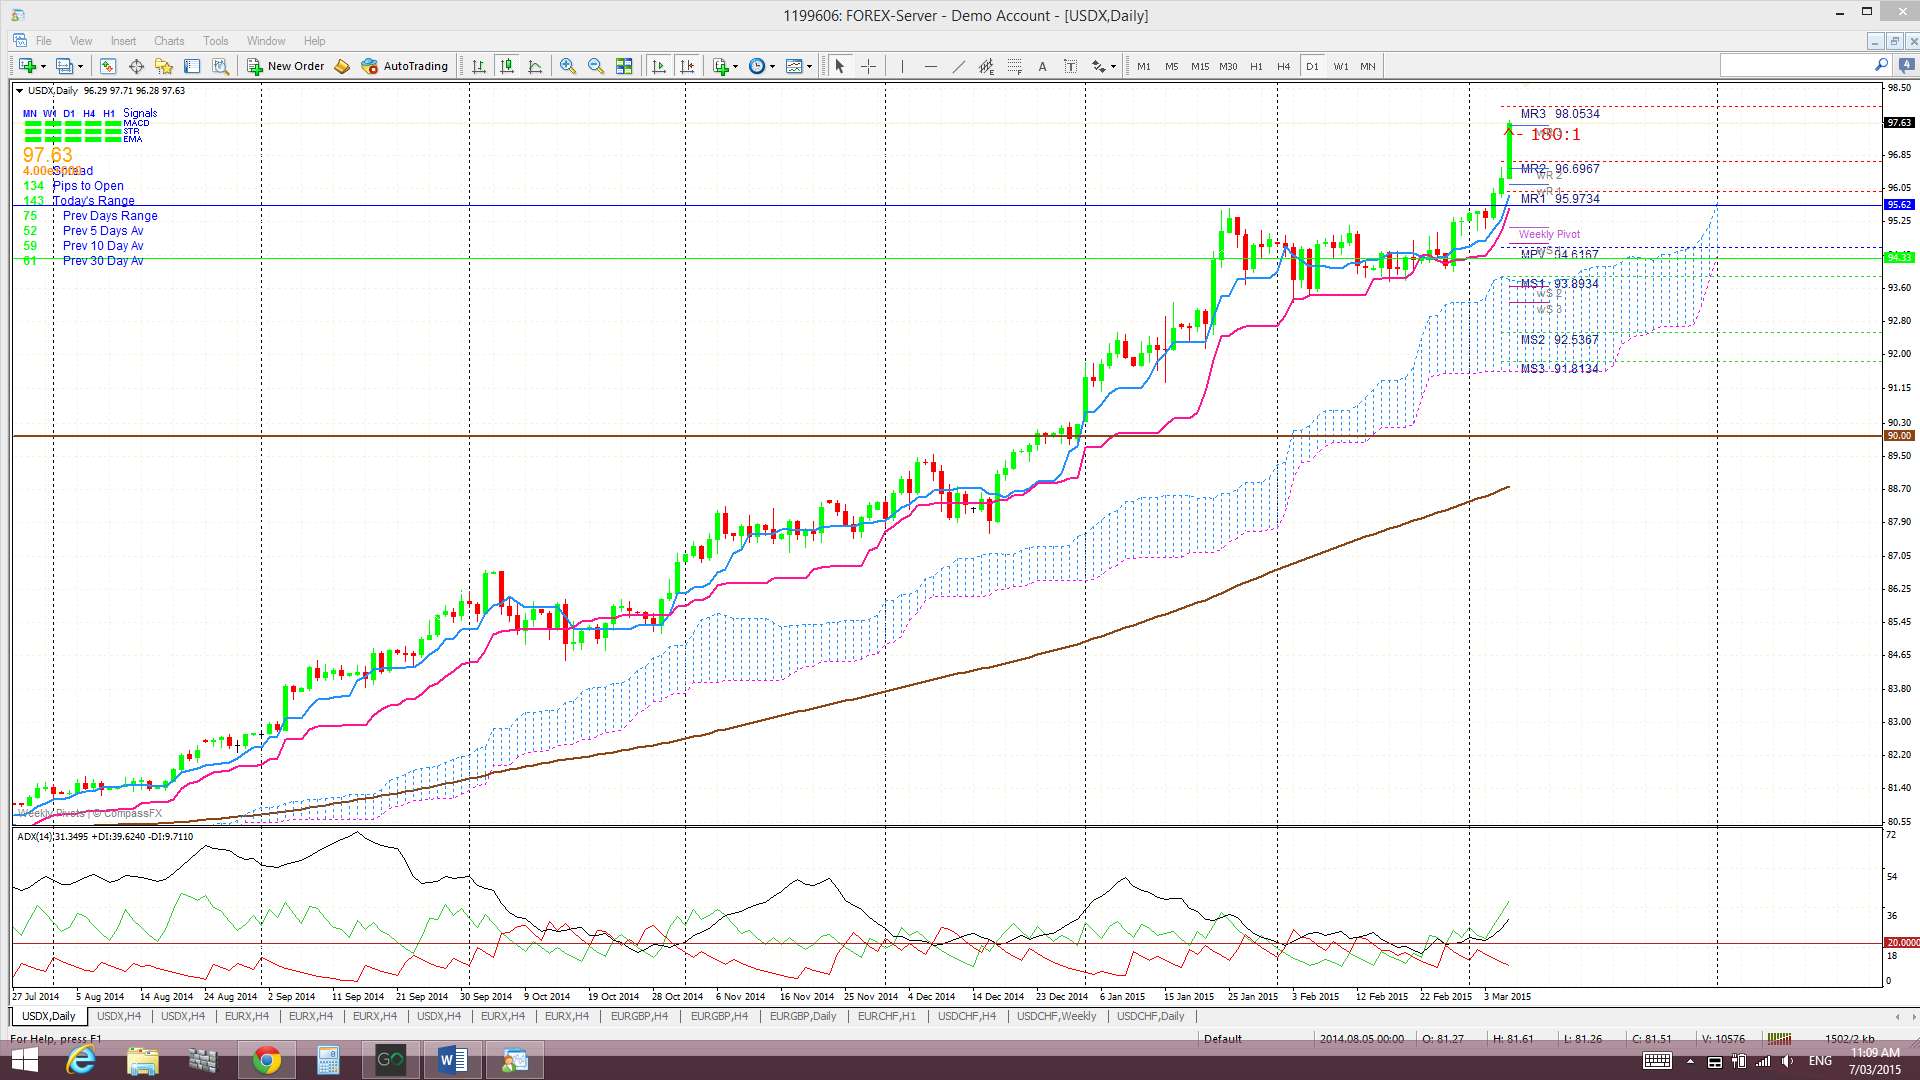
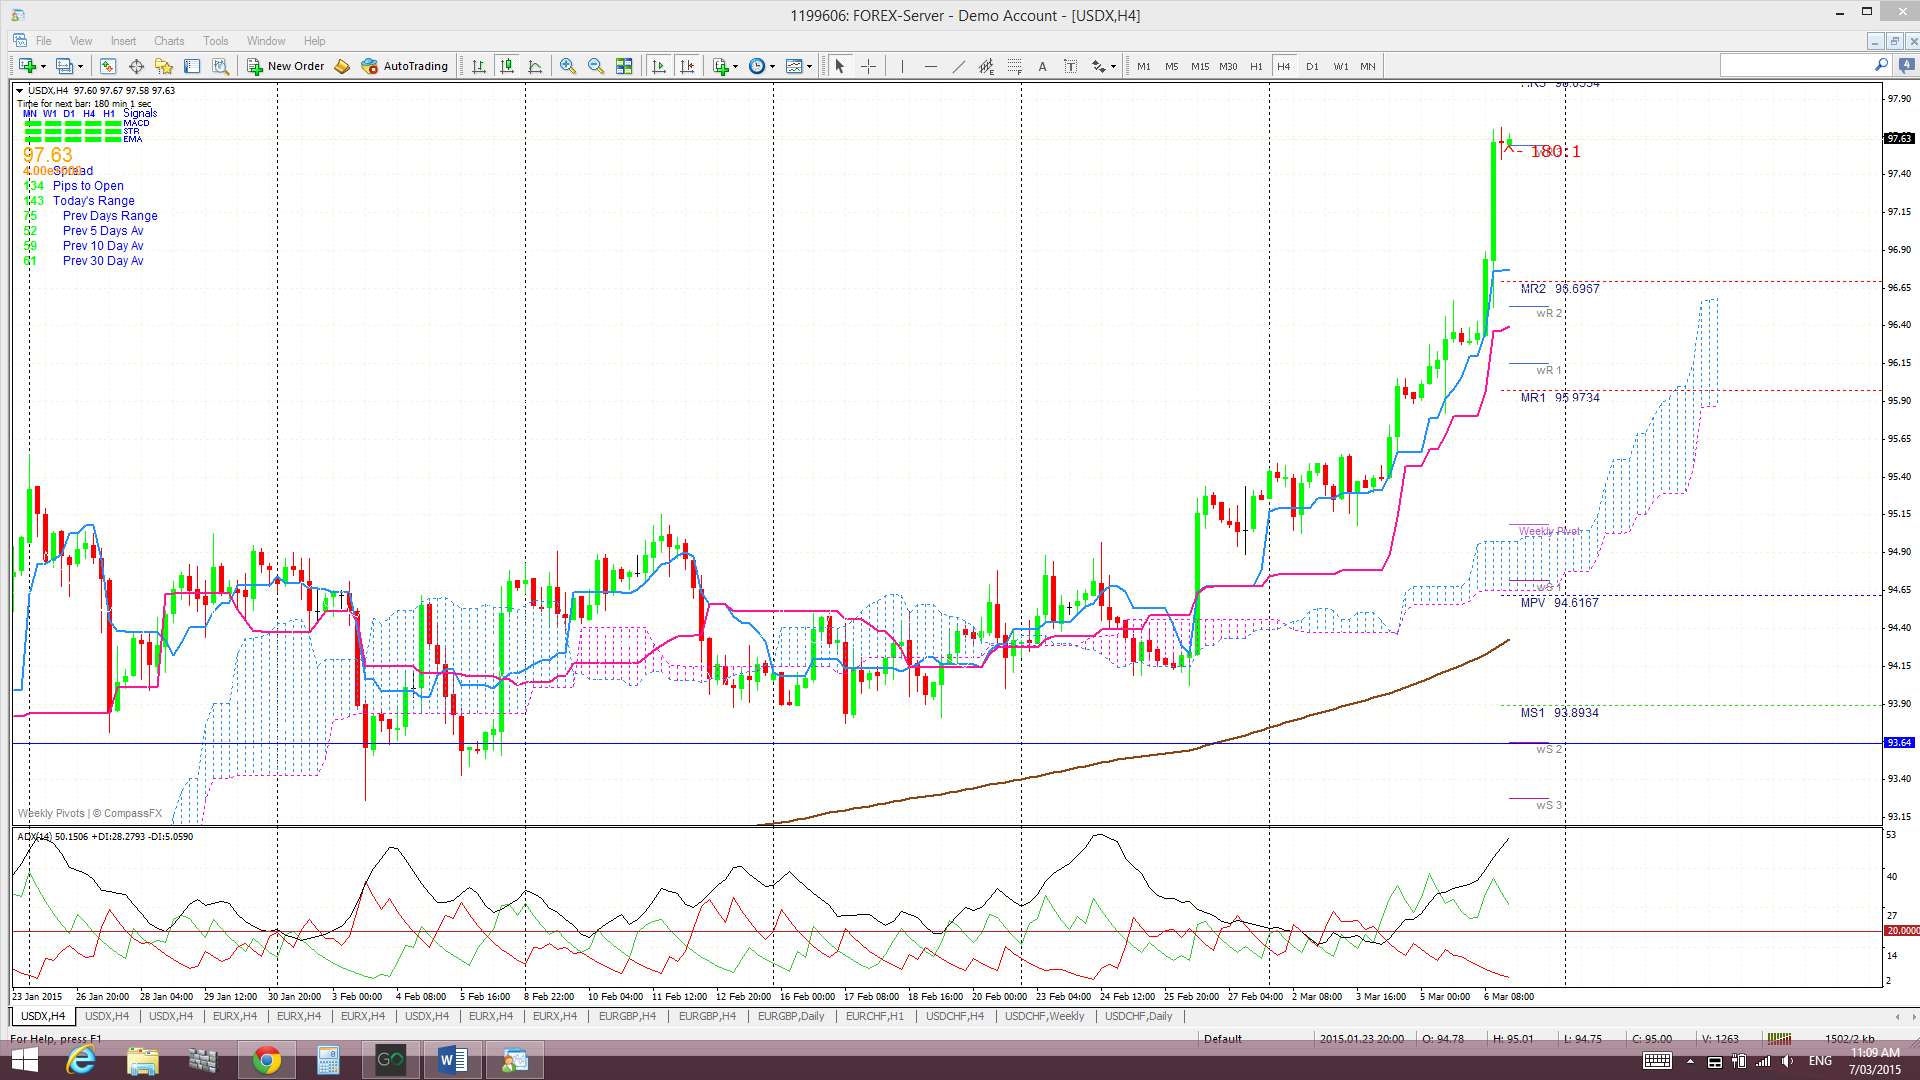
Daily: Price traded under the key 95.50 level until breaking out higher on Thursday. Friday’s NFP then gave it a further lift.
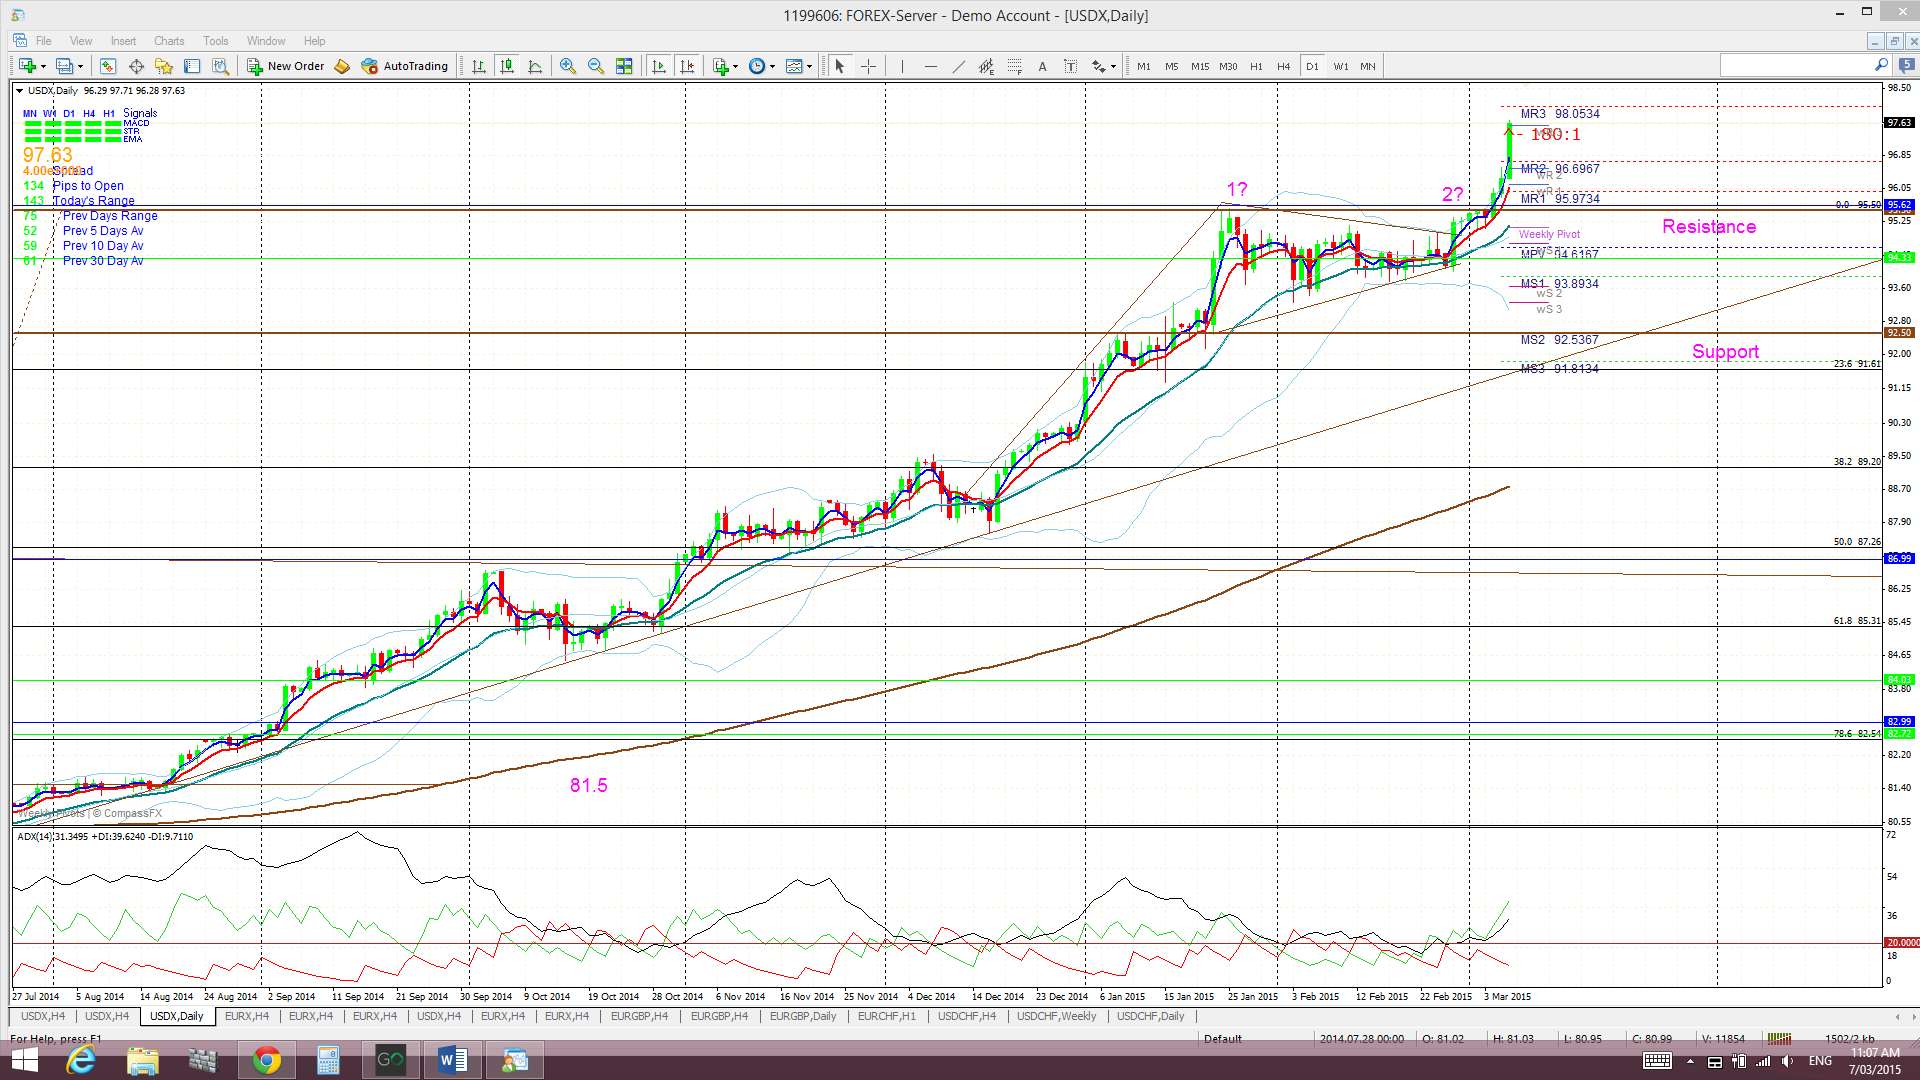
Daily Ichimoku Cloud chart: Price traded above the Cloud all week the bullish Tenkan/Kijun crossover signal remains open. This cross evolved above the Cloud and thus is deemed a ‘strong’ signal.
4hr: Price chopped sideways under the 95.50 until Thursday and then made a breakout to the upside. Friday’s NFP helped to continue this bullish momentum. Parabolas seem to be back in fashion!
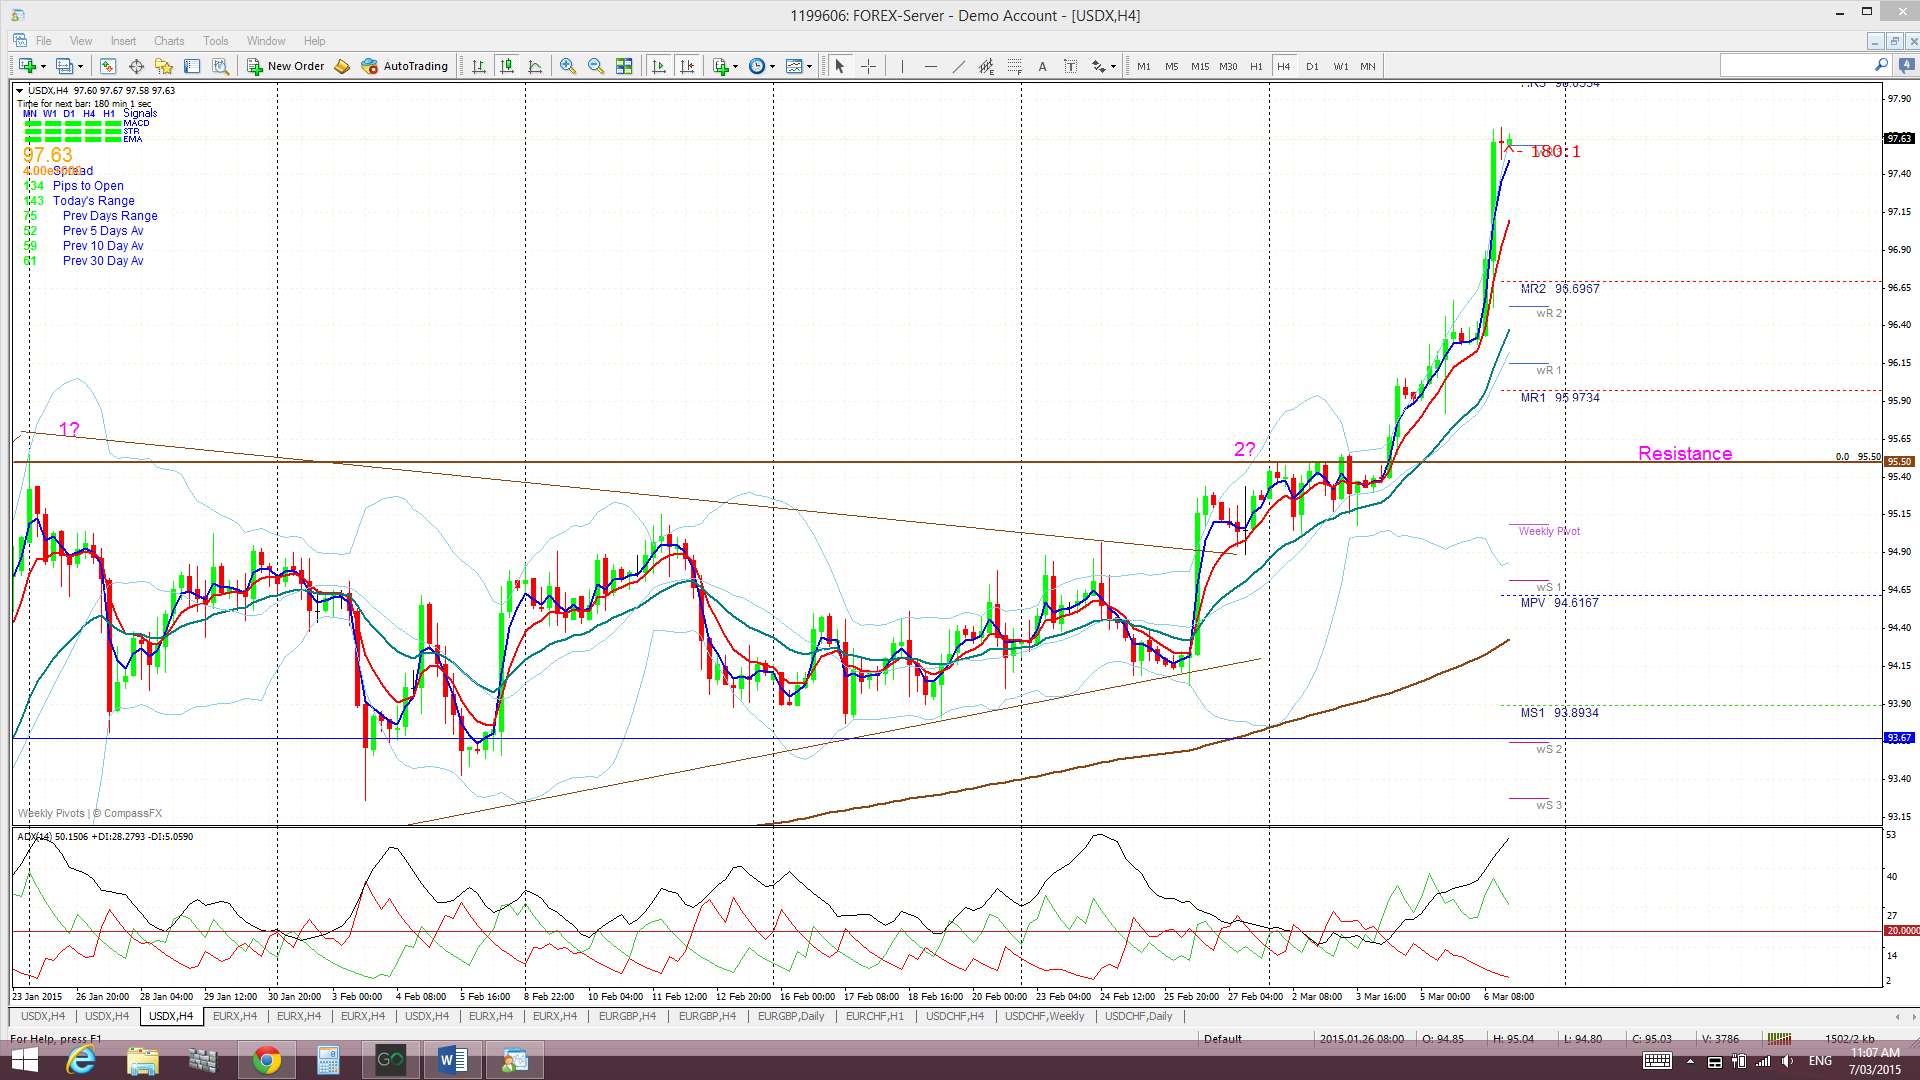
4hr Ichimoku Cloud chart: Price traded above the Cloud all week. This chart is aligned with the daily chart and suggests long USD.
EURX
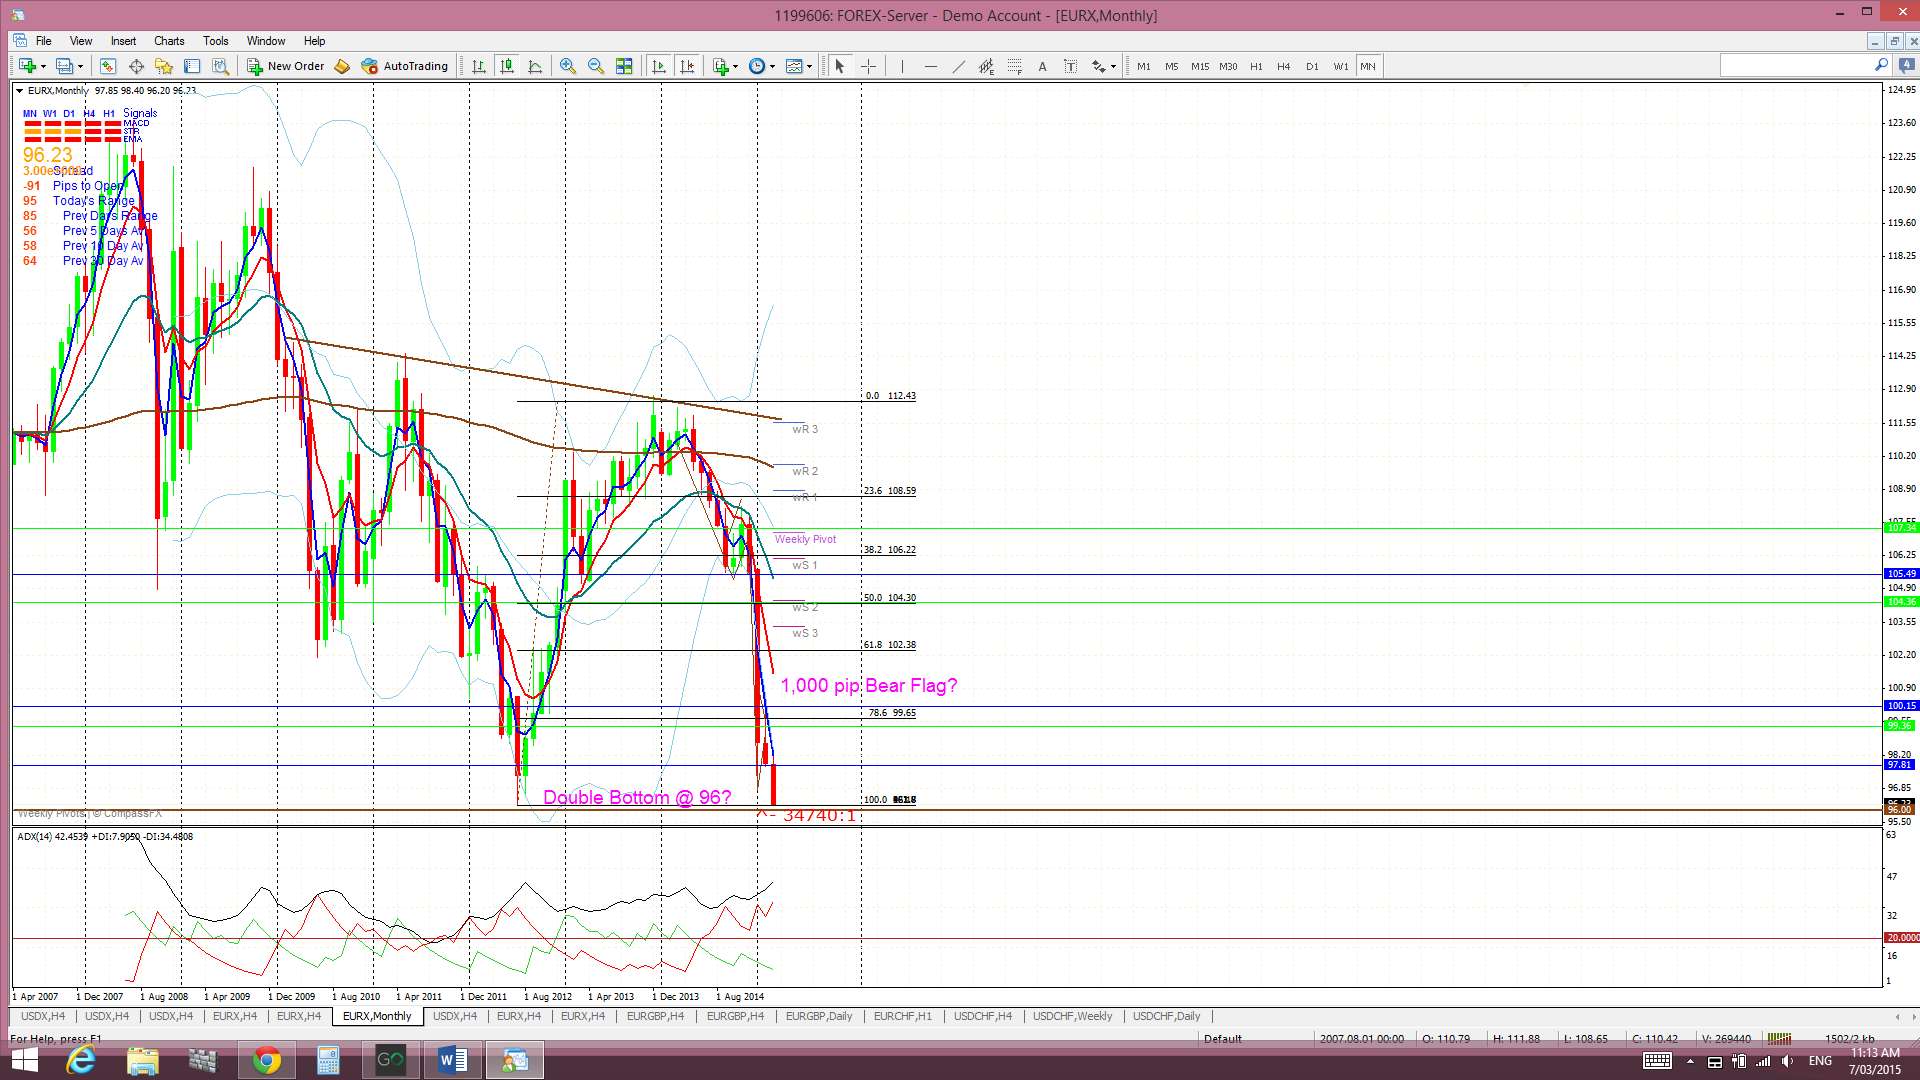
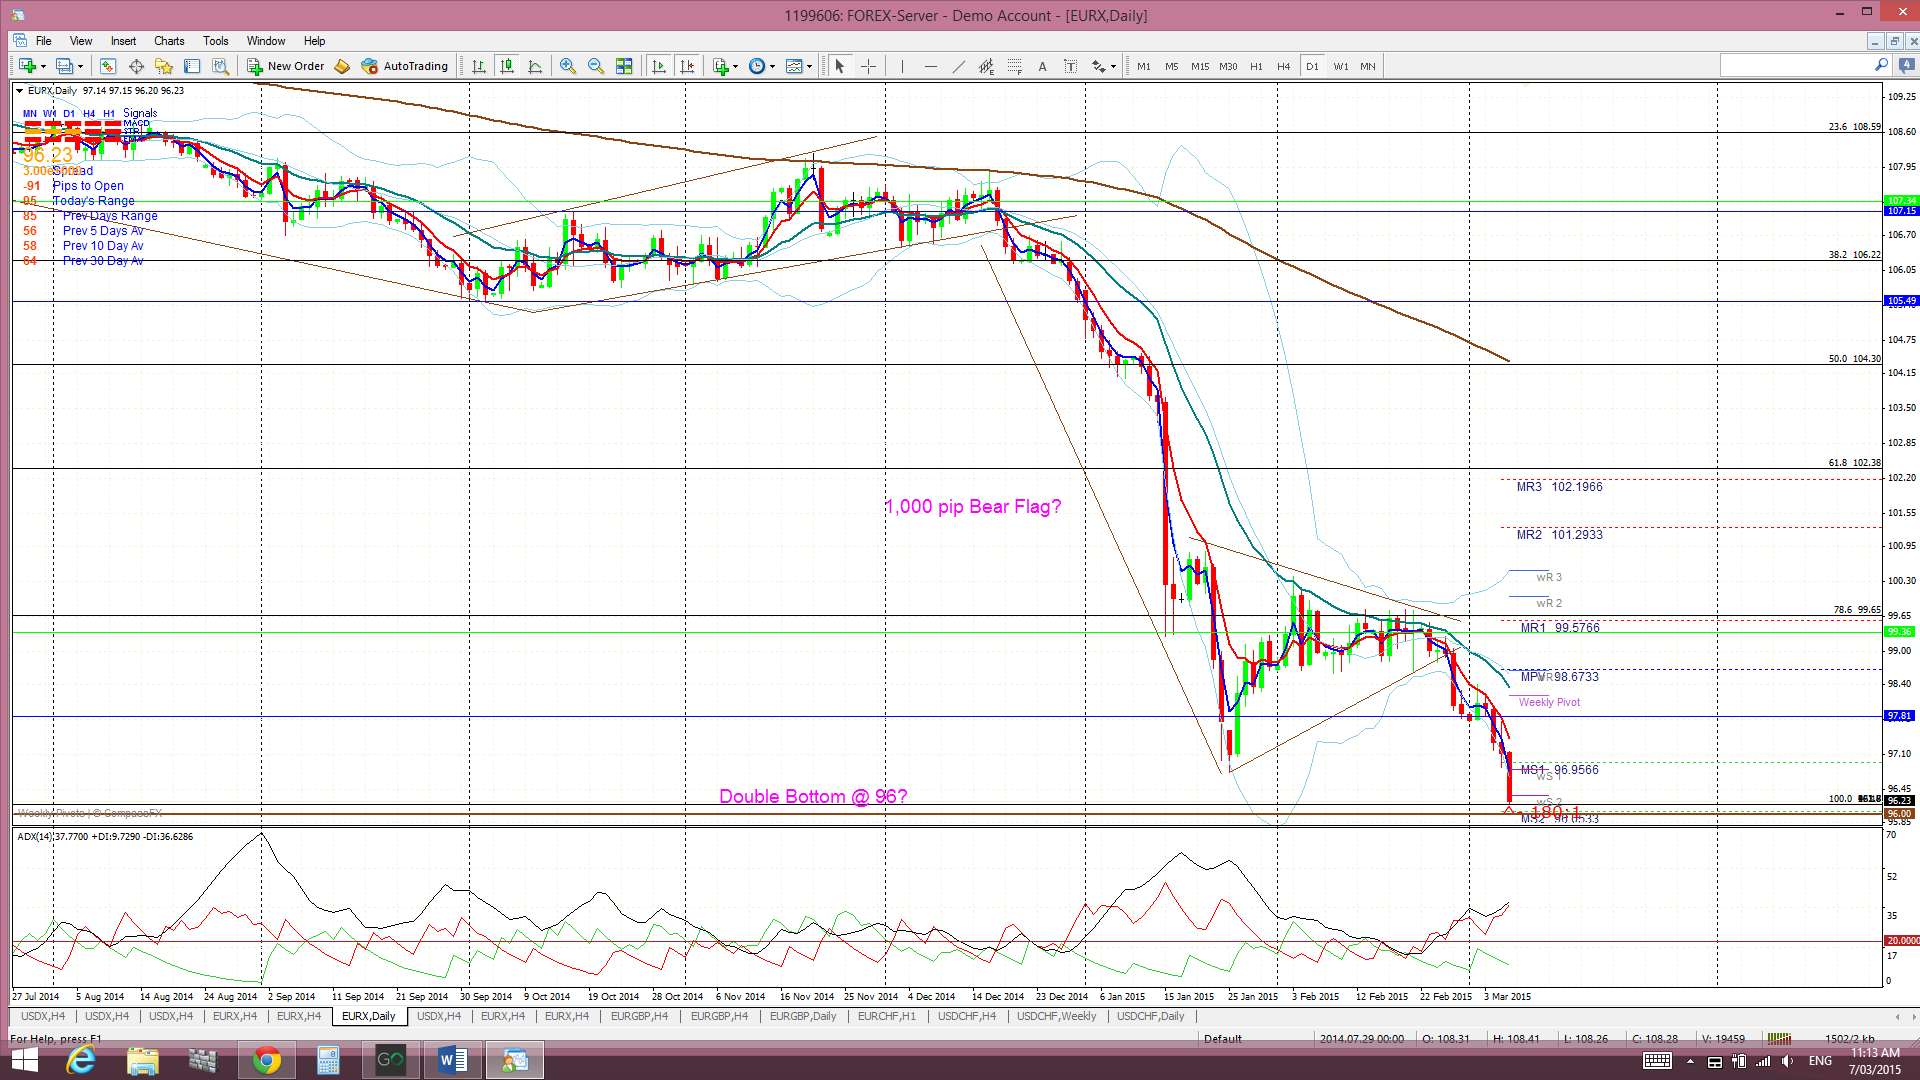
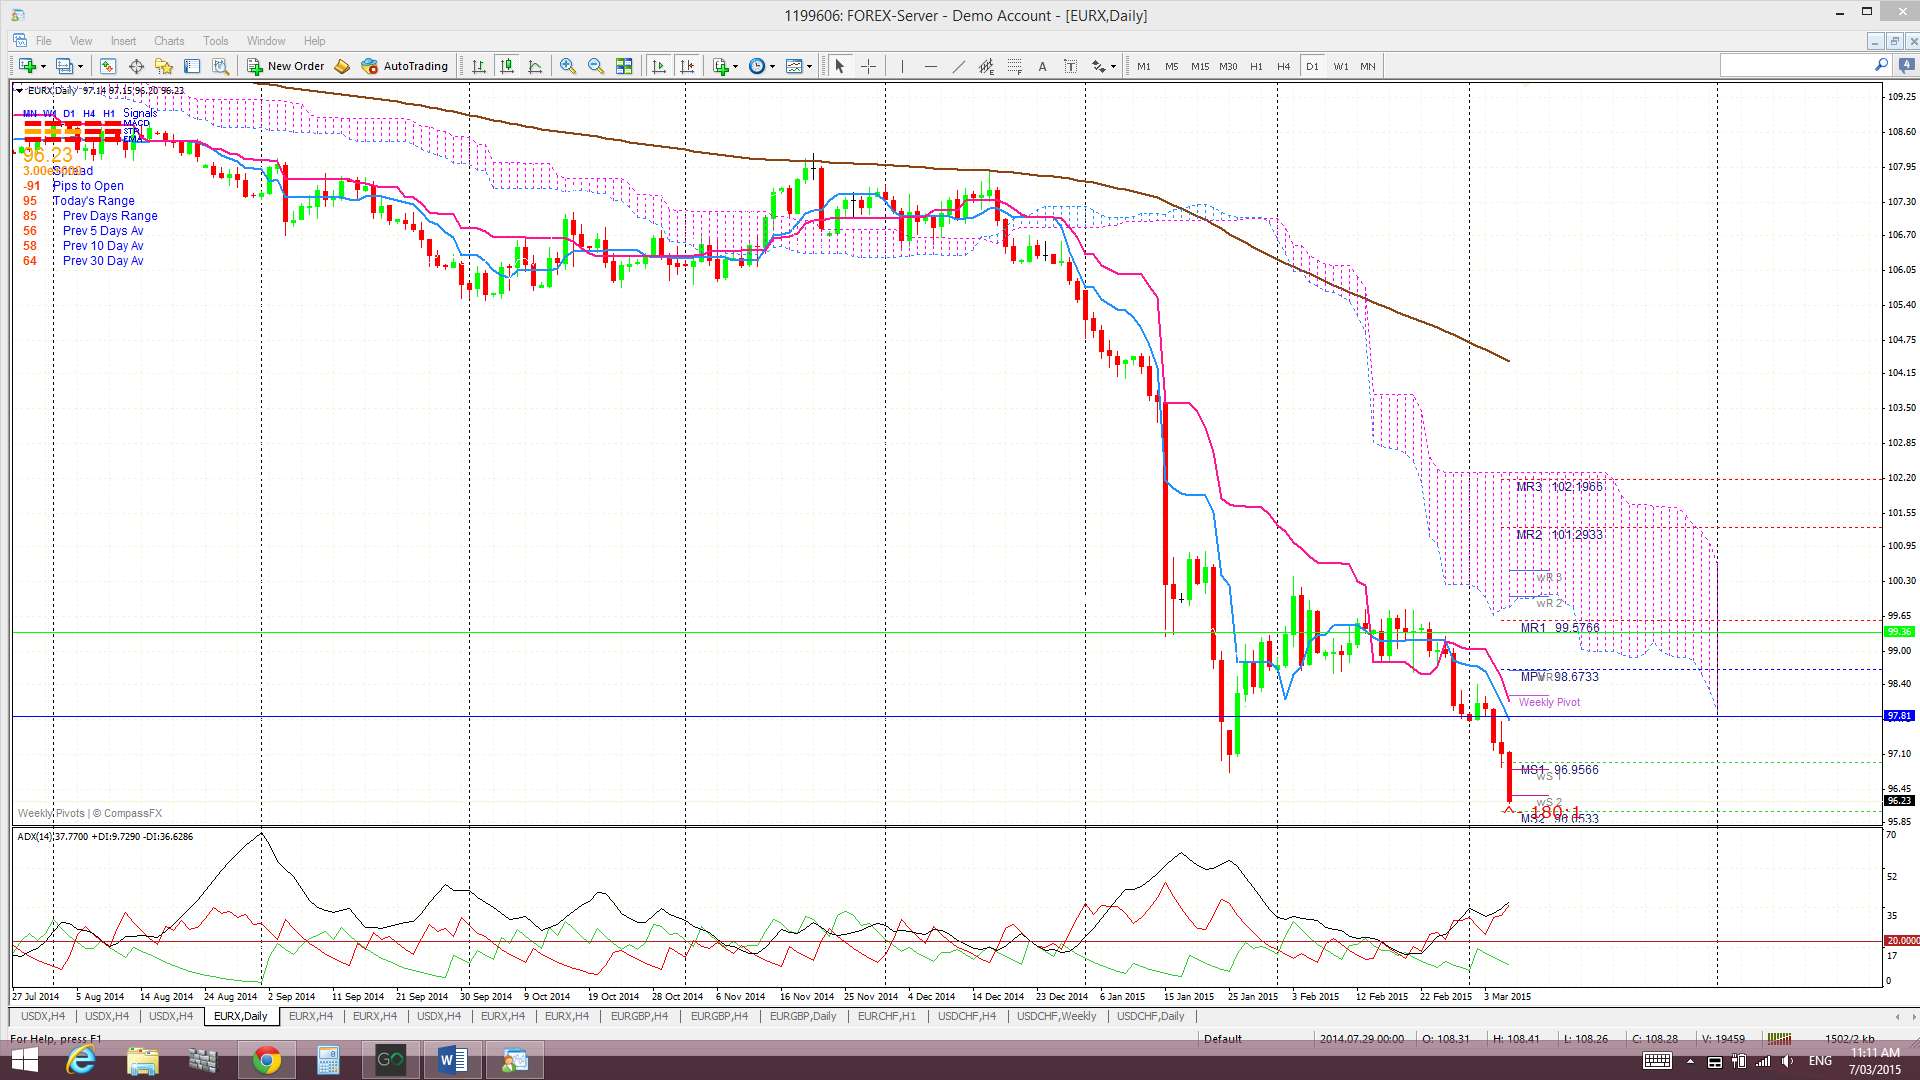
Monthly: The new March candle is currently printing a large bearish candle. There is potential ‘Double Bottom’ support looming as price action heads down to the 96 region.
Monthly Ichimoku: The new March candle is currently trading below the monthly Cloud.

Weekly: The weekly candle closed as a large bearish candle.
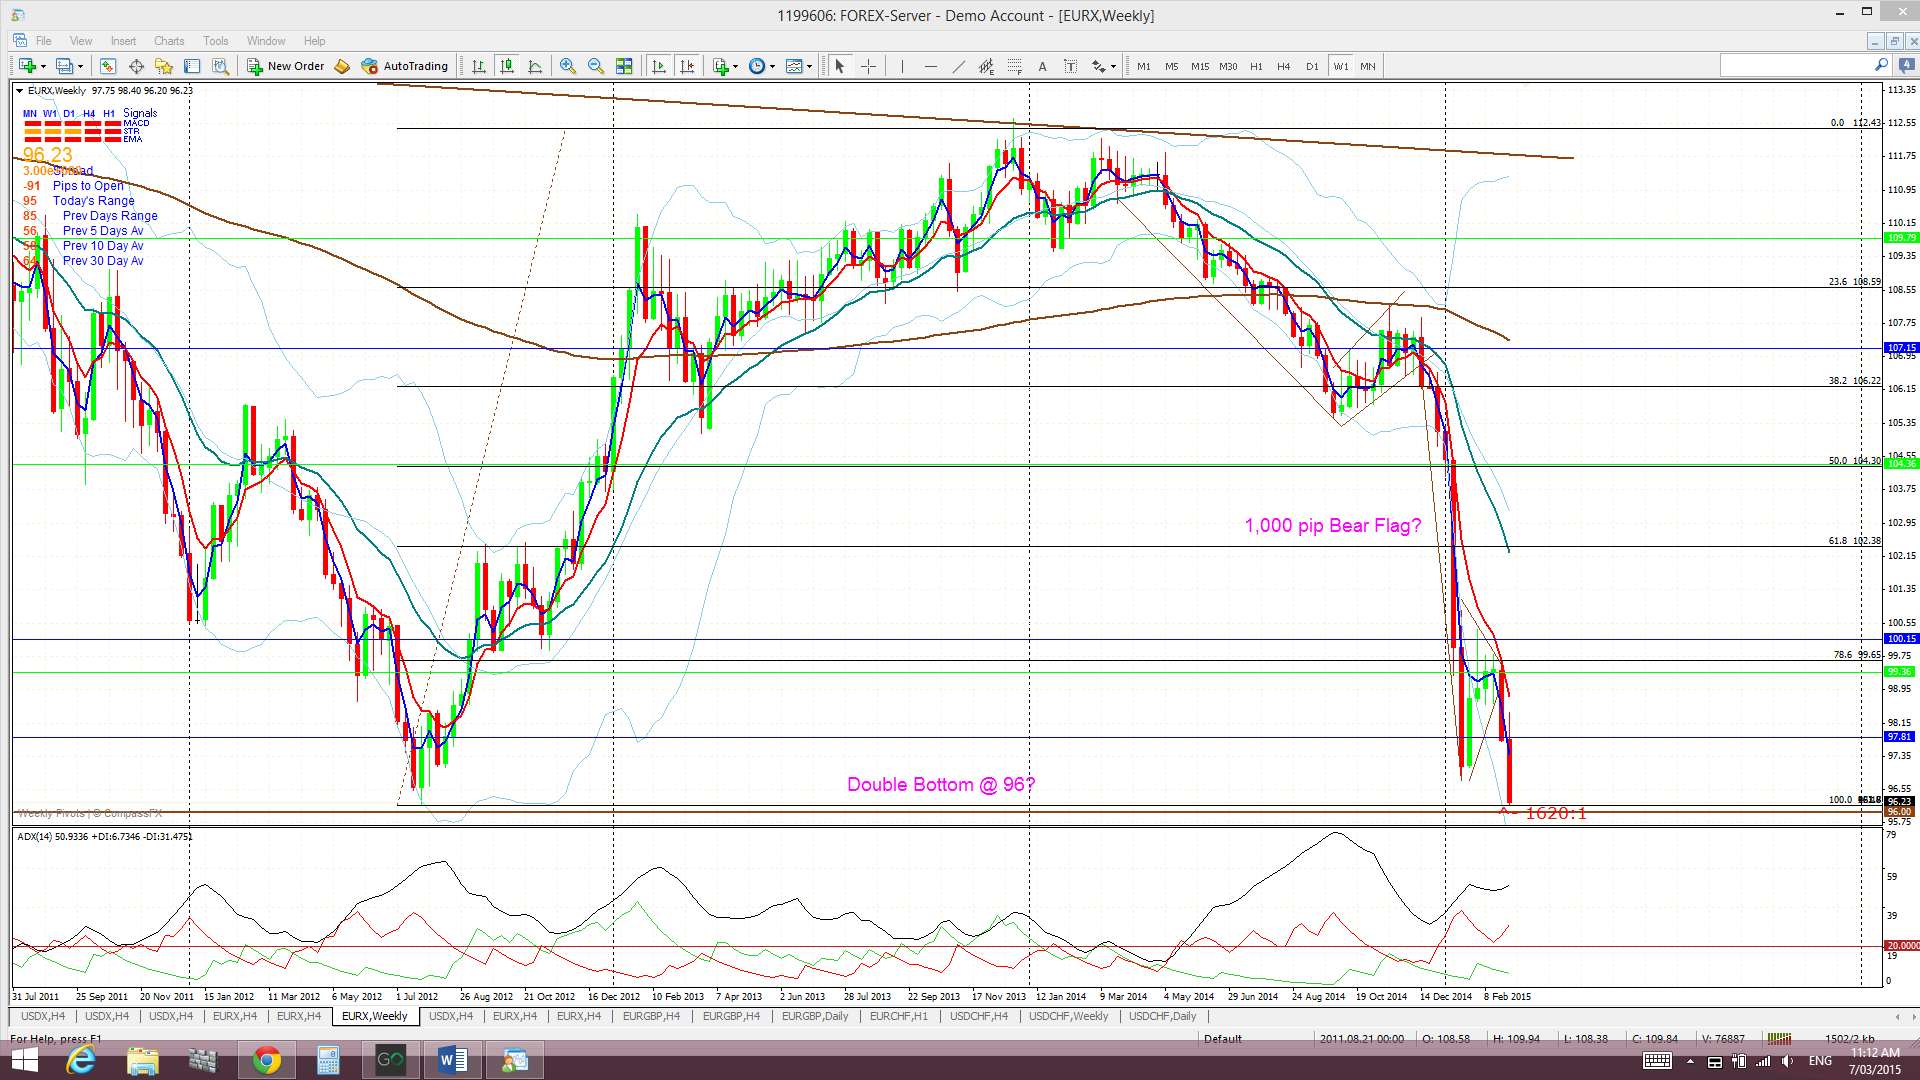
Weekly Ichimoku: Price is trading well below the weekly Cloud.
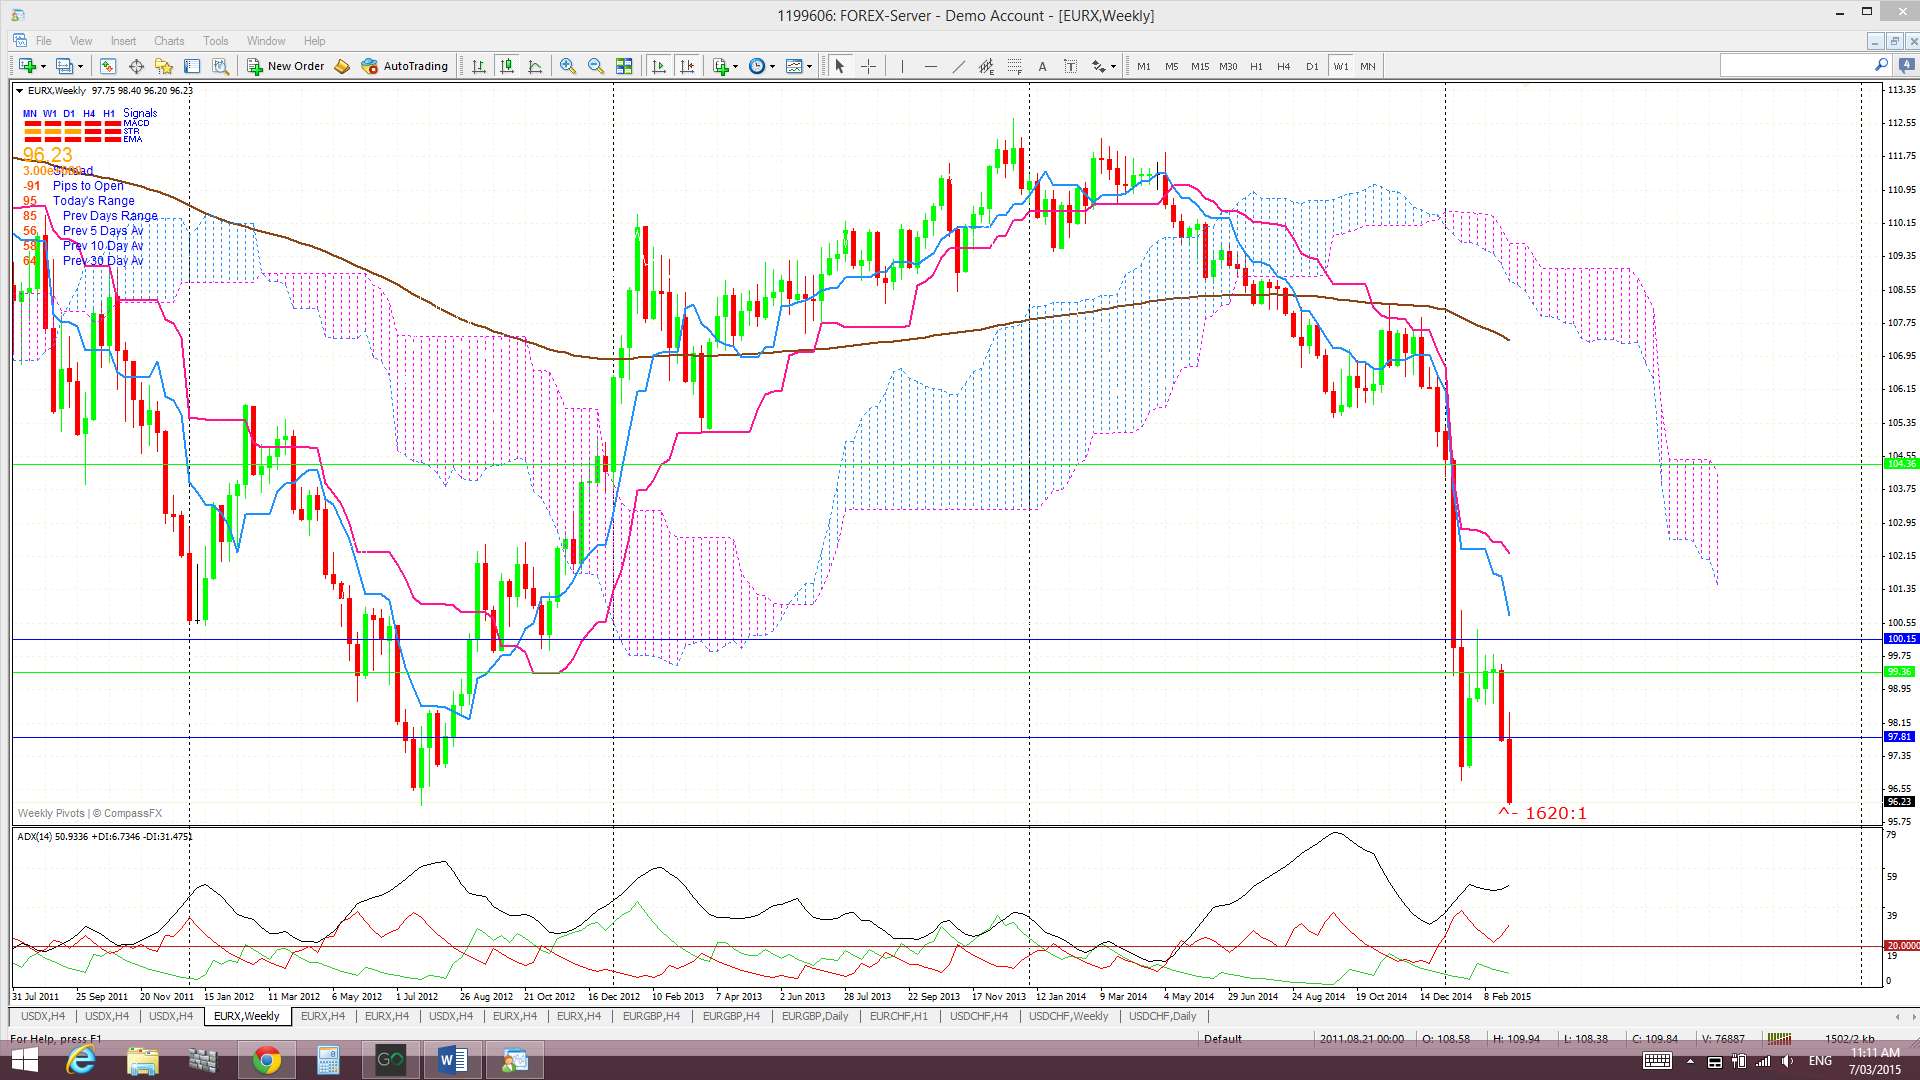
Daily: Price action continued lower following the triangle breakdown from the previous week. ECB QE and upbeat US NFP data have added pressure here. The triangle had been giving this chart a ‘Bear Flag’ appearance and this seems to have evolved. The ‘Flag pole’ here is about 1,000 pips in length and, thus, any bearish follow through move could be expected to extend by the same order of magnitude. With the Flag breakout at around 99 this would then suggest a move down to 89. This would be the level to watch if 96 gives way.
Daily Ichimoku Cloud chart: Price is still trading below the daily Cloud. The bearish Tenkan/Kijun cross remains open.
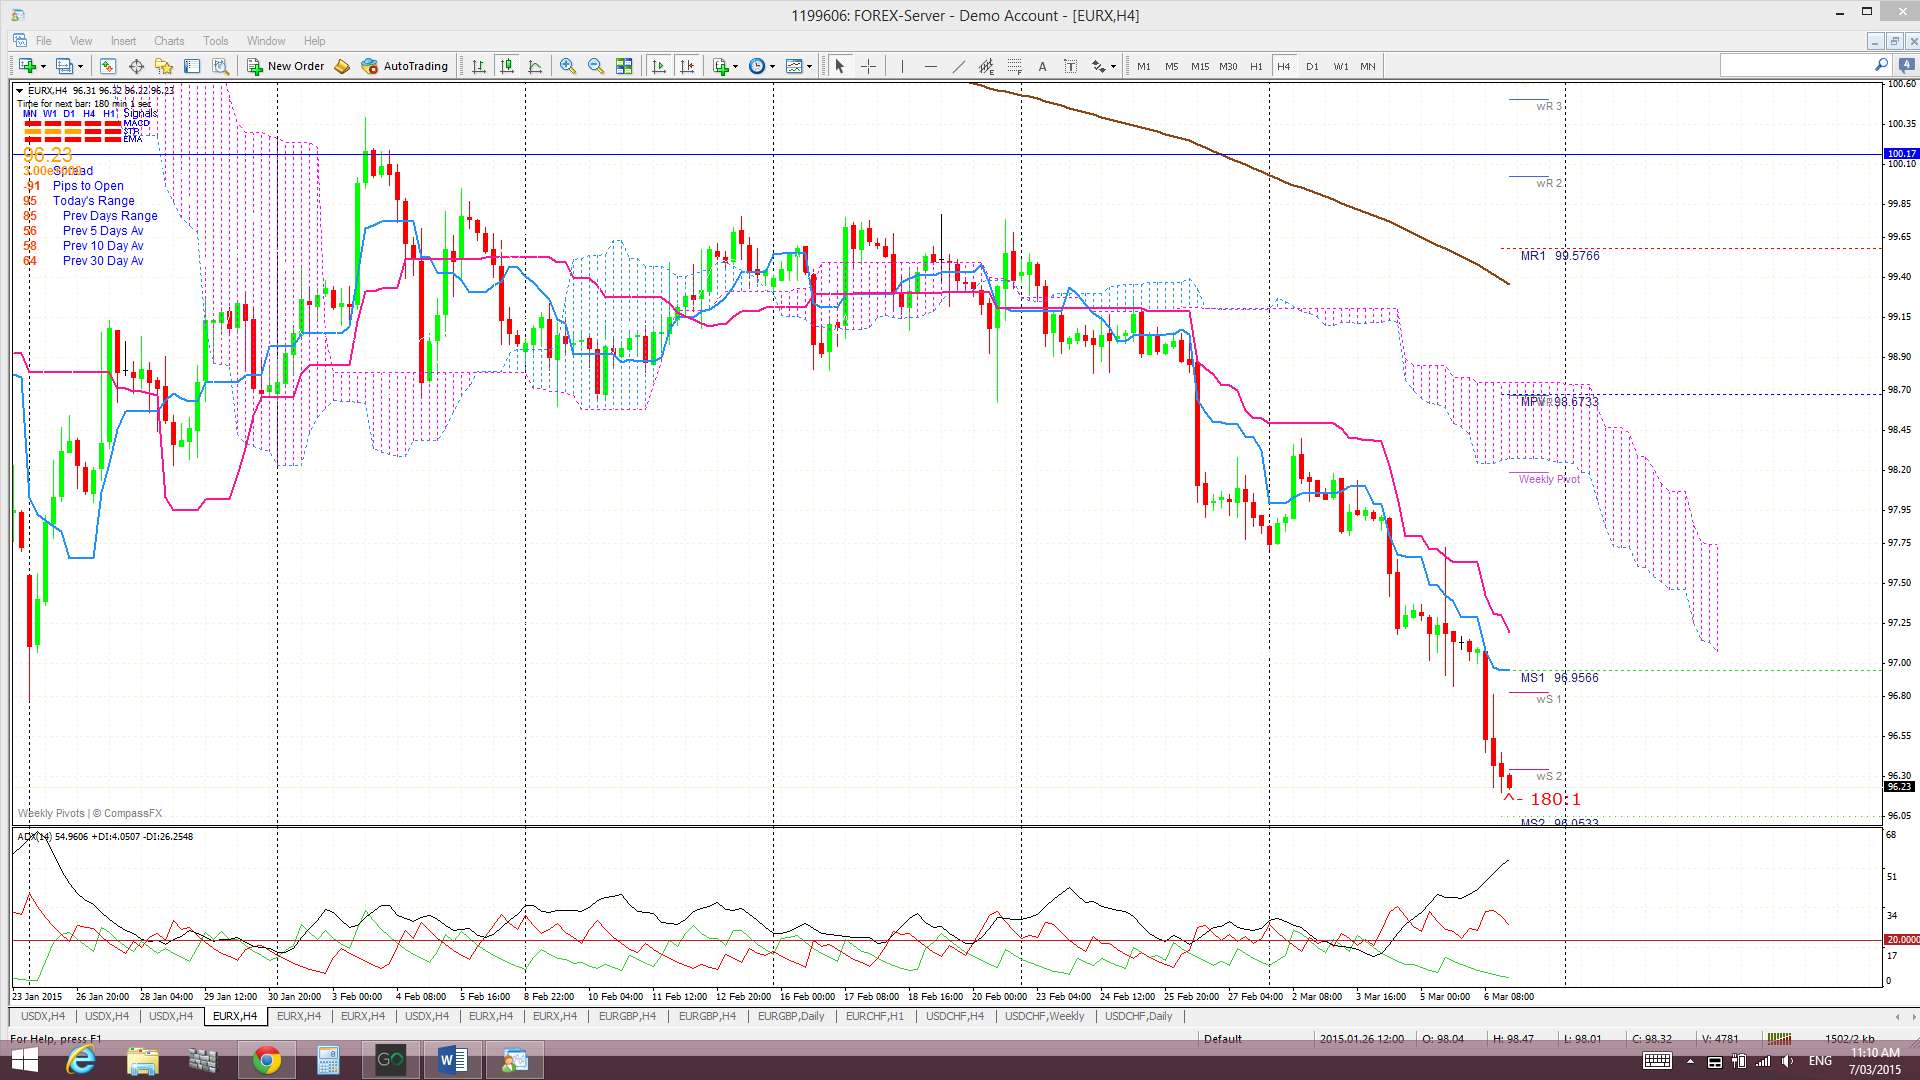
4 hr: Price chopped lower last week.
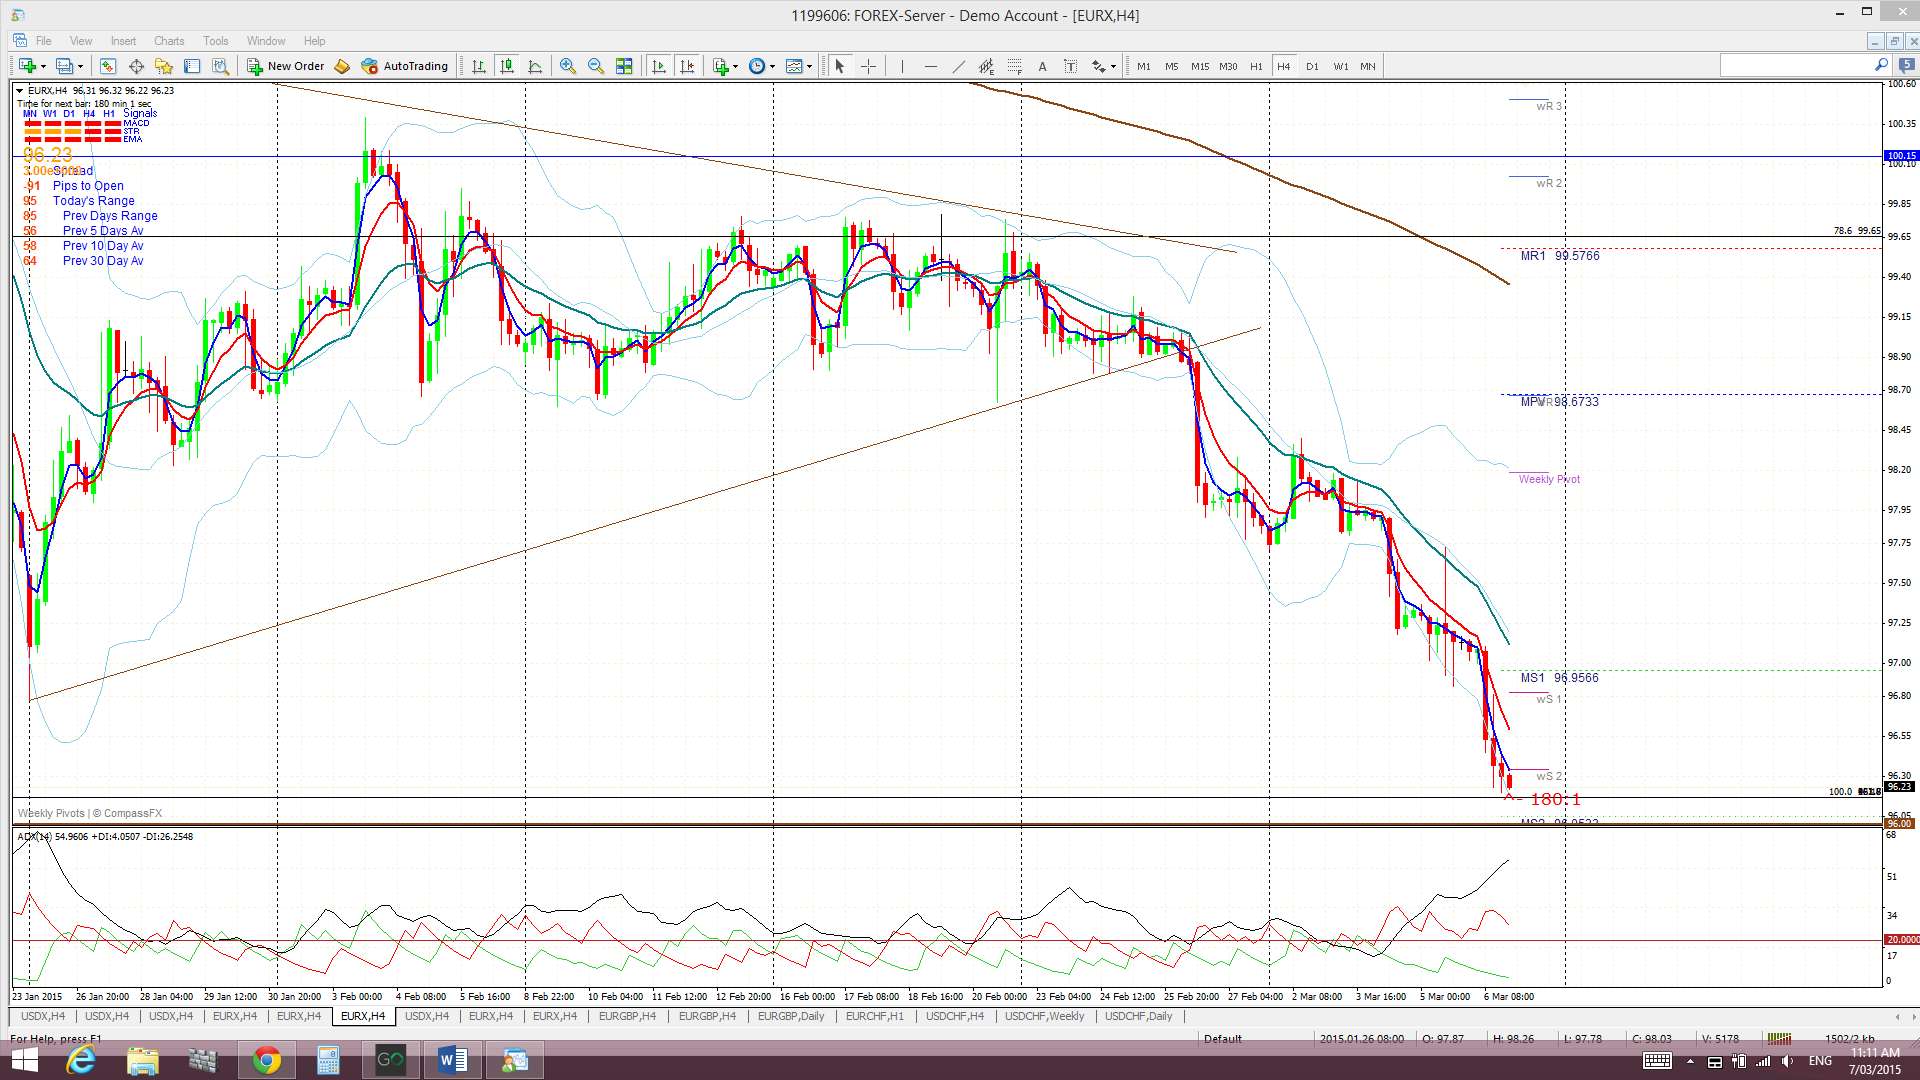
4 hr Ichimoku Cloud chart: The EURX traded below the Cloud all week. This chart is aligned with the daily chart and suggests short EUR.
Comments:
USDX: the USDX closed higher last week and made a bullish trend line break on Thursday above 95.50 supporting a ‘Bull Flag’ breakout. NFP employment numbers surprised to the upside and, although the wages component was disappointing, this was sufficient enough to support a belief that US interest rates will rise sooner rather than later and lifted the USD.
The weekly close above 95.50 would now confirm that the potential bearish ‘Double Top’ has been avoided.
The next bullish target on the USDX would be 101.5 as this is the 61.8% Fib of the weekly chart’s 2002-2008 bear move.
EURX: the EURX closed lower last week in a capitulation type move following the USD rally from Thursday that then continued on Friday. Divergence between the EZ and US economies continues to be a dominant theme with the Eurozone entering a monetary easing cycle with the US emerging from one. The EURX is heading to possible ‘Double Bottom’ support near 96. Any break and hold below 96 would suggest a trip down to 89 as this is the target of the daily chart’s Bear Flag move.
Note: The analysis provided above is based purely on technical analysis of the current chart set ups. As always, Fundamental-style events, by way of any Ukraine, Ebola, Eurozone or Middle East events and/or news announcements, continue to be unpredictable triggers for price movement on the indices. These events always have the potential to undermine any technical analysis.
The post USDX: ‘Bull Flag’ wins over the ‘Double Top’! appeared first on www.forextell.com.