Wed 27th Aug
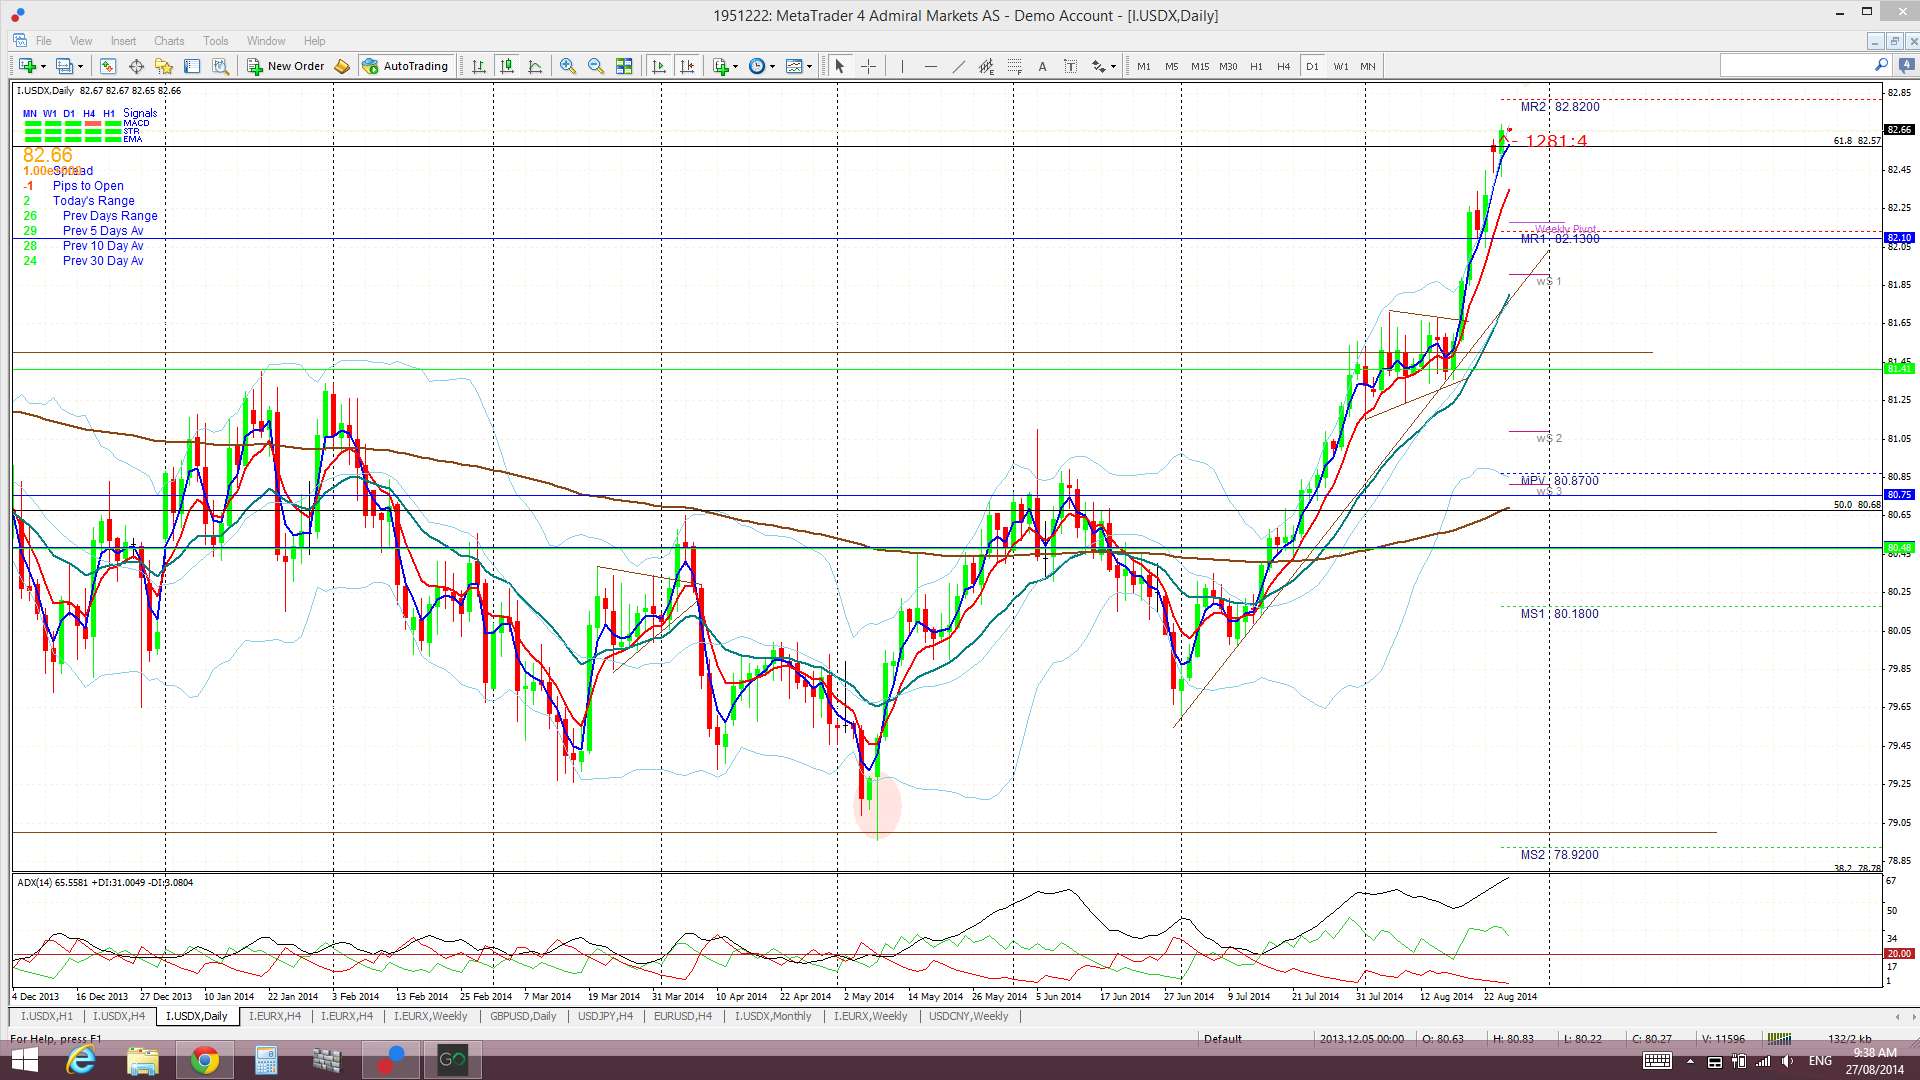
Indices: the USDX has made a daily close above the 61.8% fib level located at 82.50. This is the 61.8% fib of the last major swing move of 2010-2011. Traders really need to see a weekly close above this level to confirm the potential for trend reversal and bullish continuation.
USDX daily:
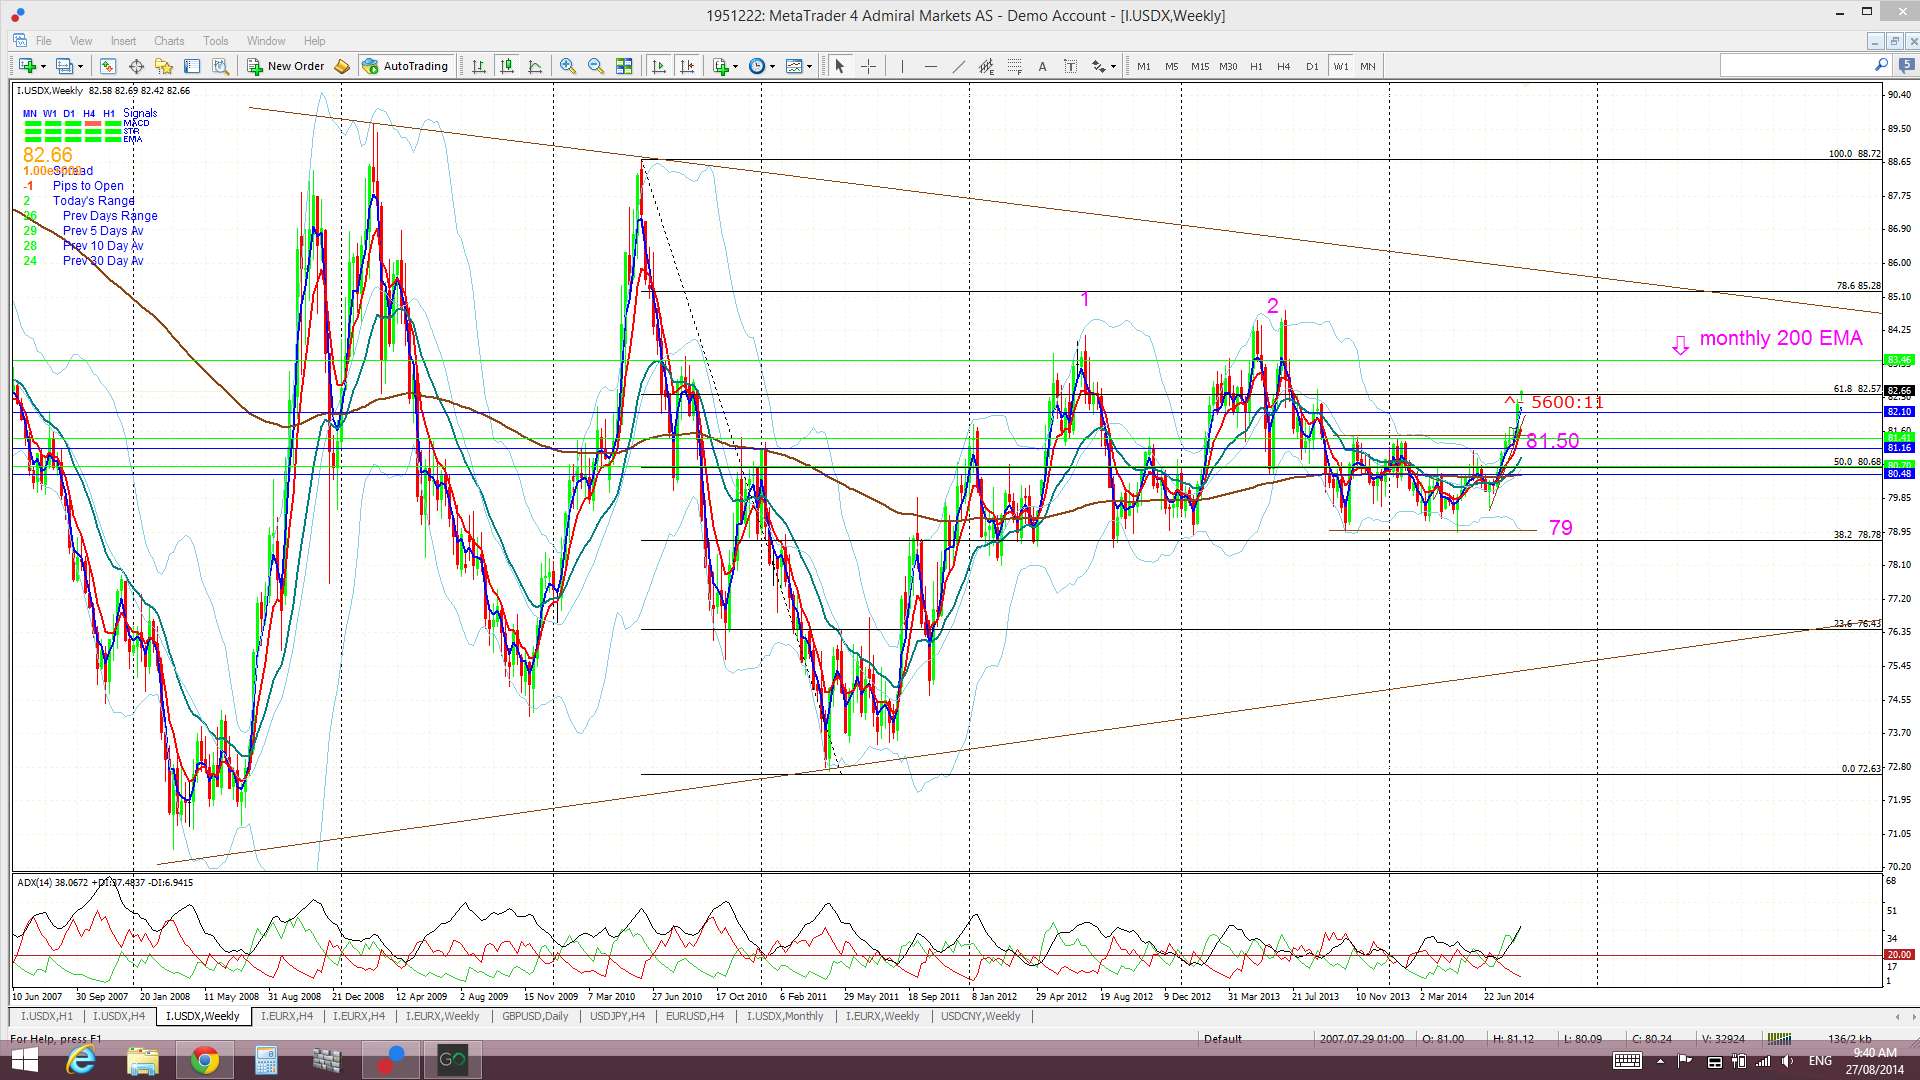
USDX weekly: A weekly close and hold below this 61.8% fib level would suggest continuation to next the next resistance zone for the USDX. The next resistance zone is the monthly 200 EMA near 83.50, another psychological level as well. The significance of this EMA can be seen on the monthly chart below and had been giving previous prints of this index a ‘Double Top’ appearance.
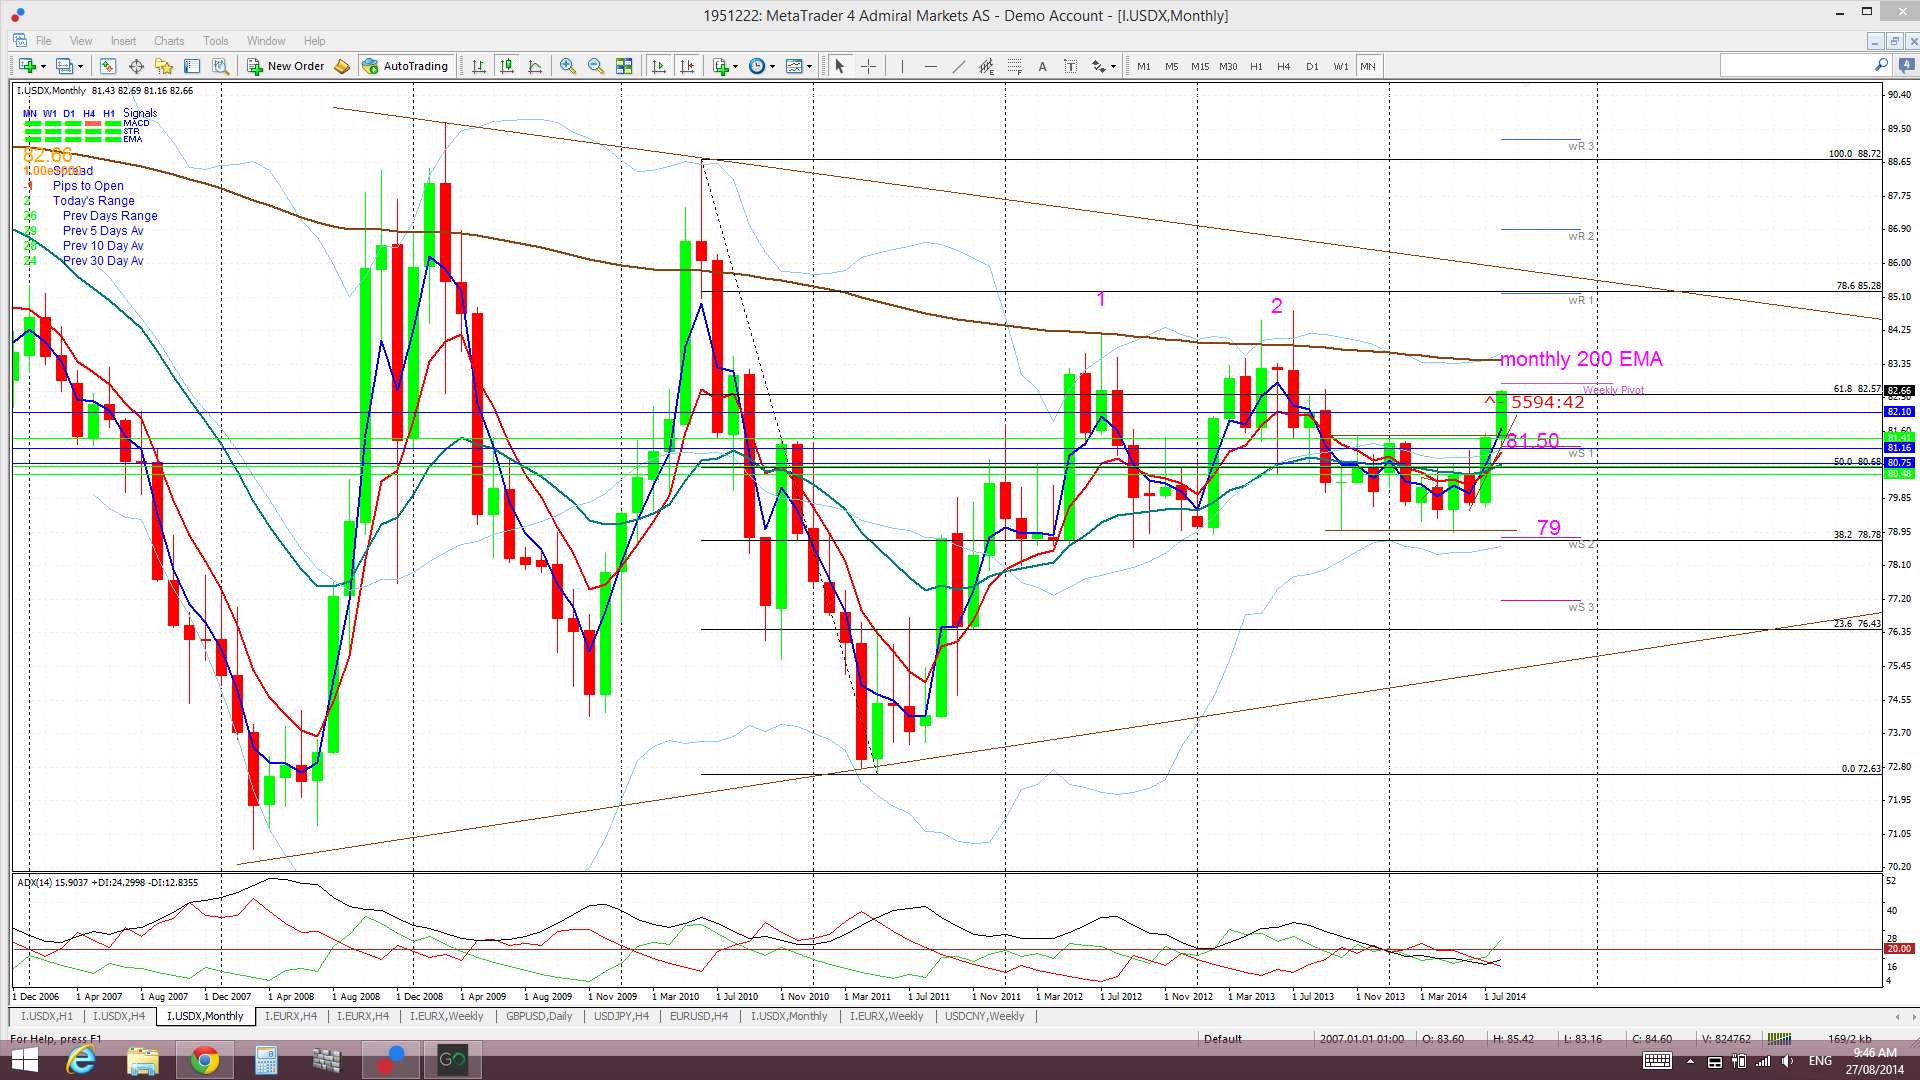
USDX monthly: the monthly 200 EMA is the next major resistance zone and had given previous prints of this chart a ‘Double Top’ appearance:
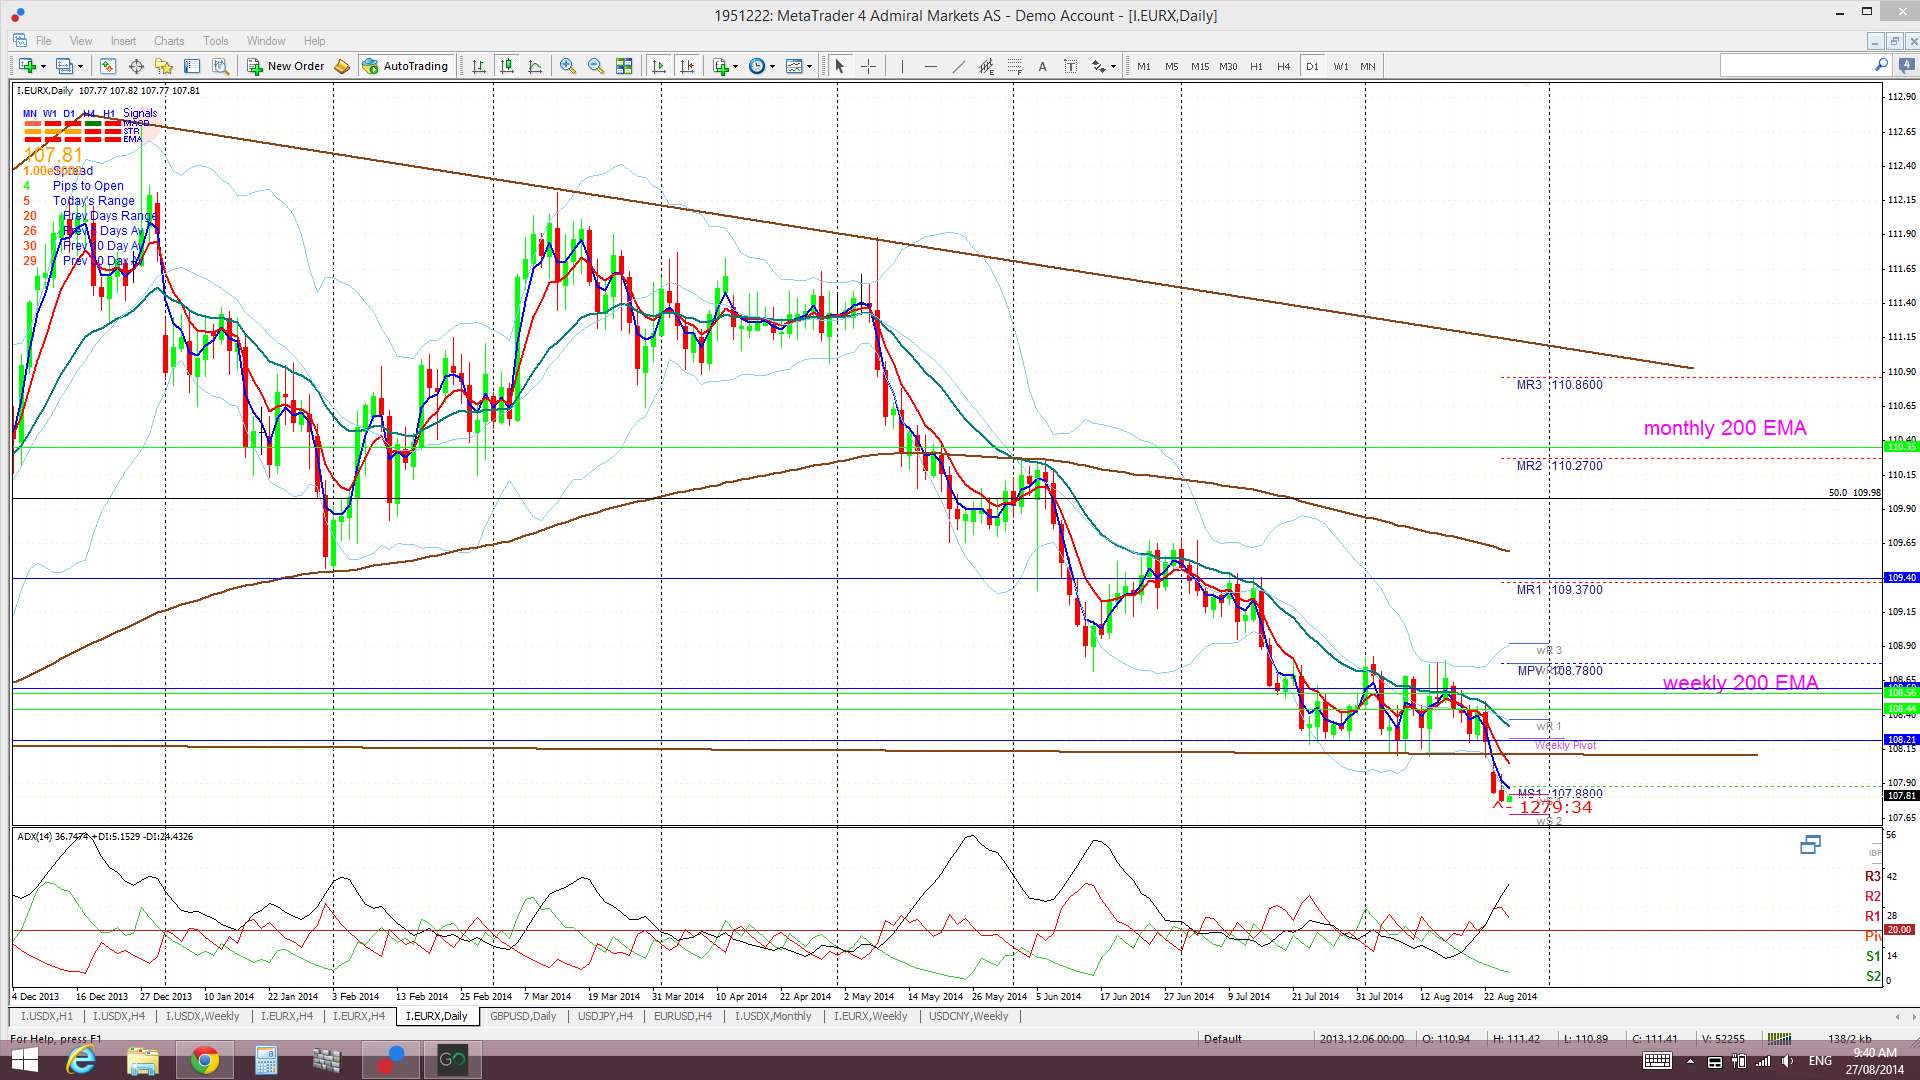
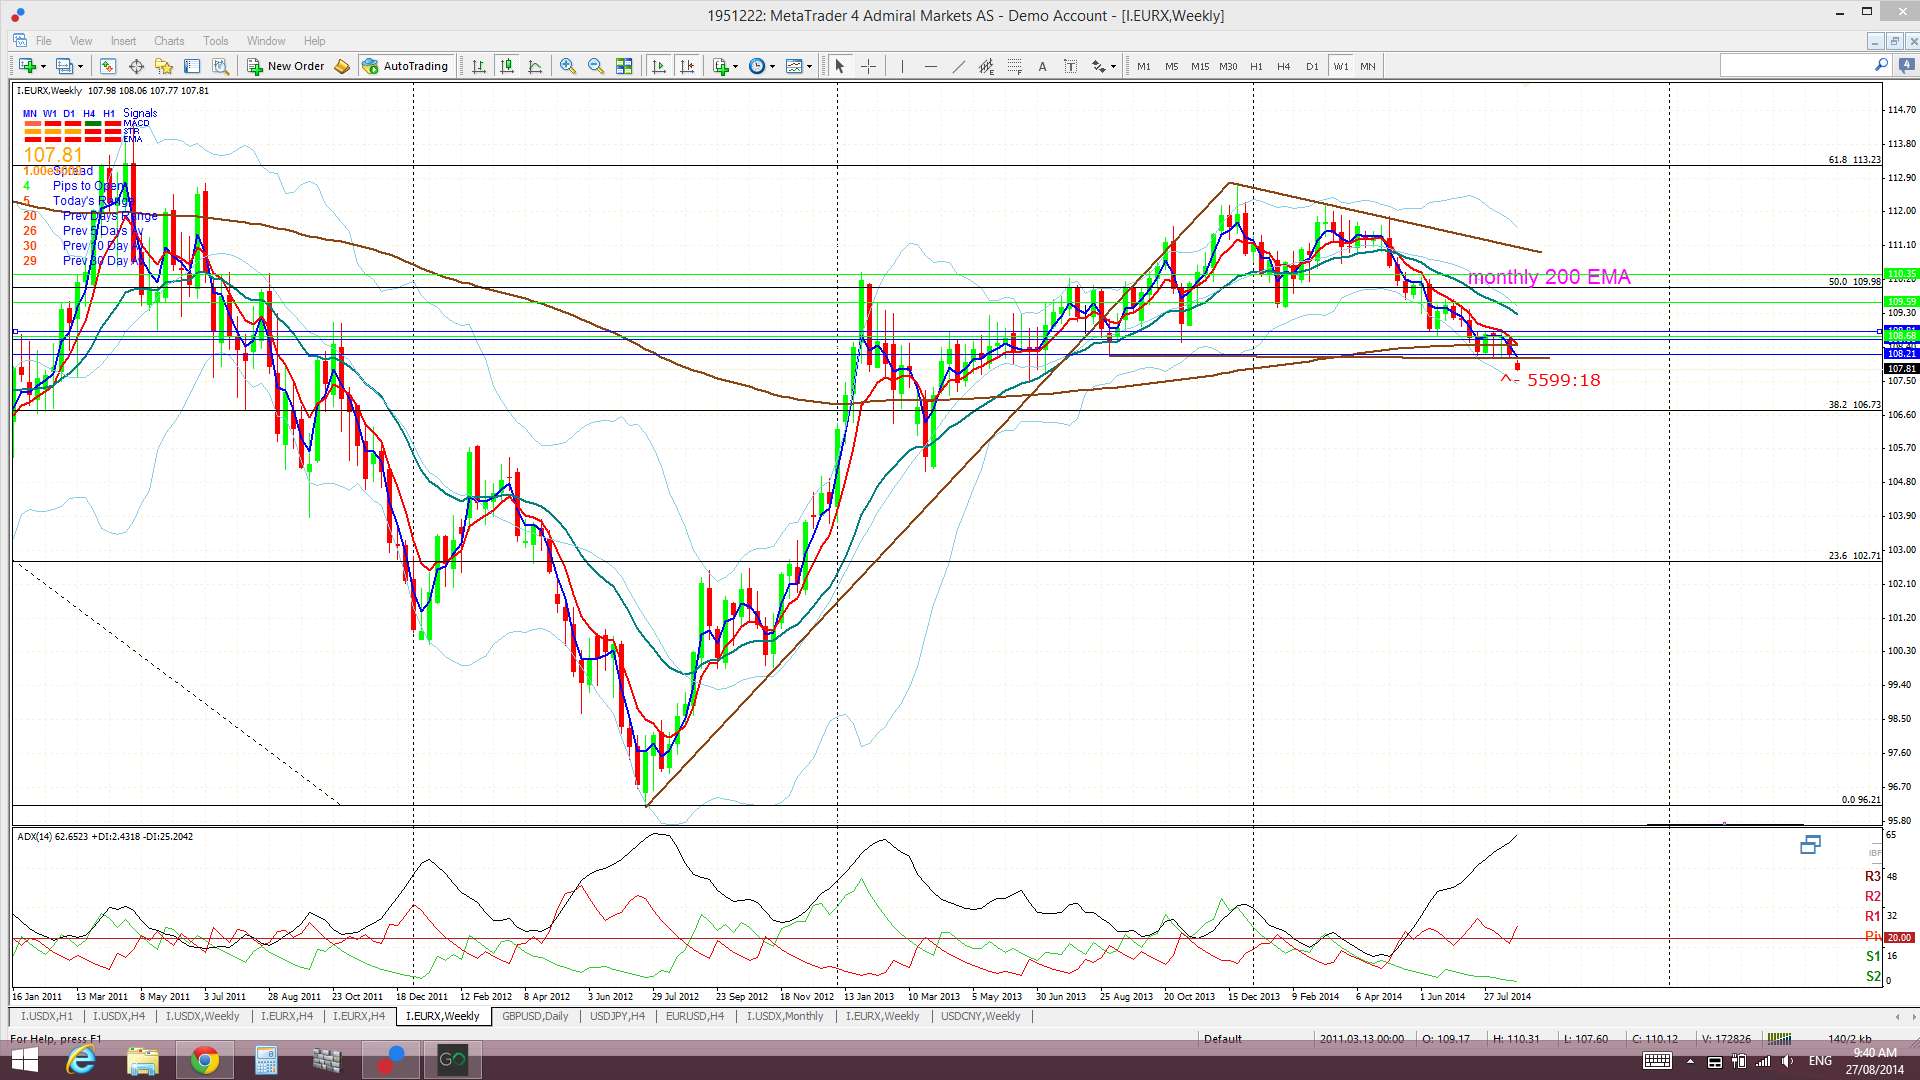
EURX: in the same way as with the EURX, we need to see a weekly candle close on the EURX below the weekly support trend line to support the idea of further bearish follow through:
EURX daily:
EURX weekly:
Summary: levels to watch on both FX indices:
- USDX: the 61.8% fib at 82.50 and then the monthly 200 EMA at 83.50.
- EURX: the weekly support trend line.
The post USDX and EURX: levels to watch. appeared first on www.forextell.com.