Last week: The divergence on the FX indices has made for choppy FX trading conditions on many pairs and, as such, I didn’t receive any new TC signals last week. I’m on the lookout for any further US$ weakness though as this could help to tip the FX indices towards a ‘Risk On‘ alignment.
This week:
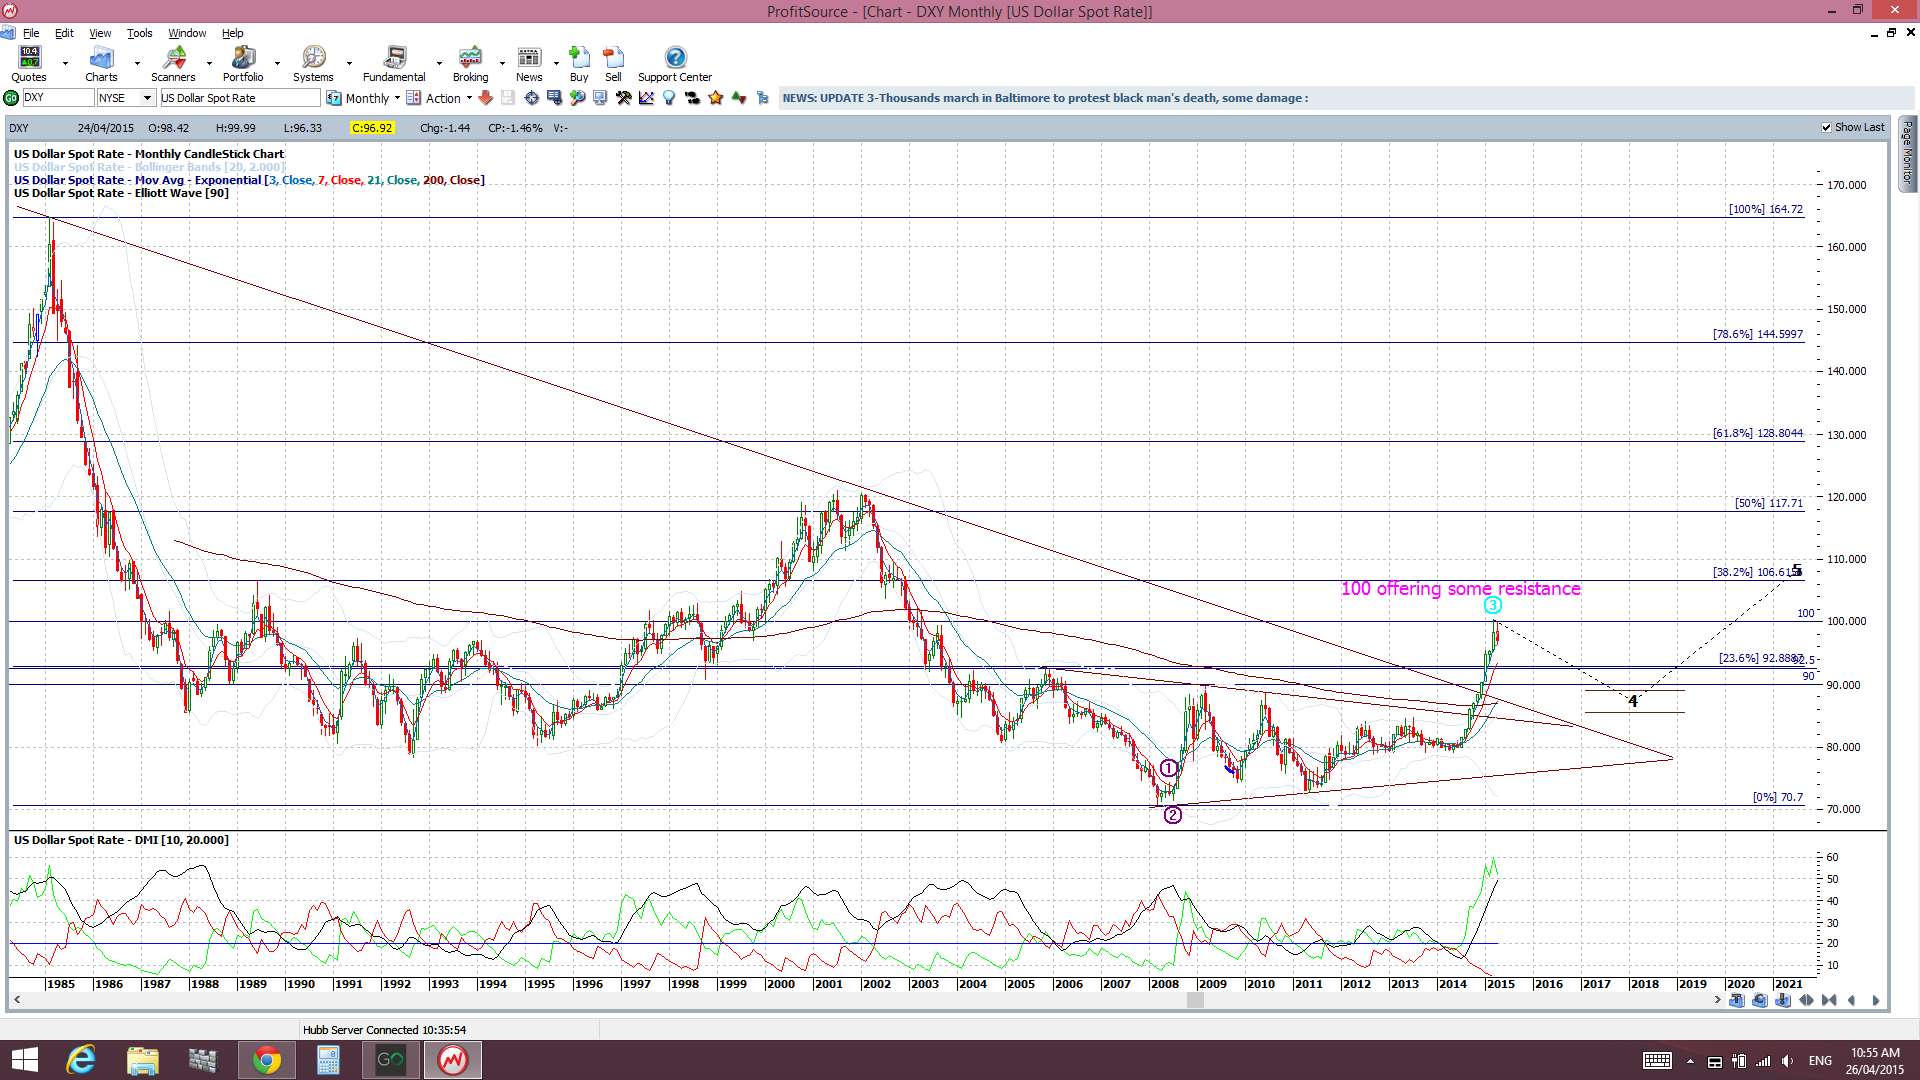
The US$ weakened last week but I am still waiting for a decisive breakout move either above 100 or below 95.5. An update on the FX Indices can be found through this link.
Cross Pairs: Whilst the US$ remains range bound below 100 but above 95.50 the appeal of some cross pairs has increased. This is even more so the case with recent strength seen across the EUR and GBP. This situation may be short lived but it pays to keep an open mind and be prepared for any shift in sentiment. This week I include reviews of the GBP/AUD, EUR/NZD and GBP/NZD but may expand my analysis to cover other cross pairs later in the week if this power shift gains momentum.
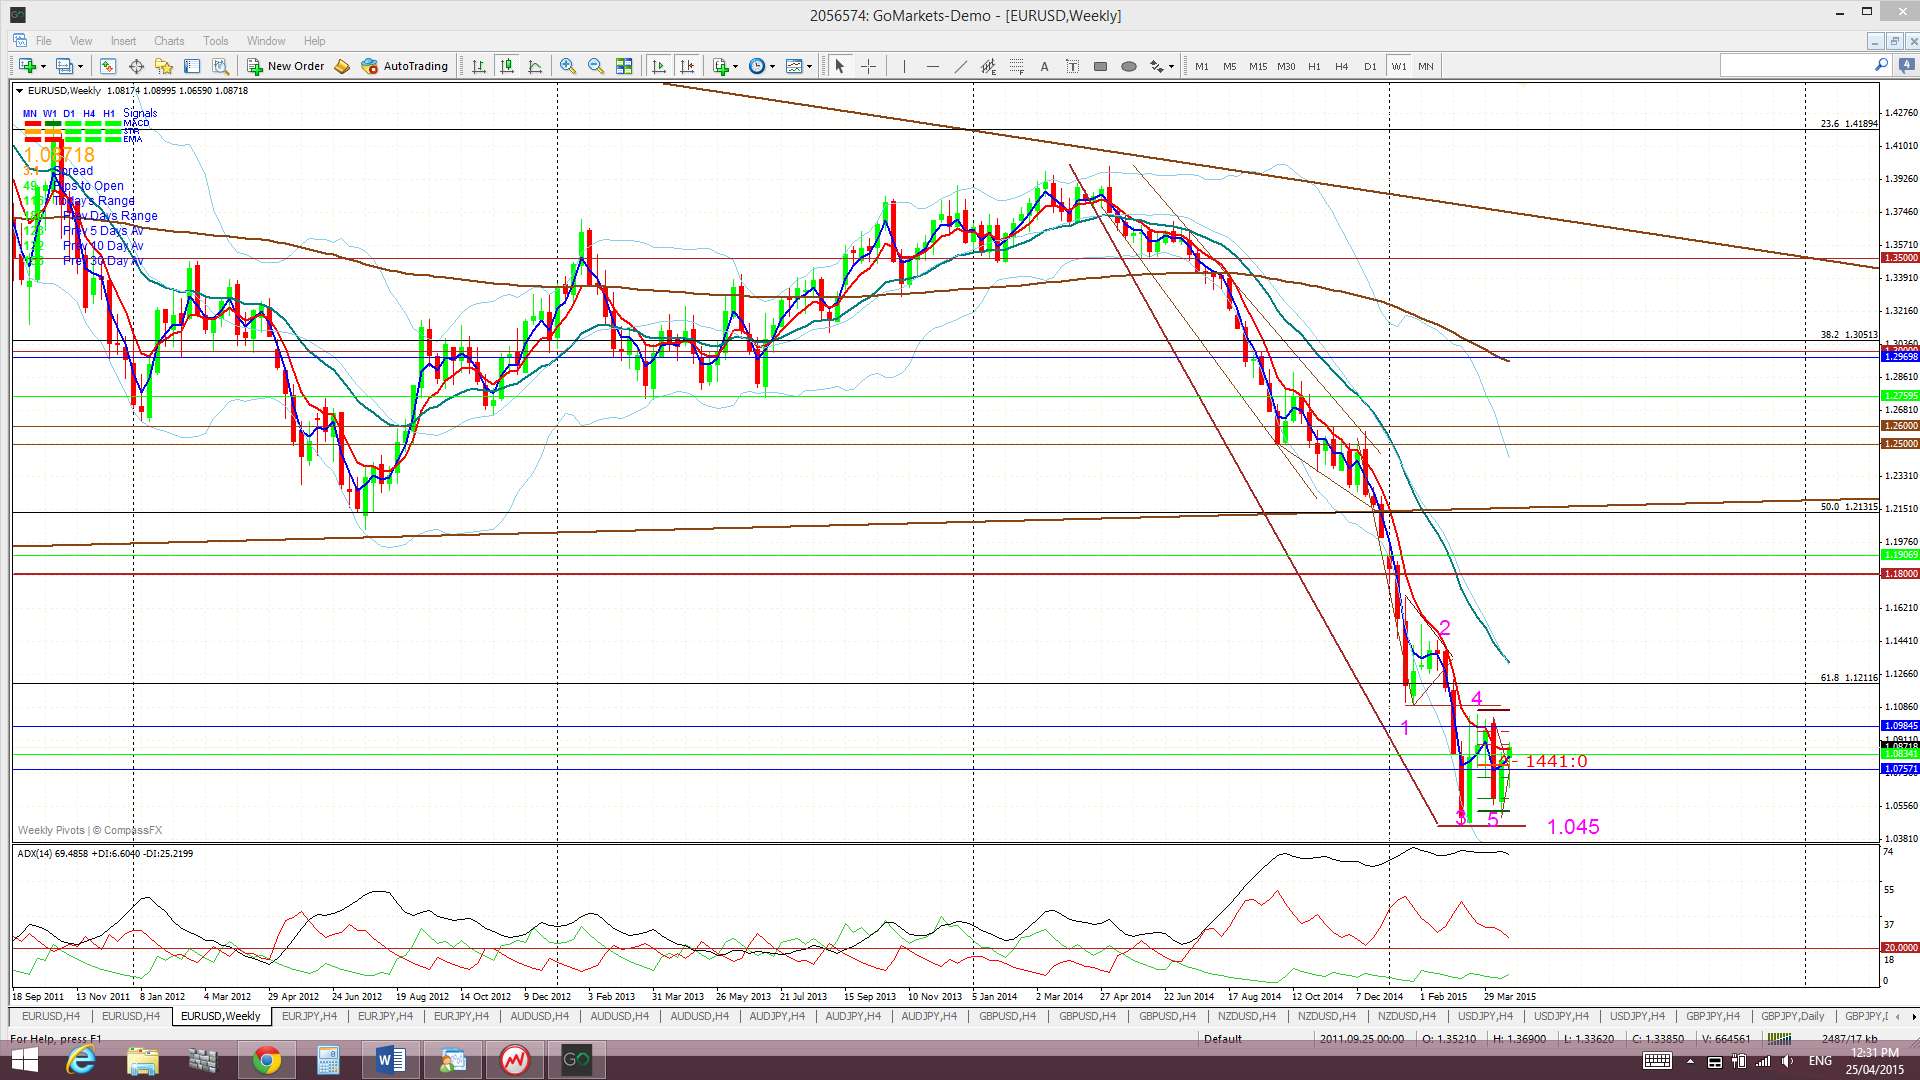
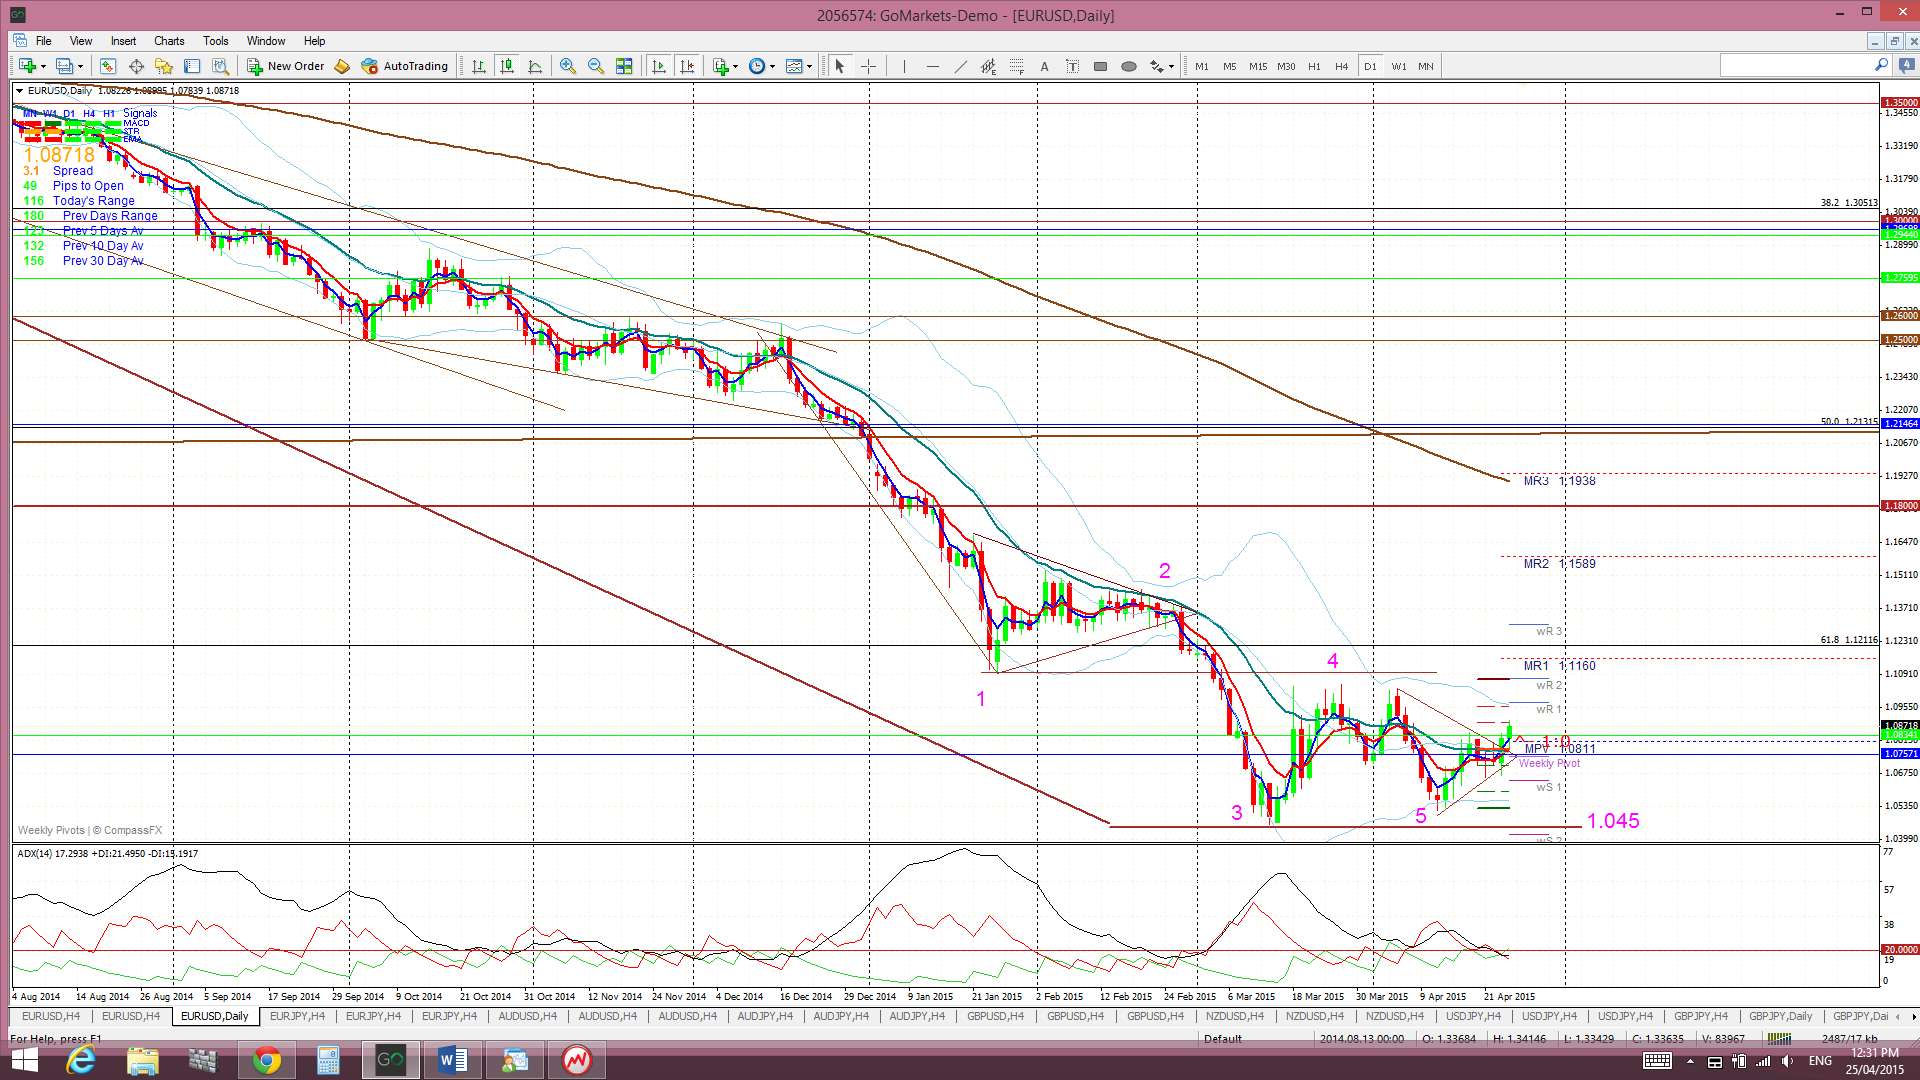
EUR/USD: is this recent choppiness above 1.045 support simply helping a weekly-chart Bear Flag to form OR is this pair carving out a base here?
Cable: this has bounced and is back above 1.50. How much further could it bounce, if at all, prior to the UK election? Technical theory may help locate targets here.
Monthly candles will close on Thursday so watch for these and new monthly pivots on Friday.
Silver & Gold: both of these metals had a bearish week despite the weaker US$. Money has been flowing preferentially into stocks but any continued US$ weakness after this week’s FOMC could help these two to reverse their fortune.
There is a lot of high impact data for the US$ next week and the most important of these include Wednesday’s FOMC and the Federal Funds Rate announcement. Two other central Banks report on interest rates too this week with both New Zealand and Japan announcing on Thursday.
Kiwi: the Kiwi has been weak of late and the RBNZ will announce their next interest rate decision on Thursday. Watch for any change or commentary here to impact Kiwi price action. Any continued NZD weakness would bring cross pairs like the GBP/NZD and EUR/NZD into greater focus.
Events in the Ukraine and the Middle East, as well as with Greek Debt talks, continue to have the potential to undermine any developing ‘risk’ appetite and need to be monitored.
Stocks and broader market sentiment:
Global stocks had another bullish week with the S&P500 and NASDAQ closing at new record highs. I mentioned last we that we could start to see some FOMO action, that is, Fear Of Missing Out action, and momentum seems to be pointing that way!
A number of stock indices and ETFs are making bullish head-way:
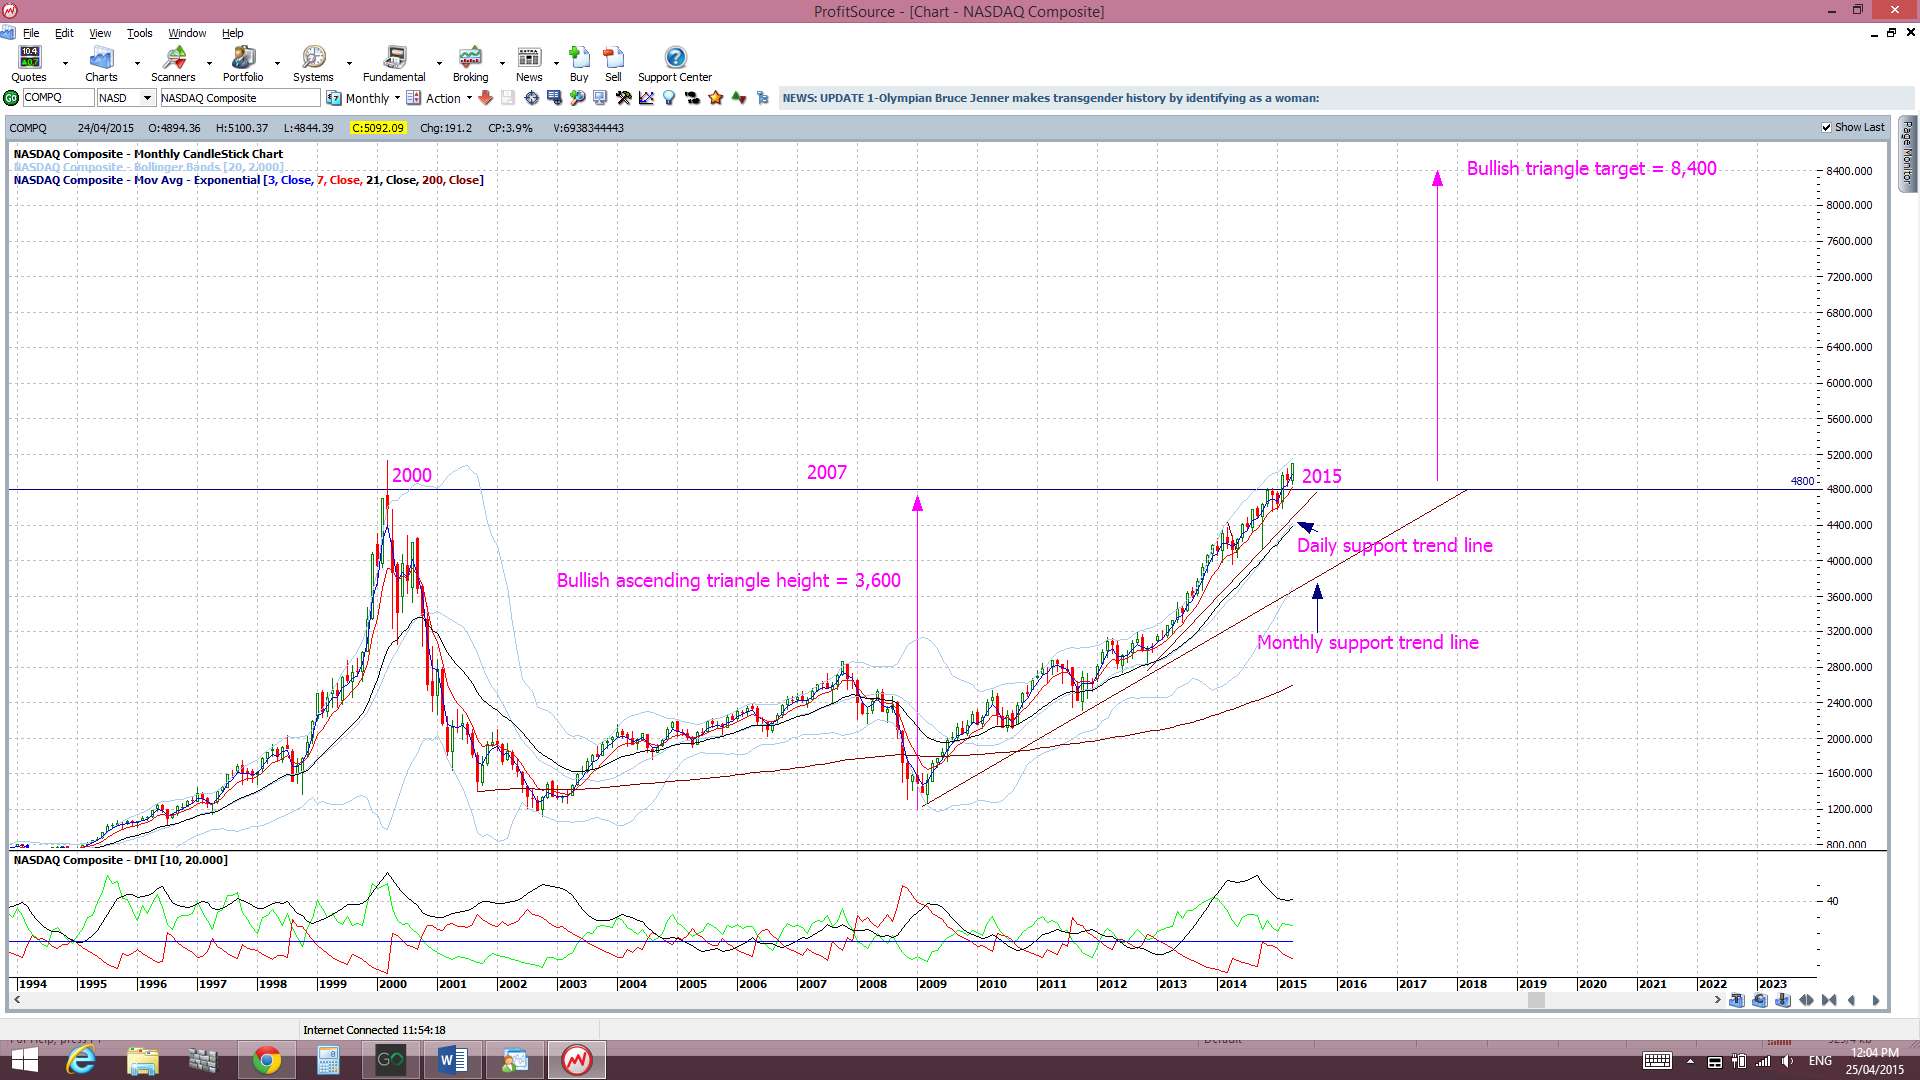
- The NASDAQ might just keep going and not test 4,800:
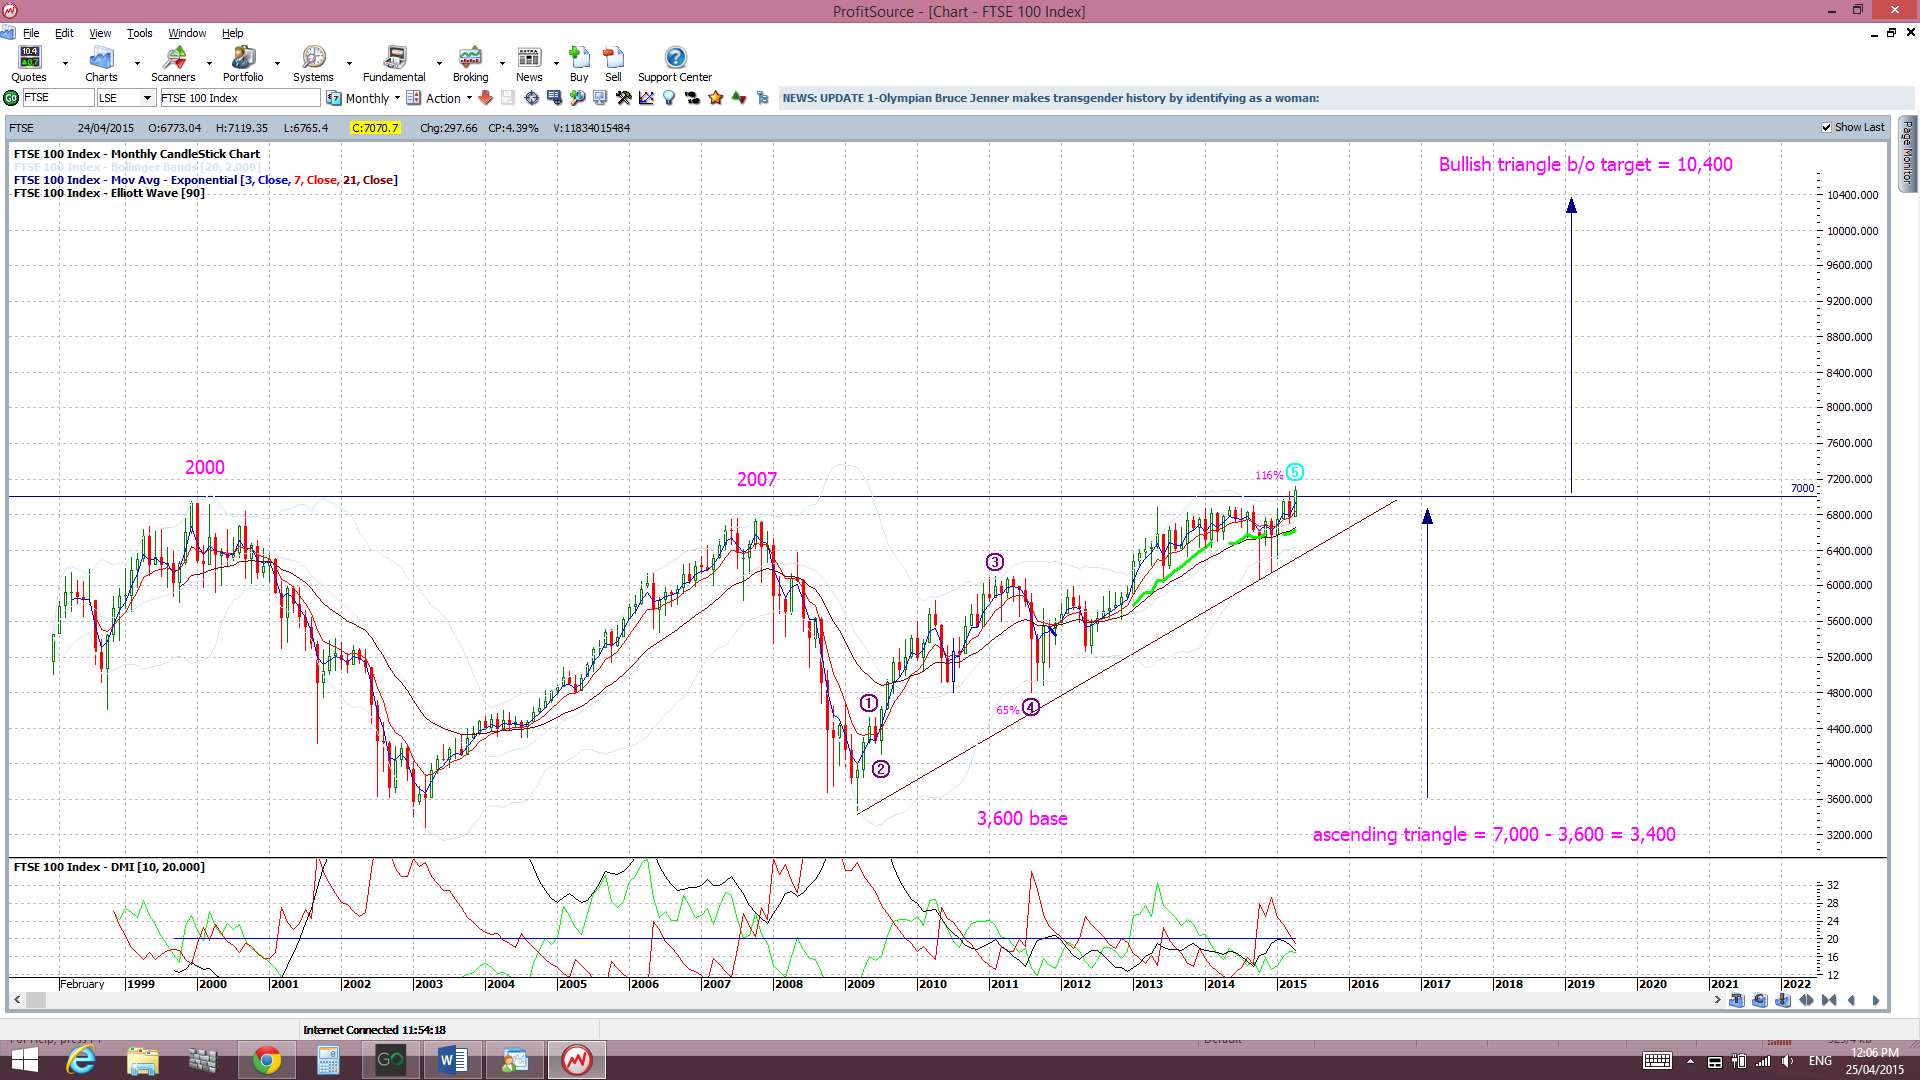
- FTSE: watch on Friday to see if this makes a monthly close above 7,000 resistance:
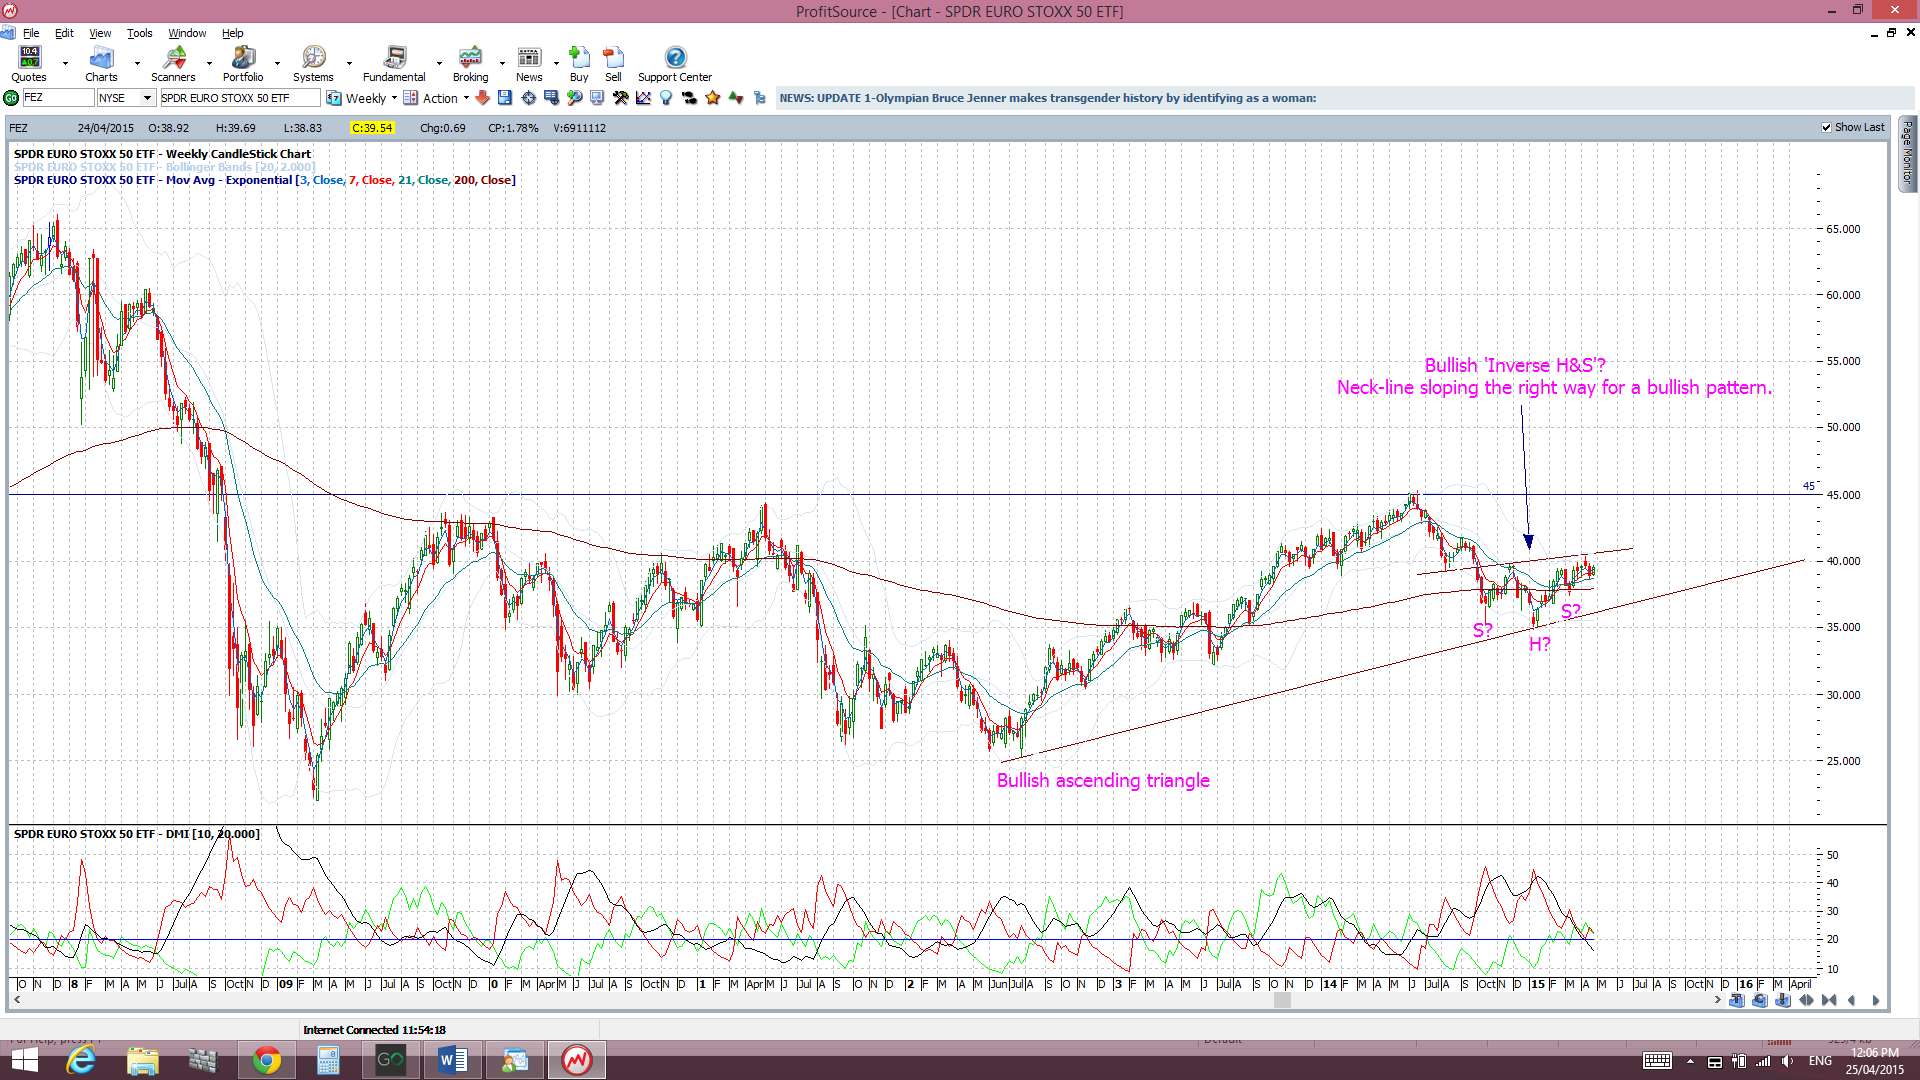
- FEZ: watch to see if the EURO STOXX 50 ETF can make any bullish breakout:
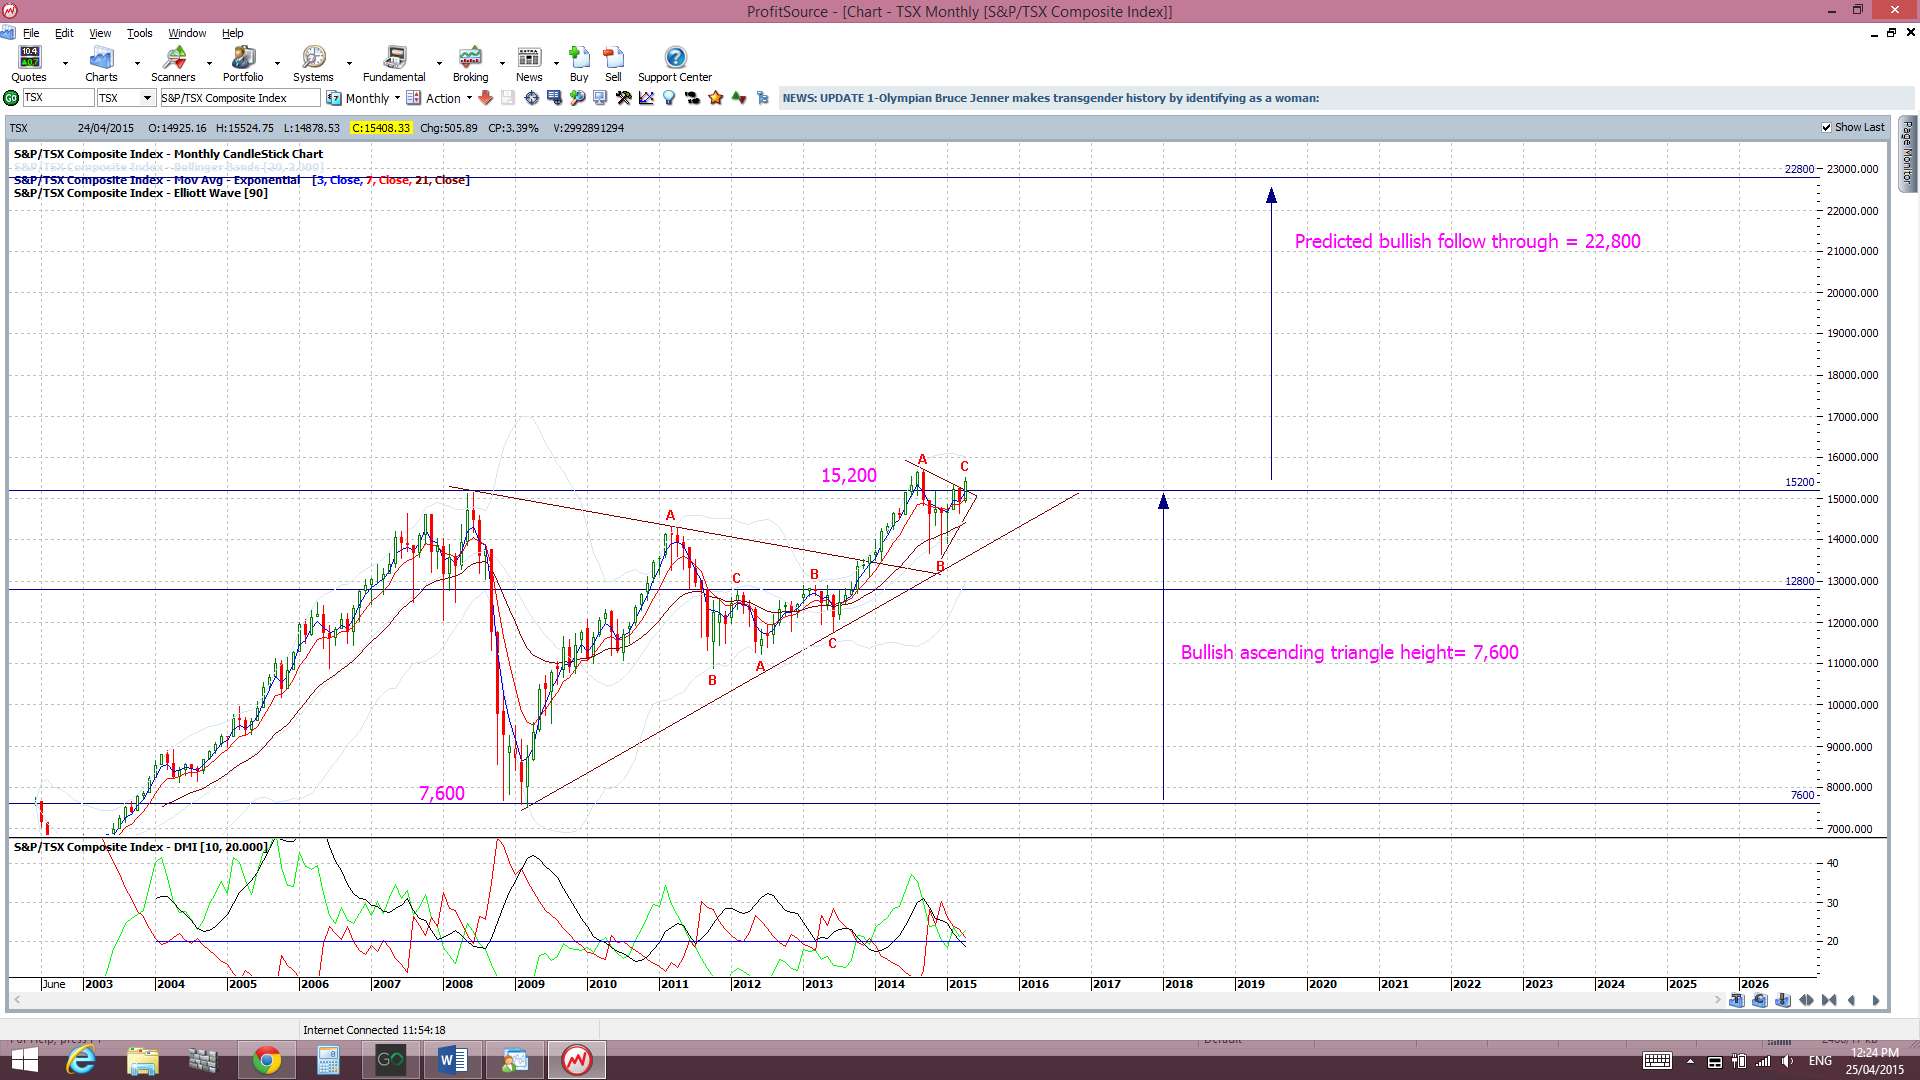
- TSX: Canada’s Toronto market looks set to make a monthly triangle breakout:
Thus, with all of this, I continue to watch out for further clues as to any new momentum move, long or short though! In particular I’m looking out for:
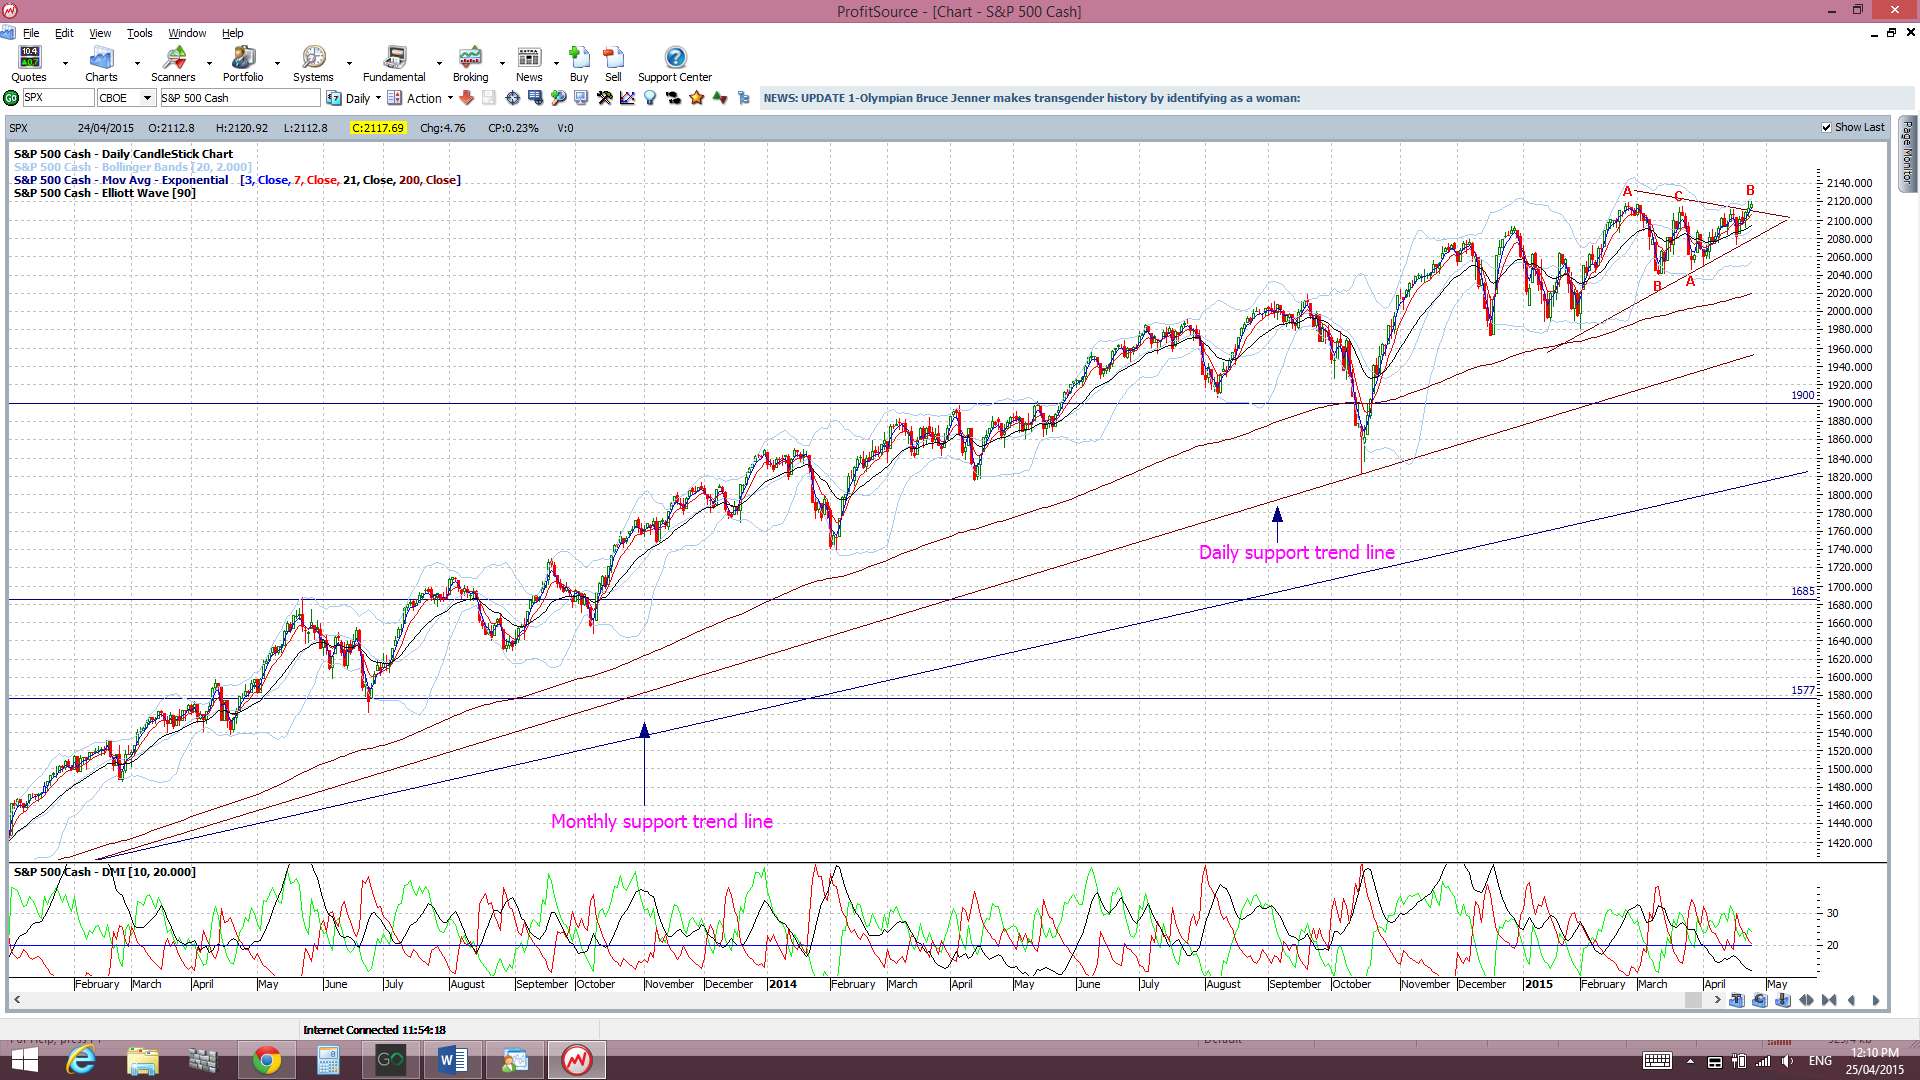
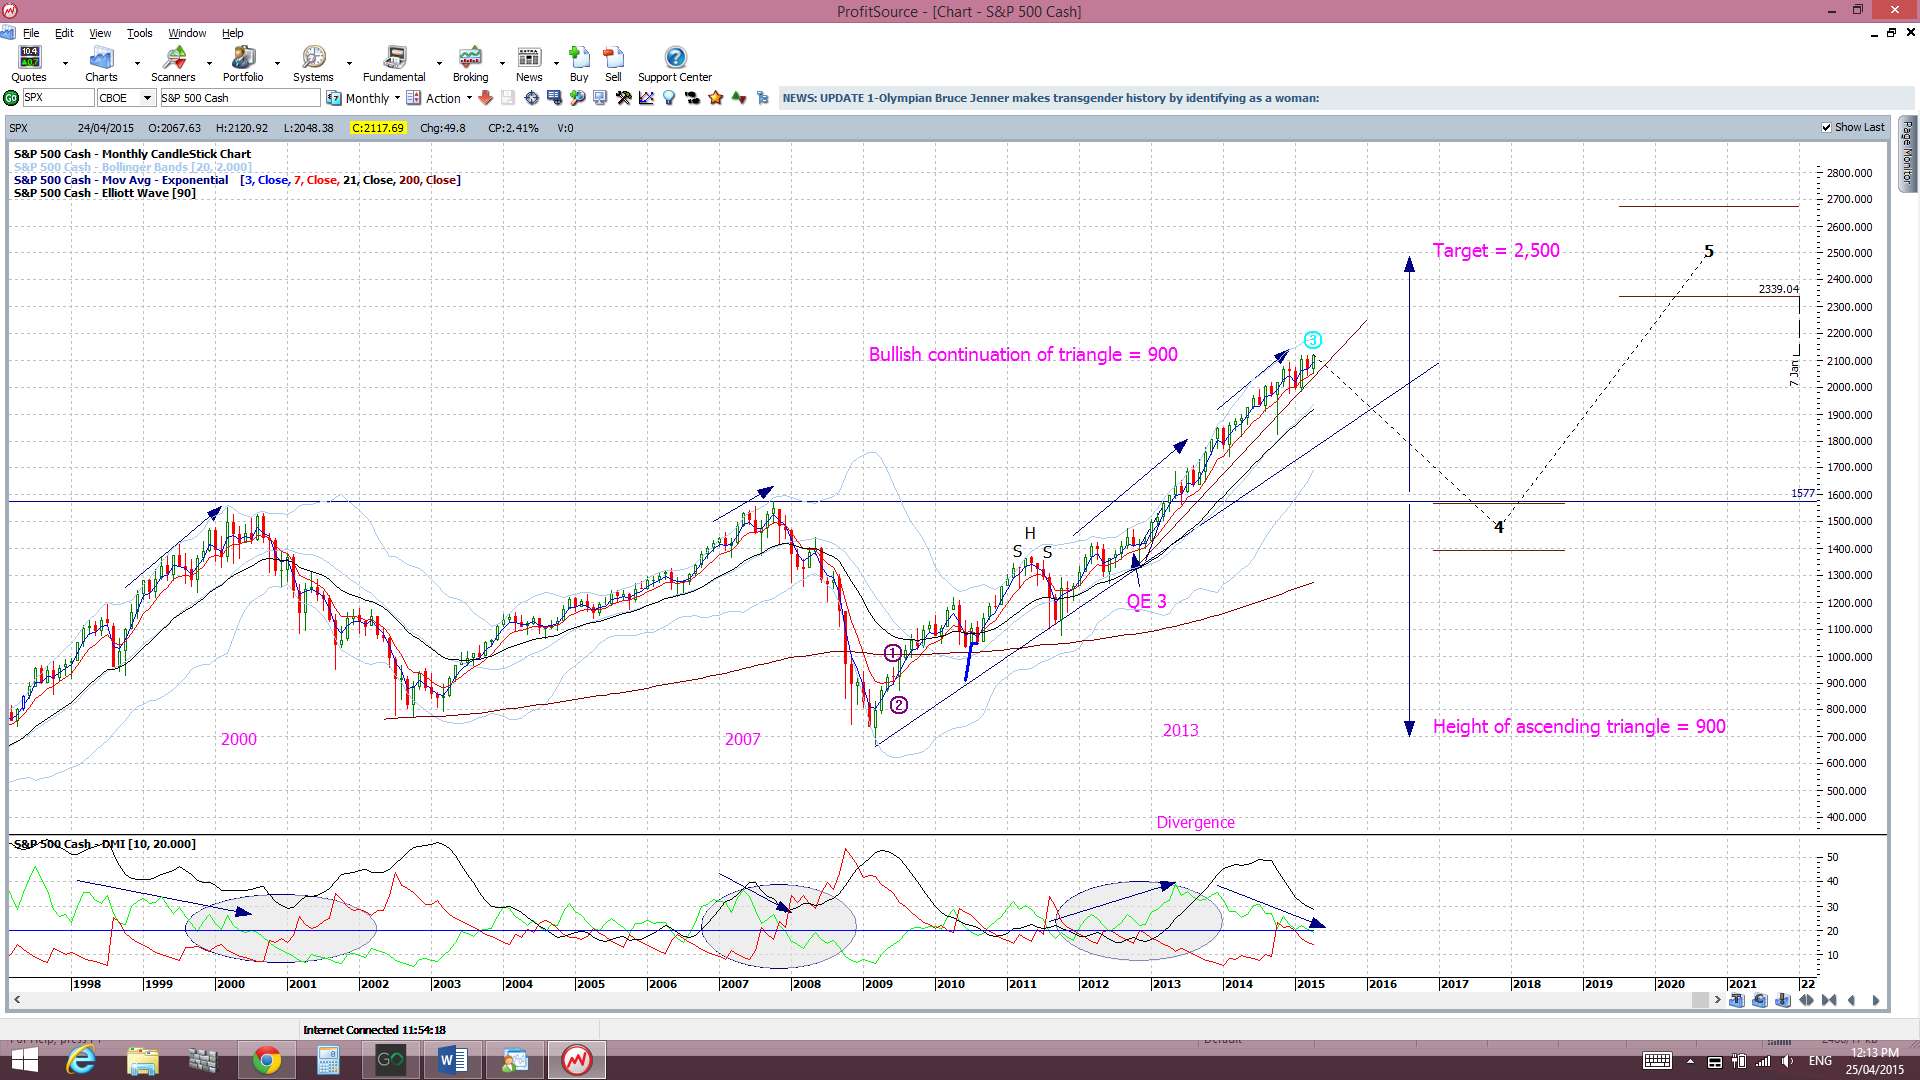
S&P500 daily chart: The index is still trading above the psychological 2,000 level and above daily trend line support. The index has now made a bullish breakout from the triangle pattern:
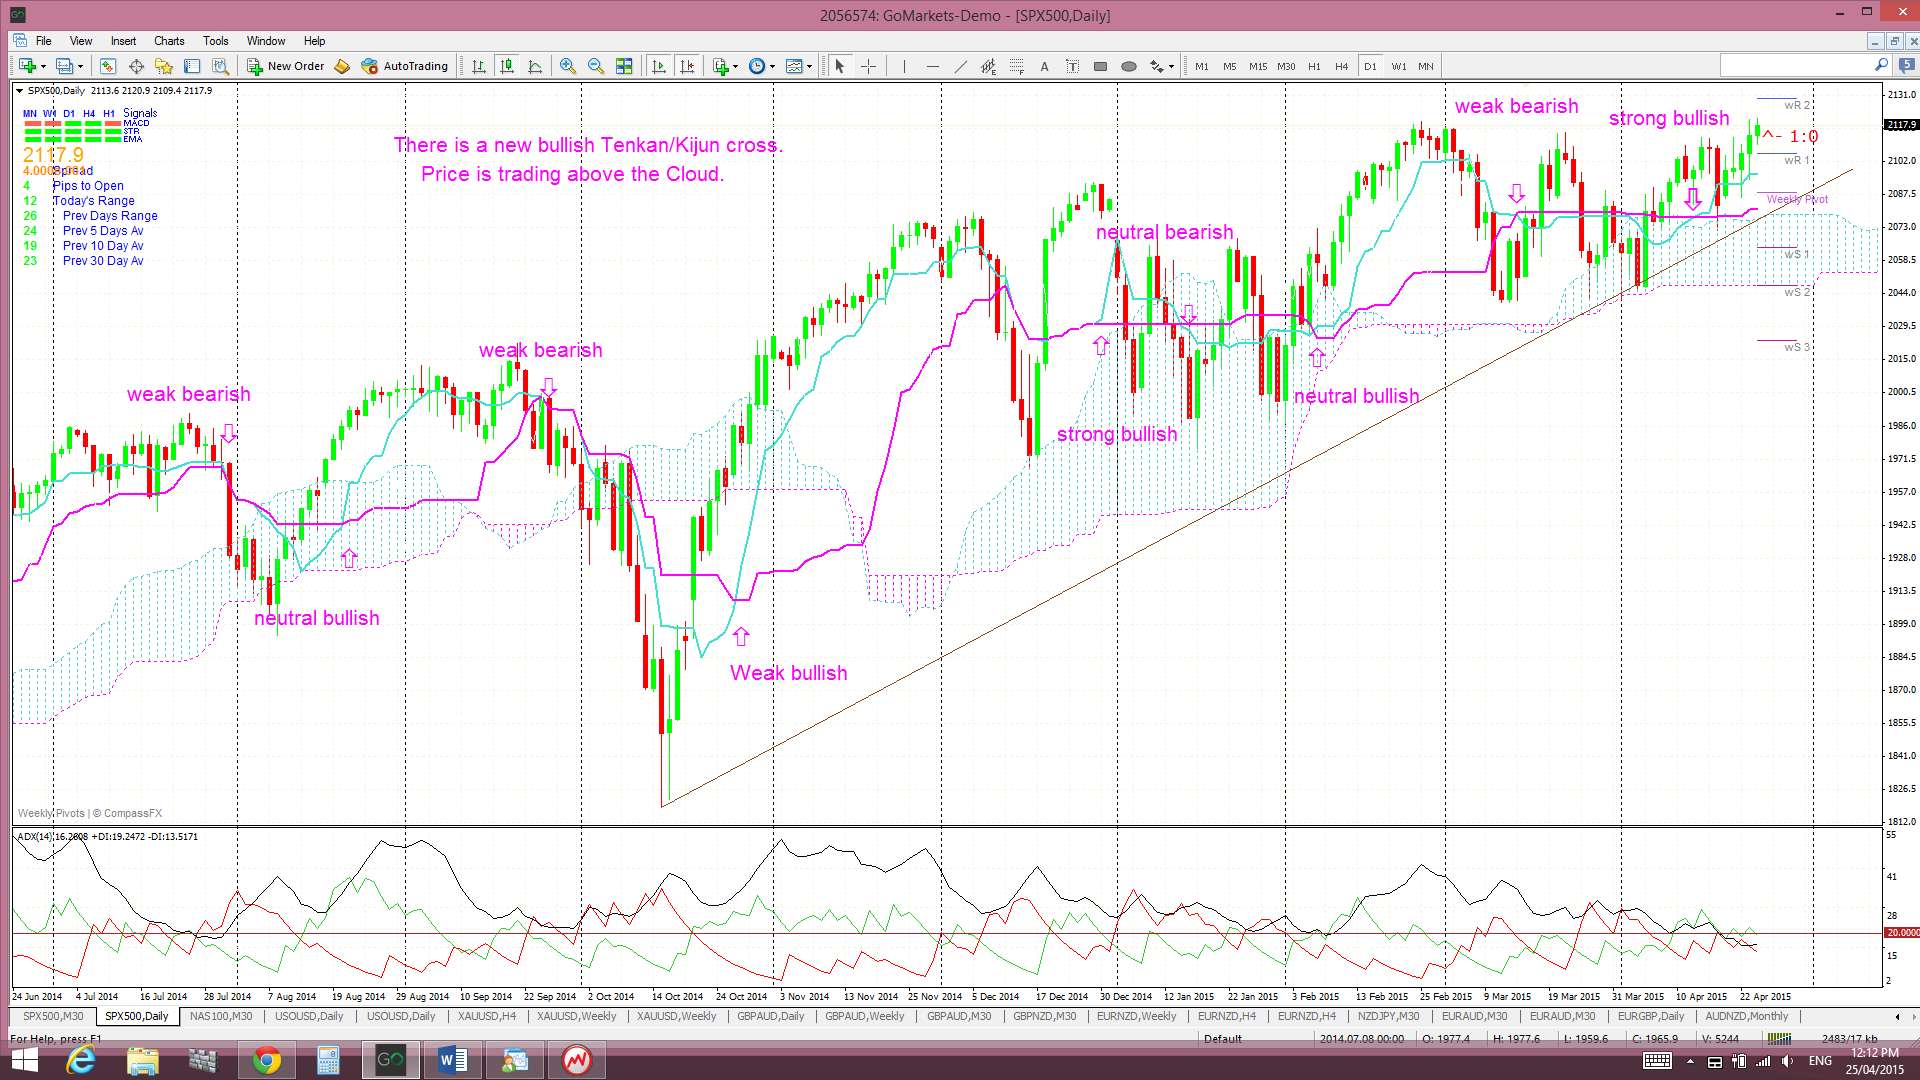
Ichimoku S&P500 chart: a clear cross of the blue Tenkan-sen line below the pink Kijun-sen line. There has been a recent bullish Tenkan/Kijun cross here and this evolved above the Cloud and so is deemed a ‘STRONG’ signal. The latest up-tick with the Tenkan/Kijun lines has now endorsed this bullish signal.
S&P500 monthly chart: a break of the monthly support trend line. The monthly trend line remains intact. A break of this support level would suggest to me of a more severe pull back or correction.
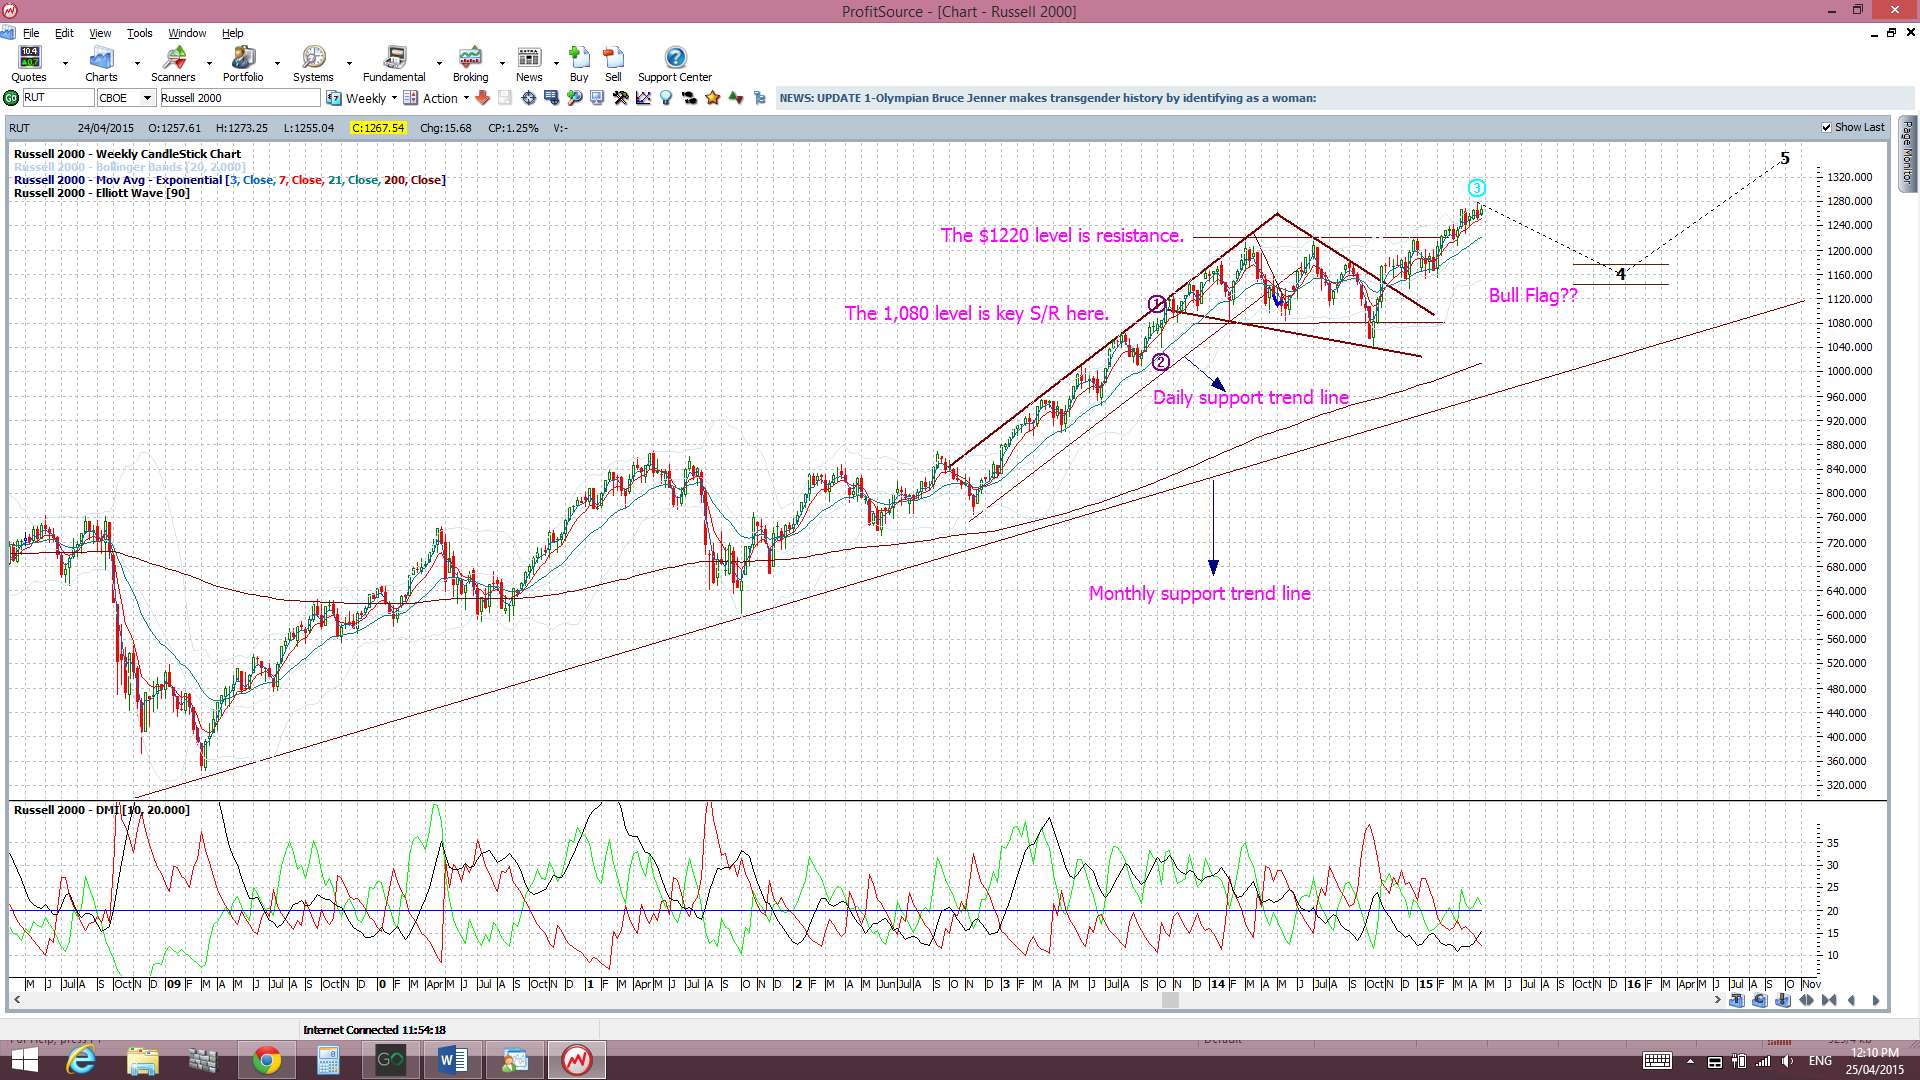
Russell 2000 Index: this small caps index is considered a US market ‘bellwether’. This is still trading above the key 1,220 level and printed a bullish weekly candle.
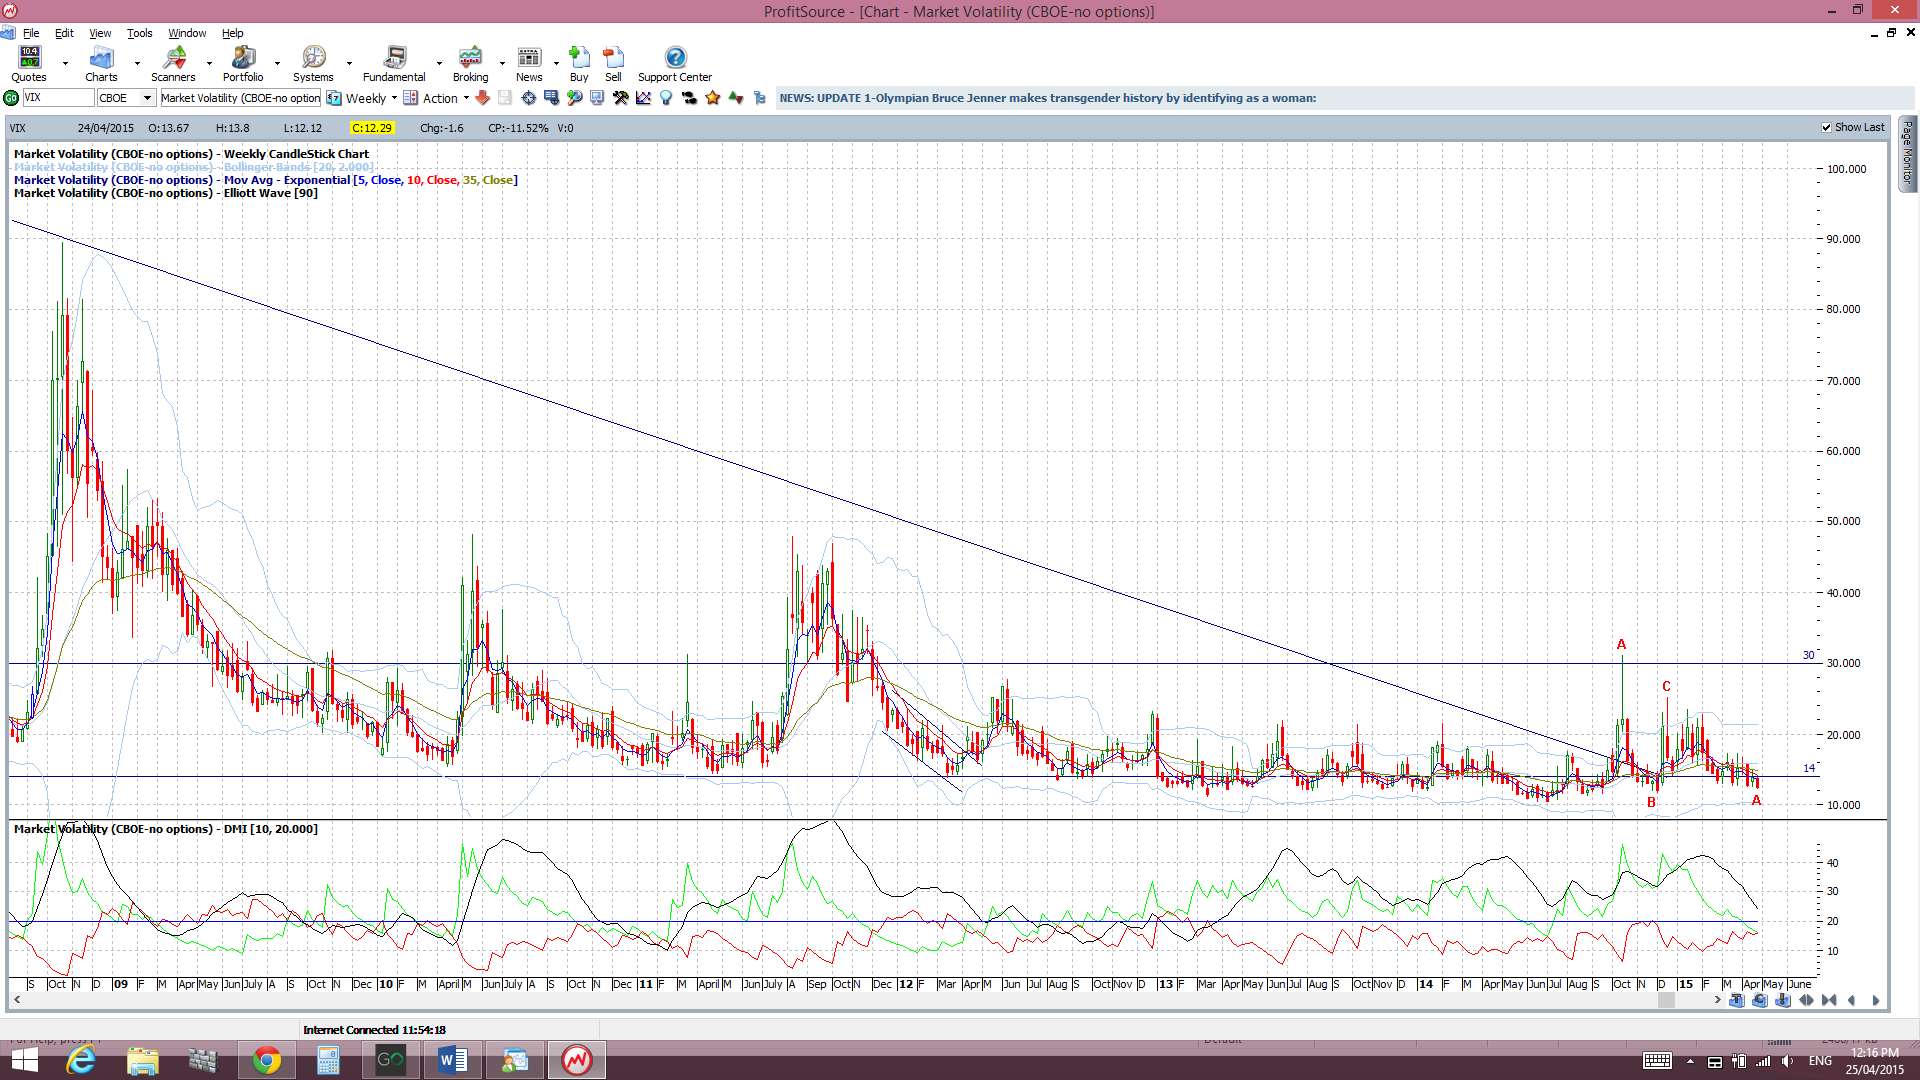
VIX Index: The ‘Fear’ index had a bearish week AND is still below the 14 level.
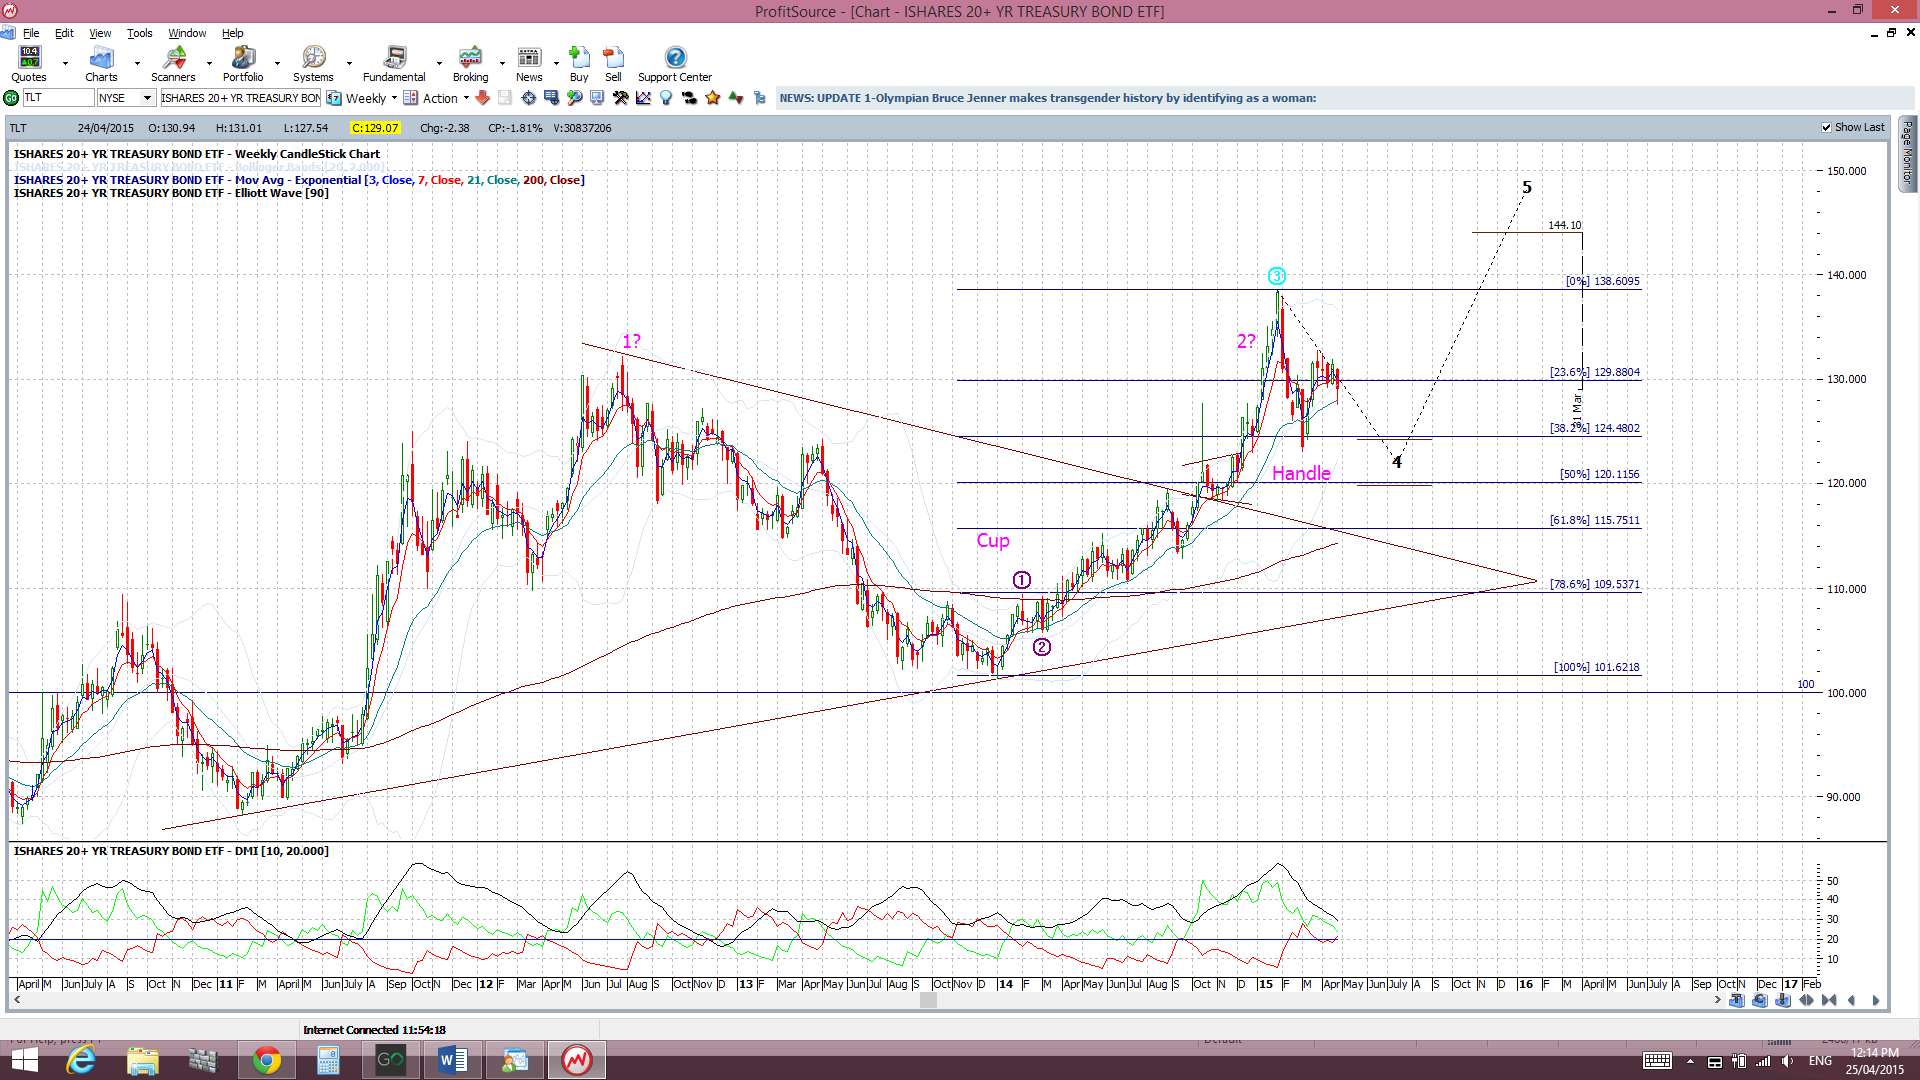
Bonds: The bond ETF had a bearish week despite the weaker US$ as money seems to be flowing into equities.
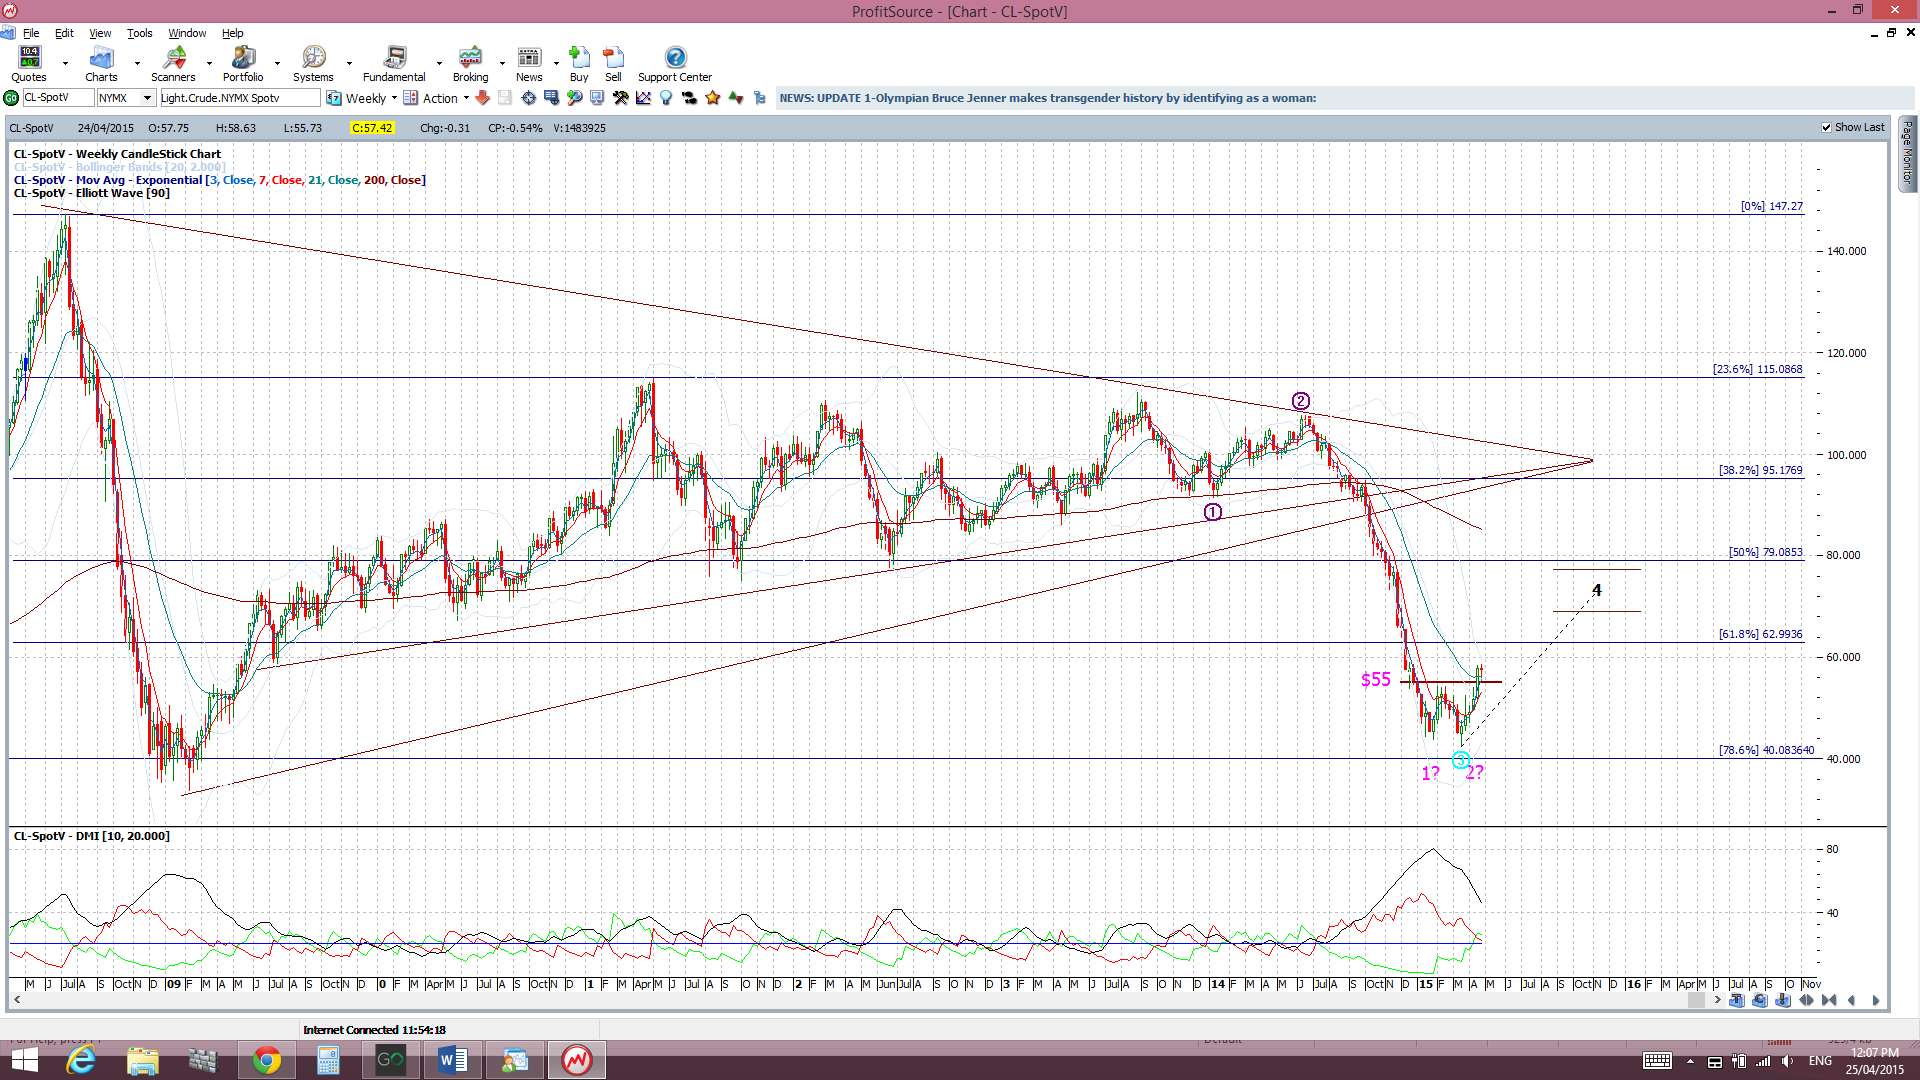
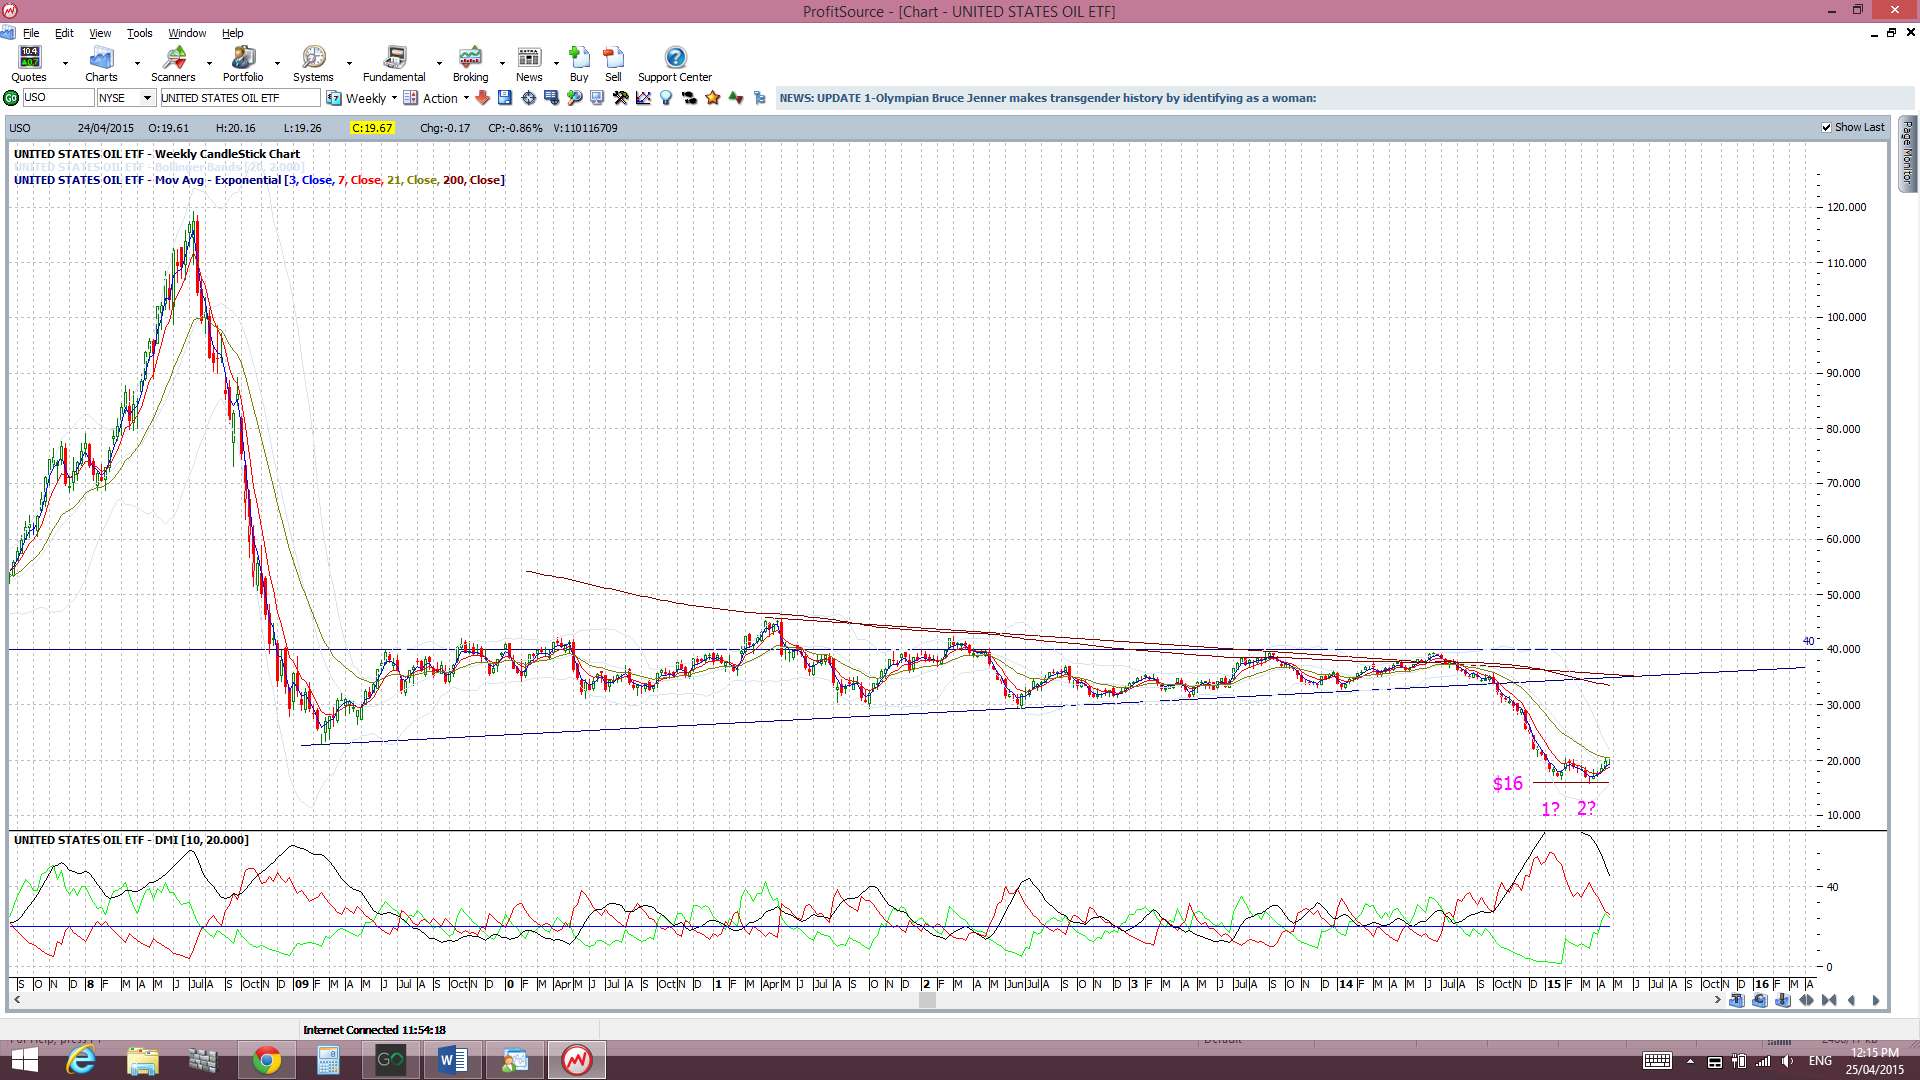
Oil: Oil is consolidating after a bullish breakout from a ‘Double Bottom’. I’m still on the lookout for a test of the $55 ‘neck line’ breakout level before possible continuation. USO is holding above $16 and still forming a bullish ‘Double Bottom’ with $20 as the ‘neck line here. Price is still under this $20 breakout region for the time being:
Trading Calendar Items to watch out for:
- Mon 27th: NZD Bank Holiday.
- Tue 28th: AUD RBA Gov Stevens speaks. GBP Prelim GDP. USD CB Consumer Confidence.
- Wed 29th: NZD Trade Balance & ANZ Business Confidence. JPY Bank Holiday. EUR German Prelim CPI. USD Advance GDP, Fed Funds Rate & FOMC.
- Thurs 30th: NZD Cash Rate & RBNZ Rate Statement. JPY Monetary Policy Statement & BoJ Press Conference. EUR CPI Flash estimates. CAD GDP. USD Unemployment Claims.
- Fri 1st: CNY, EUR, CHF Bank Holiday. CNY Manufacturing PMI. AUD PPI. GBP Manufacturing PMI. USD ISM Manufacturing PMI.
Forex:
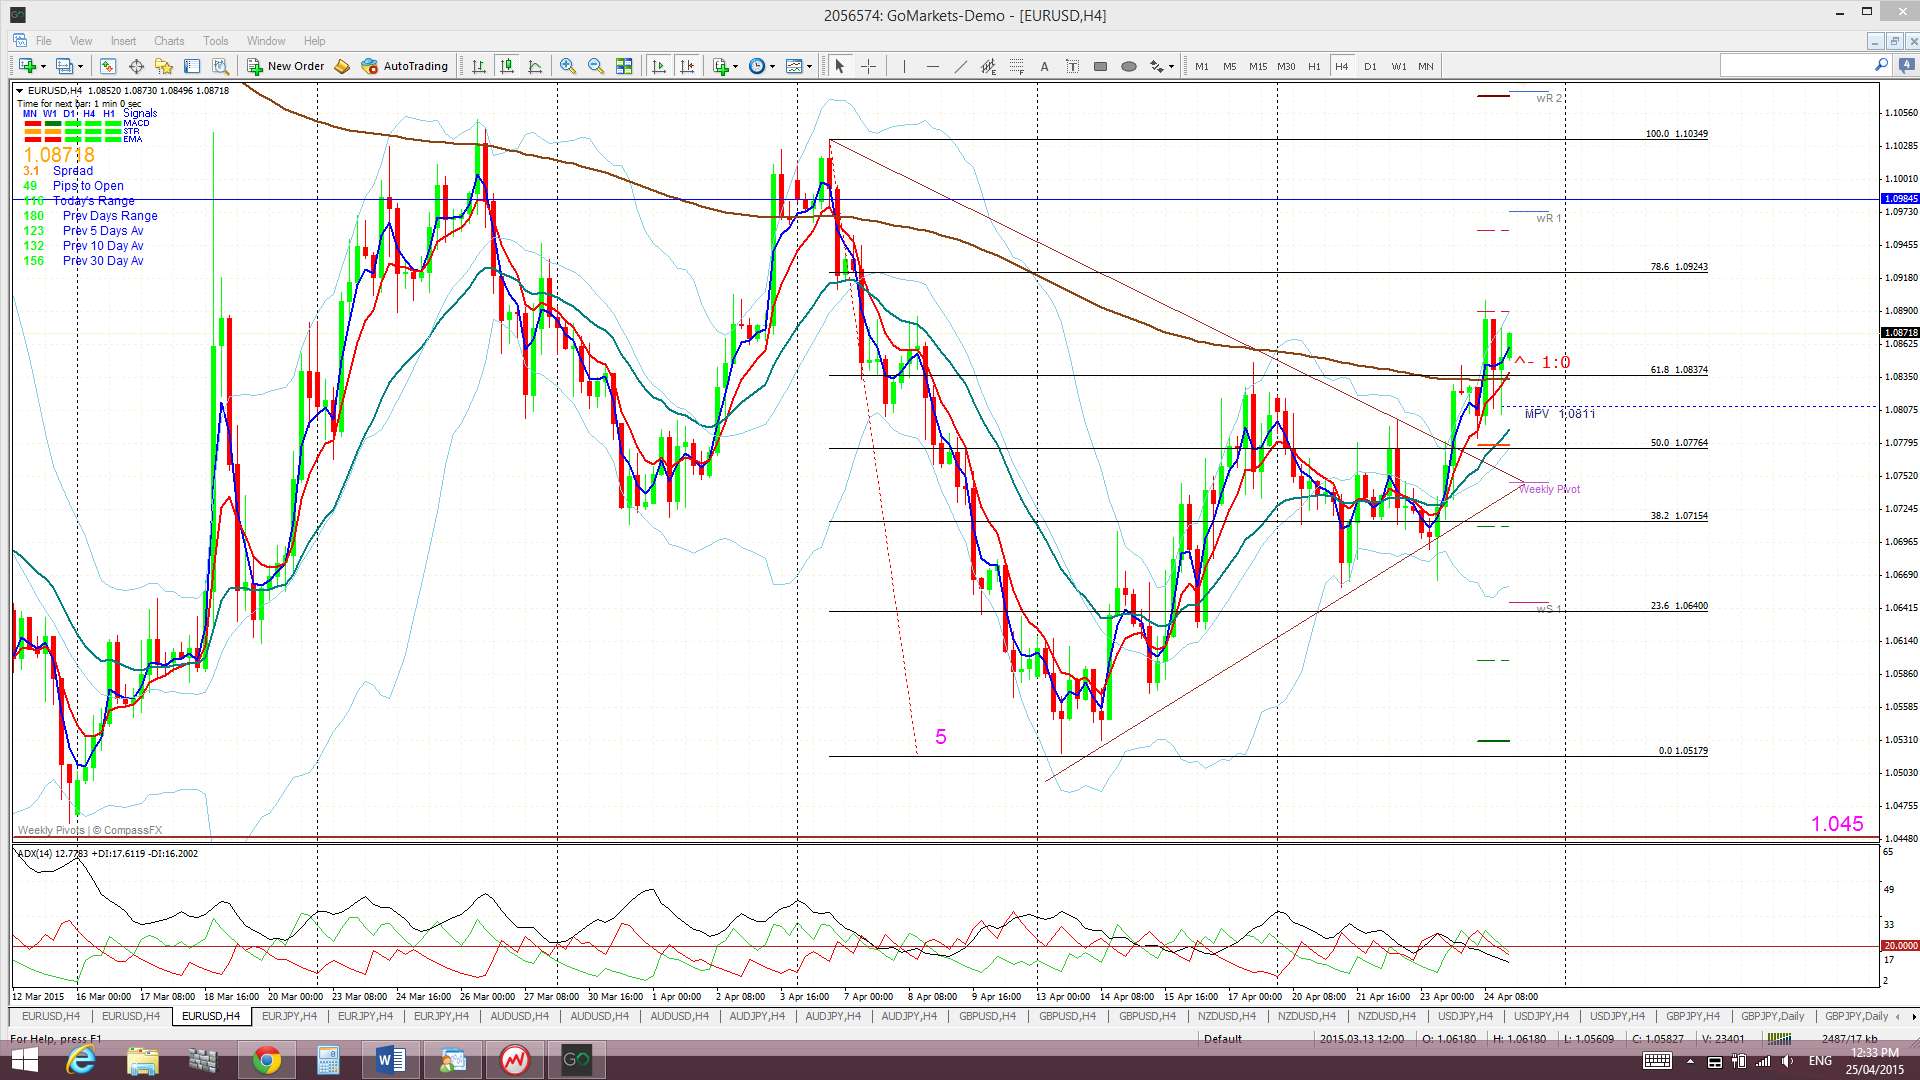
E/U: The E/U consolidated within a triangle for much of the week but broke out on Thursday. It stalled at the 4hr 200 EMA and 61.8% fib of the recent swing low move ahead of Friday’s Eurogroup meetings though but managed to close the week above this resistance region. It seems hard to fathom given divergent central bank policy for the EUR vs USD BUT this pair is starting to look bullish as it holds above 1.045.
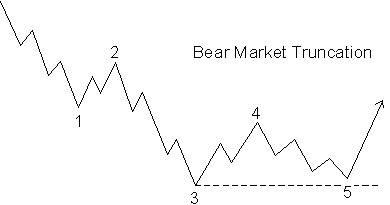
The E/U is still conforming to the Elliott Wave Bear Market Truncation pattern so, given this observation and the break of resistance, keep watching for any continued bounce.
Continued choppiness just above this 1.045 level though could simply be helping to form a weekly-chart Bear Flag pattern and so traders need to keep an open mind here. A close and hold below 1.045 would support a Bear Flag but a close and hold above 1.12, a level near the monthly chart’s 61.8% fib retracement, would support a bullish reversal.
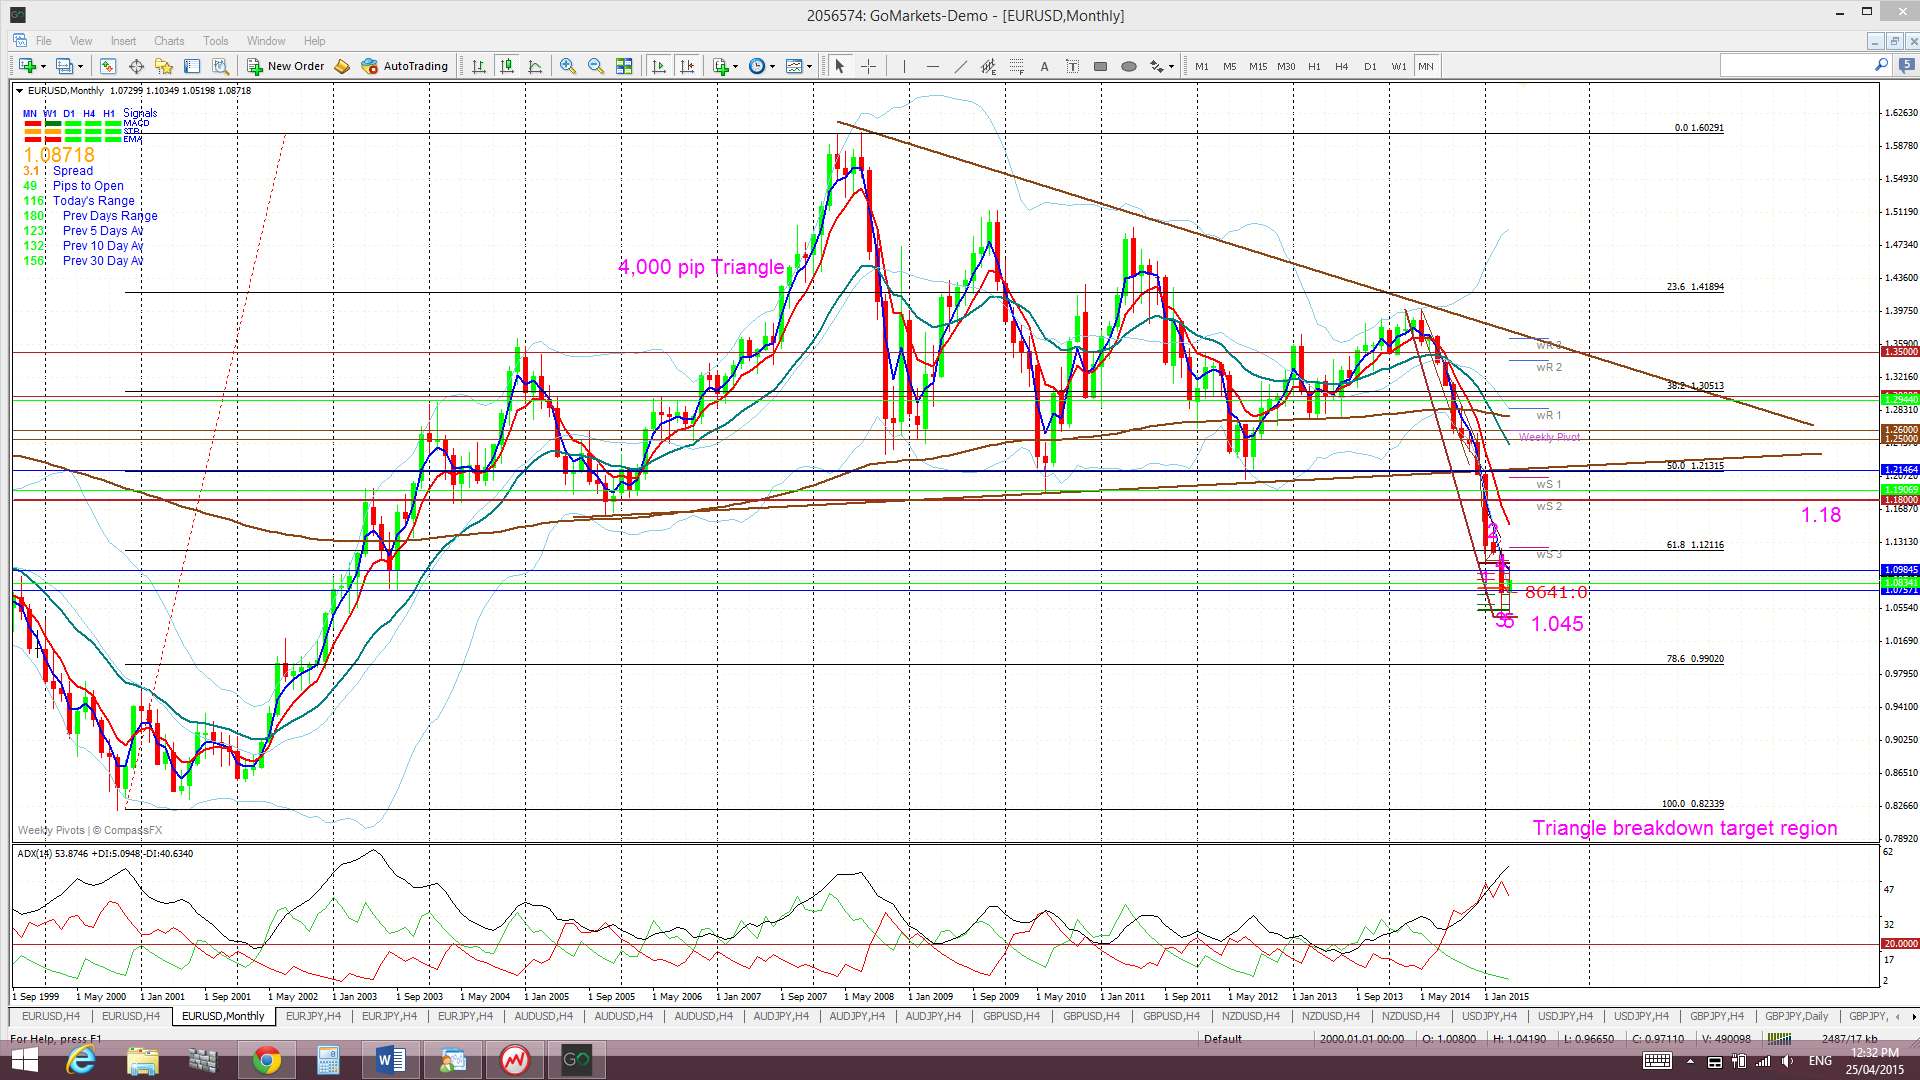
Descending triangle on the monthly chart: However, there is still an overall bearish pattern in play on the E/U monthly chart: a 4,000 pip bearish descending triangle breakdown on the monthly chart. The descending triangle pattern is a bearish continuation pattern and has a base at around the 1.18 level. The height of this triangle is about 4,000 pips. Technical theory would suggest that any bearish breakdown of this triangle below 1.18 might see a similar move. It is worth noting that this would bring the E/U down near 0.80 and to levels not seen since 2000/2001! The monthly chart shows how critical this 1.18 level is for the E/U.
Price is trading above the Ichimoku Cloud on the 4hr chart, in the bottom of the Cloud on the daily chart but below the Cloud on the weekly and monthly charts.
Risk events for this pair are dominated by the Greek-debt situation. This pair could rally hard if any suitable outcome is resolved here but conversely, a Grexit could help form up the Bear Flag!
The weekly candle closed as a bullish coloured Doji.
- I’m watching for any new TC signal.
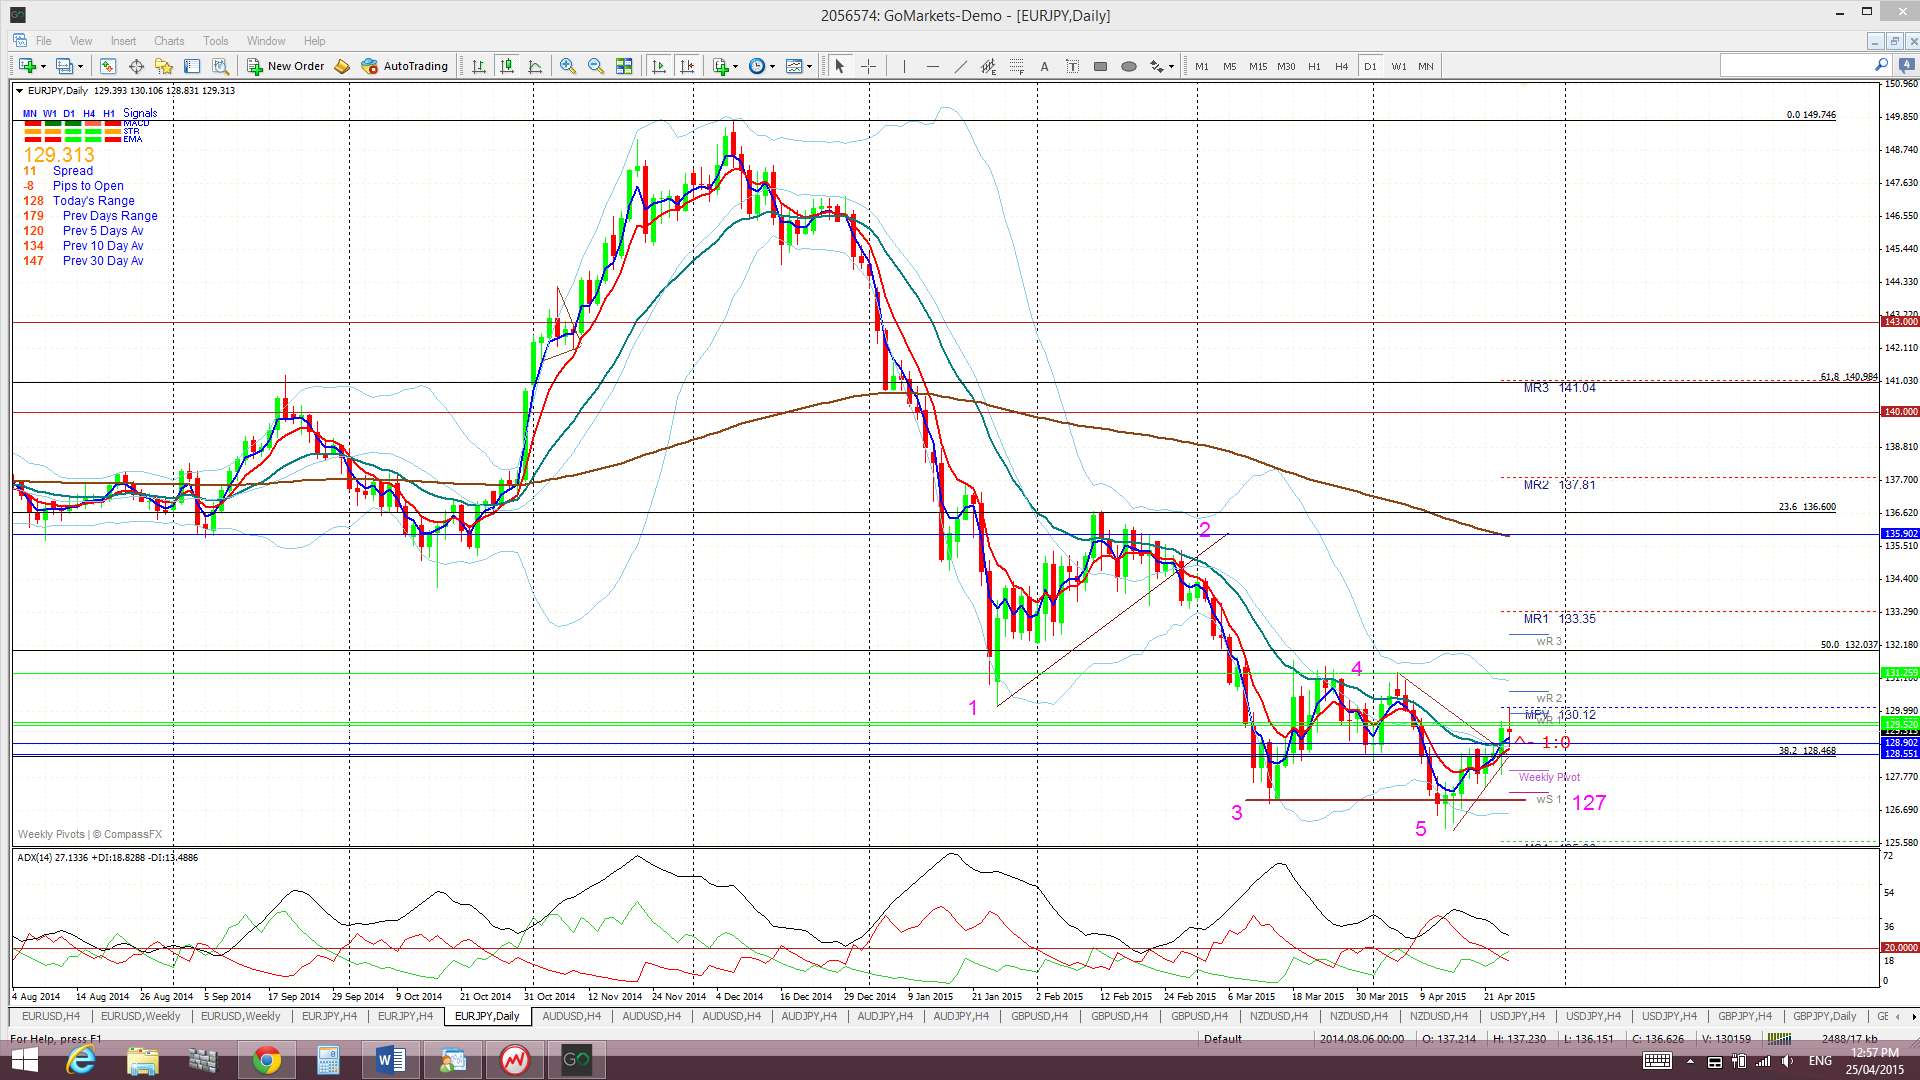
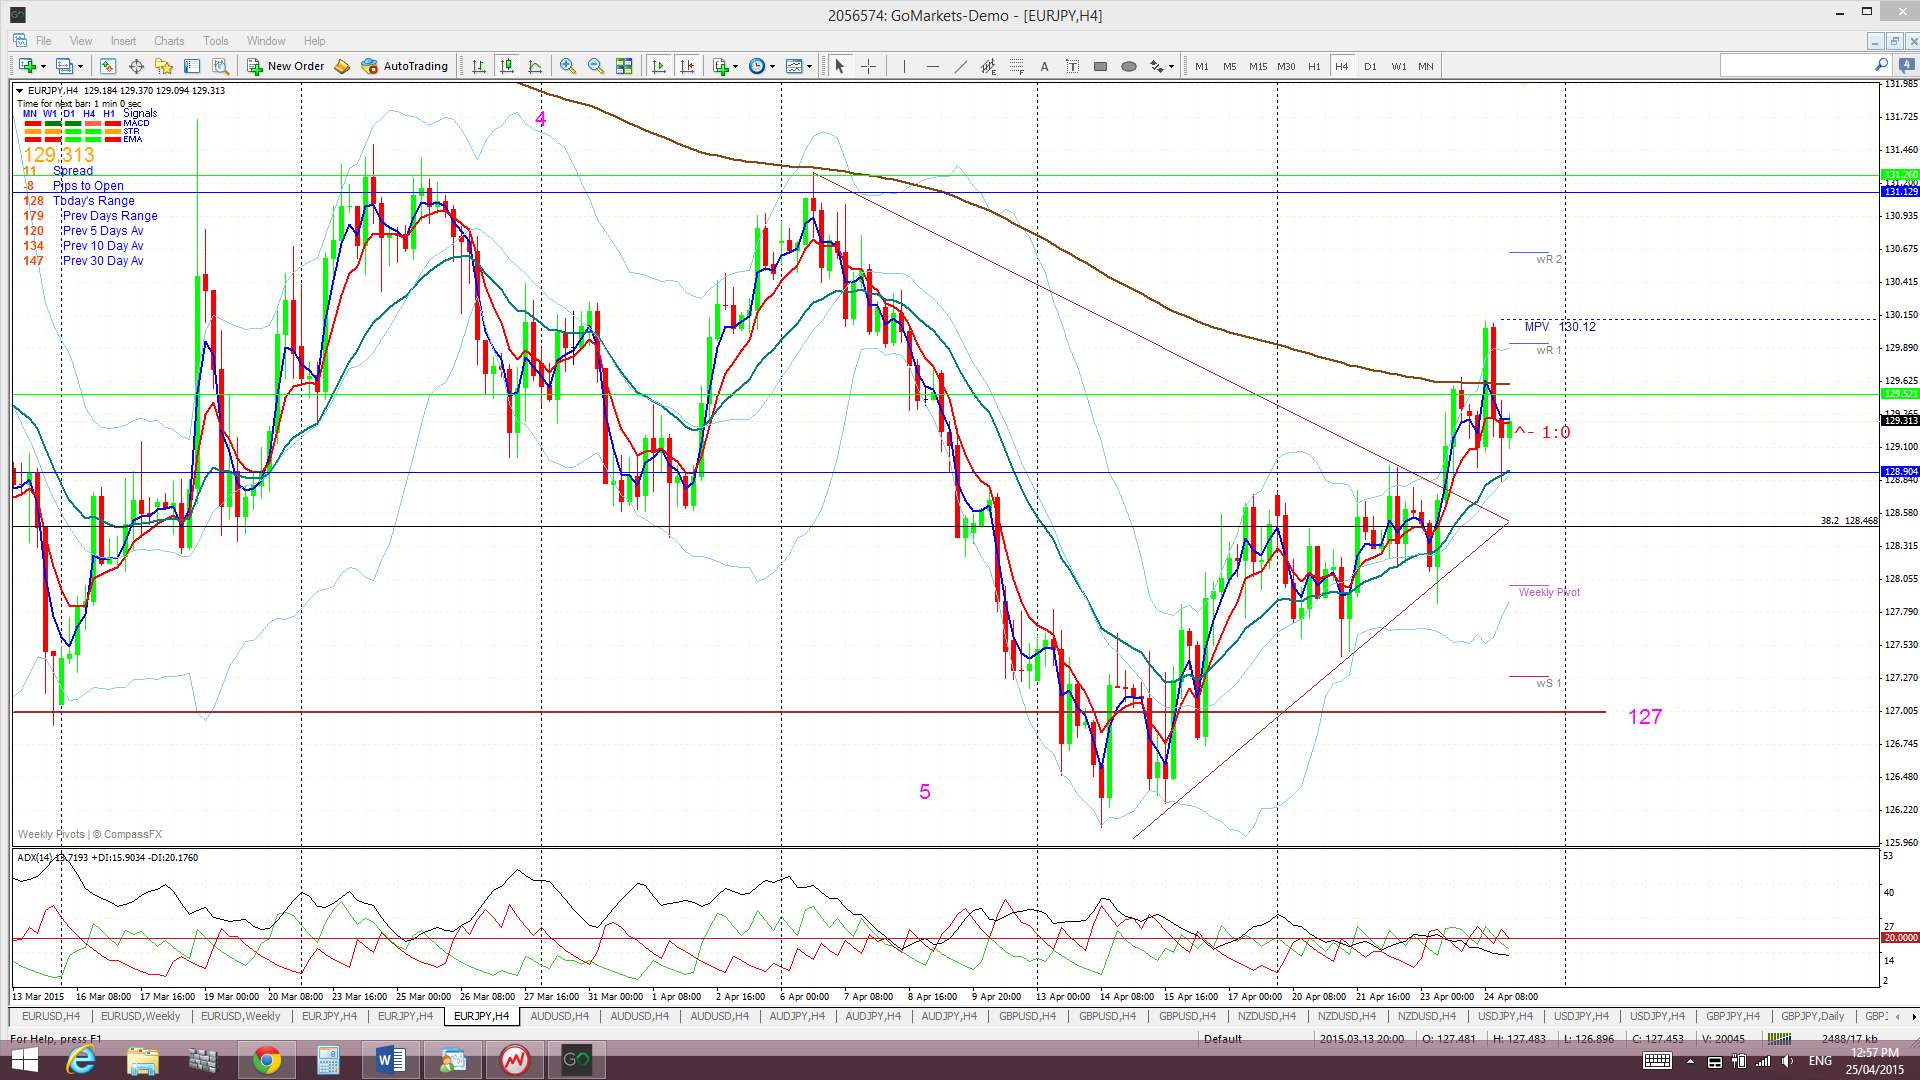
E/J: Like the E/U, the E/J also consolidated within a triangle for much of the week and broke out on Thursday. It also stalled at the 4hr 200 EMA ahead of Friday’s Eurogroup meetings and remained there to see out the week.
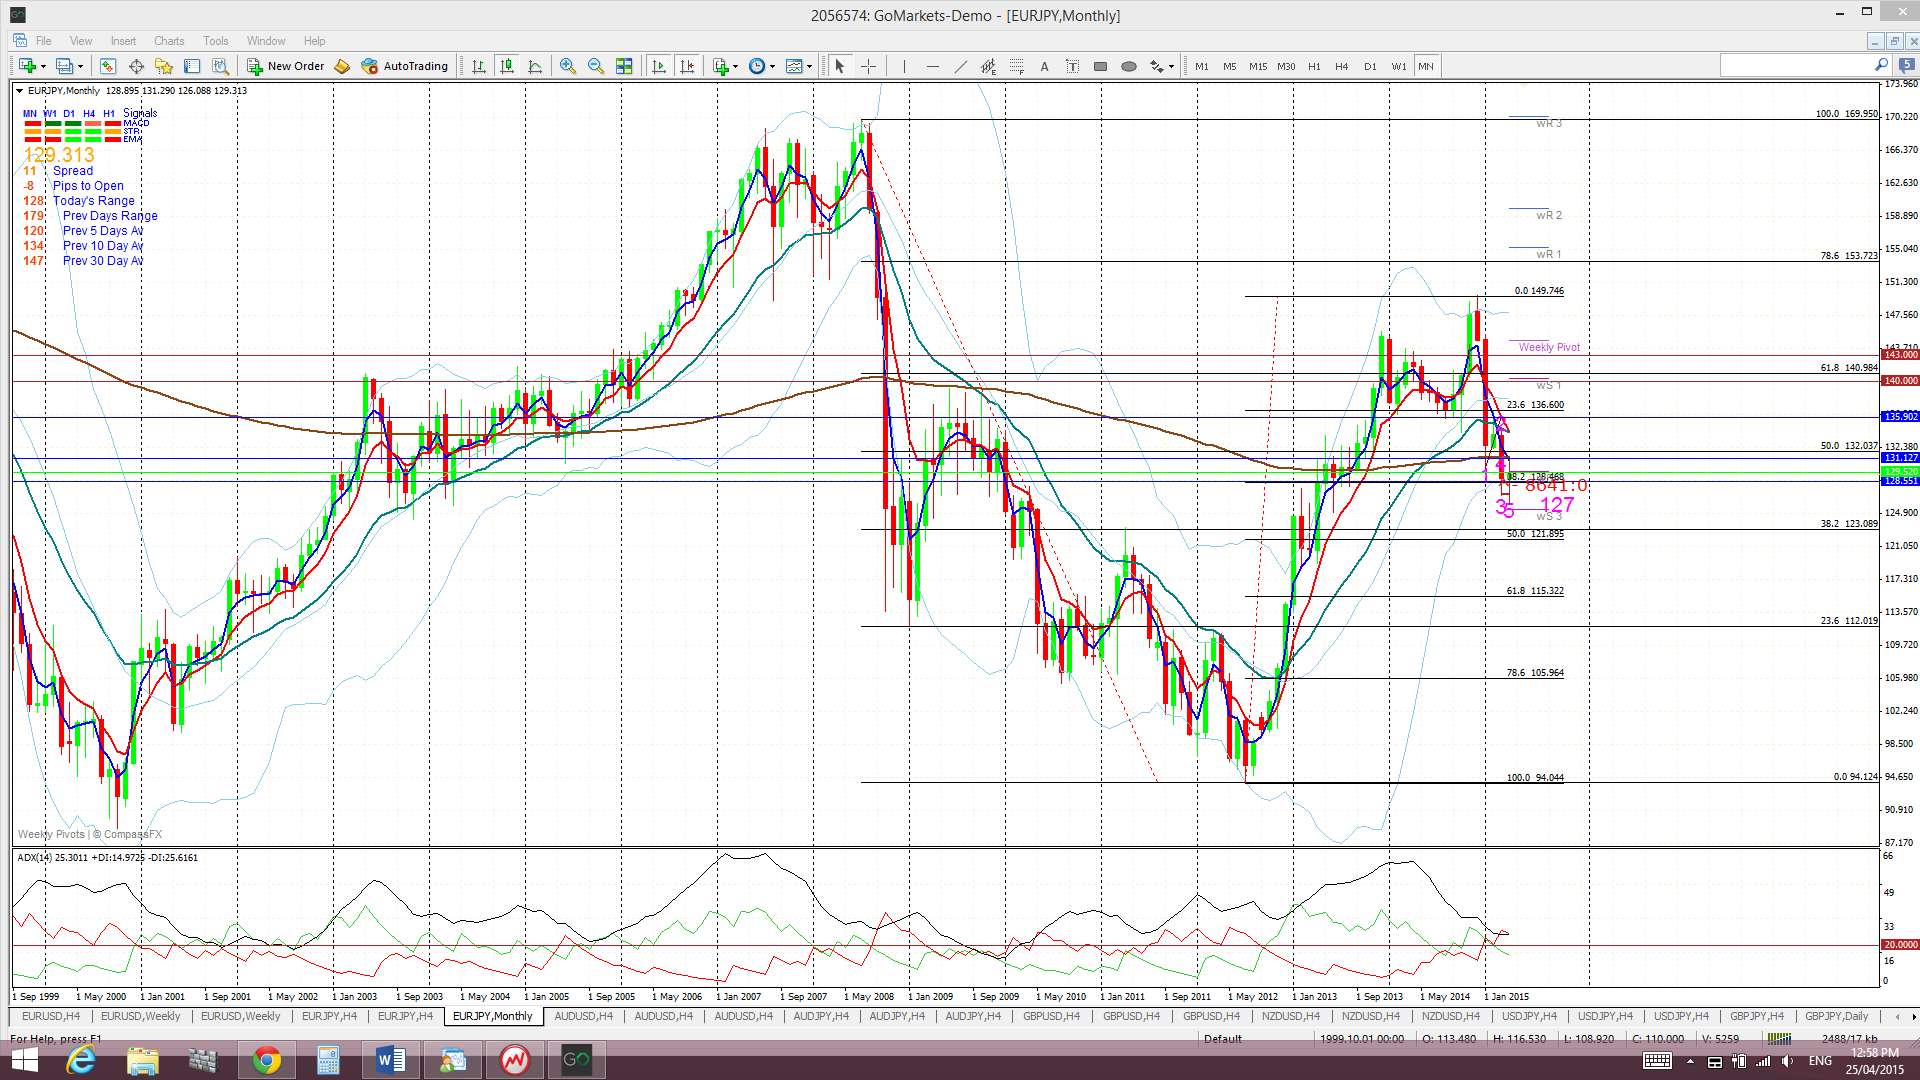
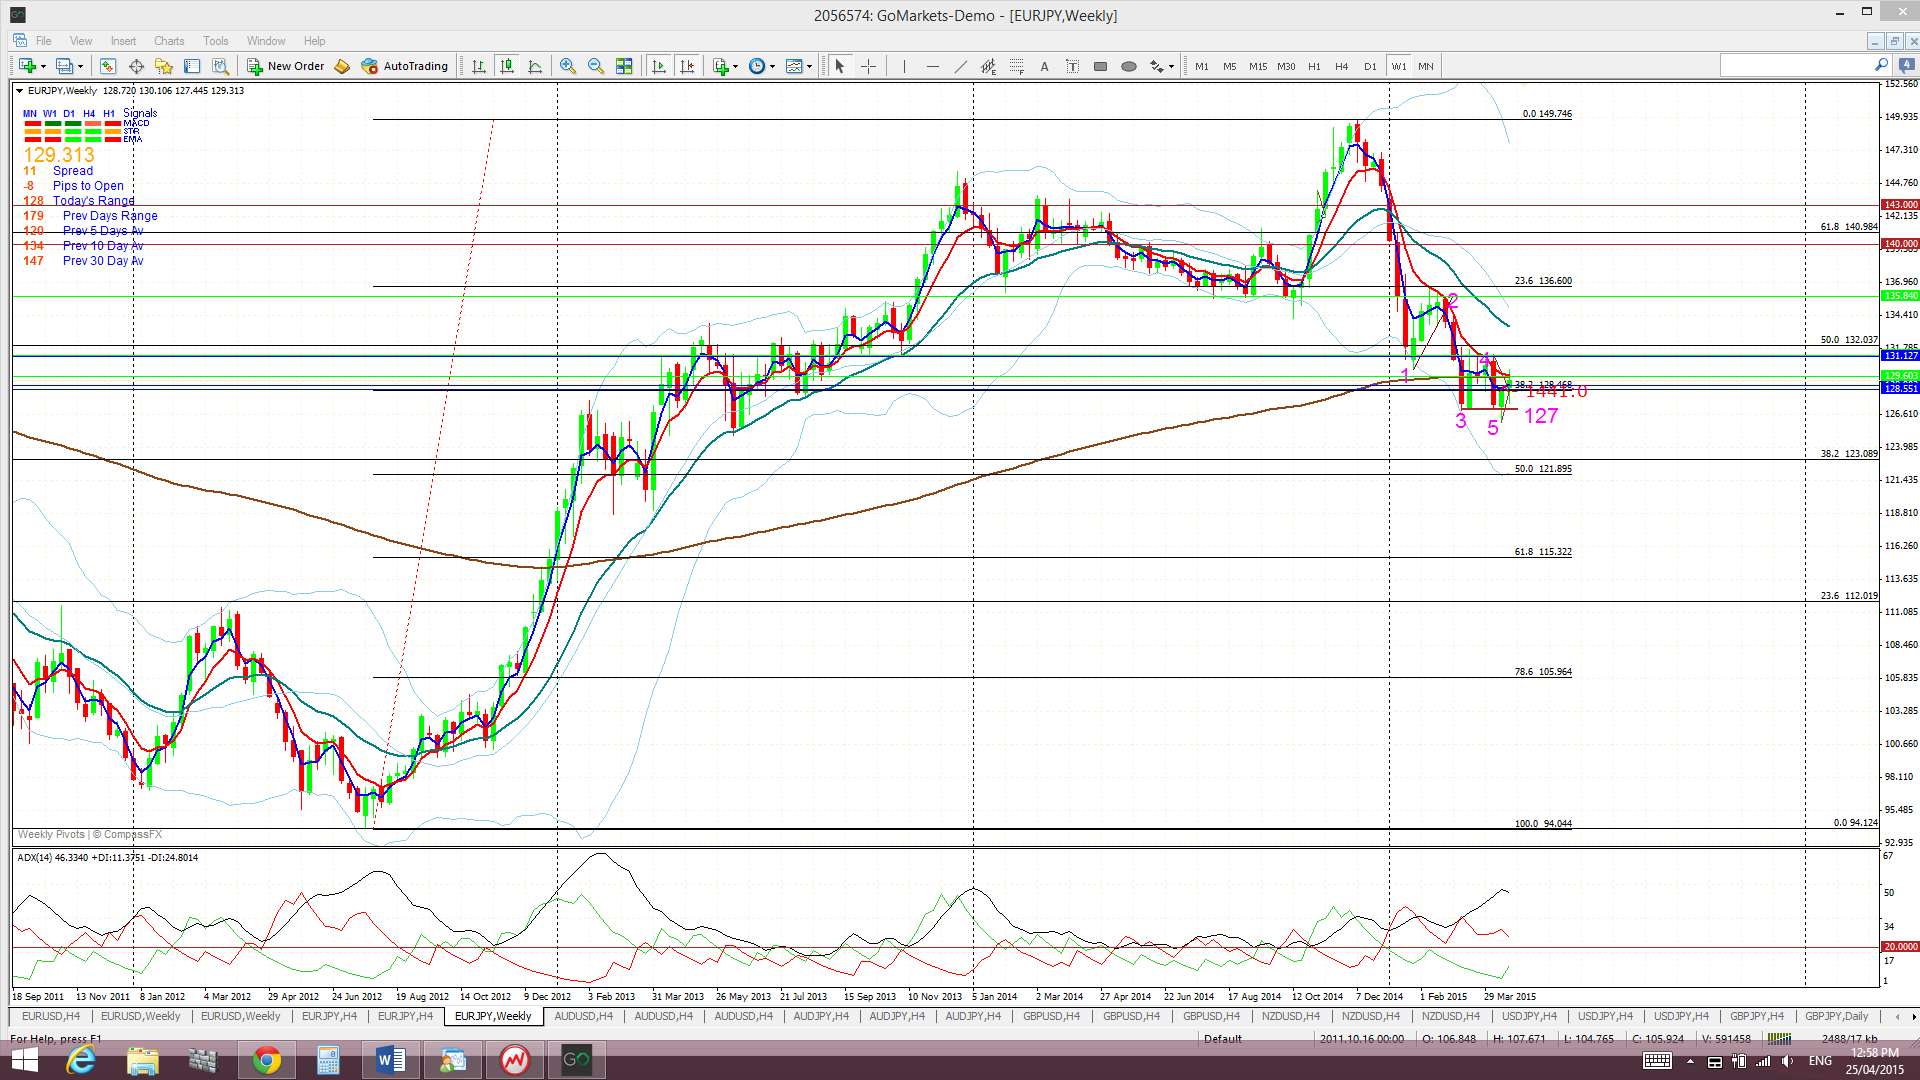
The E/J is also still conforming to the Elliott Wave Bear Market Truncation pattern so keep watching for any continued bounce.
Price is trading above the Cloud on the 4hr chart but below the Cloud on the daily and weekly charts yet above on the monthly chart.
The weekly candle closed as a small bullish ‘Spinning Top’ candle.
Risk events here this week include the Greek situation but also BoJ Interest Rate news.
- I’m watching for any new TC signal on this pair and still keeping an eye on the 127 level.
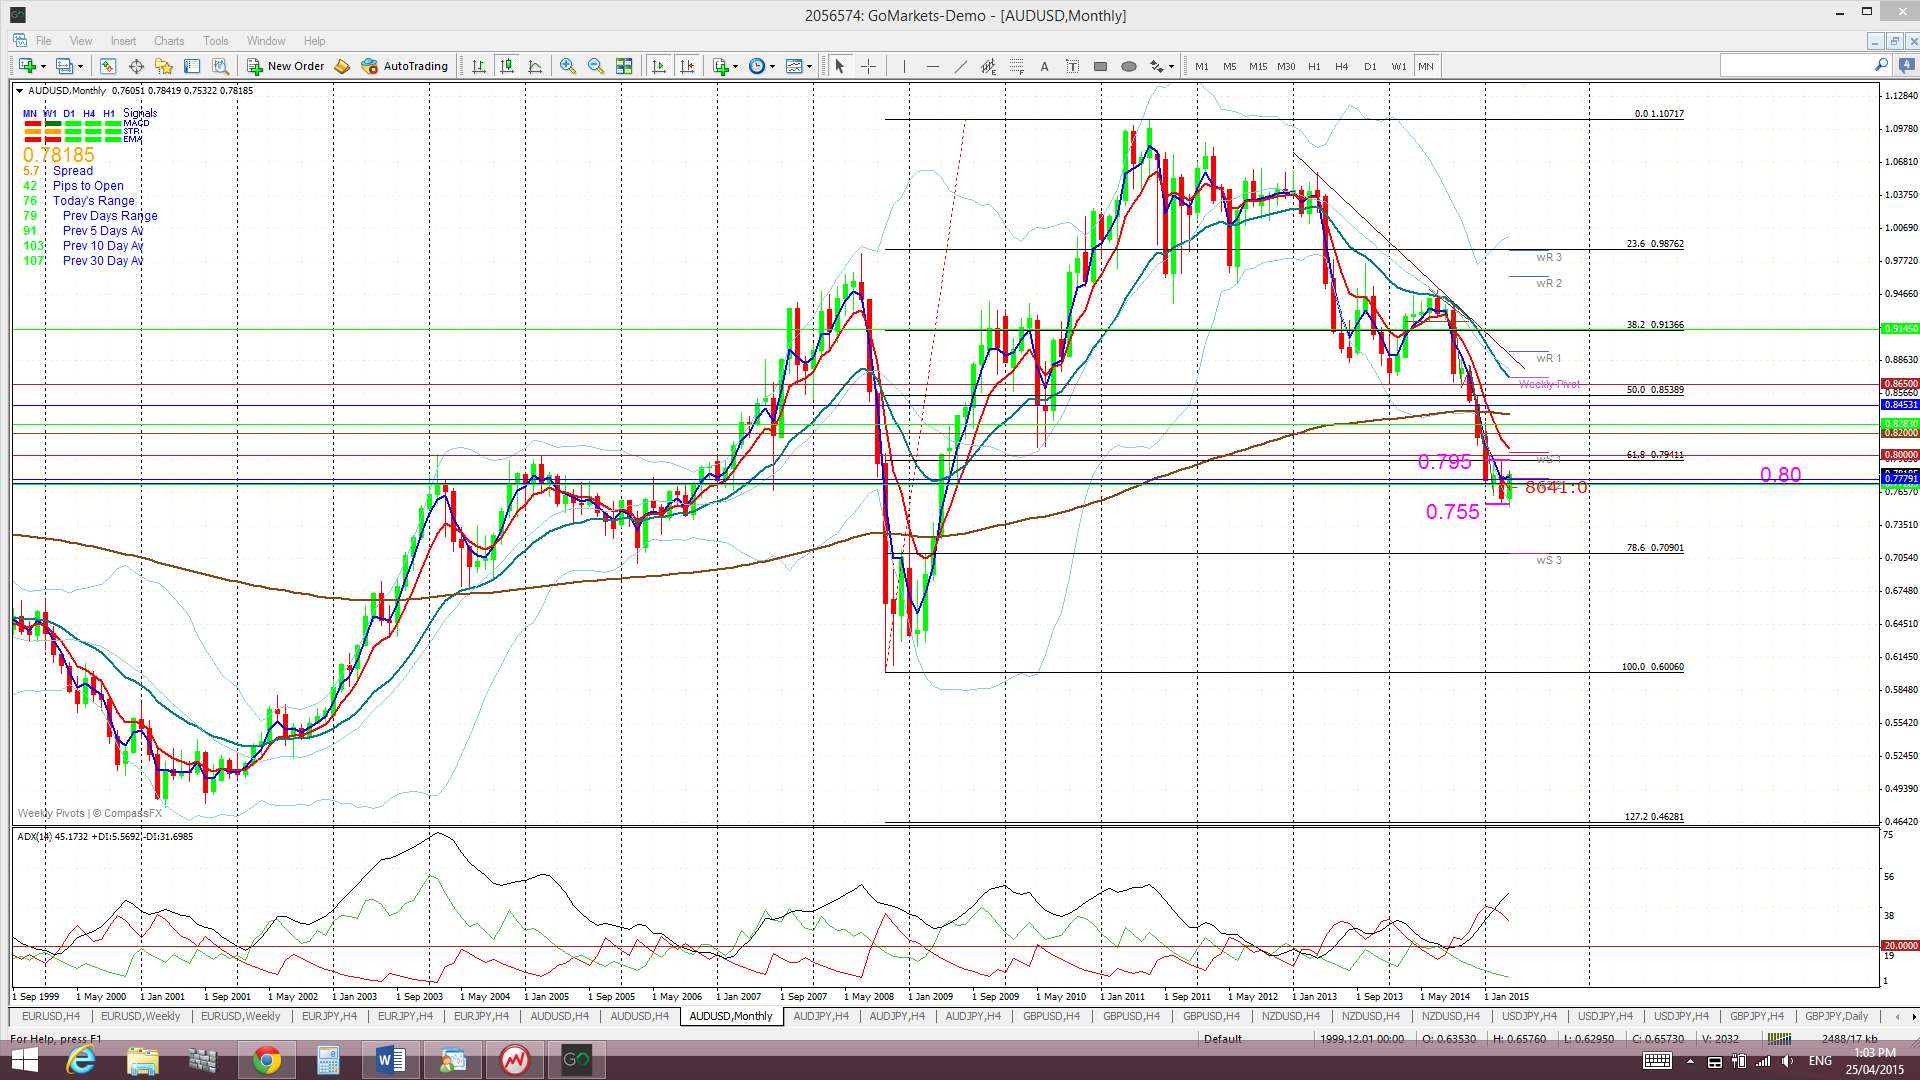
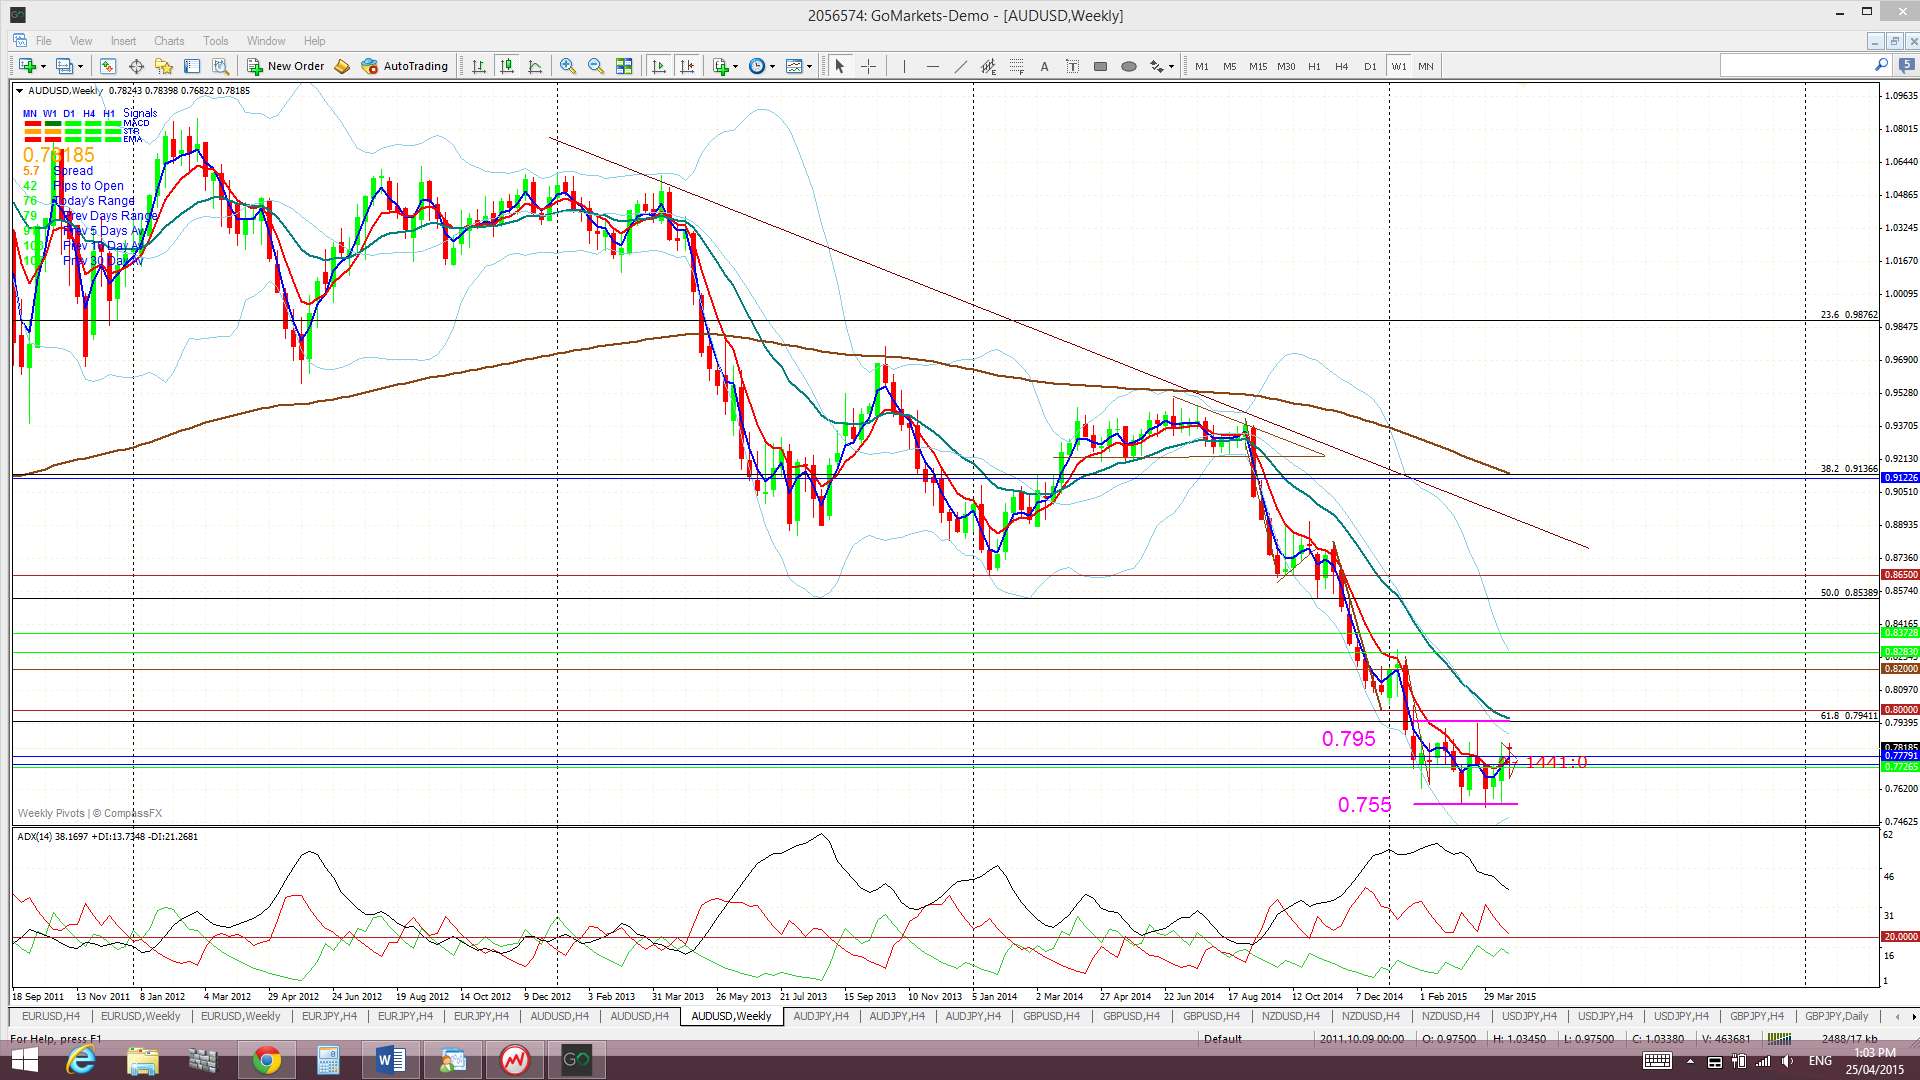
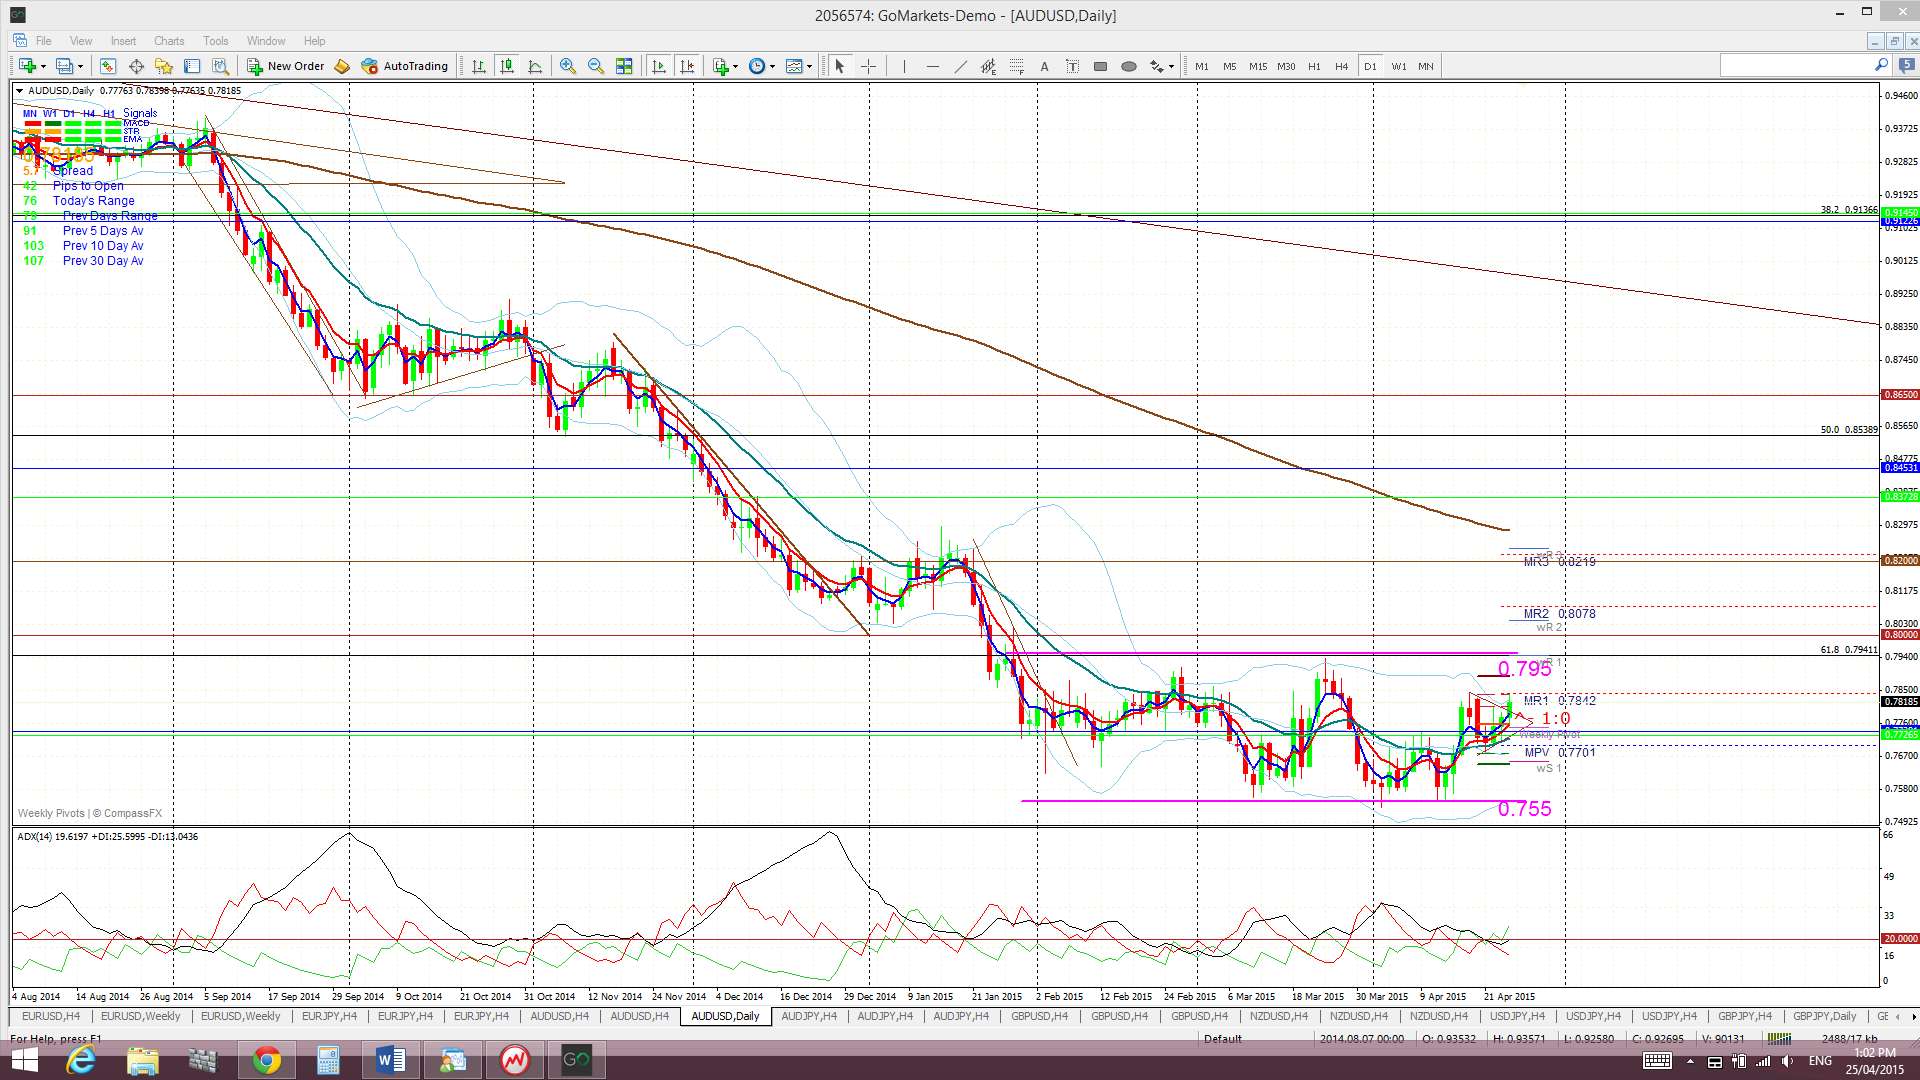
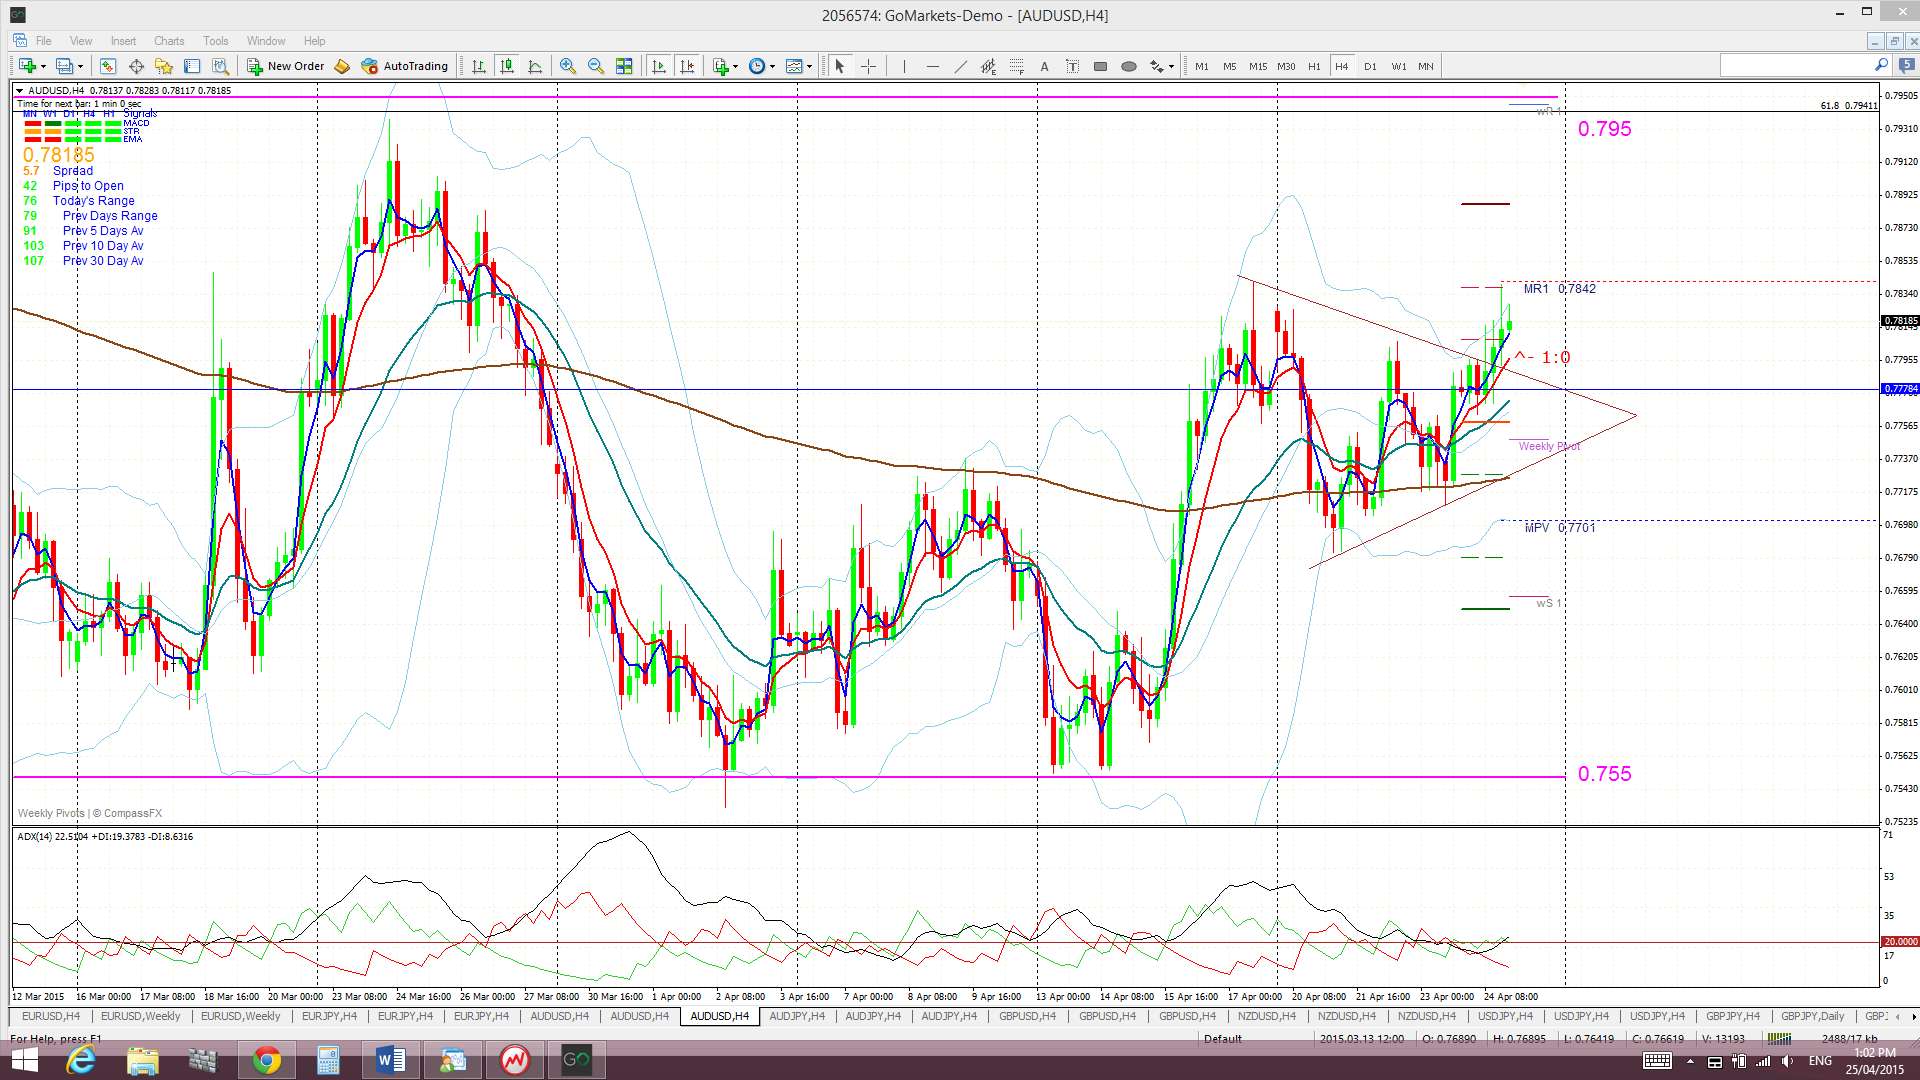
A/U: The A/U, like the E/U and E/J, consolidated within a triangle for much of the week and broke out on Friday BUT price still remains channel bound between 0.755 and 0.795.
The A/U is trading above the Cloud on the 4hr chart, in the Cloud on the daily but below the Cloud on the weekly and monthly charts.
The weekly candle closed as a bearish coloured Doji candle reflecting the indecision here.
The mains risk events for the A/U this week include Tuesday’s RBA Gov Stevens speech and Friday’s AUD PPI data but Wednesday’s US FOMC and Friday’s Chinese Manufacturing PMI will also impact here.
- I’m watching for any new TC signal on this pair and the trading channel trend lines.
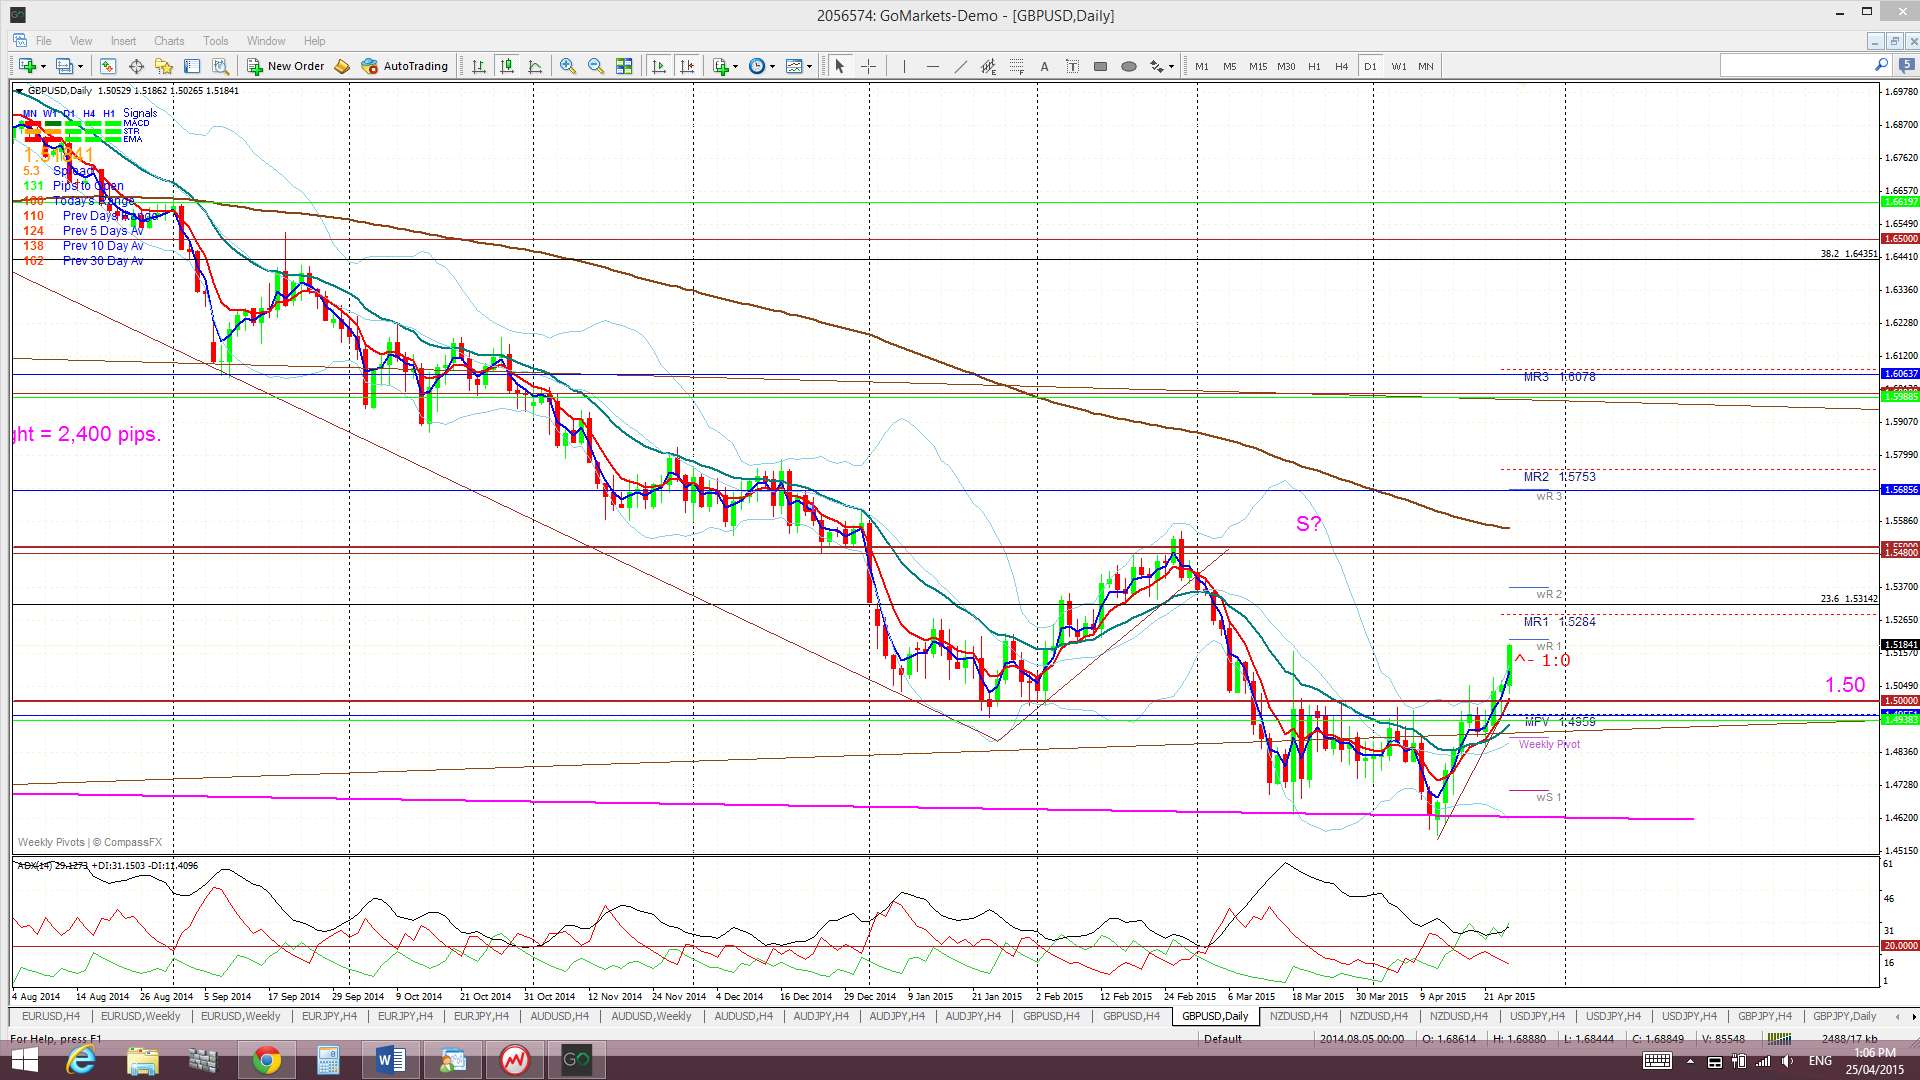
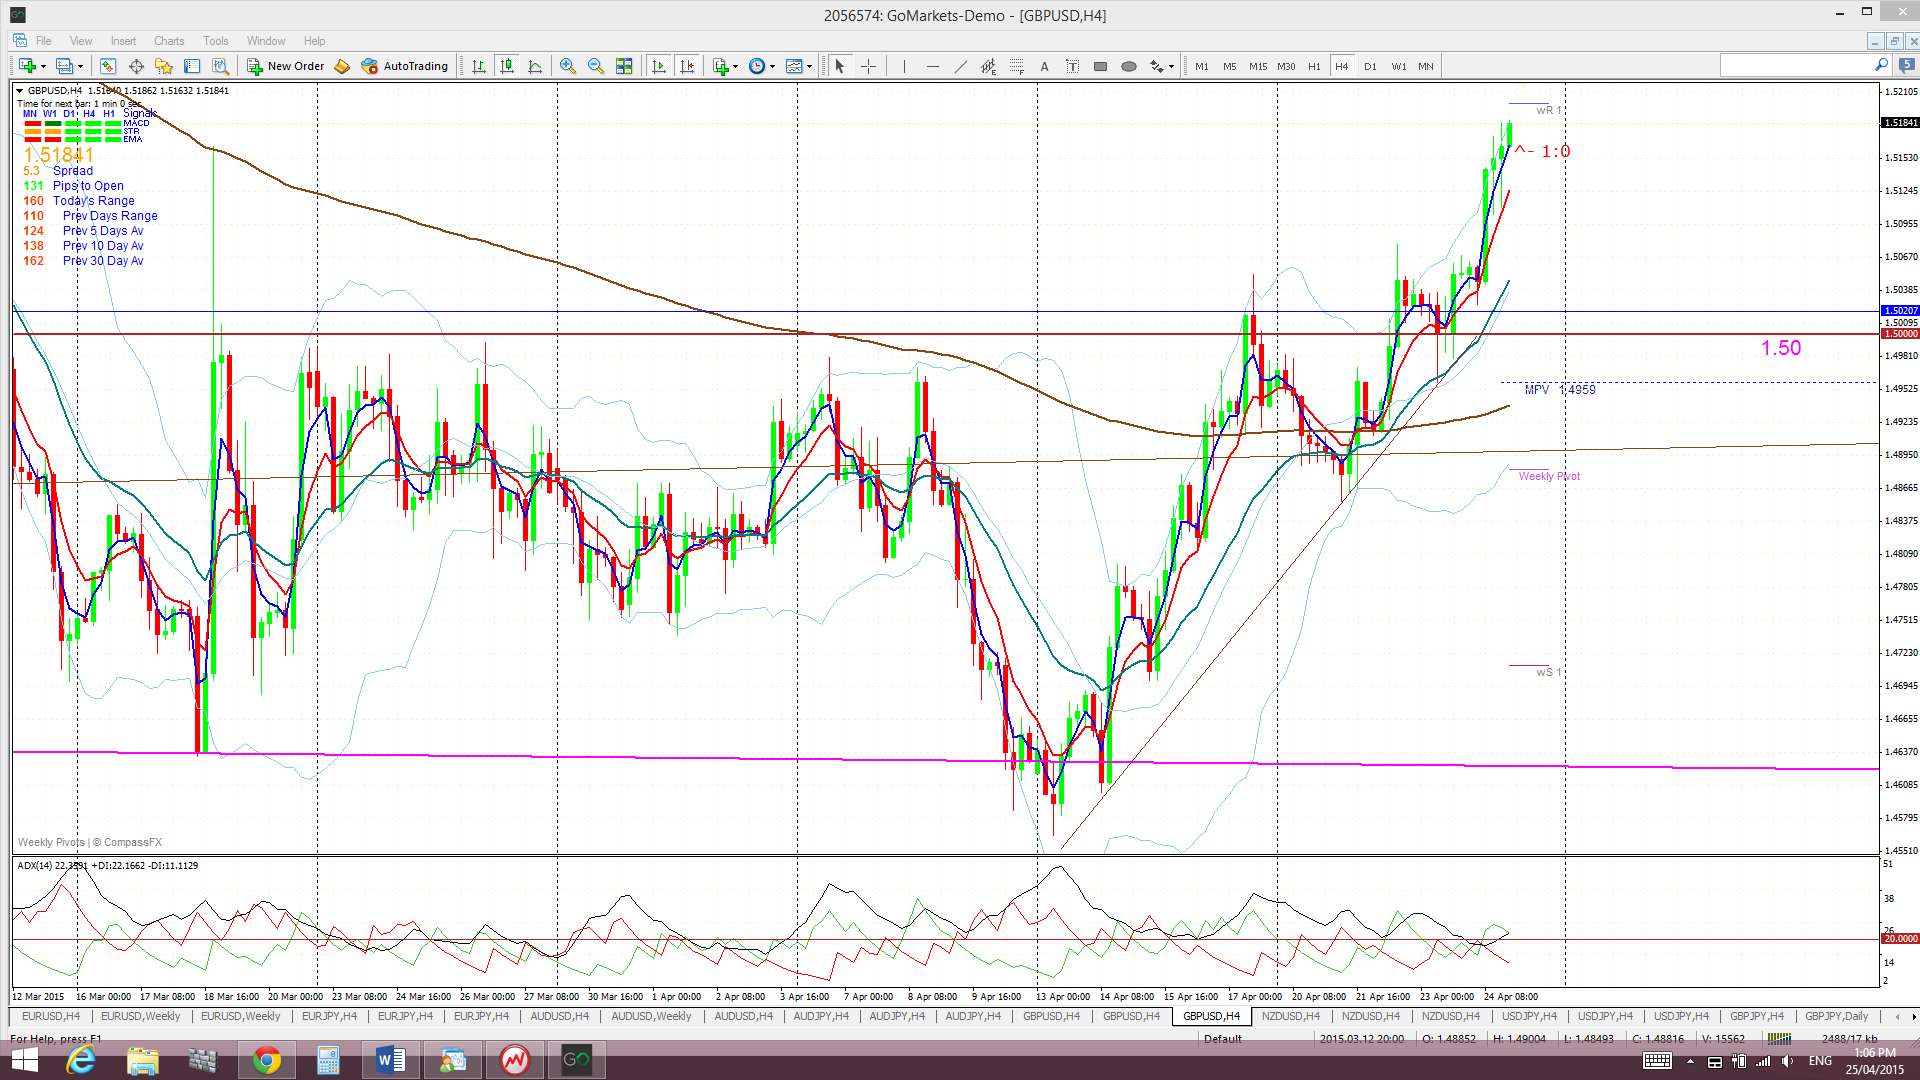
G/U: The Cable rallied much higher last week and closed back above the 1.50 S/R region. GBP data has been mixed but the weaker US$ and some less dovish BoE Minutes helped to lift price here. I have also seen talk of short-covering after the lengthy down-trend and as the UK Election approaches as contributing to gains.
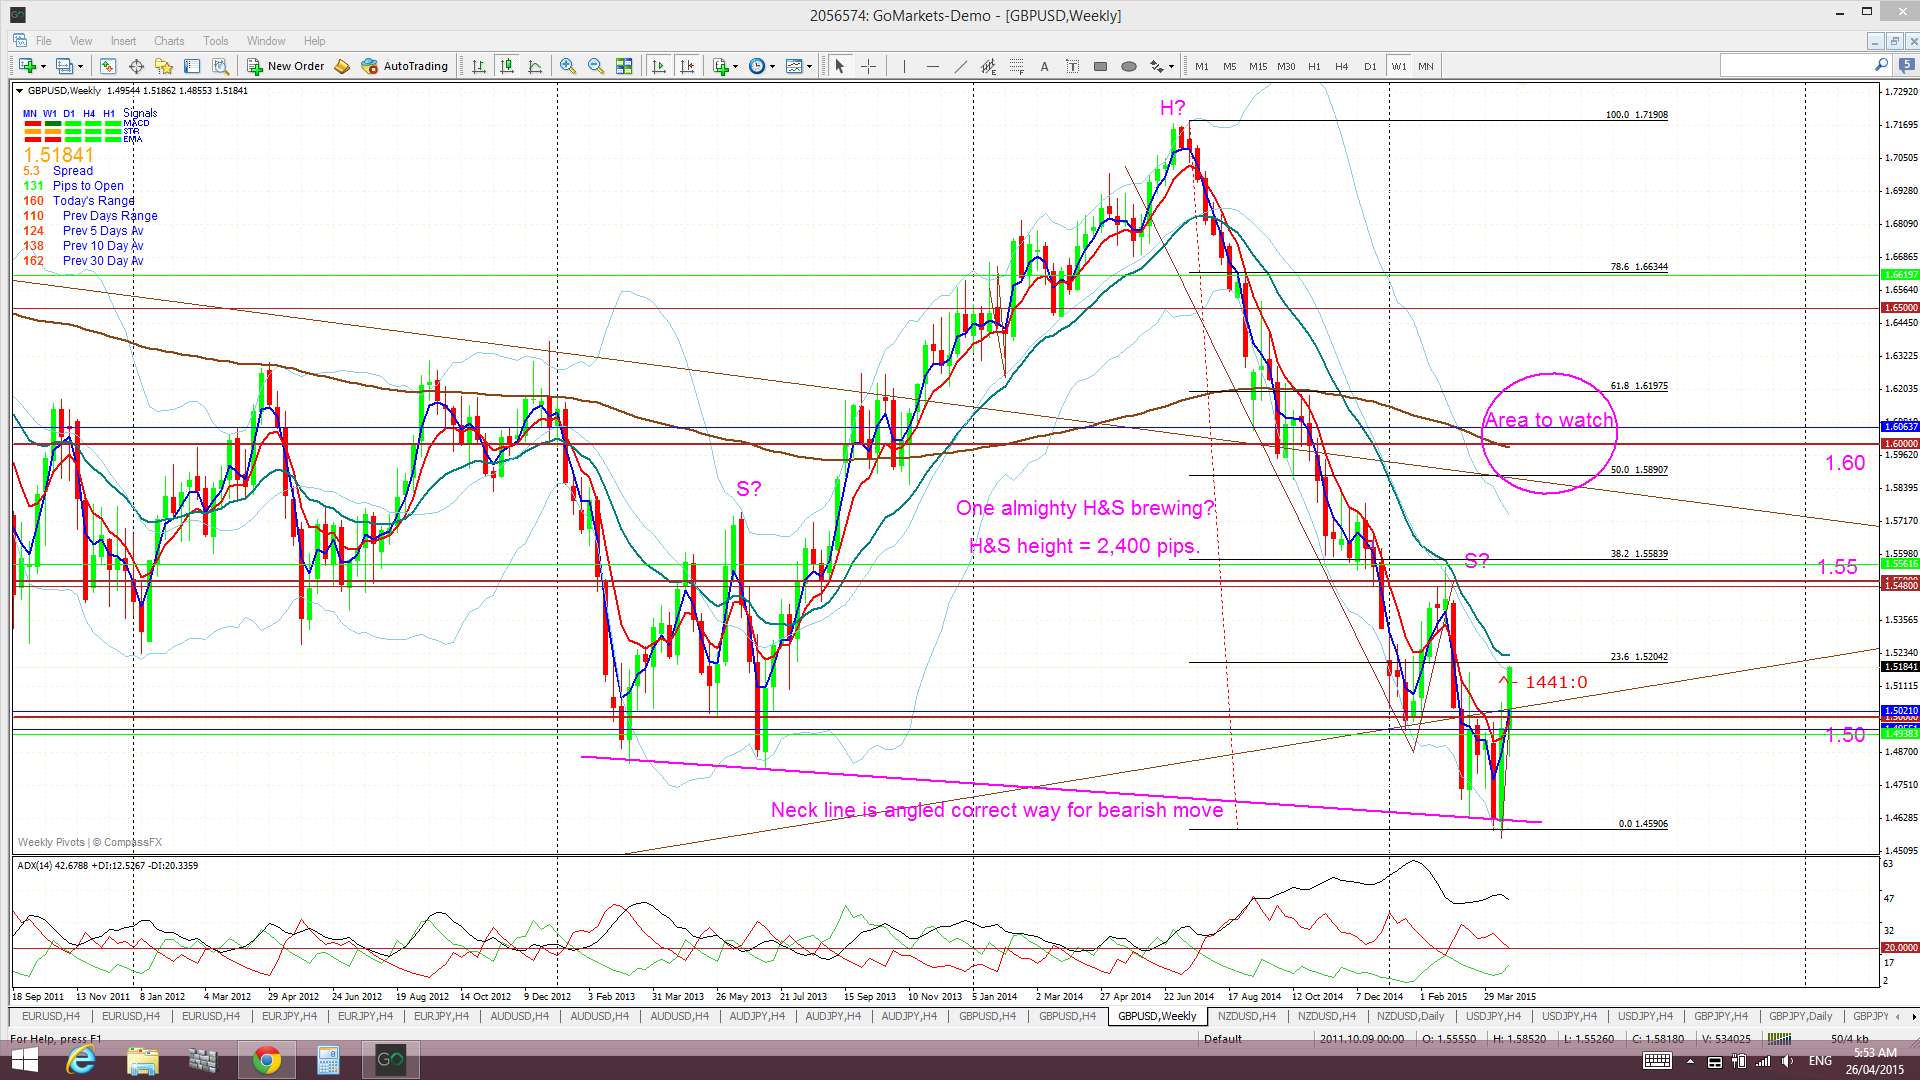
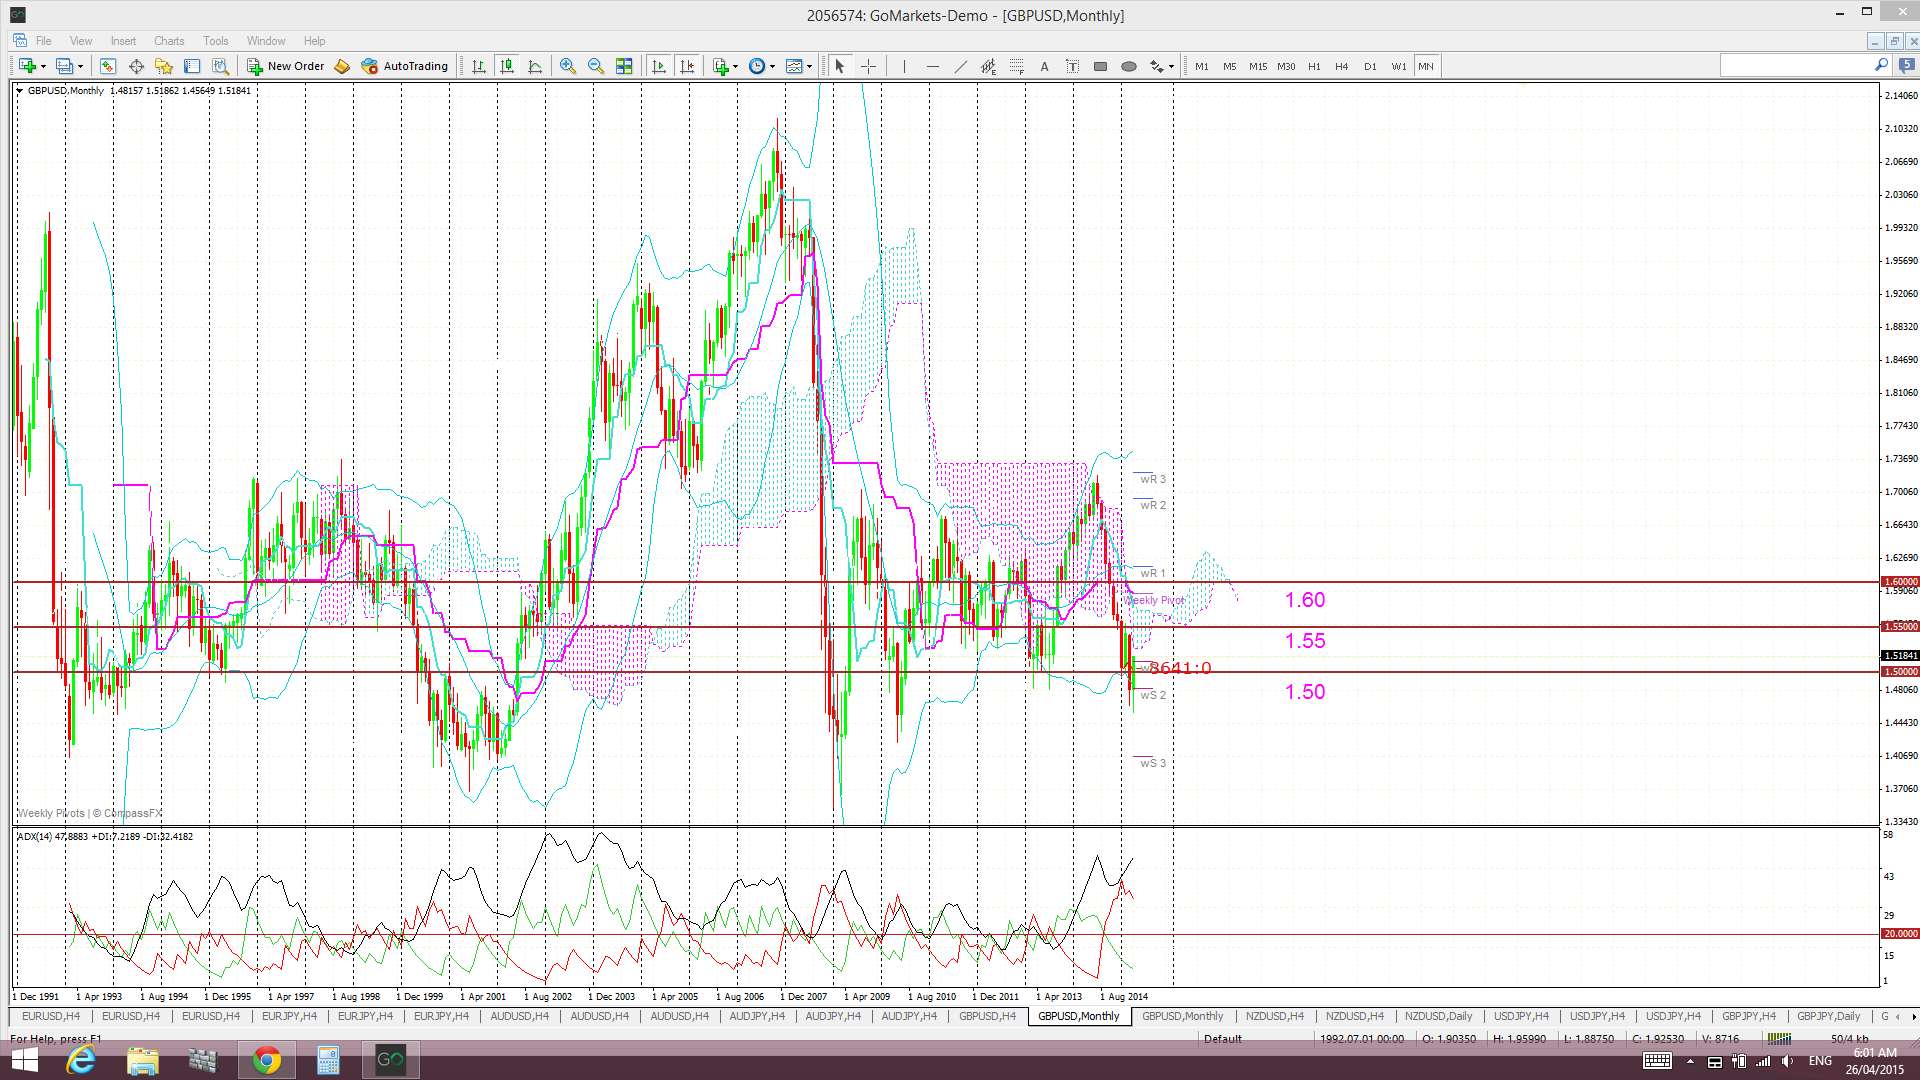
So, how far could the Cable bounce here prior to the Elections? Technical theory would have traders looking towards the 61.8% fib retracement level of the recent swing-low move. The weekly chart shows this level to be in the region of the weekly 200 EMA and the 1.60 S/R level and so there is enough confluence there to act as a possible magnet for price action. The monthly chart insert here shows the significance of the 1.60 level as one of many S/R levels for the Cable. A bounce to 1.60 may seem a bit too far for the Cable but, if US$ weakness continues then, I think anything could be possible here. The 1.60 region is about 800 pips away but price has bounced around 600 pips in the last two weeks and so a test of 1.60 may not be that far-fetched! Failing a bounce to 1.60, then, 1.55 looks a possibility:
Cable weekly: bounce target?
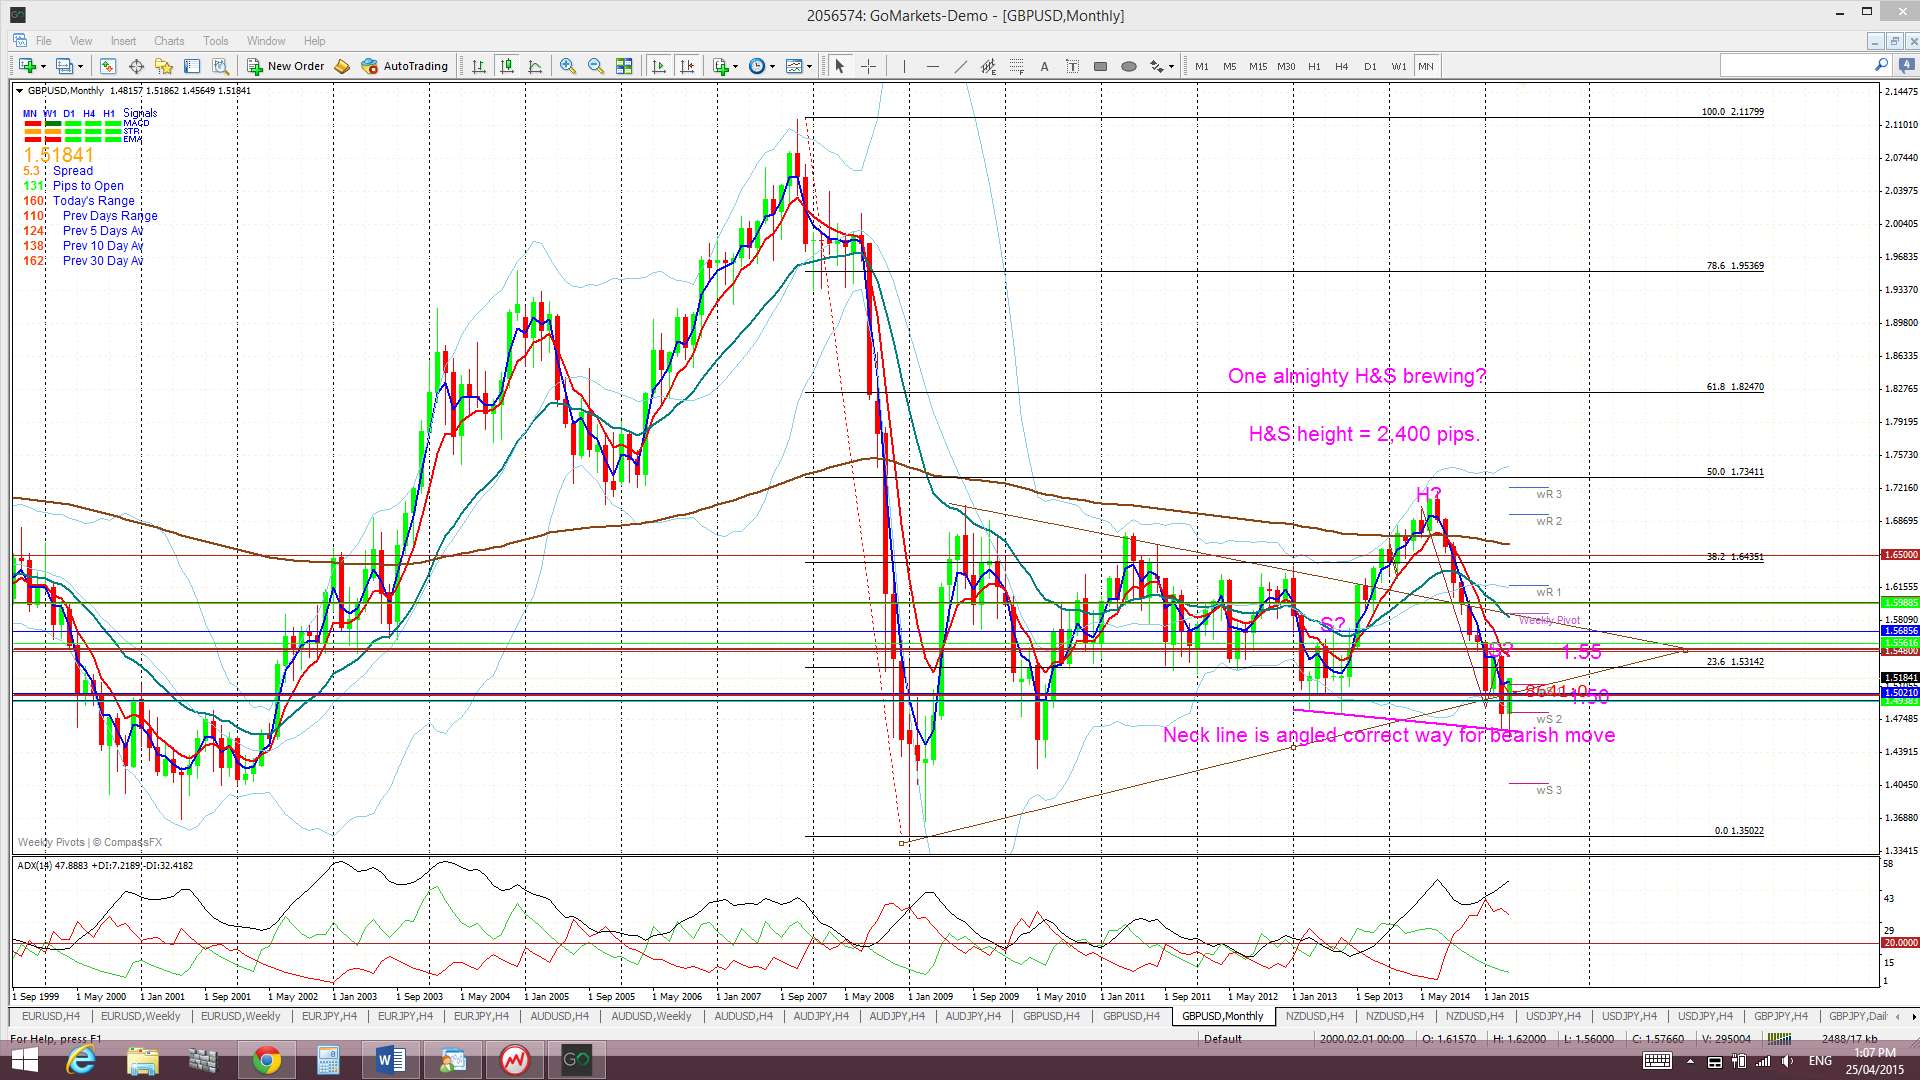
Cable monthly: 1.60 just one S/R level:
Weekly chart H&S ???: There is still a possible bearish H&S pattern forming on the weekly chart as well, although, recent strength above 1.50 undermines this for now. The height of the pattern is about 2,400 pips and suggests a similar move lower with any break and hold below the ‘neck line’. Recall that the GBP/USD printed a monthly close in March below 1.50, the first since June 2010. This bearish development supports the H&S pattern BUT we will need to see a close and hold below the neck line to confirm any such bearish breakdown. The ‘Left Hand Shoulder’ was quite choppy for a while and so this current price action could still be just helping to from up the Right Hand Shoulder. We shall have to wait and see!
Price is now trading above the Cloud on the 4hr and daily charts but below on the weekly and monthly charts however this is a significant bullish shift.
The weekly candle closed as a large bullish candle following on from last week’s large bullish ‘engulfing’ candle.
Cable traders will be closely watching Tuesday’s GBP GDP and Friday’s GBP Manufacturing PMI data this week but Wednesday’s US FOMC will impact here as well. The over-riding issue for the Cable throughout the next couple of weeks though is the UK General Election set down for May 7th. The uncertainty surrounding the result of this election will most likely keep pressure on the Cable but I am keeping an open mind about a possible bounce move if US$ weakness continues.
- I’m watching for any new TC signal on this pair and the 1.50 level.

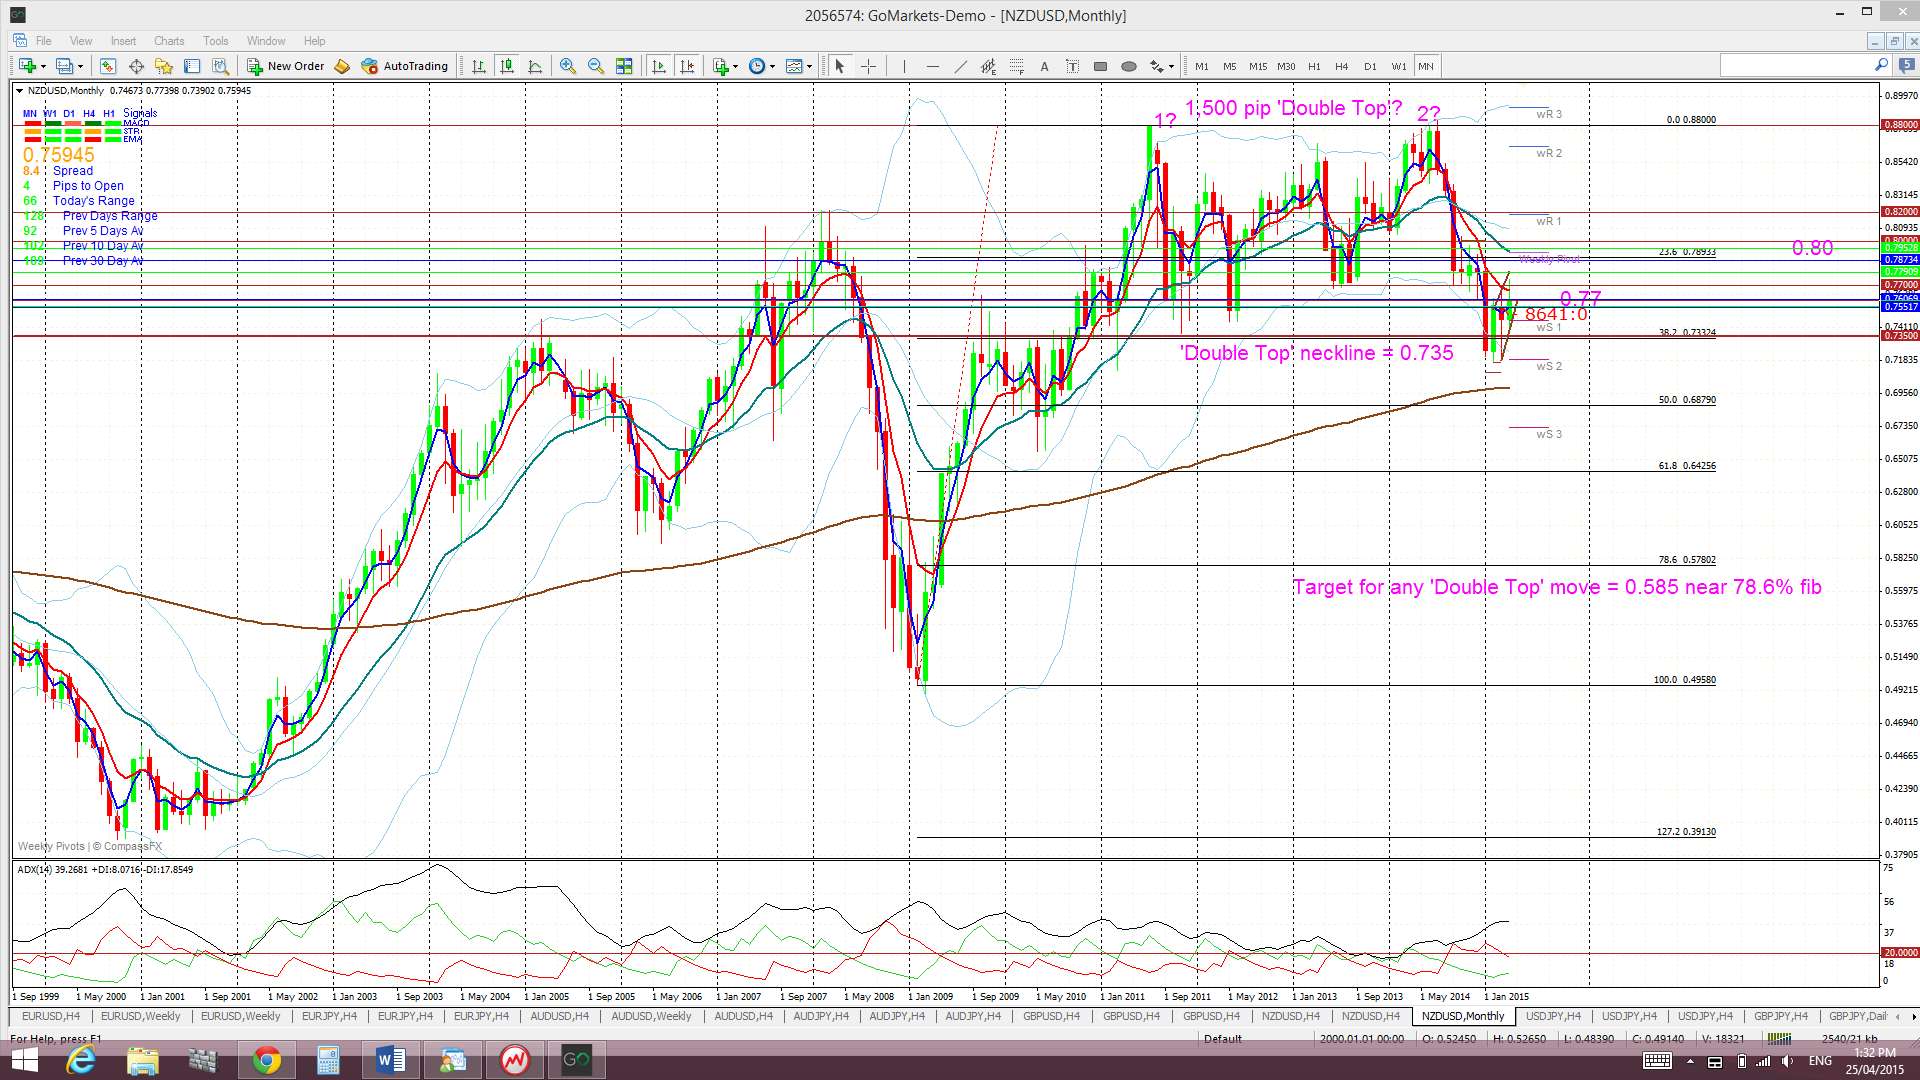
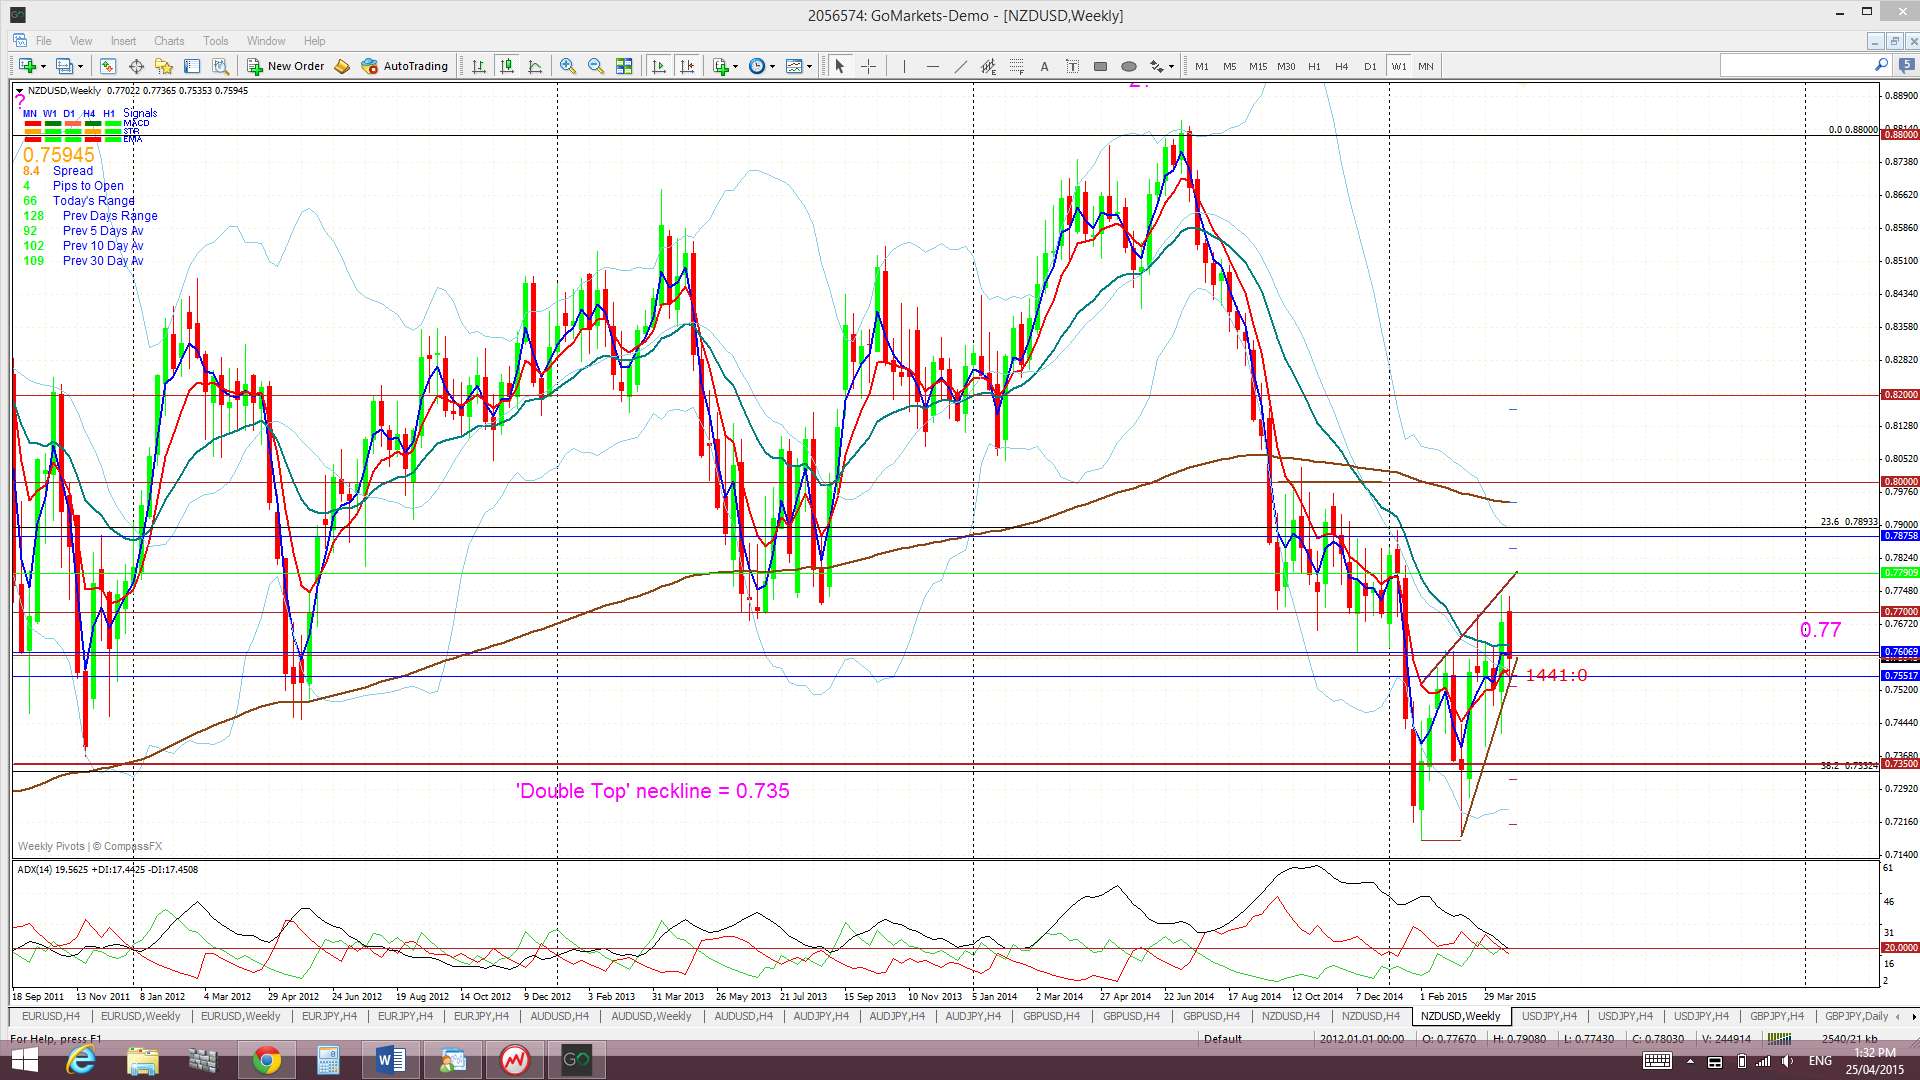
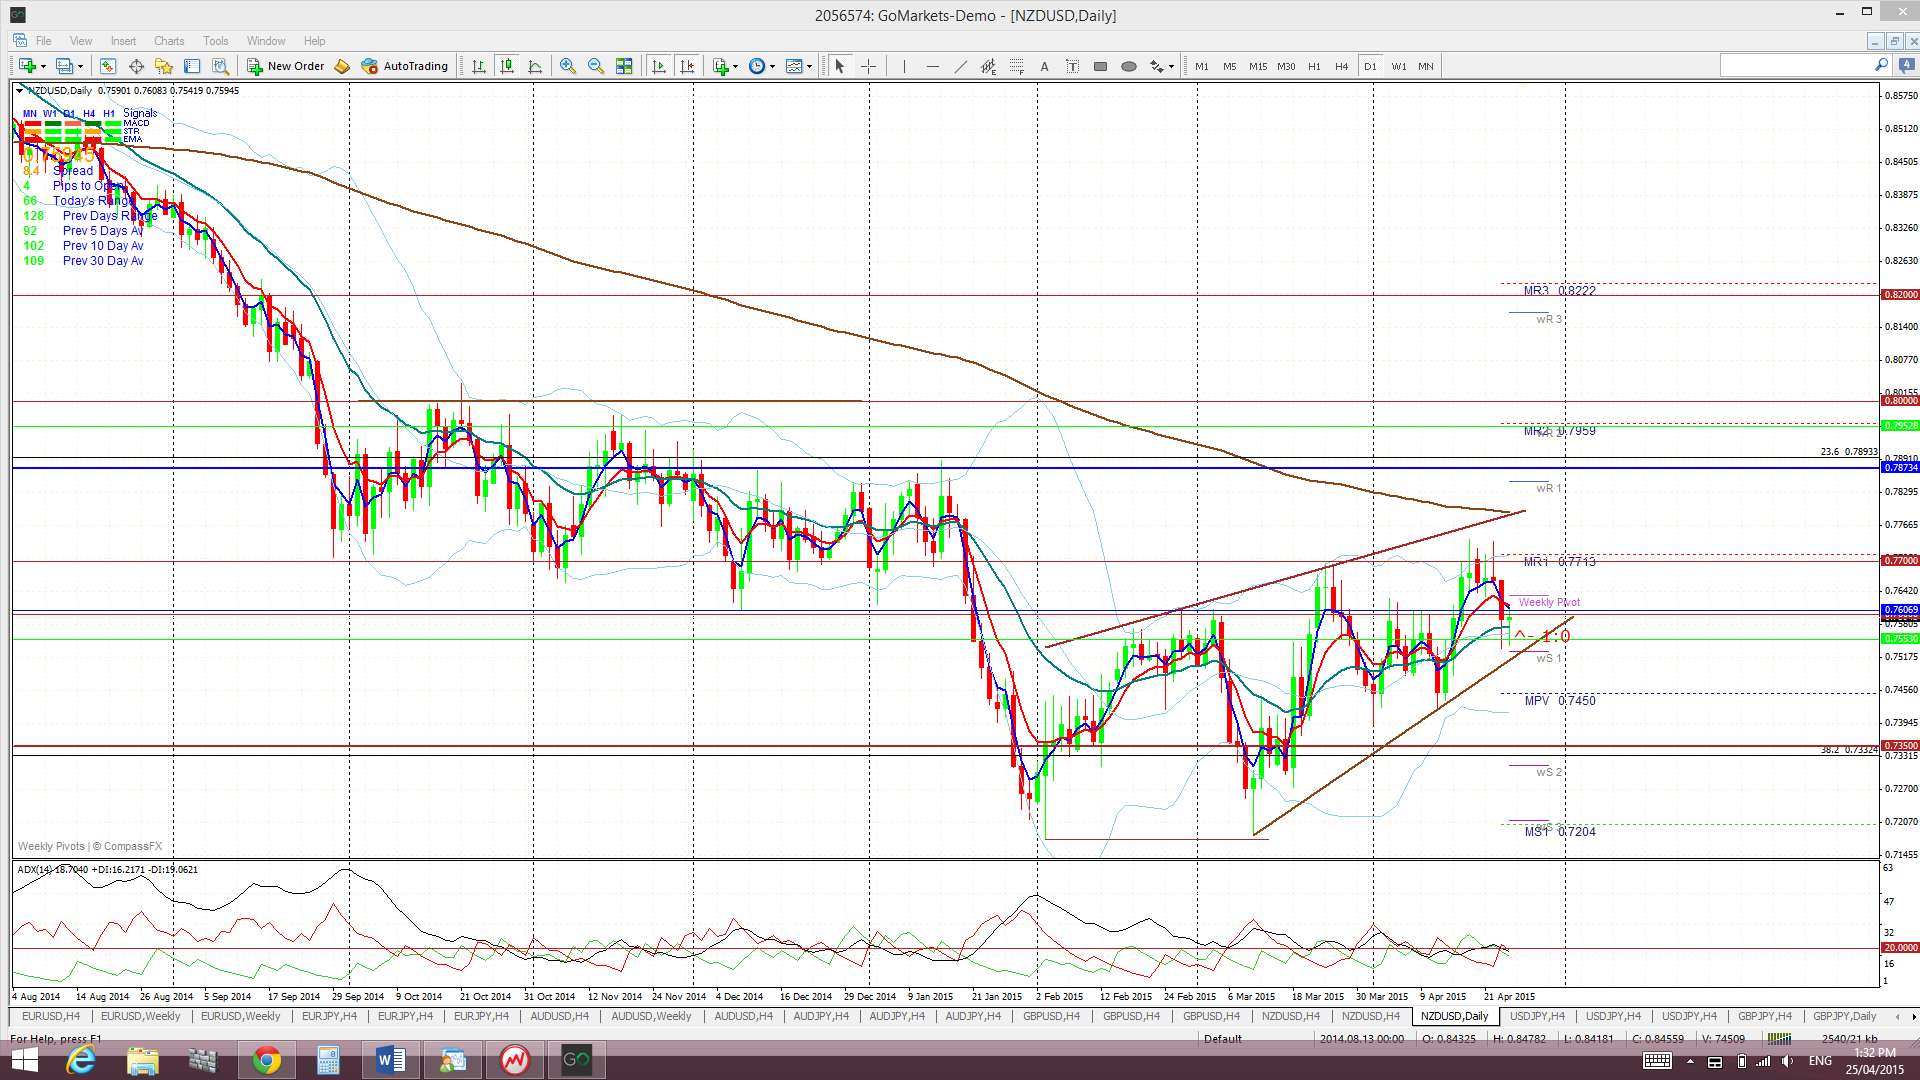
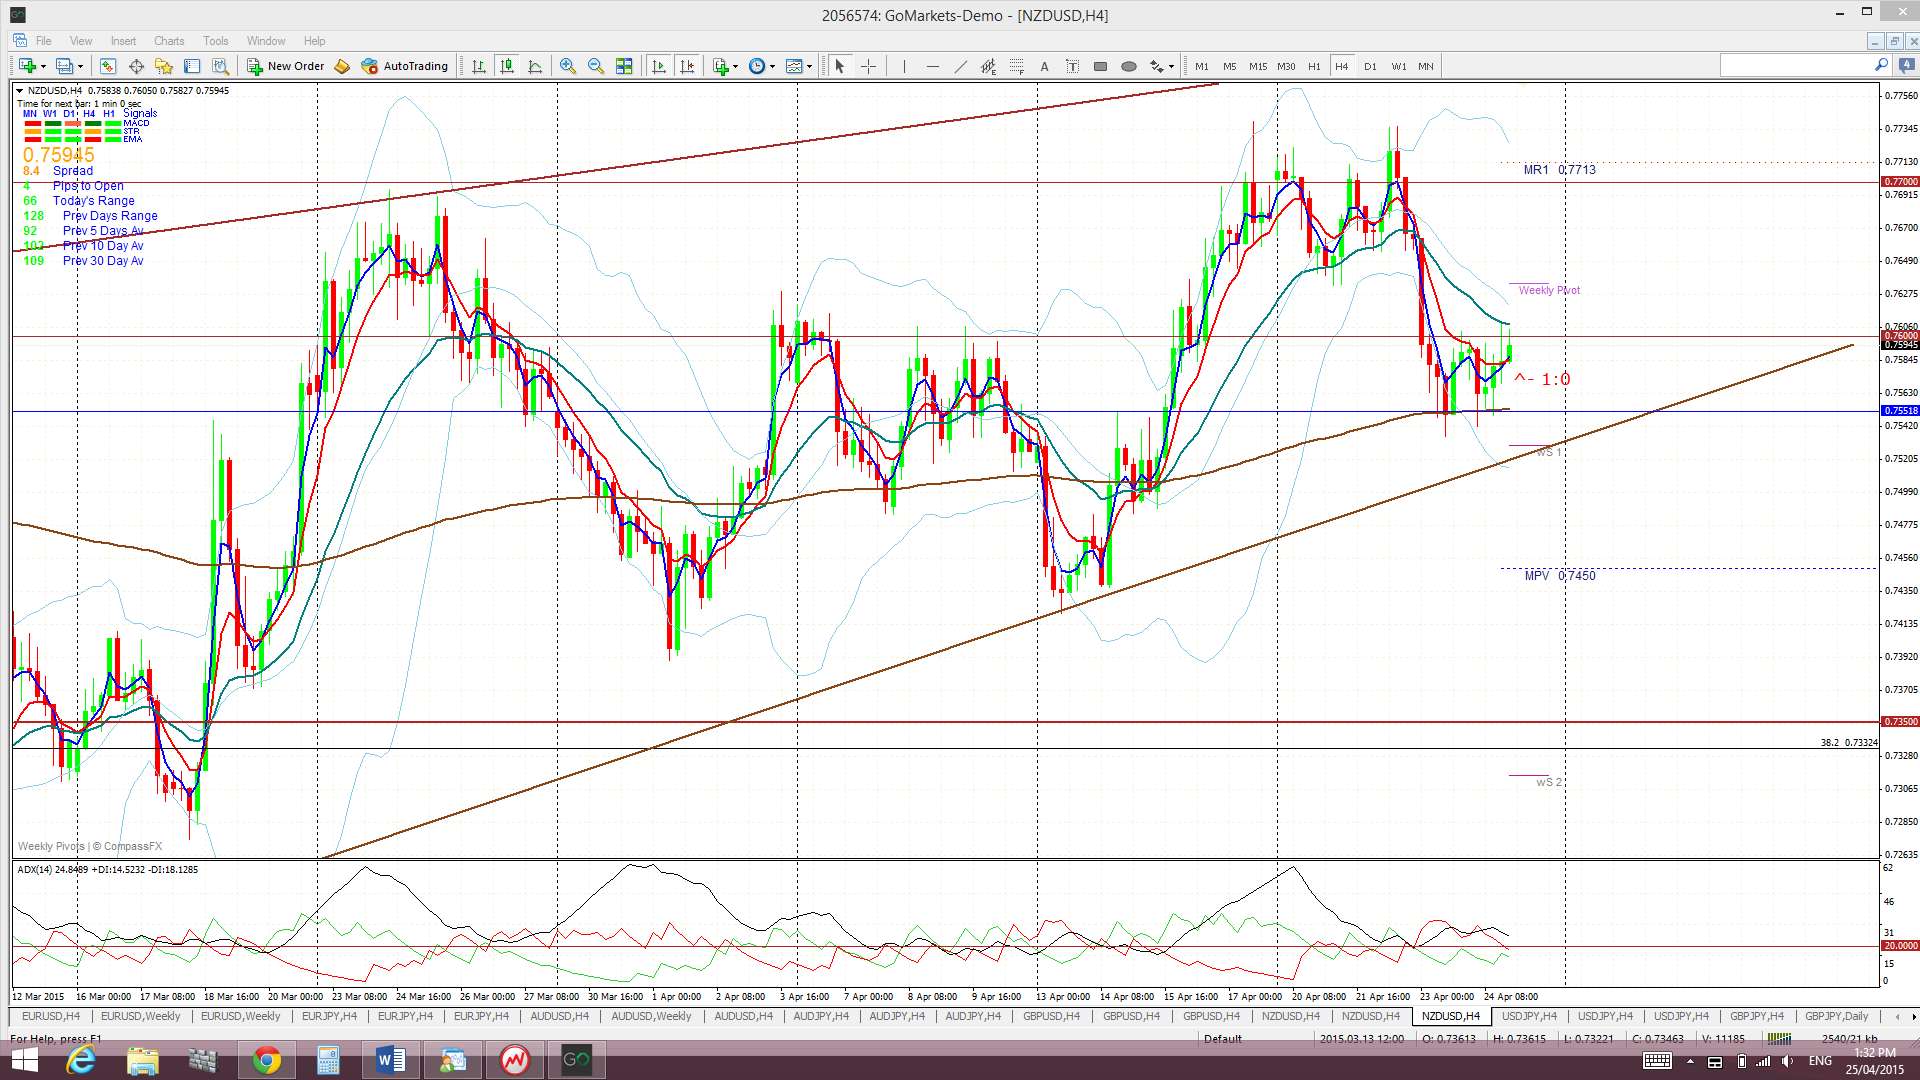
Kiwi: NZD/USD: The Kiwi chopped up to the 0.77 level last week but jaw-boning from the RBNZ resulted in price reversing from this peak and then closing the week just below 0.76. The daily and 4hr charts now show price action in a bearish ascending wedge ahead of next week’s RBNZ Cash Rate announcement.
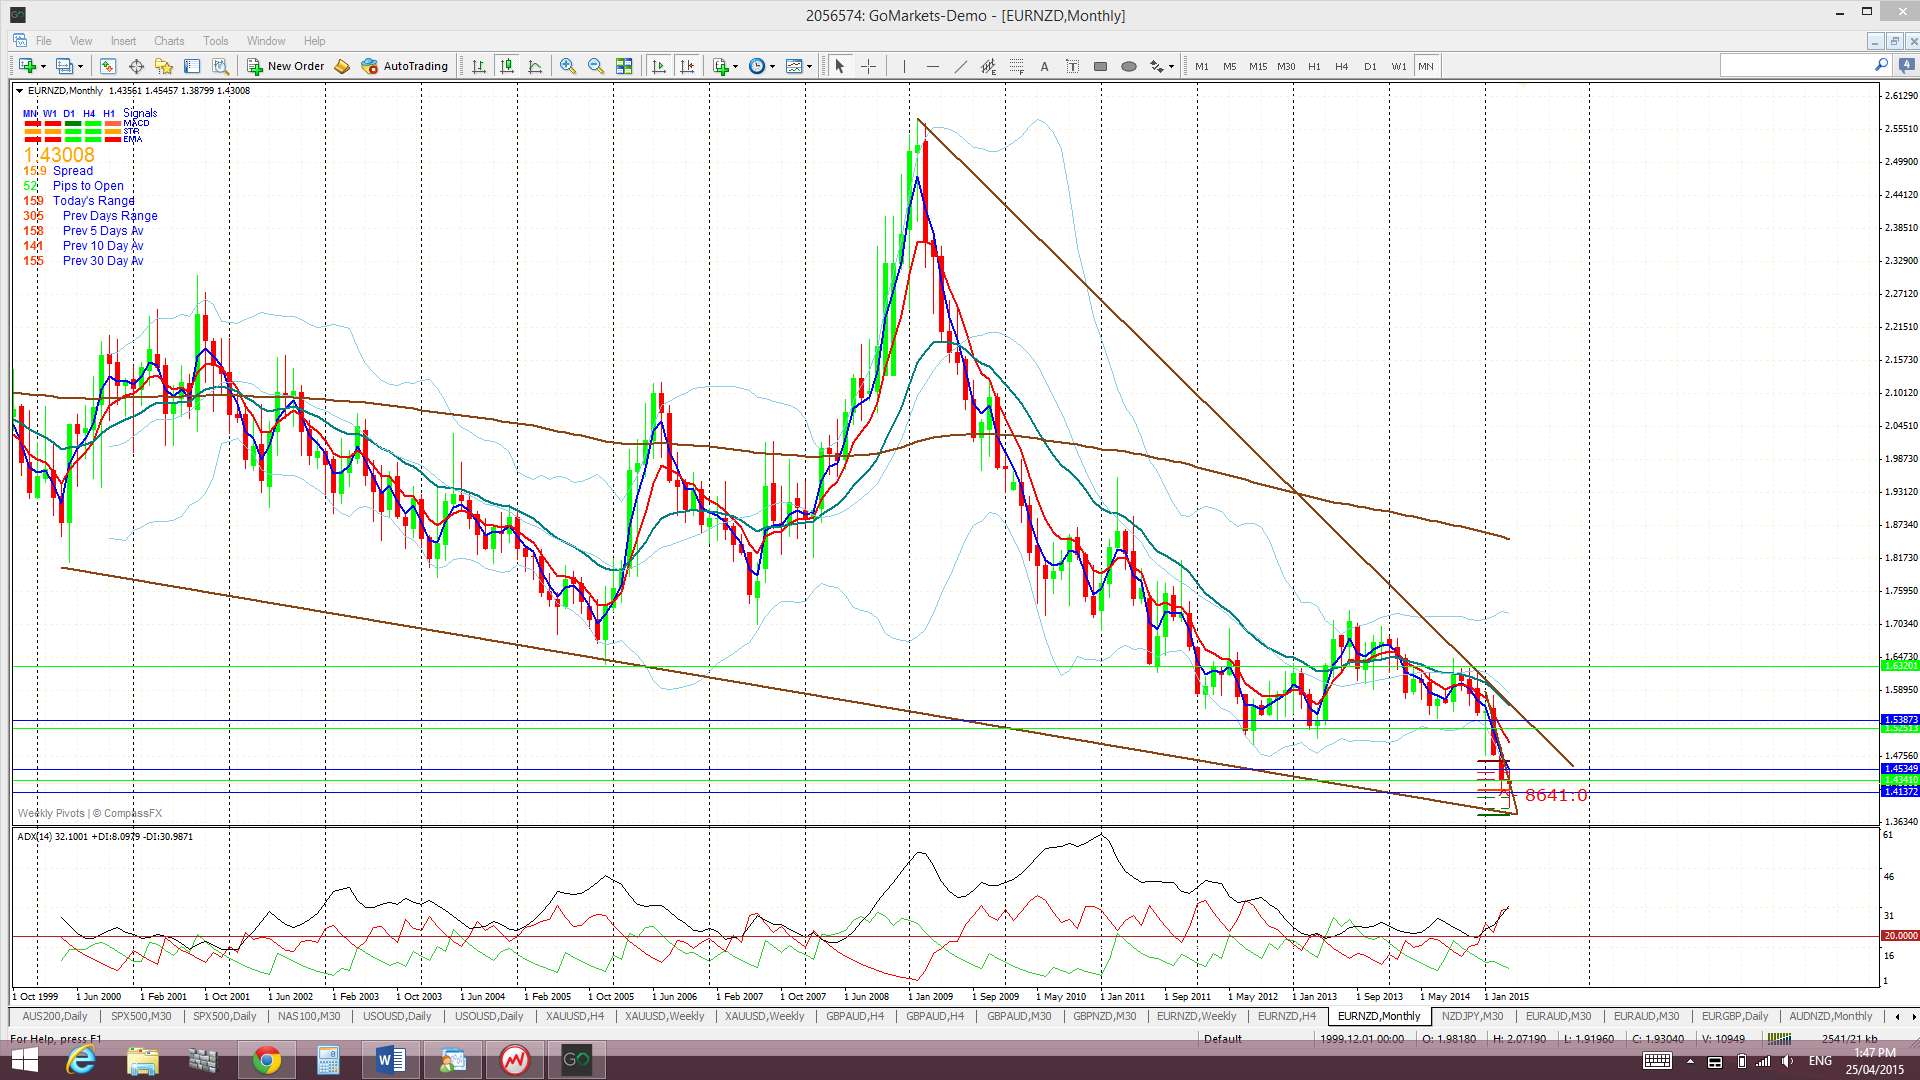
‘Double Top’ breakdown on Monthly chart? The monthly chart still reveals a possible ‘Double Top’ pattern with a neck line at 0.735 in the making. The monthly candle close below this level for January suggested a possible 2,000 pip bearish follow through move as this is the height of the ‘Double Top’ BUT there does not seem to be a hold below this key level JUST YET. This may still well evolve, especially if the USD index regains its bullish mojo but any reversal on the USD index could see Kiwi continue to bounce up off this major support.
Price is now trading in the bottom of the Ichimoku Cloud on the 4hr chart, above the Cloud on the daily chart, below on the weekly chart but in the middle of the Cloud on the monthly chart.
The weekly candle closed as a large bearish candle.
The mains risk events for the Kiwi this week include Wednesday’s Trade Balance & Business Confidence data and Thursday’s RBNZ Cash Rate announcement but Wednesday’s FOMC and Friday’s Chinese Manufacturing PMI will also impact here.
- I’m watching for any new TC signal on this pair, the 0.77 level and the wedge trend lines.
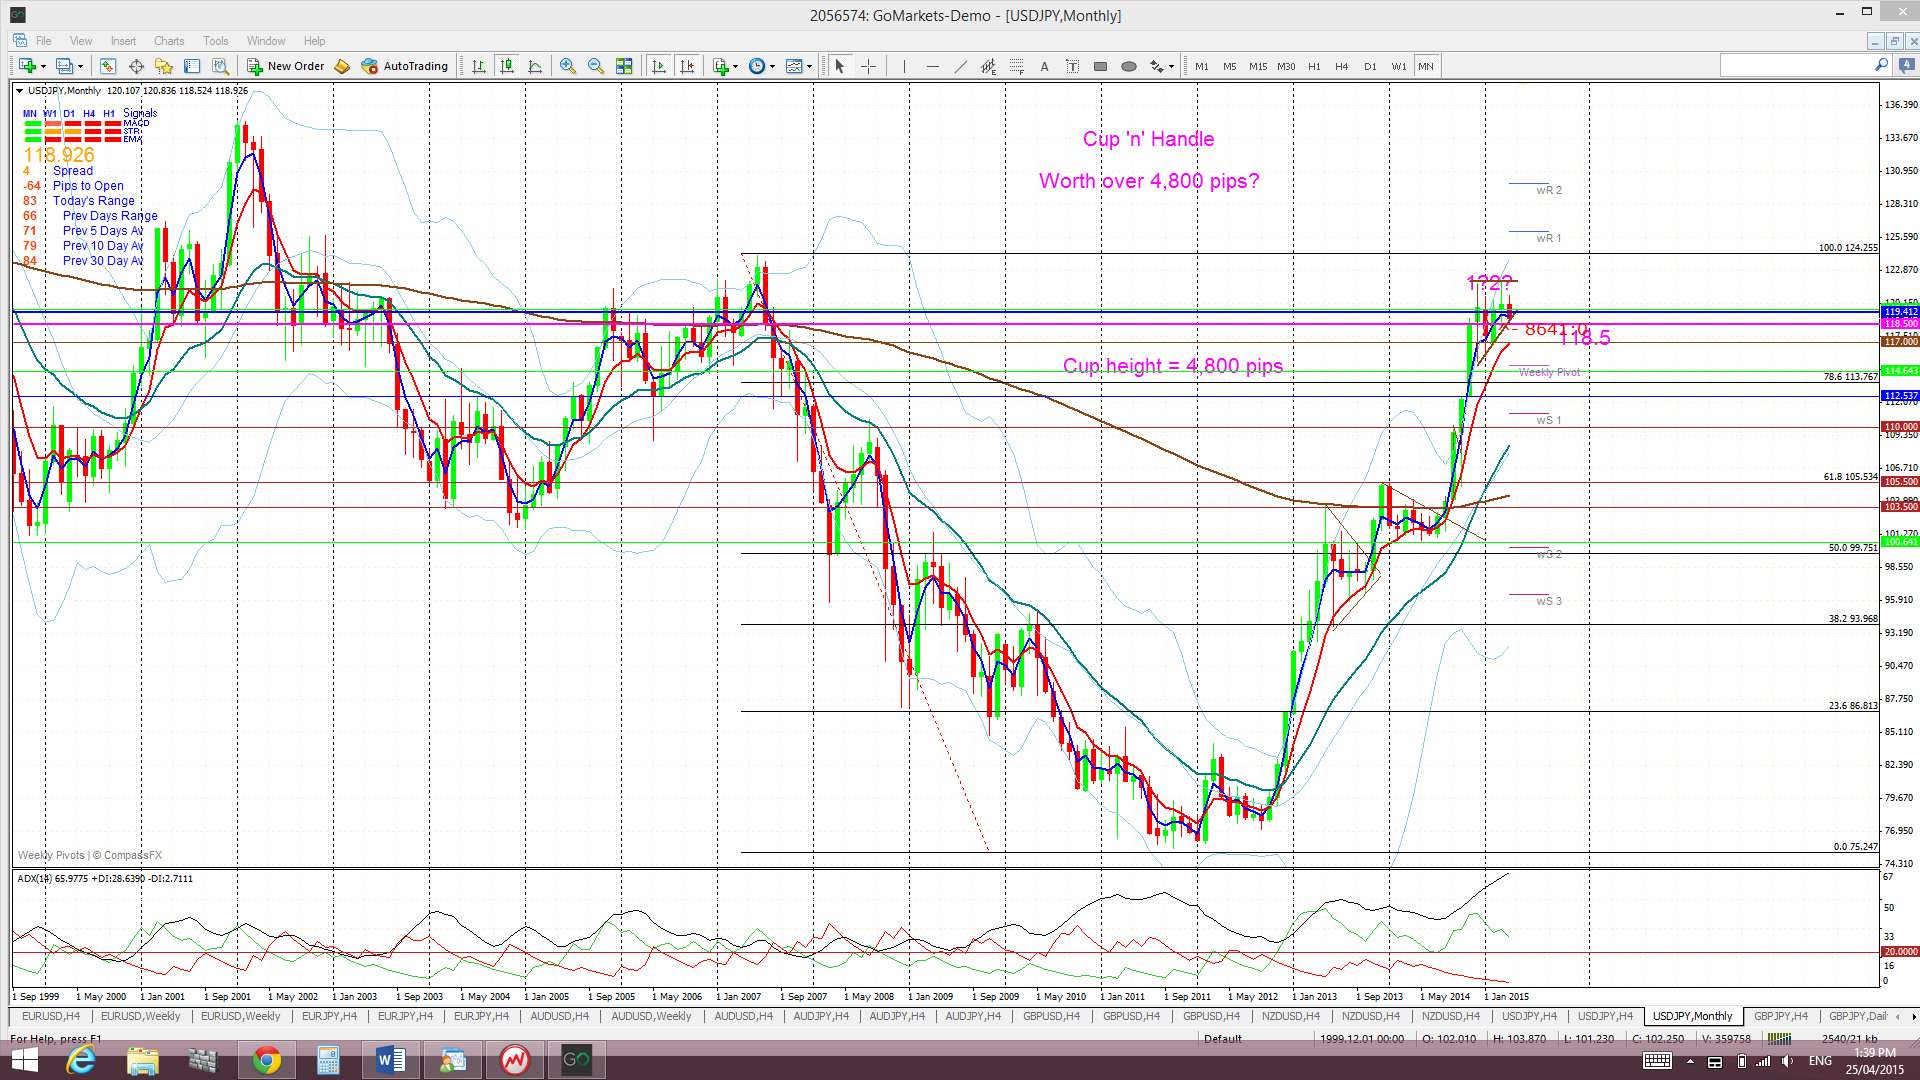
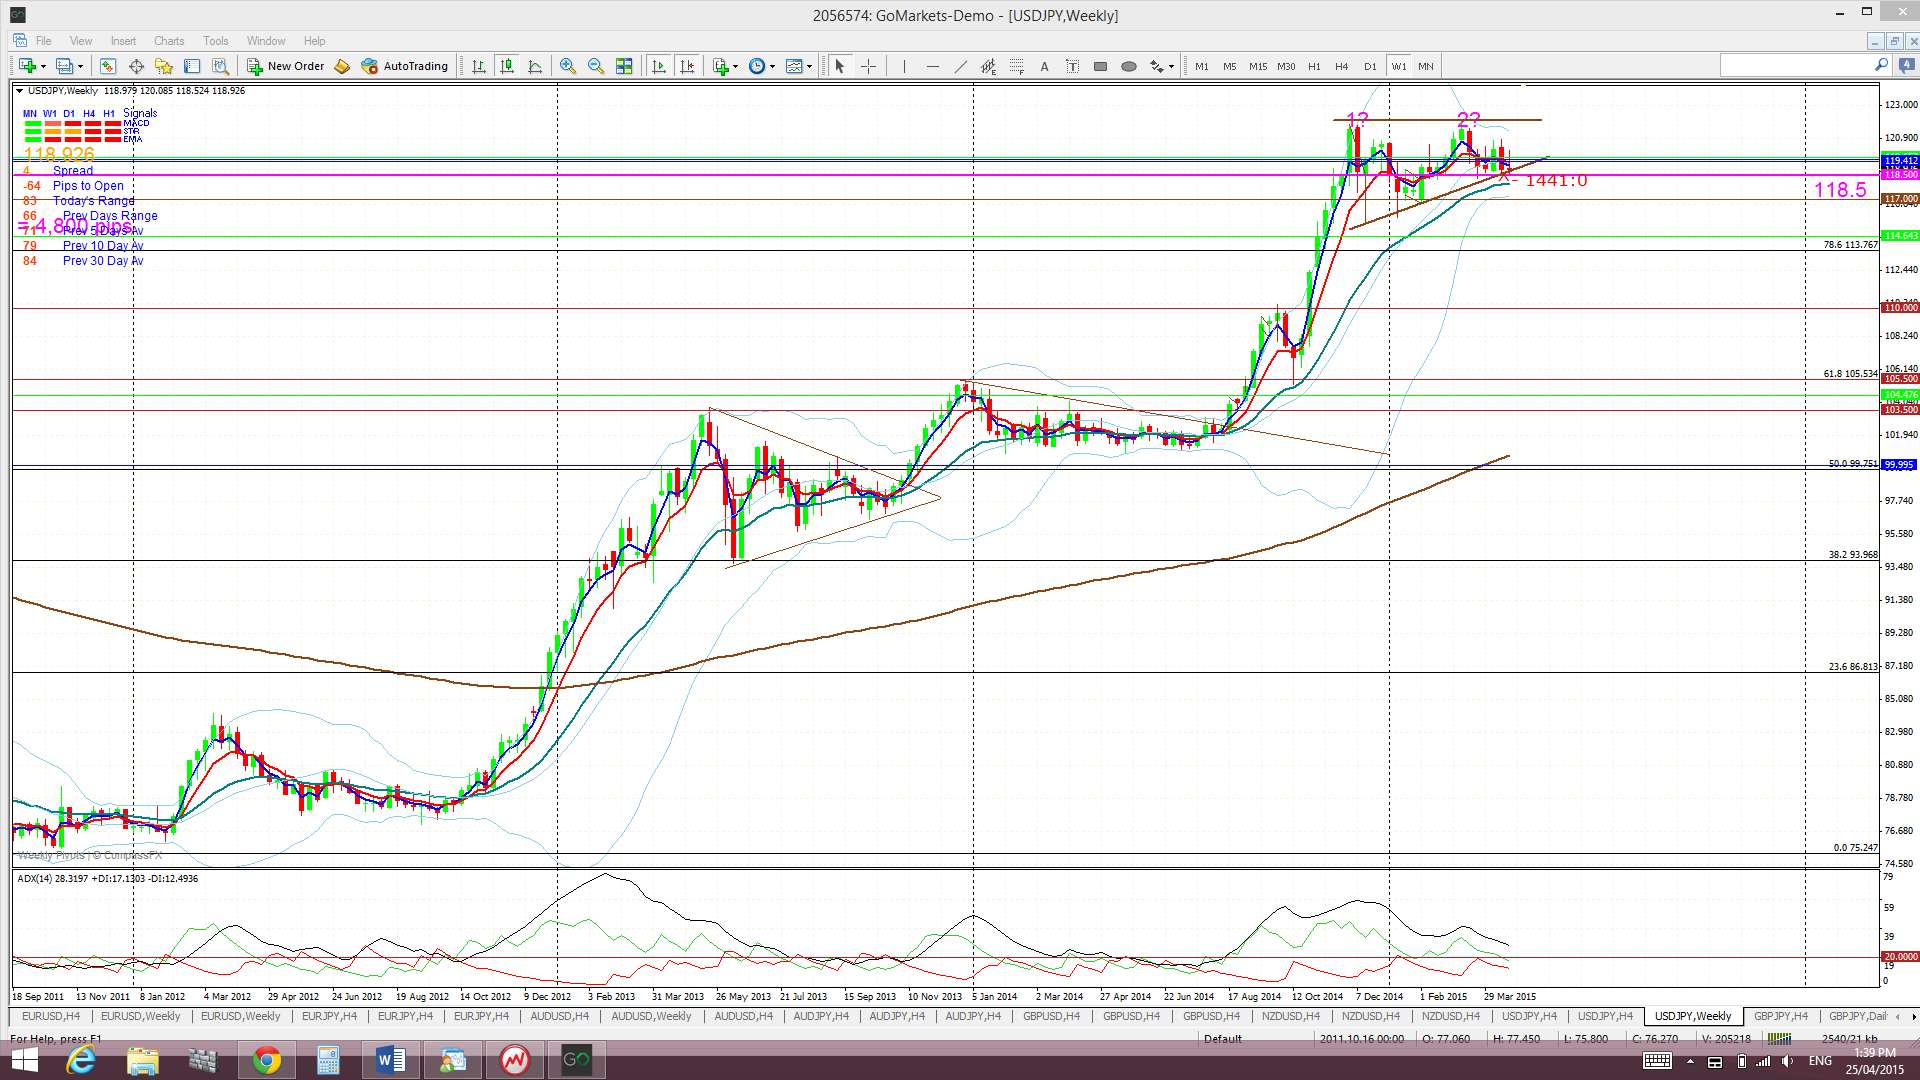
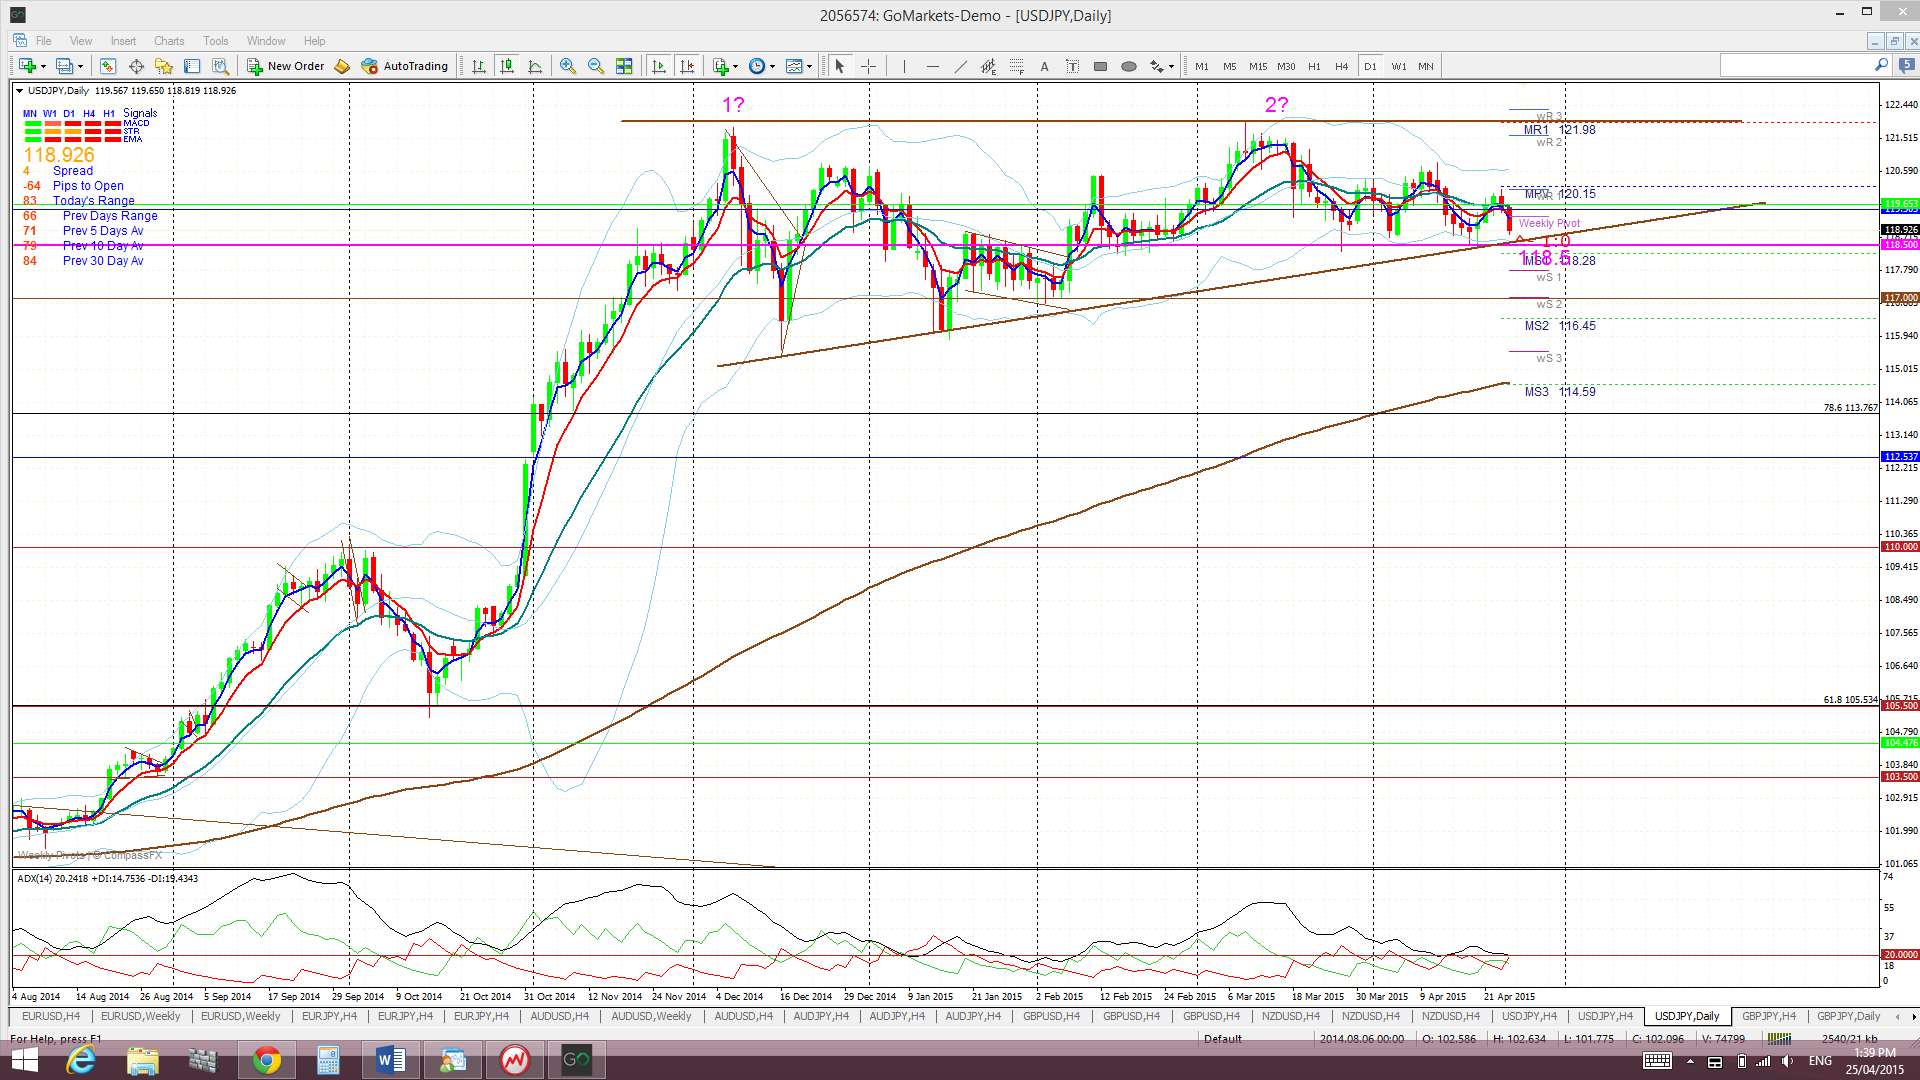
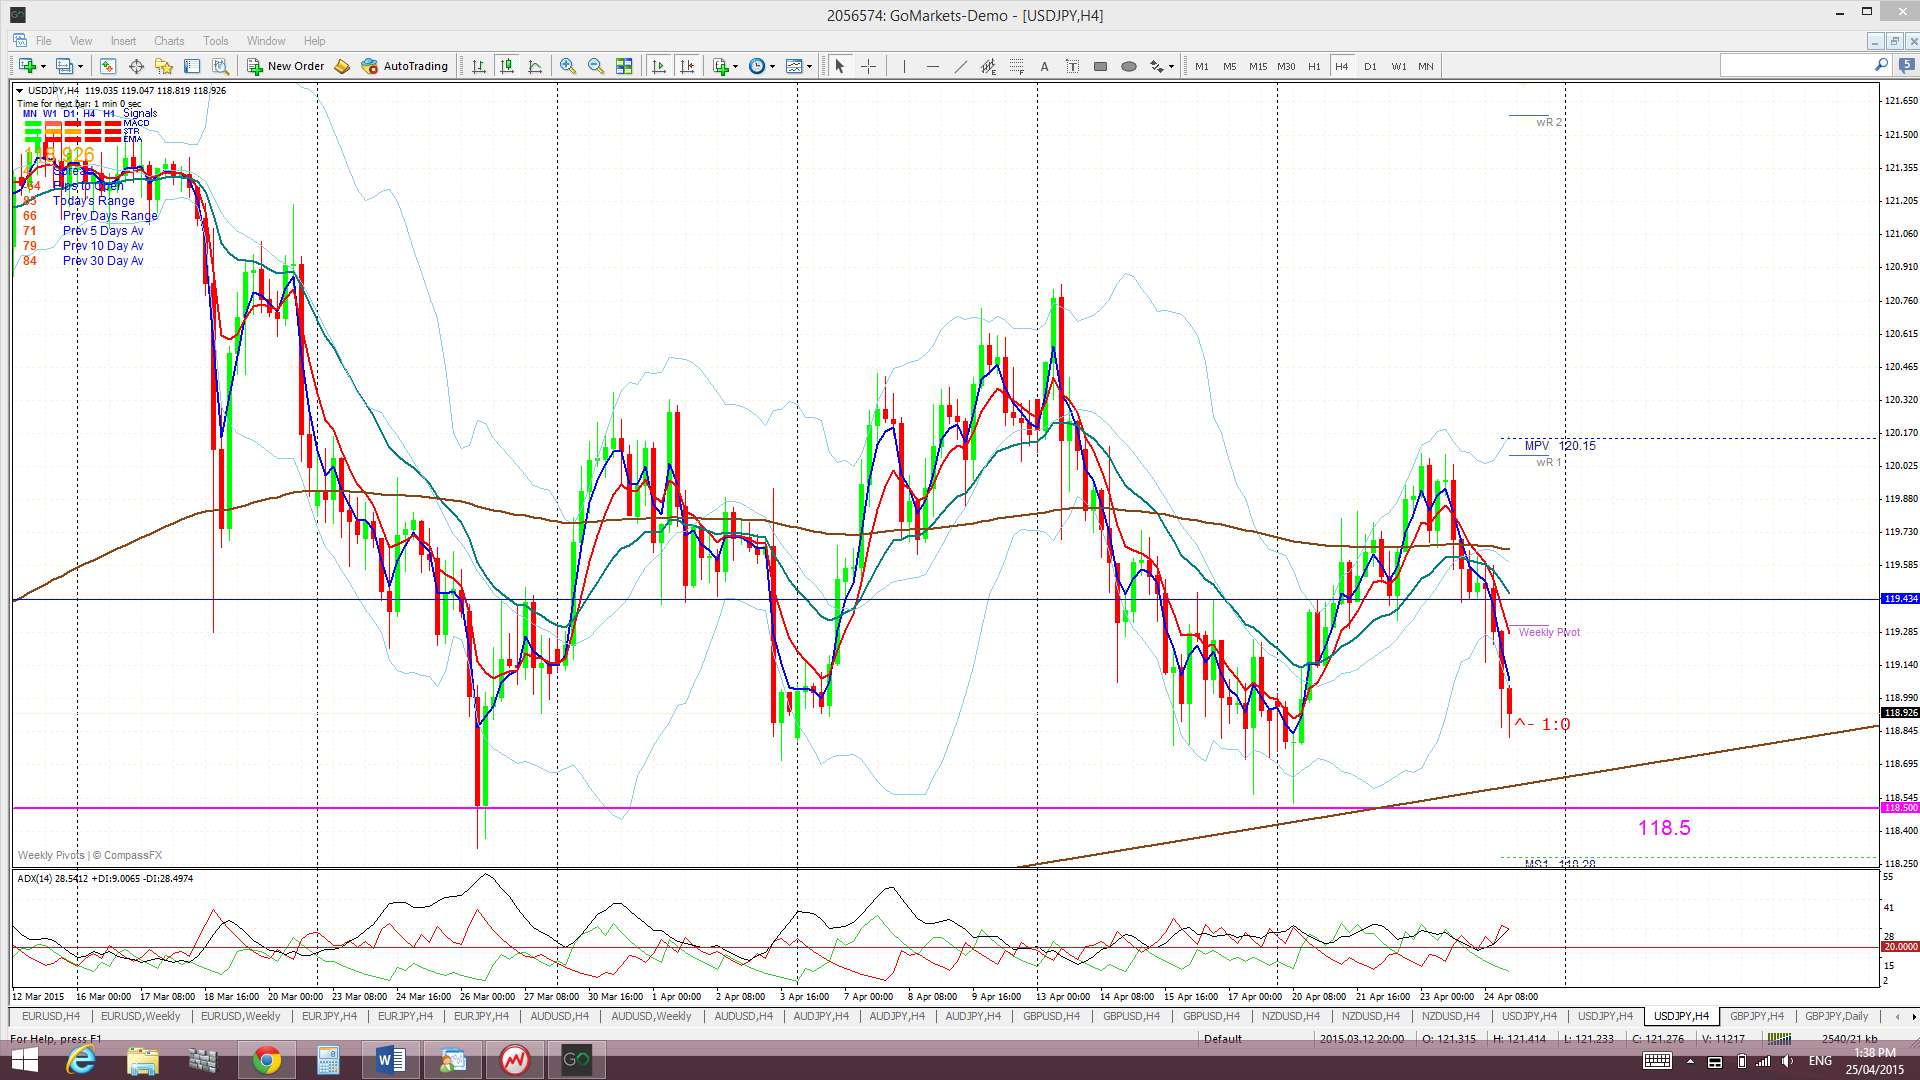
The Yen: U/J: The U/J chopped up and down last week after bouncing up off trend line and 118.5 support. The daily/weekly charts still show a bullish ascending triangle pattern developing and I continue to view this choppy triangle action as helping to form the ‘Handle’ of a potential Cup ‘n’ Handle on the monthly chart.
Price is now trading below the Cloud on the 4hr chart, at the bottom edge of the Cloud on the daily chart but above the Cloud on the weekly and monthly charts. November 2013 was the first monthly candle close above the Ichimoku Cloud since mid-2007 and the bullish hold above the monthly Cloud continues to be noteworthy.
The weekly candle closed as a bearish coloured Doji candle.
Monthly Chart Bullish Cup’ n’ Handle pattern: There looks to be a new bullish Cup ‘n’ Handle forming up on the monthly chart. The theory behind these patterns is that the height of the ‘Cup’ pattern is equivalent to the expected bullish move from the ‘handle’ breakout. The height of the Cup for the U/J weekly chart is around 4,800 pips.
- I’m watching for any new TC signal on this pair, the ‘Handle’ trend lines and the 118.5 level.
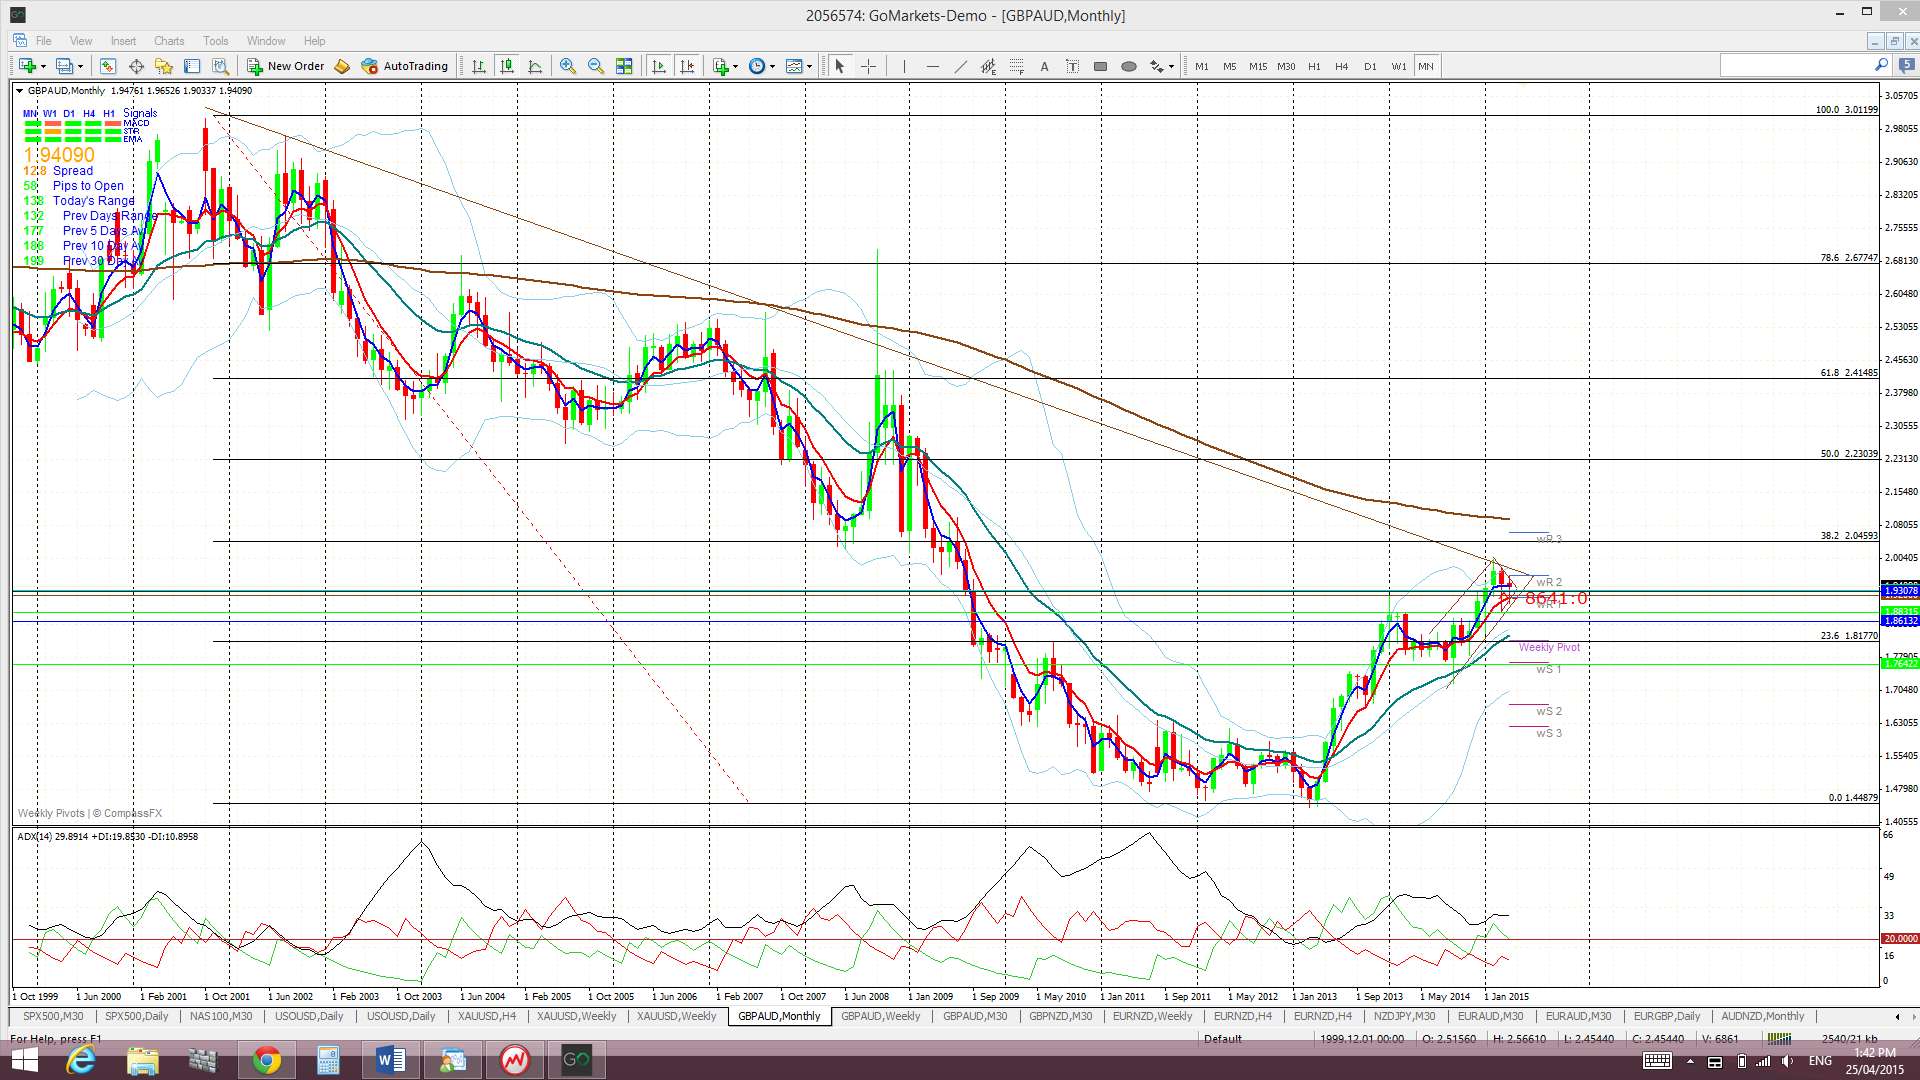
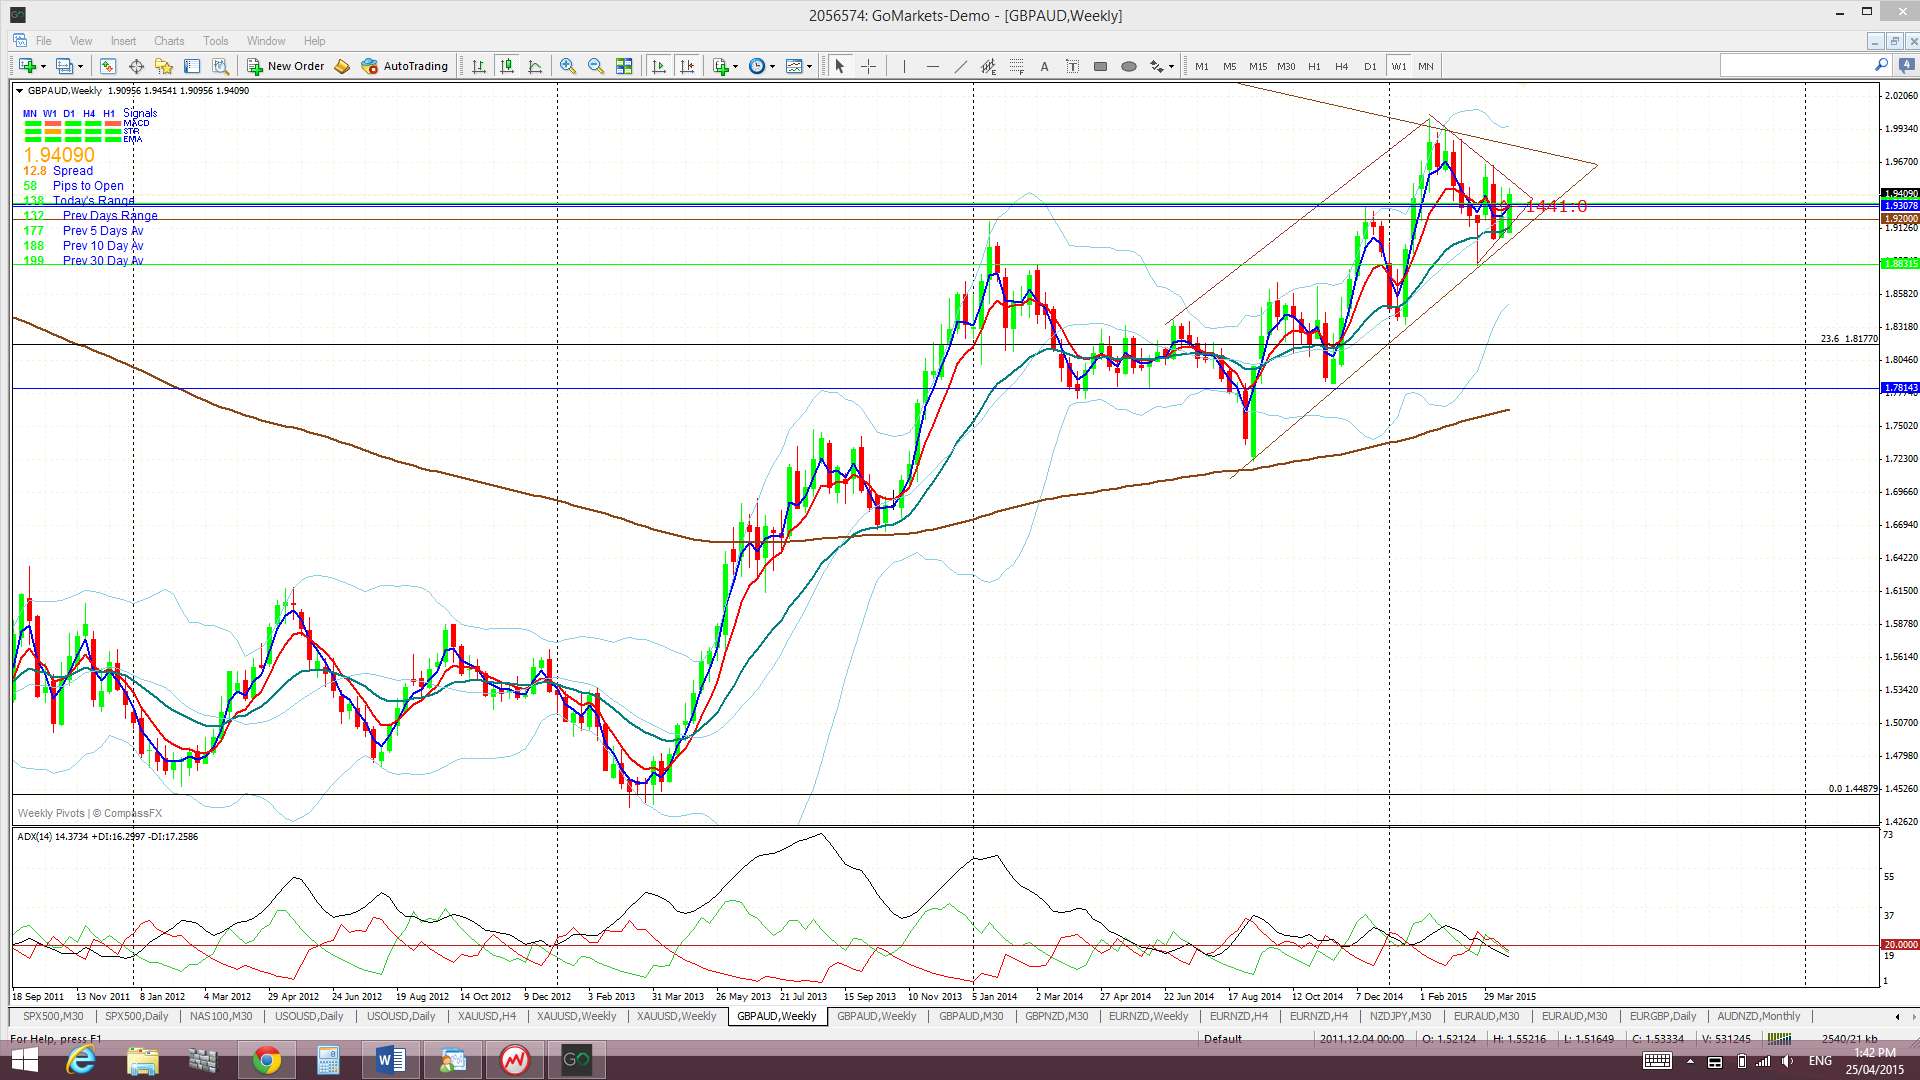
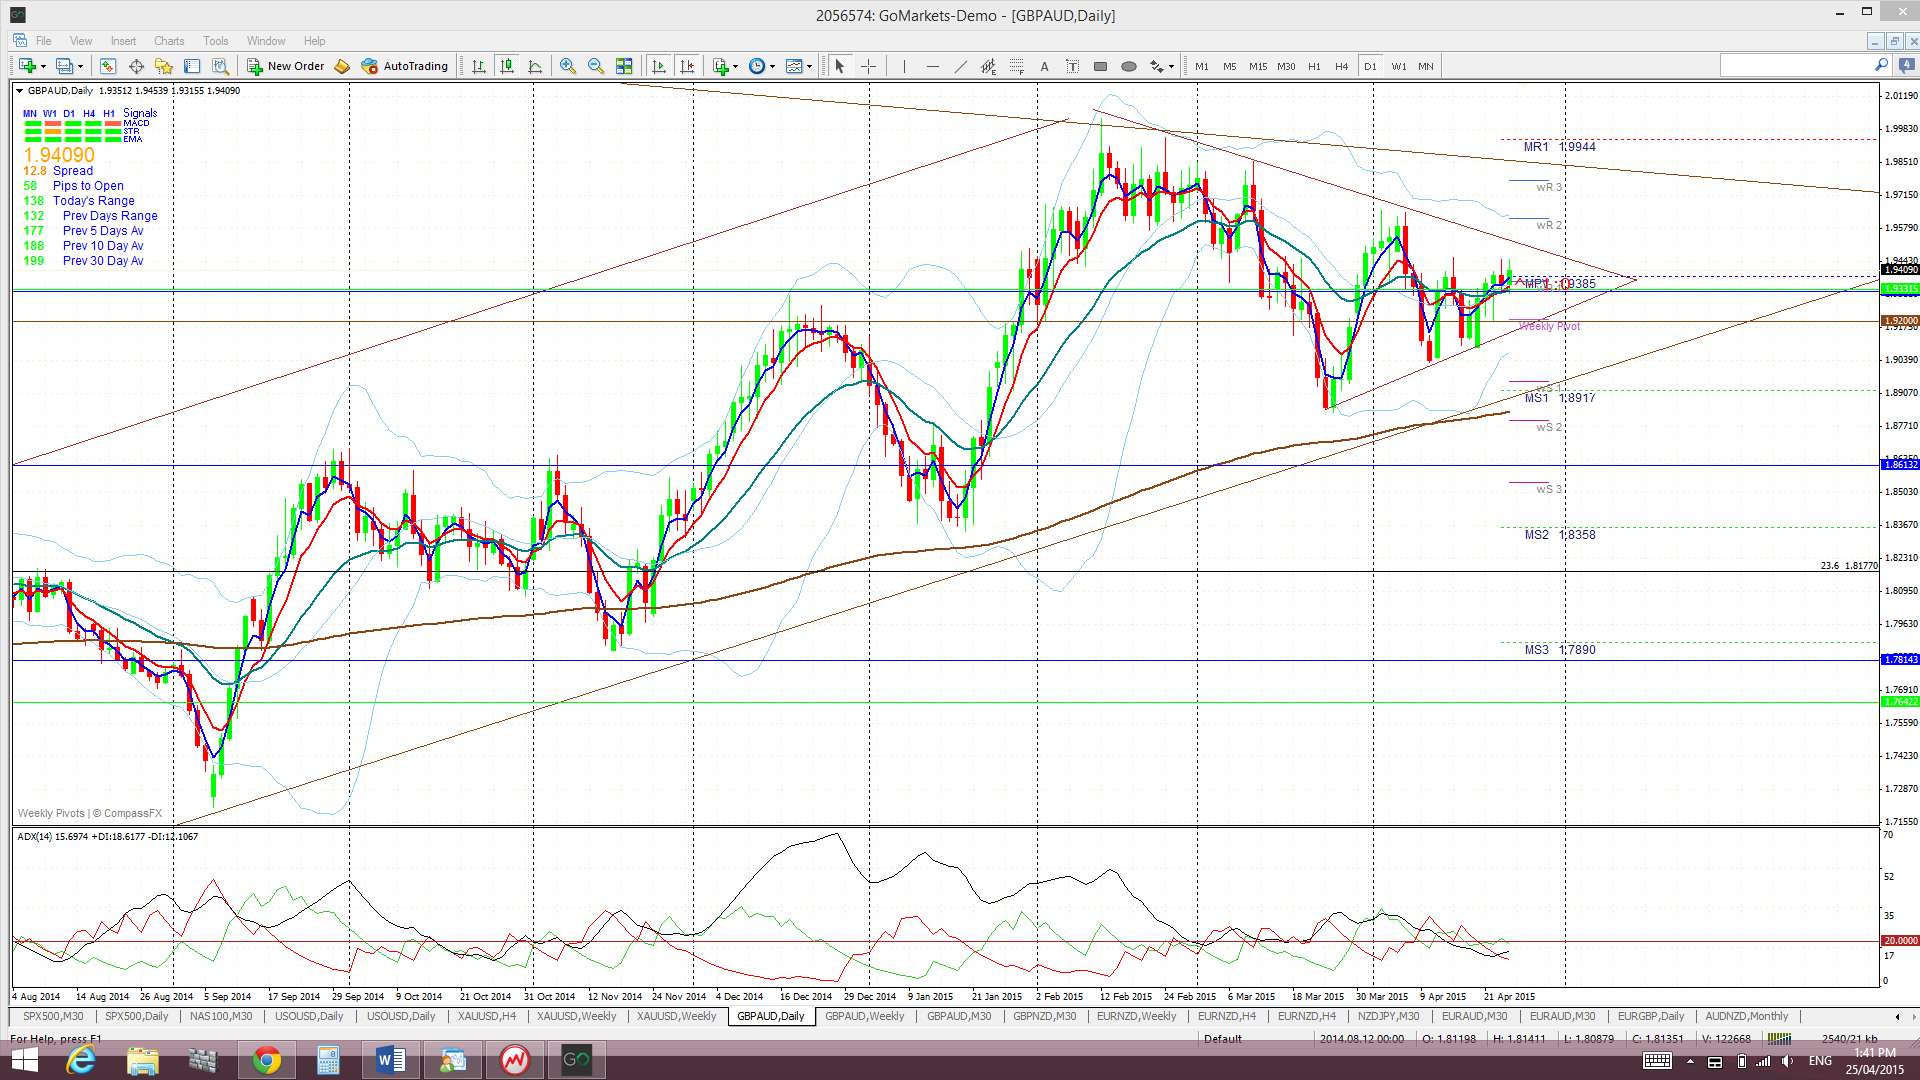
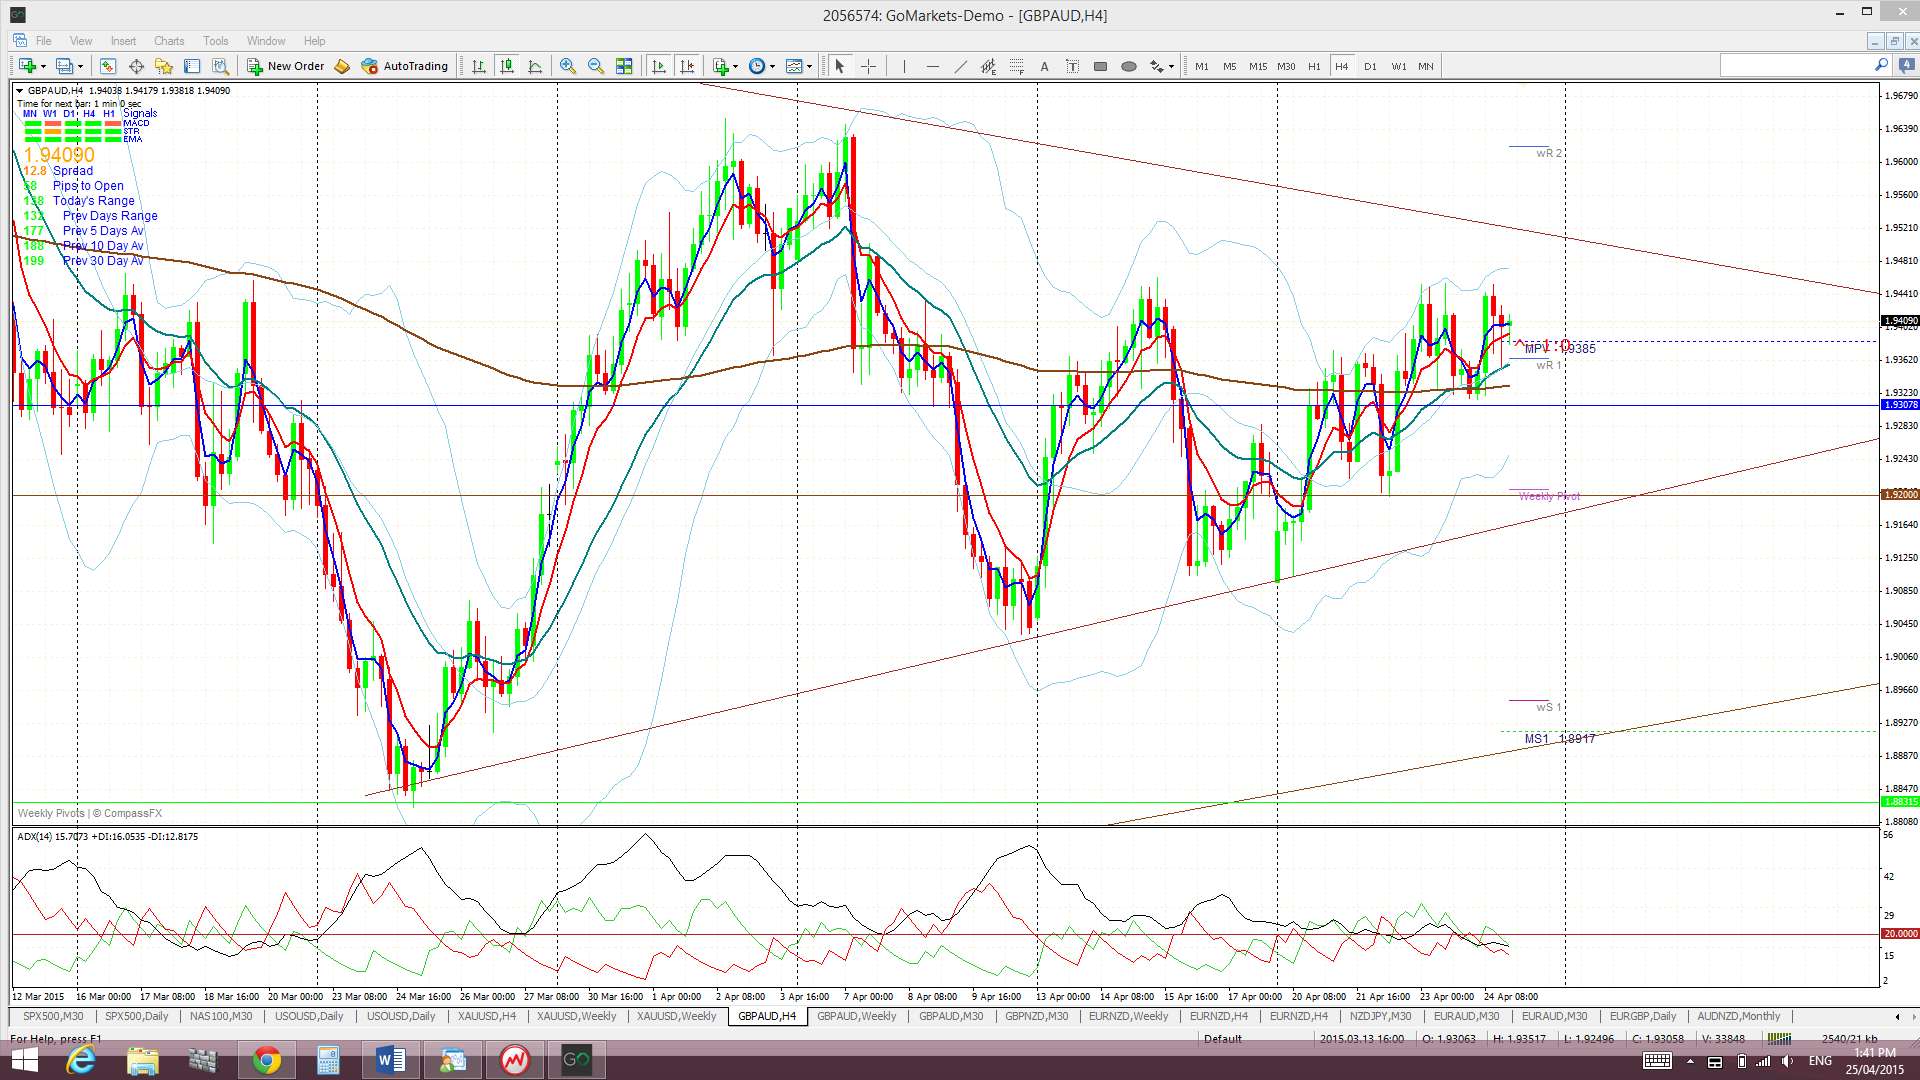
GBP/AUD: This pair chopped higher last week and will hold my interest whilst the US$ remains range-bound.
Price action is currently confined within a symmetrical triangle on the daily chart that is set within an ascending trading channel on the weekly chart that is set within a triangle pattern on the monthly chart! Needless to say, watch for any trend line breakouts!
Price is now trading above the Ichimoku Cloud on the 4hr chart, in the Cloud on the daily chart, above on the weekly chart and just above the top edge of the Cloud on the monthly chart.
The weekly candle closed as a bullish candle.
- I’m watching for any new TC signal and the monthly chart’s bear trend line.
EUR/NZD: This pair also has my interest with the range-bound US$. I wrote a separate article about this pair during the week and this can be found through the following link.
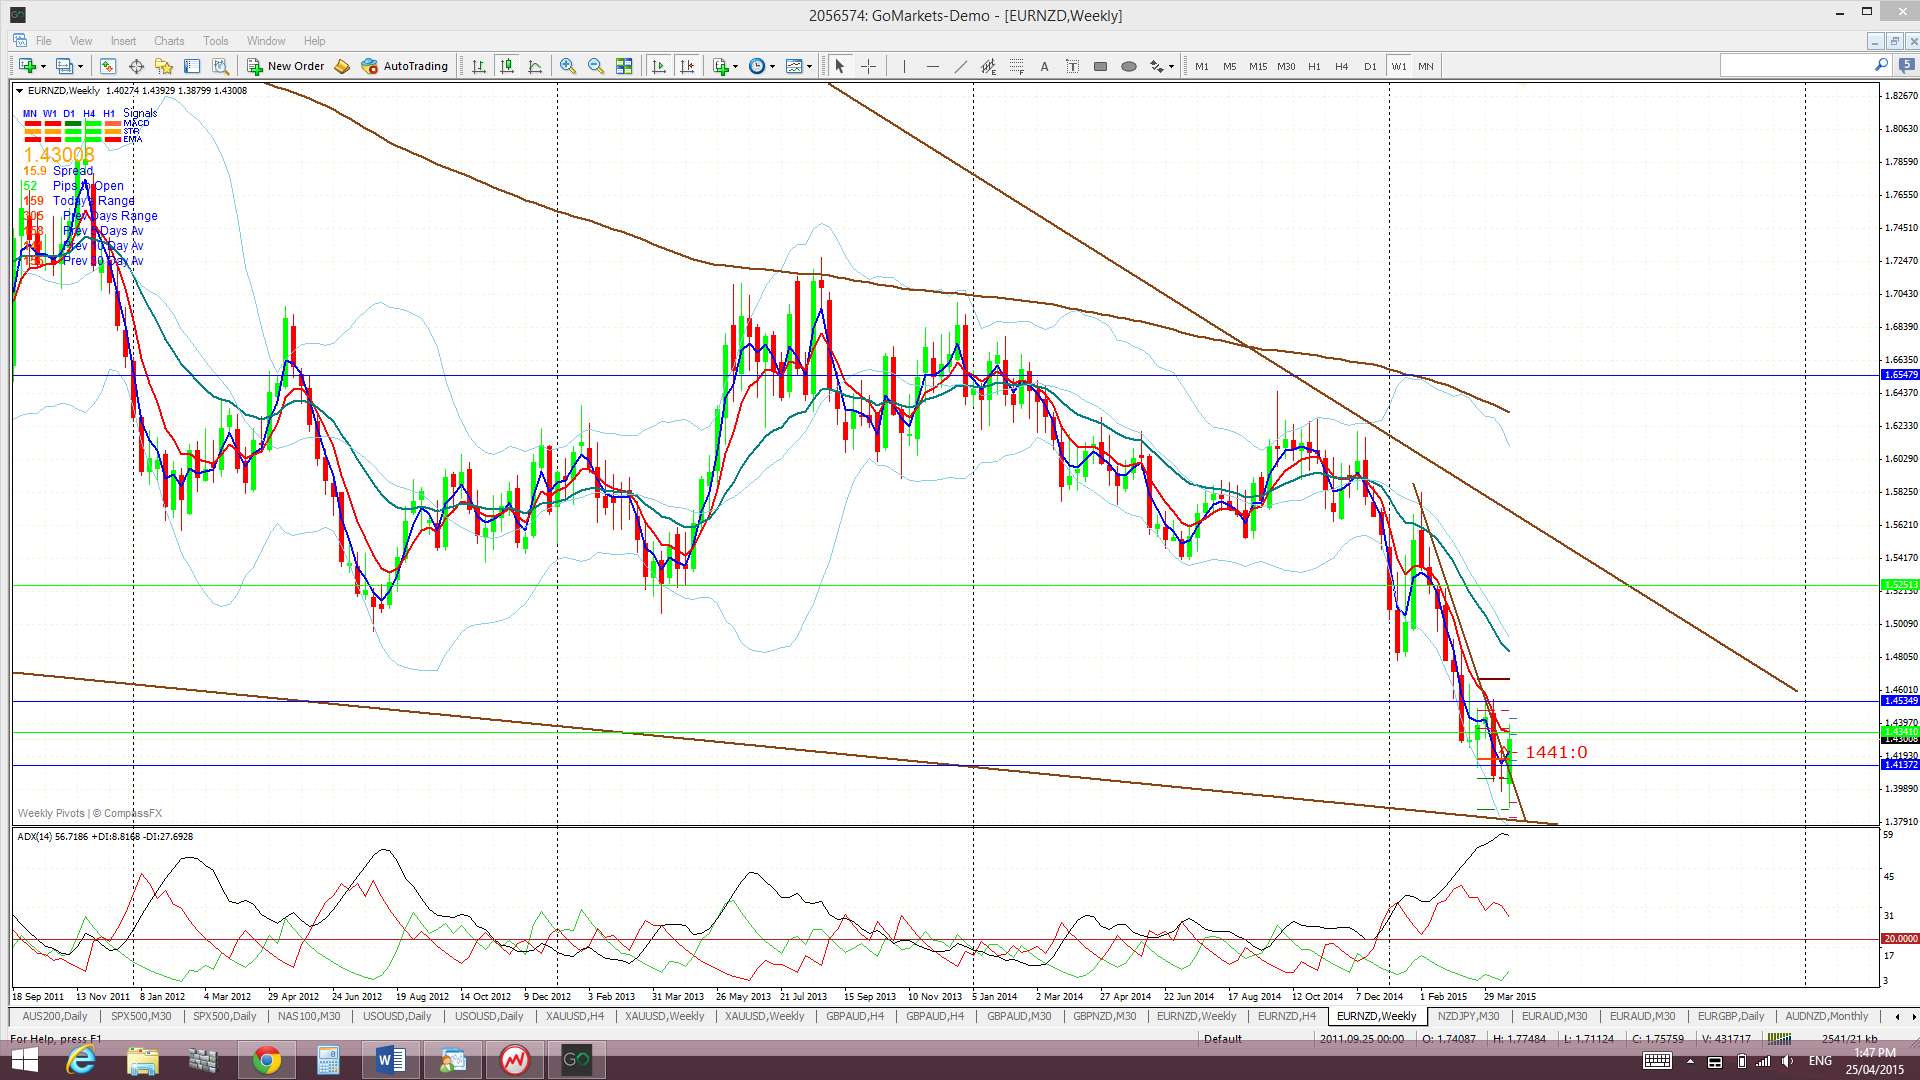
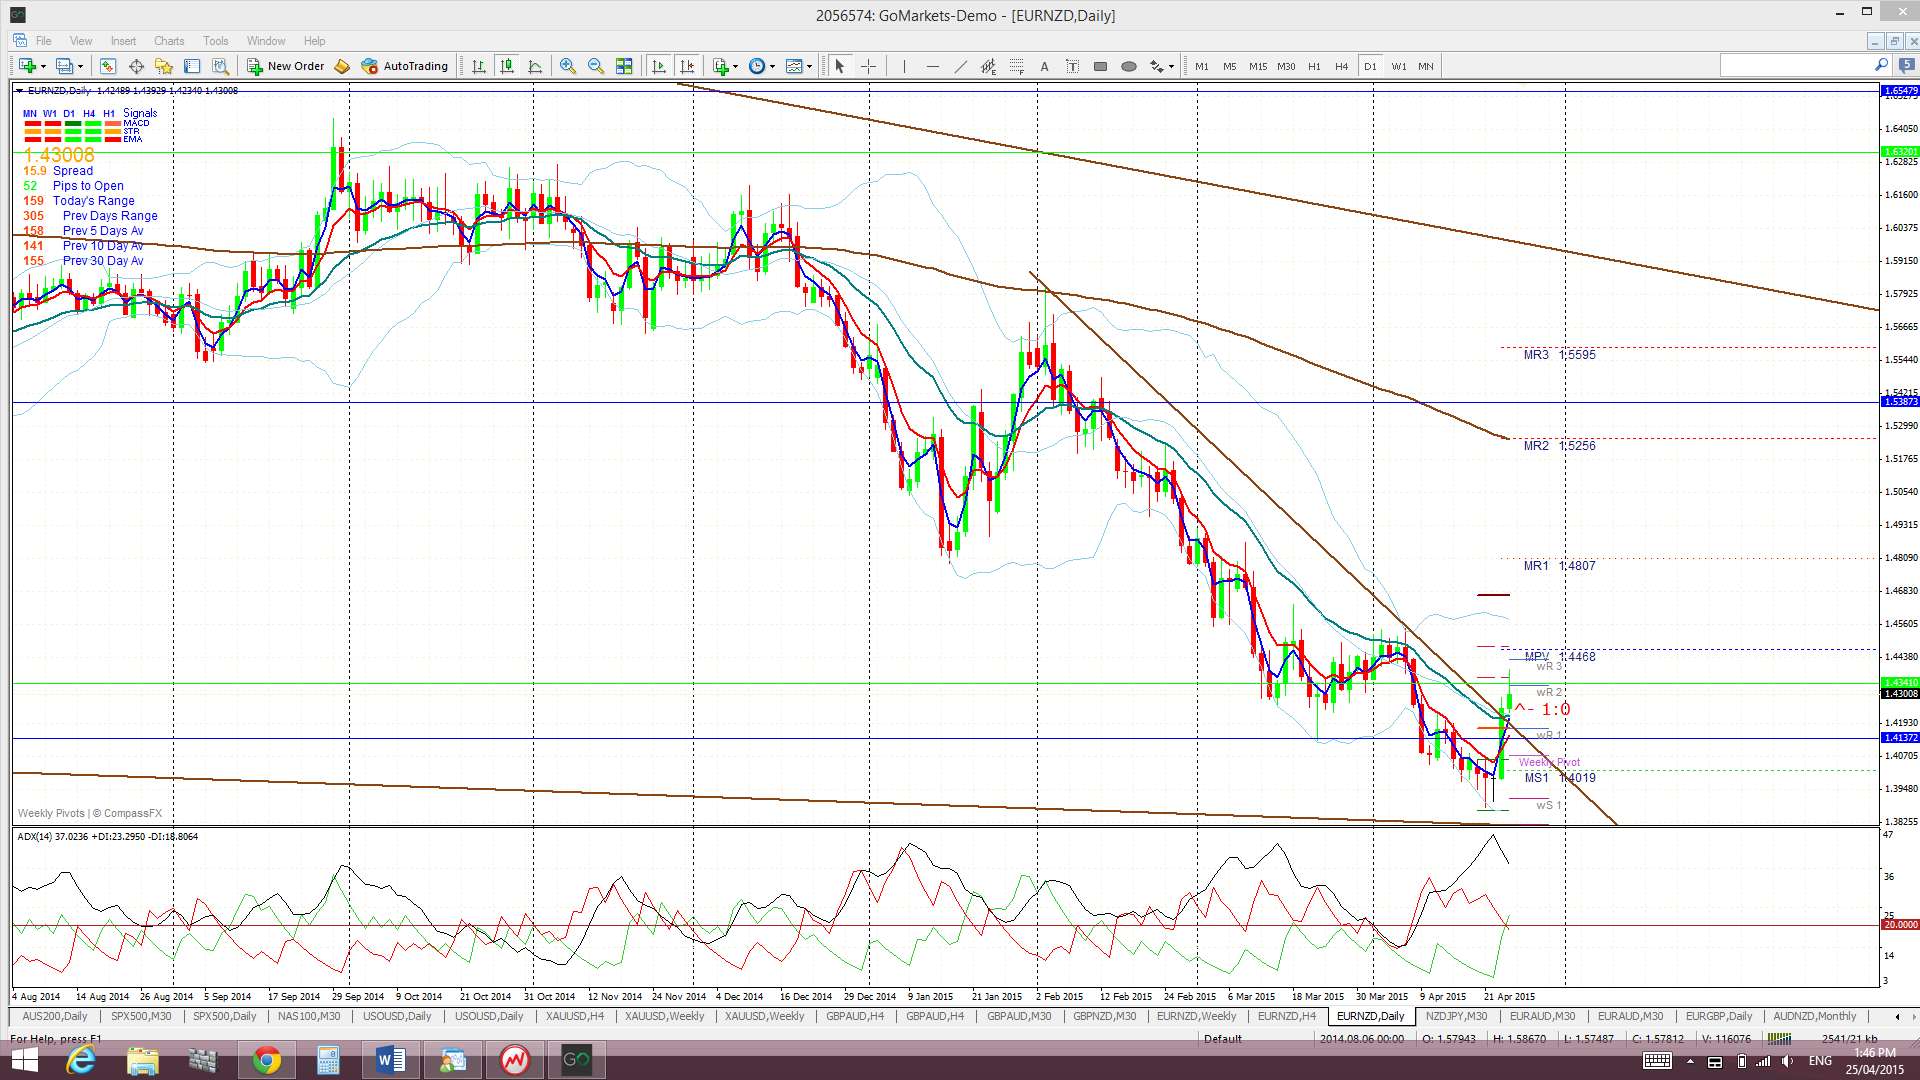
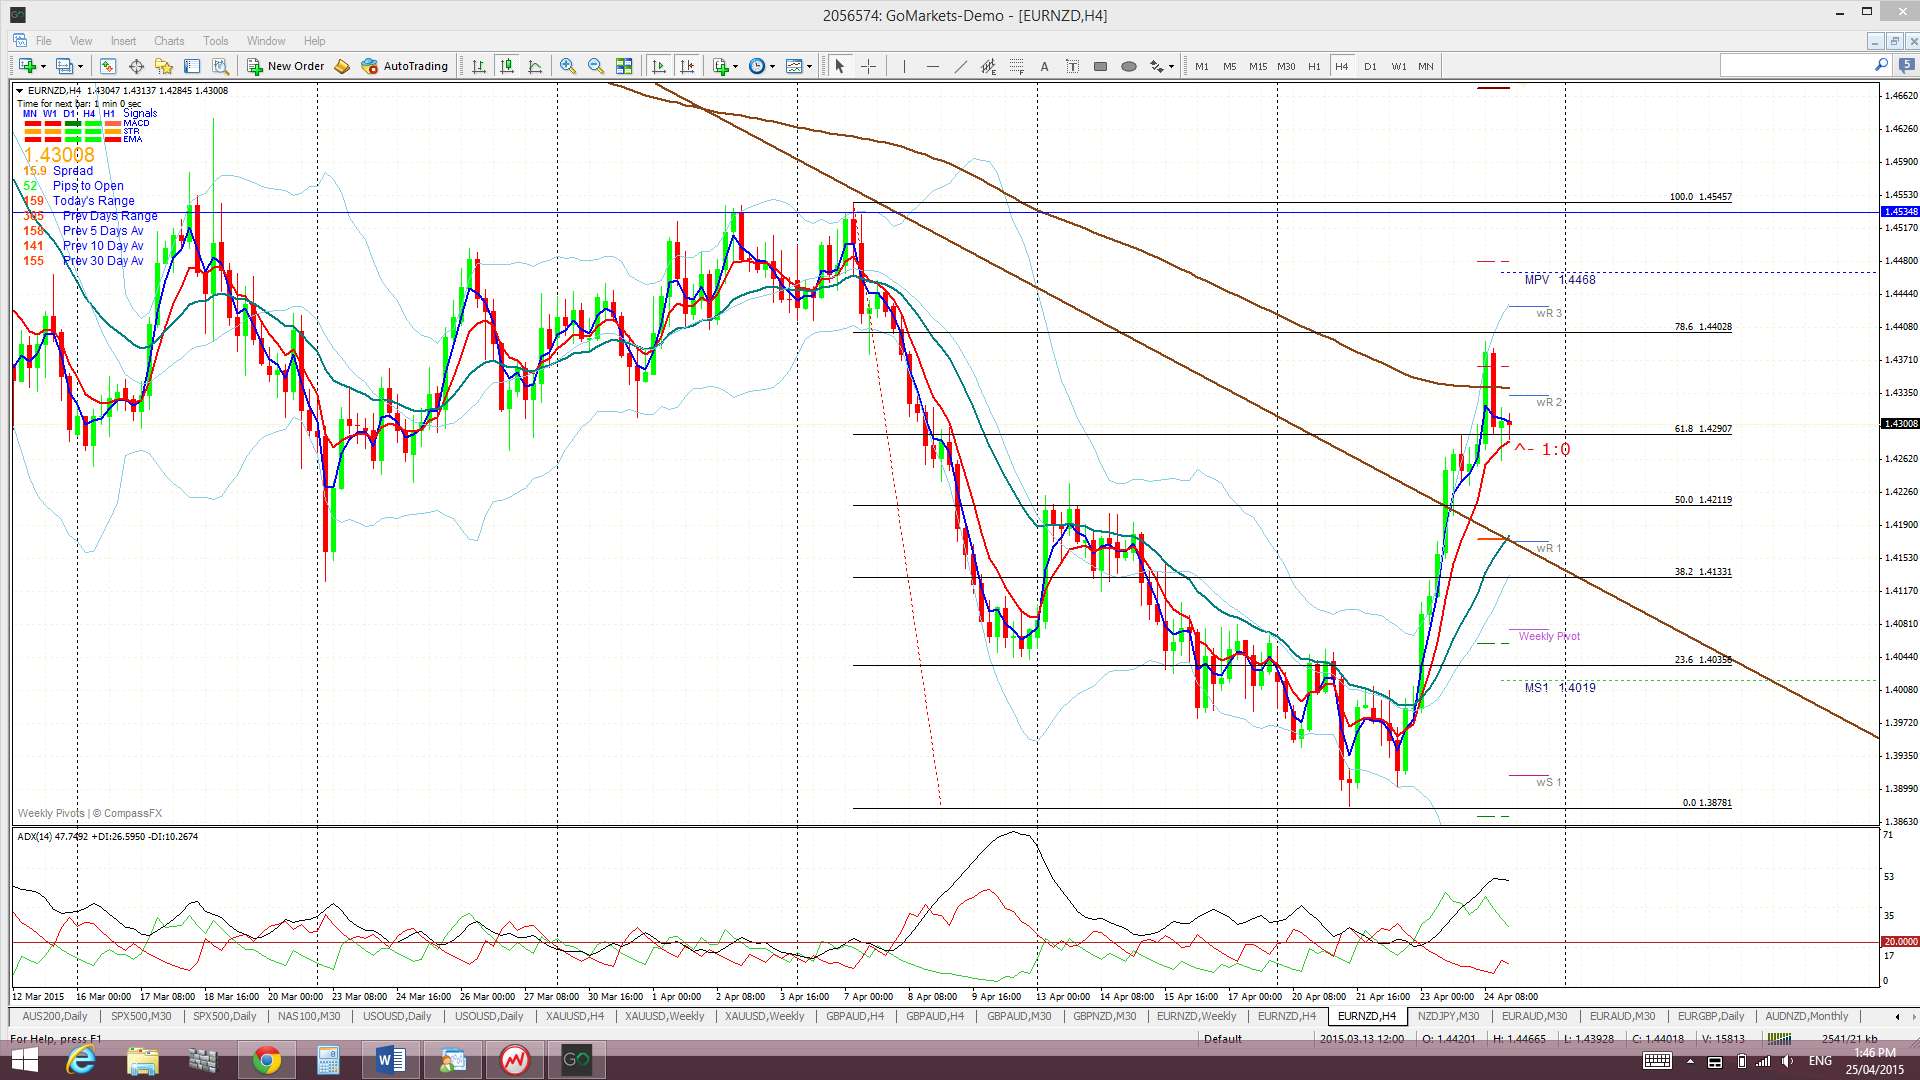
The EUR/NZD chopped higher last week after bouncing up off a monthly support trend line; this being the lower trend line of a bullish descending wedge pattern. Price also broke above a recent daily-chart bear trend line and back above the 4hr Cloud.
Price is now trading above the 4hr Cloud but below the daily, weekly and monthly Clouds. Note the ADX on the 4hr chart though and how there is more momentum with this recent move above the Cloud than the previous move:
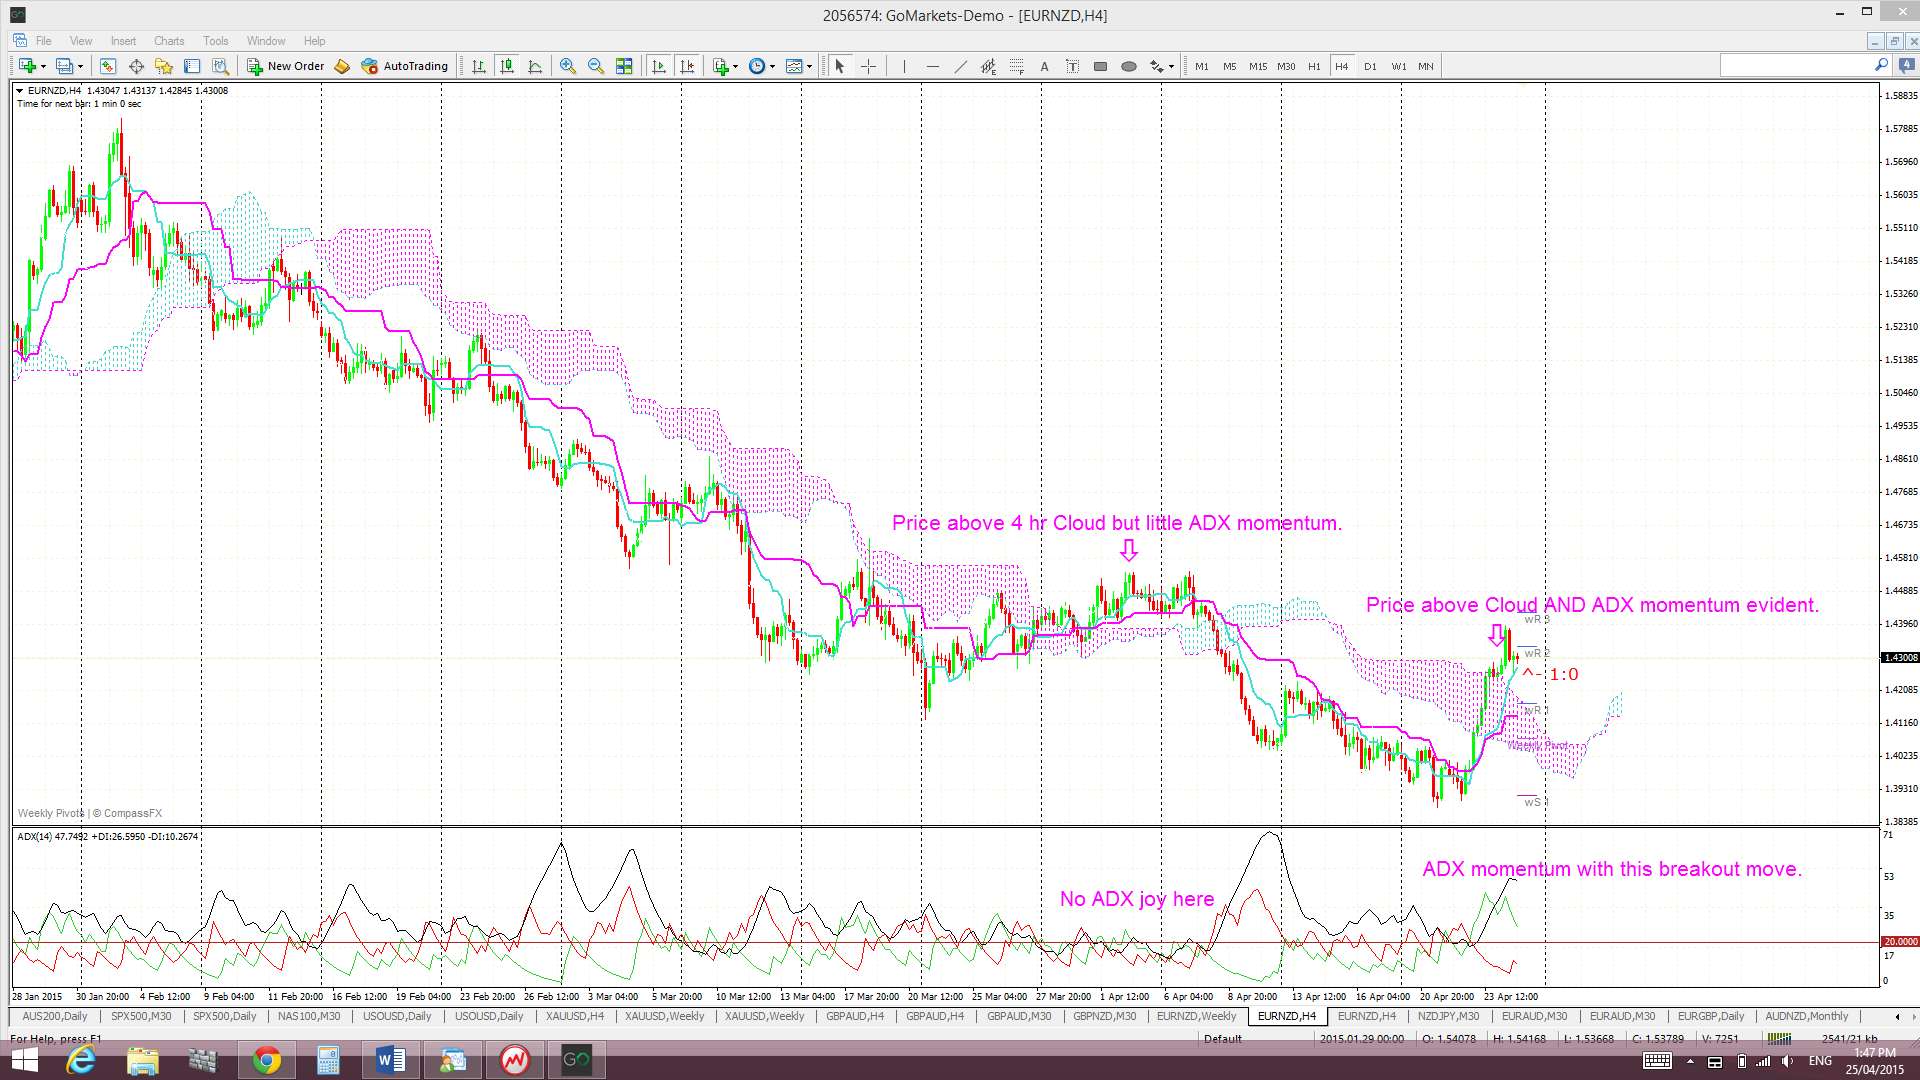
The weekly candle closed as a bullish engulfing candle.
- I’m watching for any new TC signal.
GBP/NZD: This is not a pair I normally watch BUT with recent NZD weakness and GBP strength it is a bit of a no-brainer that traders would be checking this pair out and I’m sure I’m not the only one dredging up charts of this particular pair this weekend! The appeal of the GBP/NZD may increase if the GBP remains bullish and following Thursday’s NZD interest rate news.
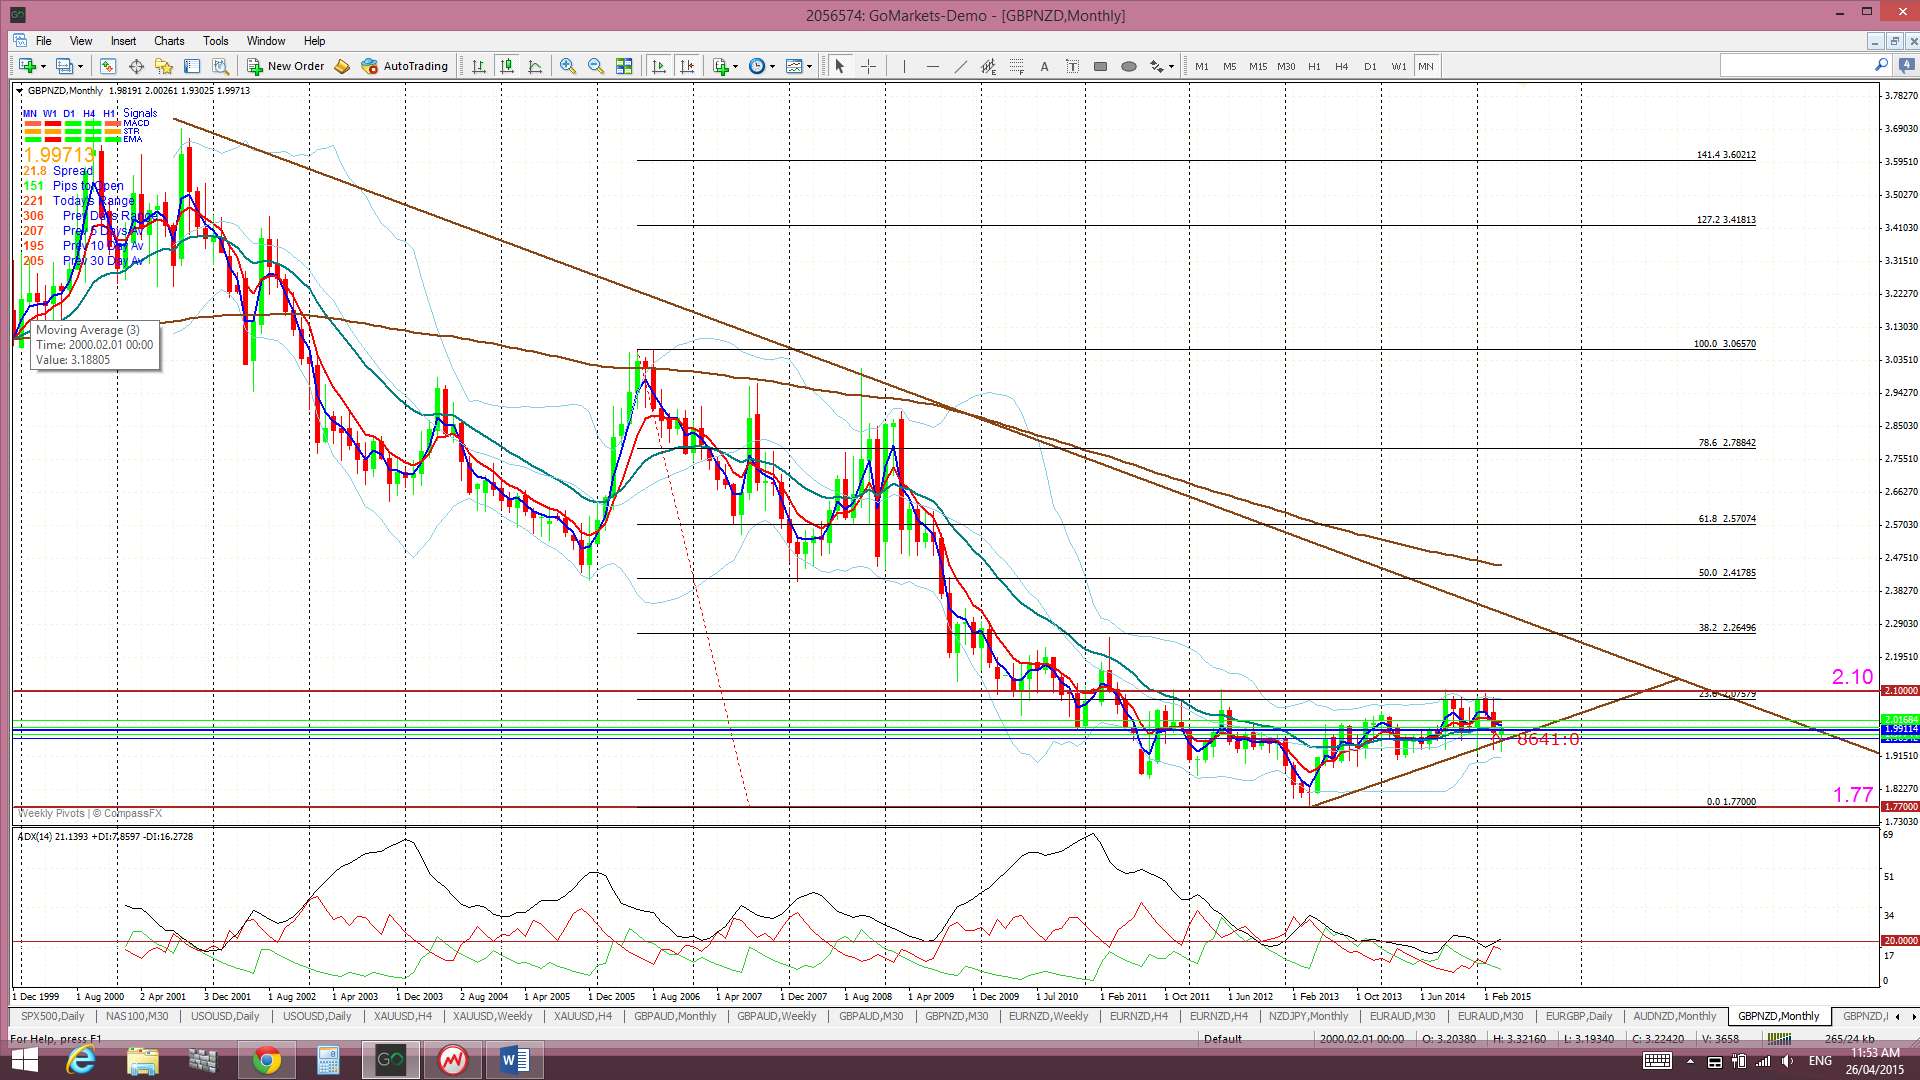
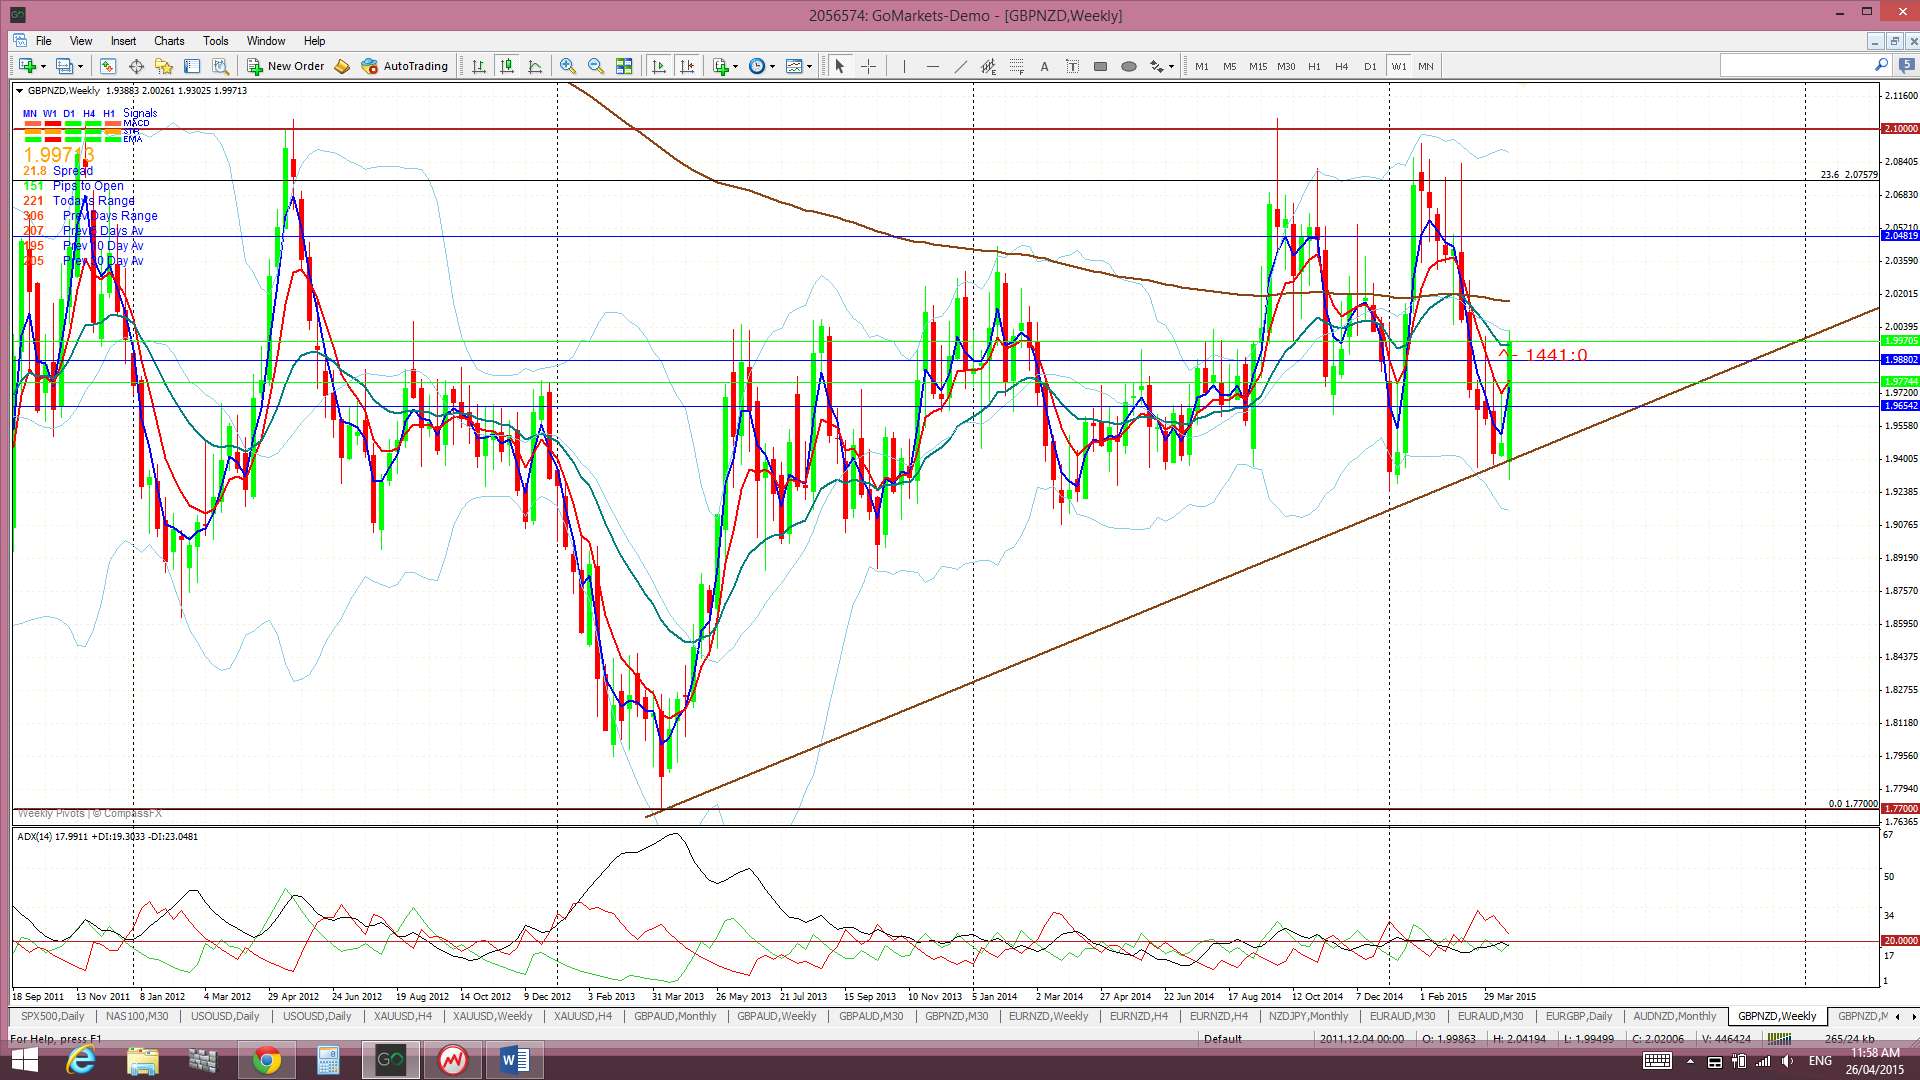
The monthly chart shows this pair in a down trend and trading under a bear trend line. However, price has bounced up off the 1.77 level and may be trying to carve out a recovery from this base. This chart also shows the 2.10 level as a clear-cut longer term S/R level and this is giving the monthly and weekly charts a bit of an ascending triangle appearance.
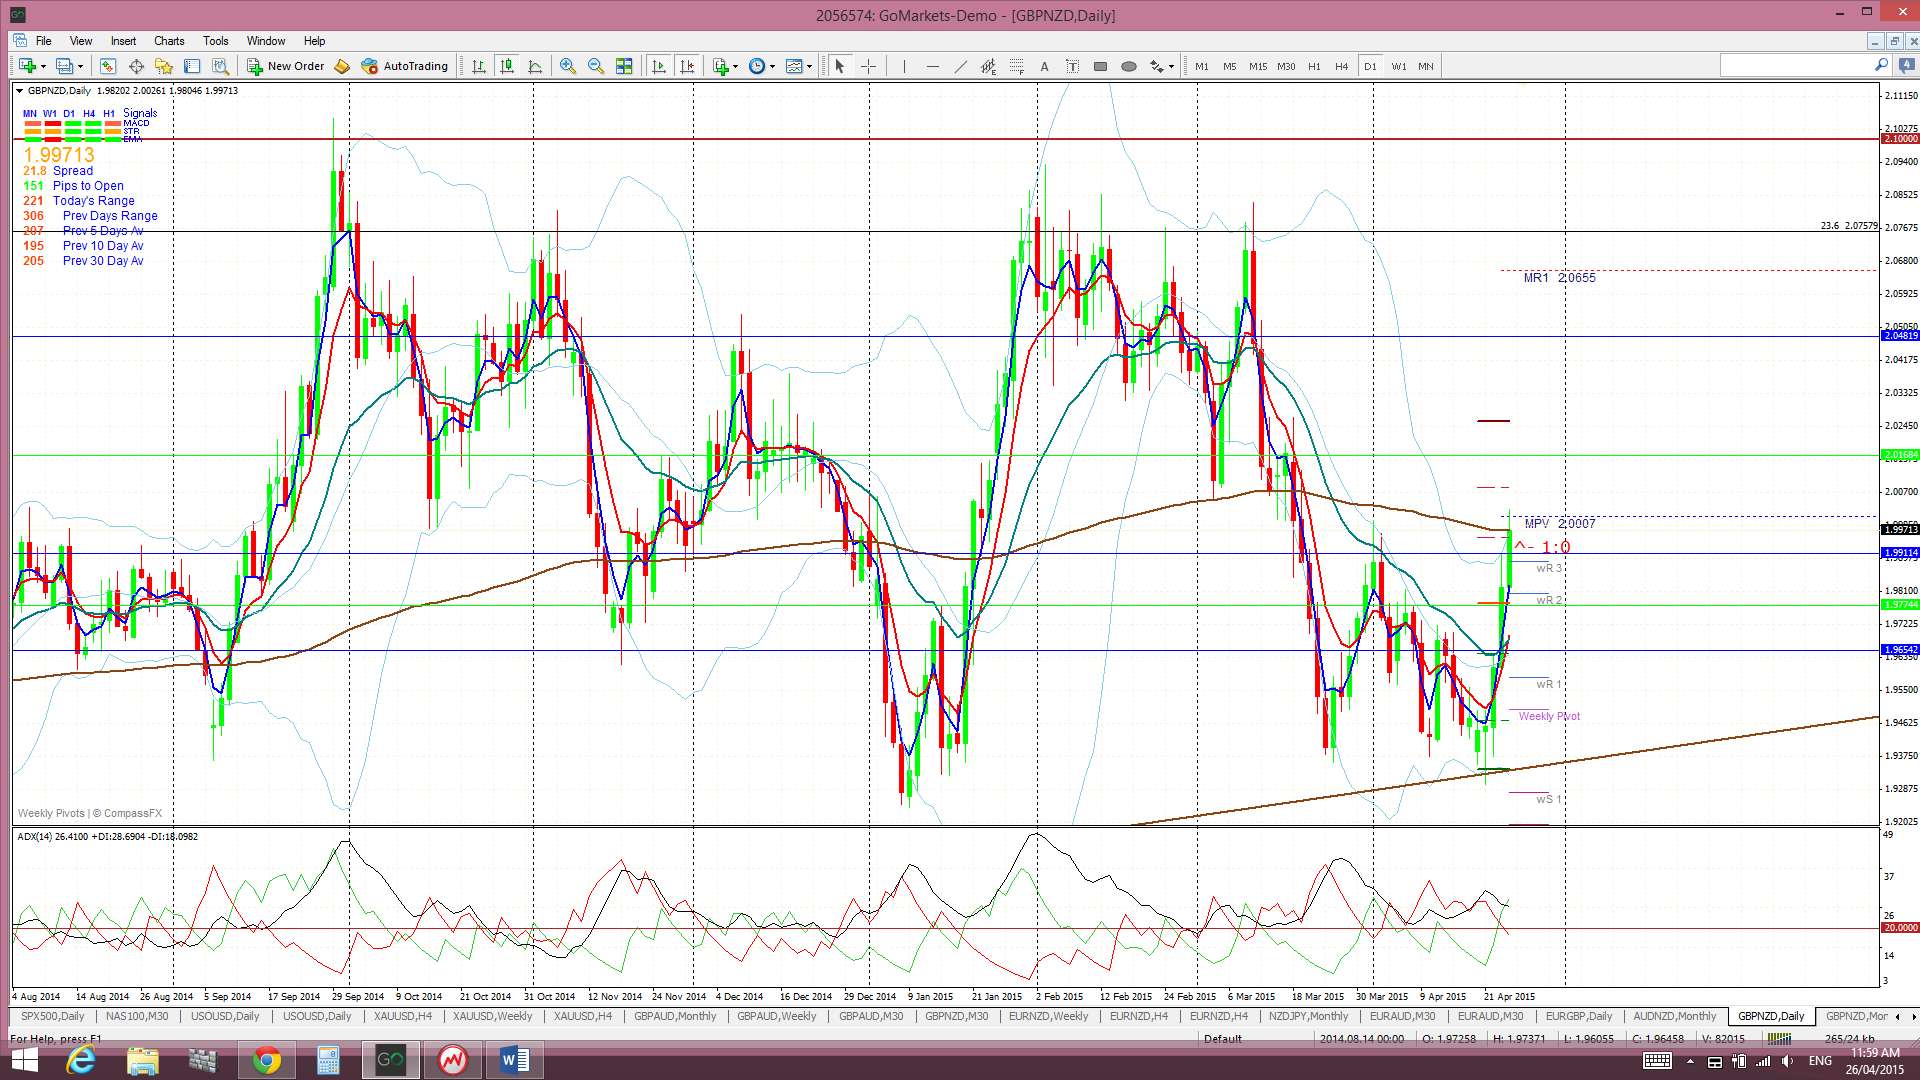
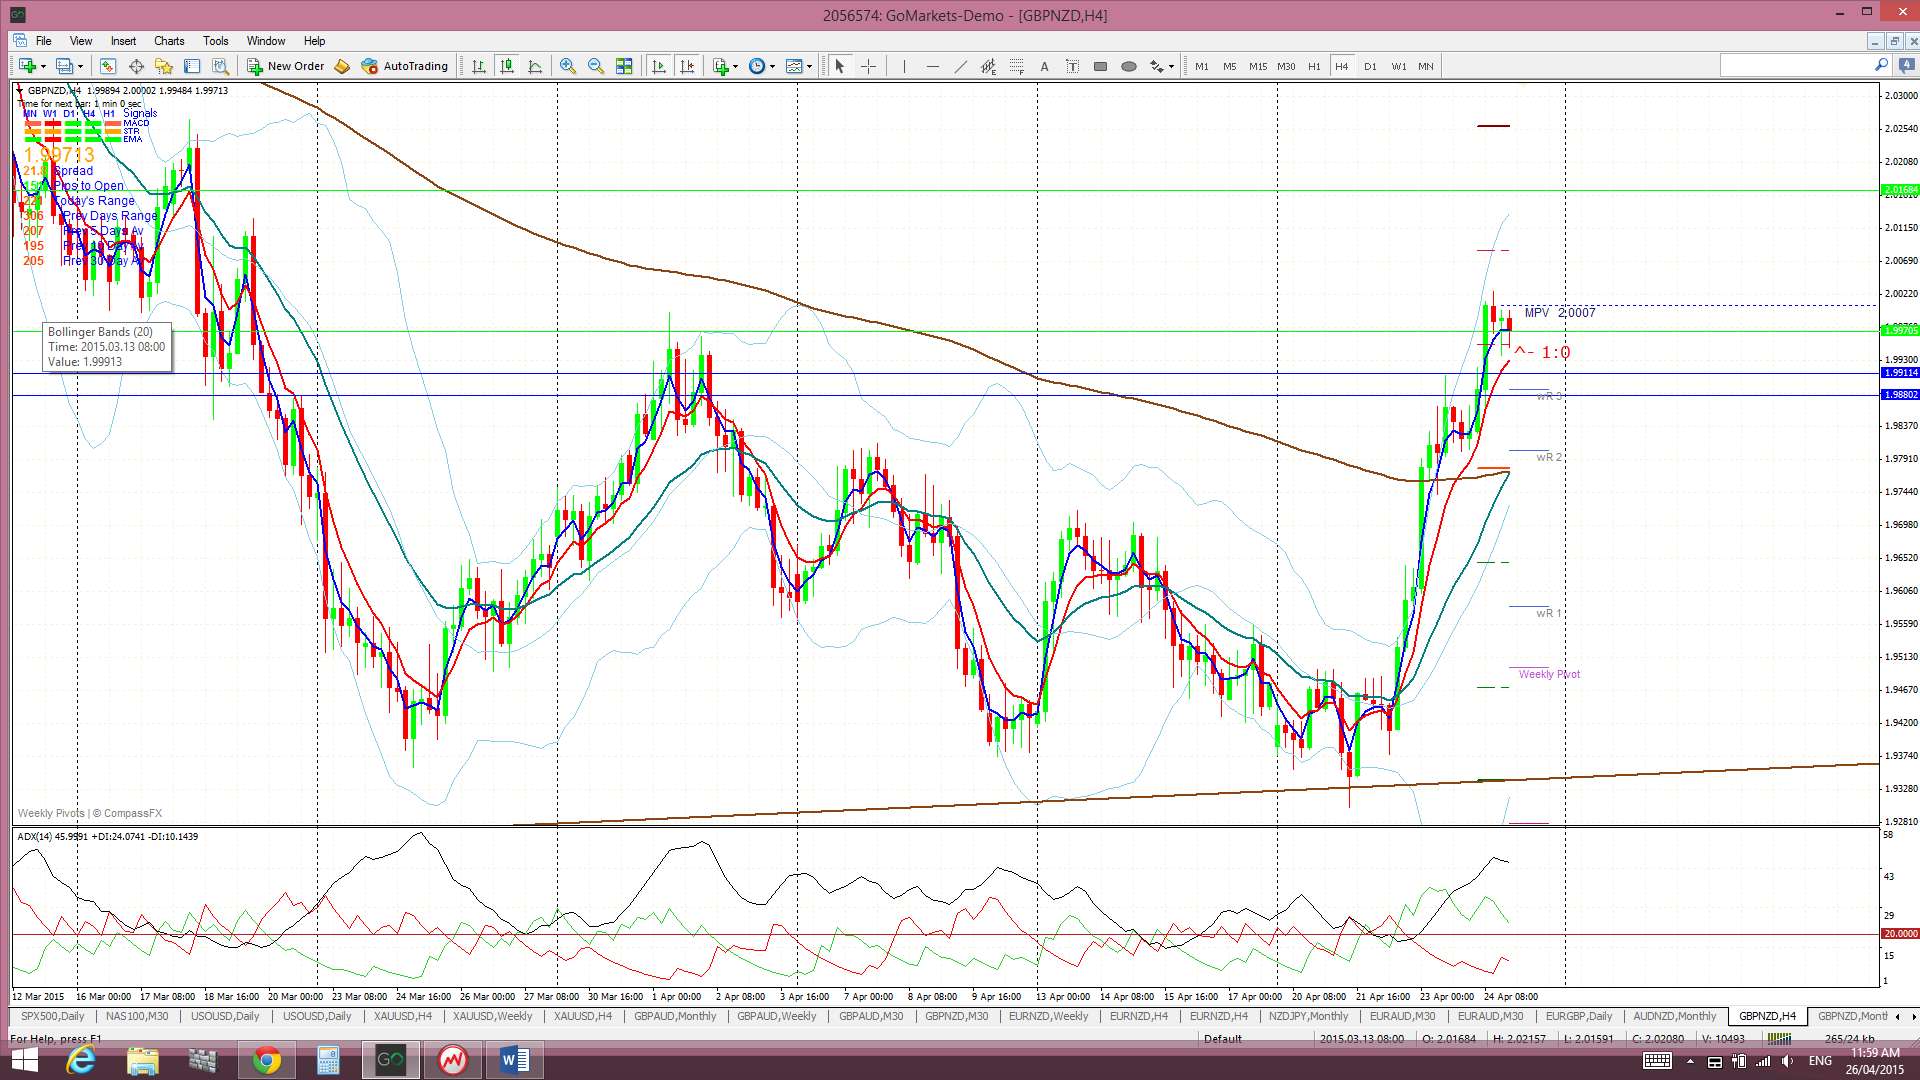
The GBP/NZD is trading above the Cloud on the 4hr chart, below on the daily and weekly chart and in the bottom of the Cloud on the monthly chart.
- I’m watching for any new TC signal and the ascending triangle trend lines.
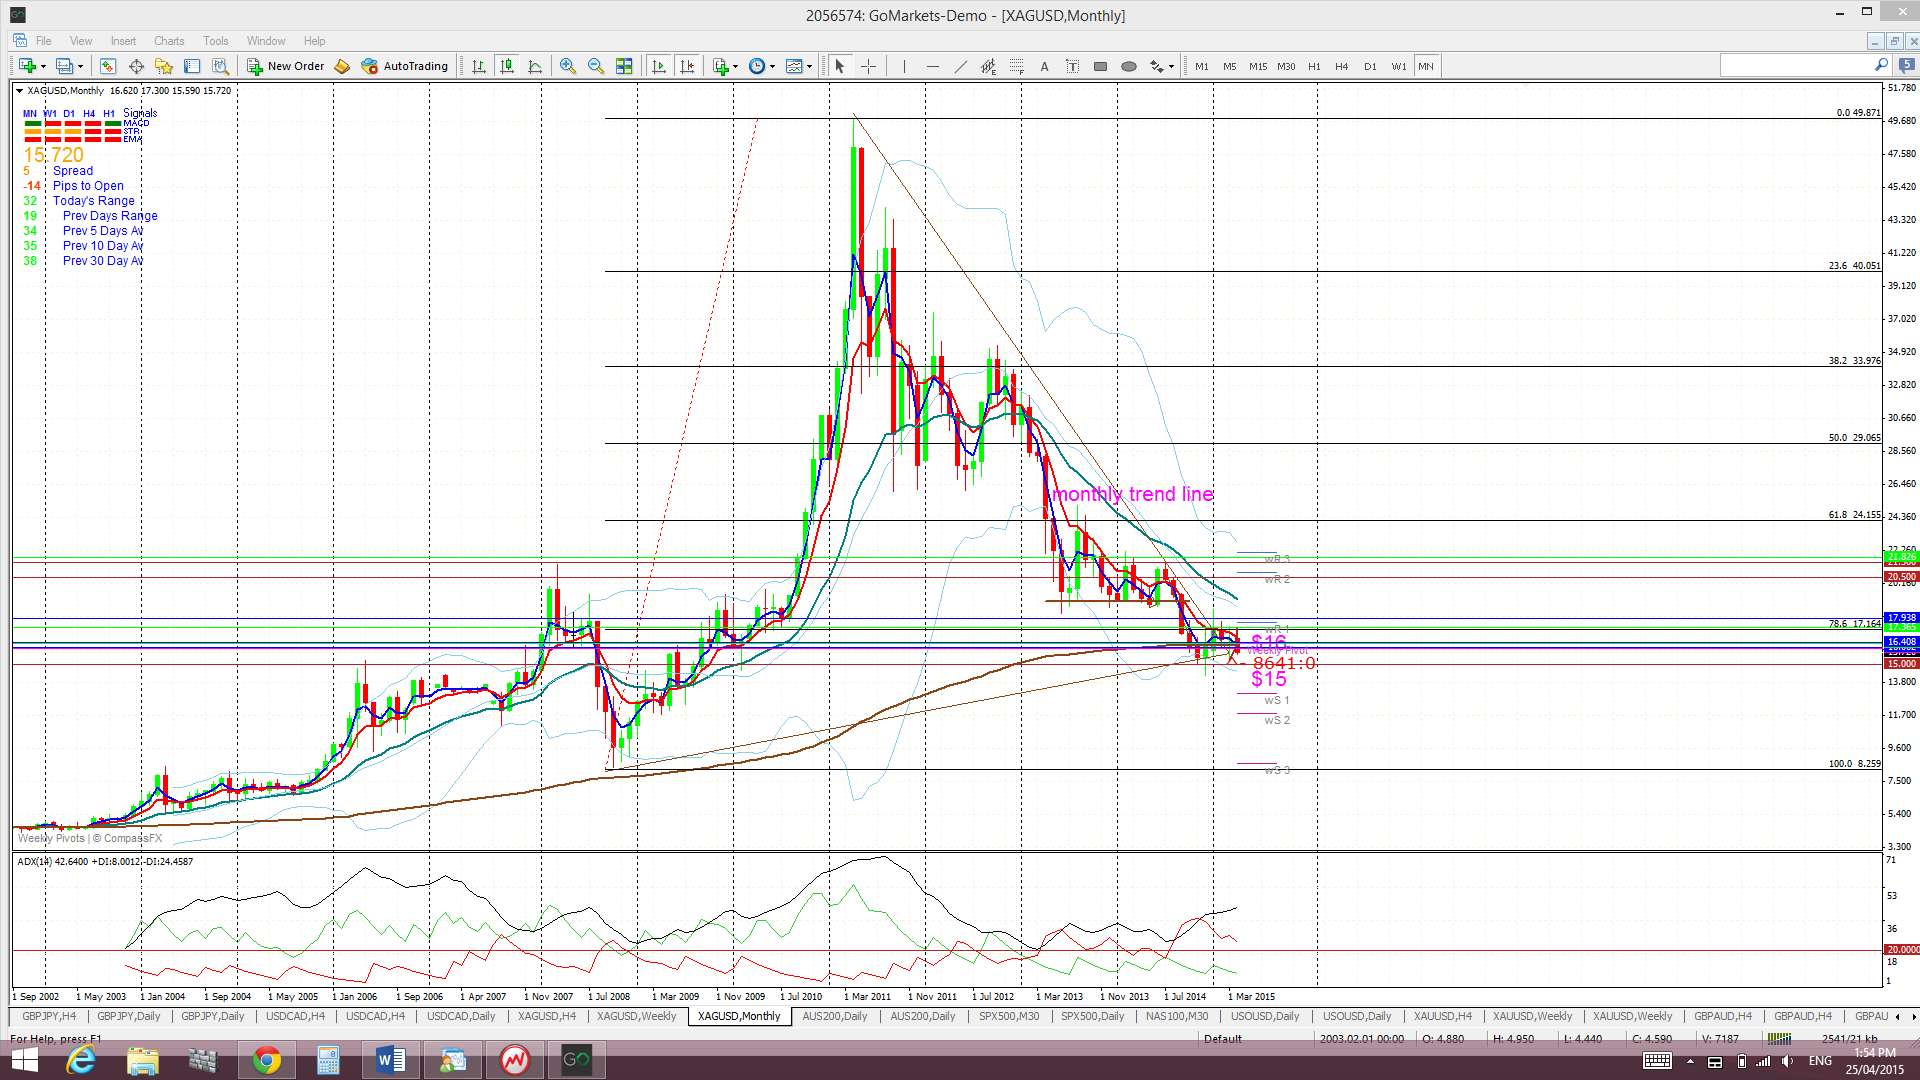
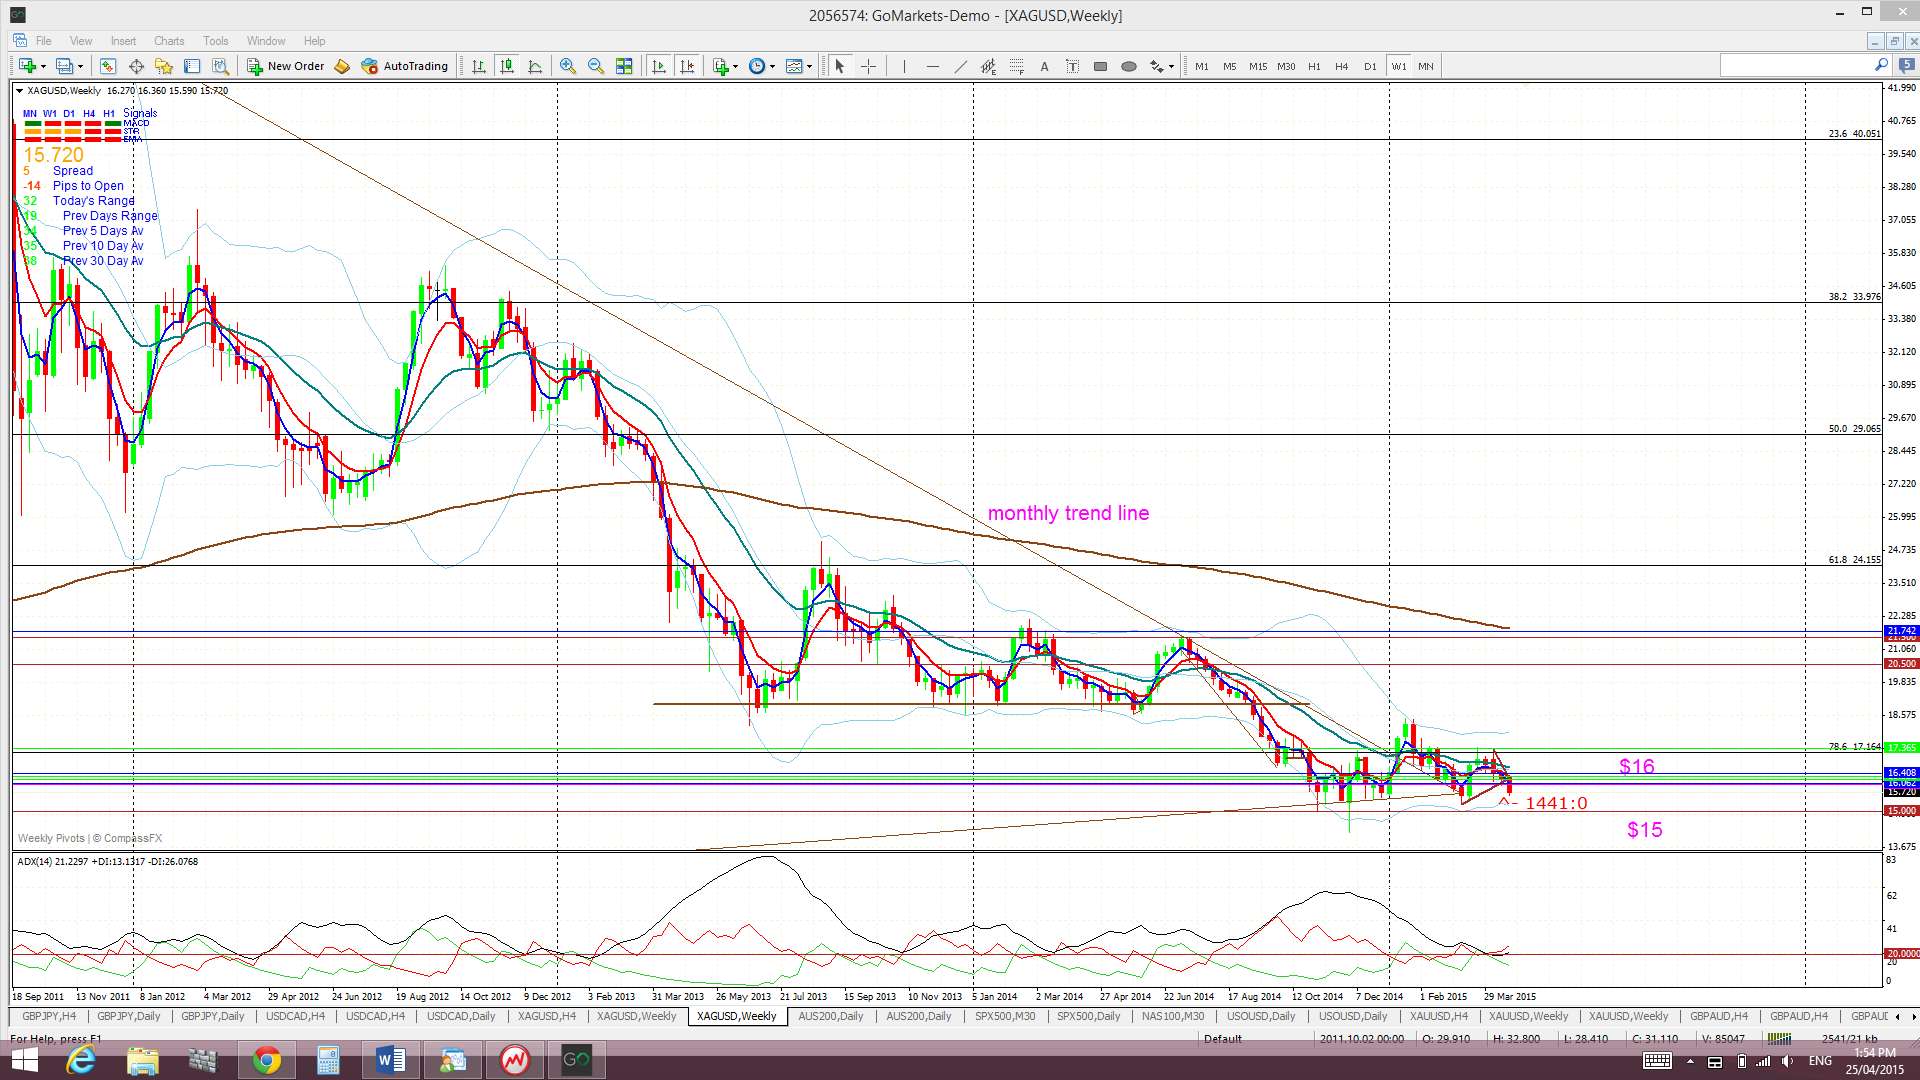
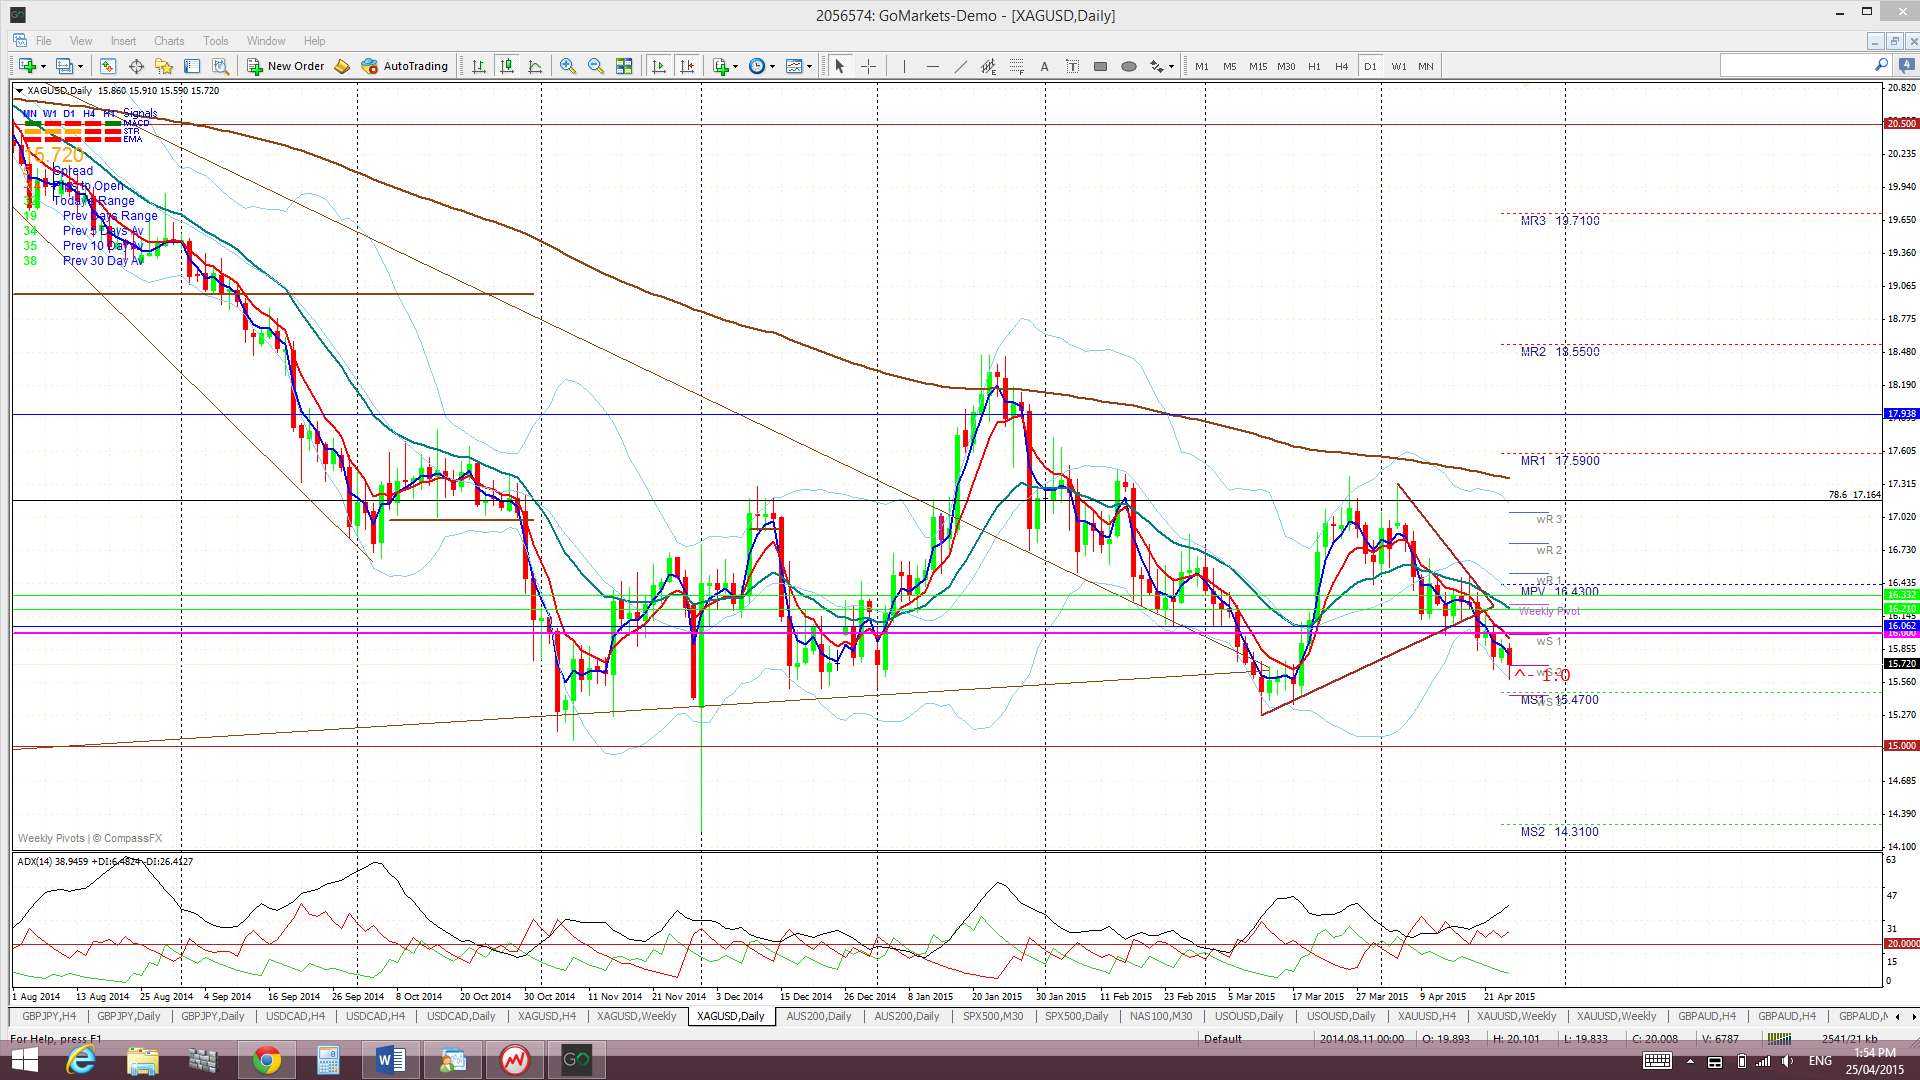
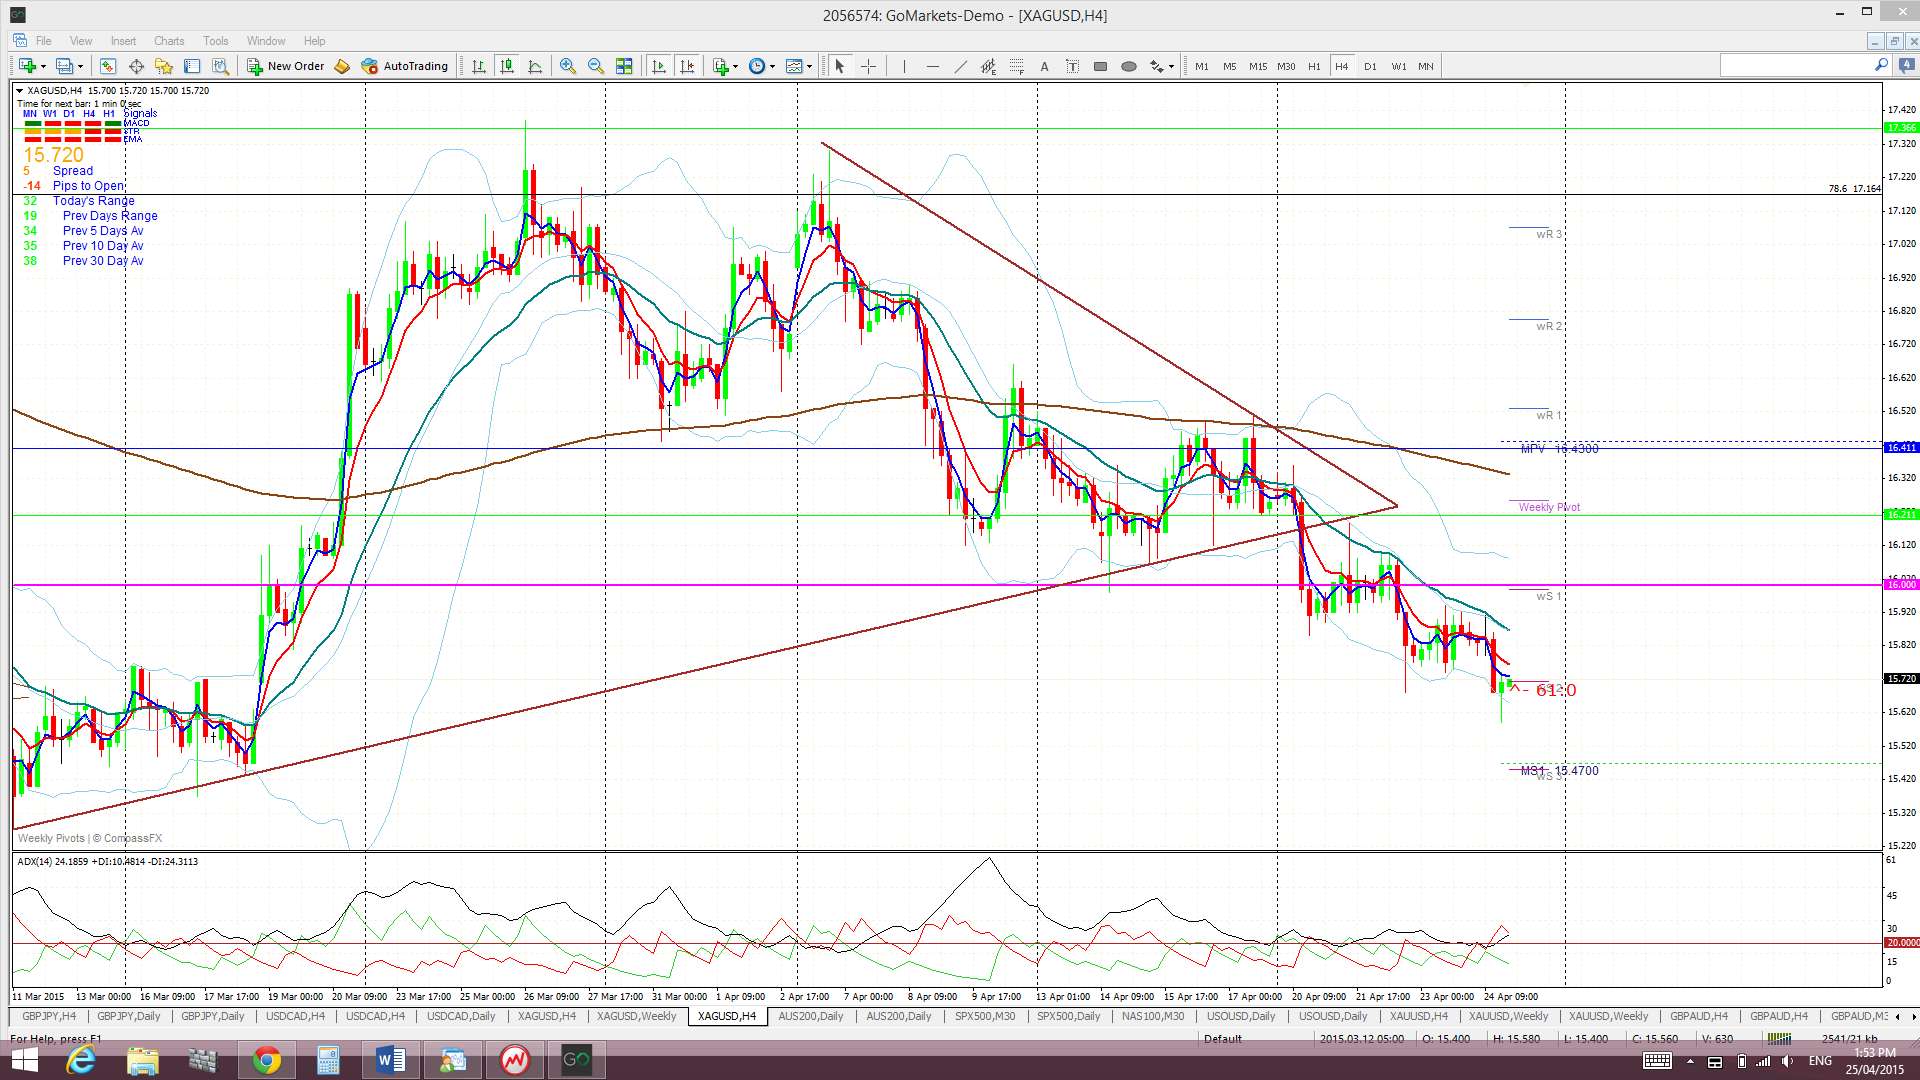
Silver: Silver, again, did not get much benefit from the weaker US$ last week and actually broke down from a triangle pattern and below $16 support. It looks destined to head to test $15 support.
Silver is trading below the Ichimoku Cloud on the 4hr, daily, weekly and monthly charts.
The weekly candle closed as a bearish candle.
The risk event for Silver this week is FOMC and the Federal Funds Rate announcement. Any continued US$ weakness might end up supporting the metal though.
- I’m watching for any new TC signal and the $16 and $15 levels.
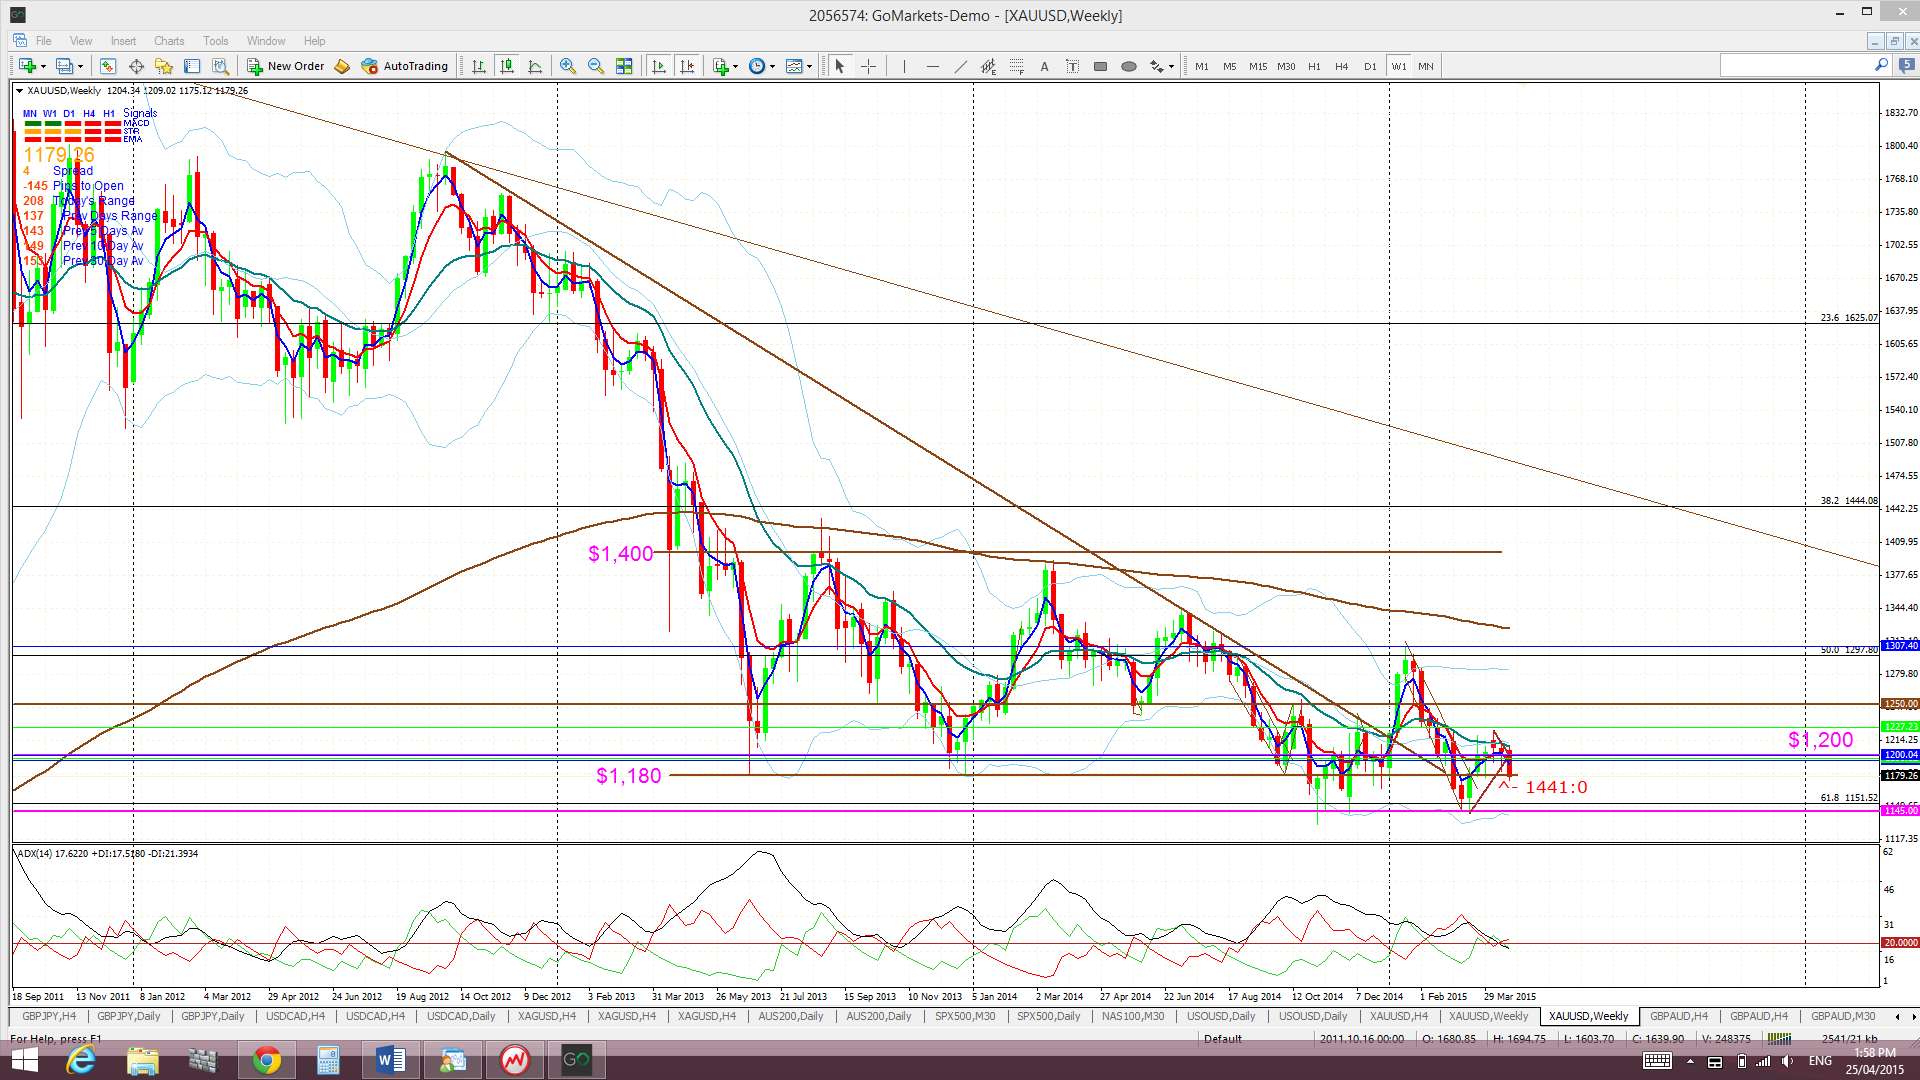
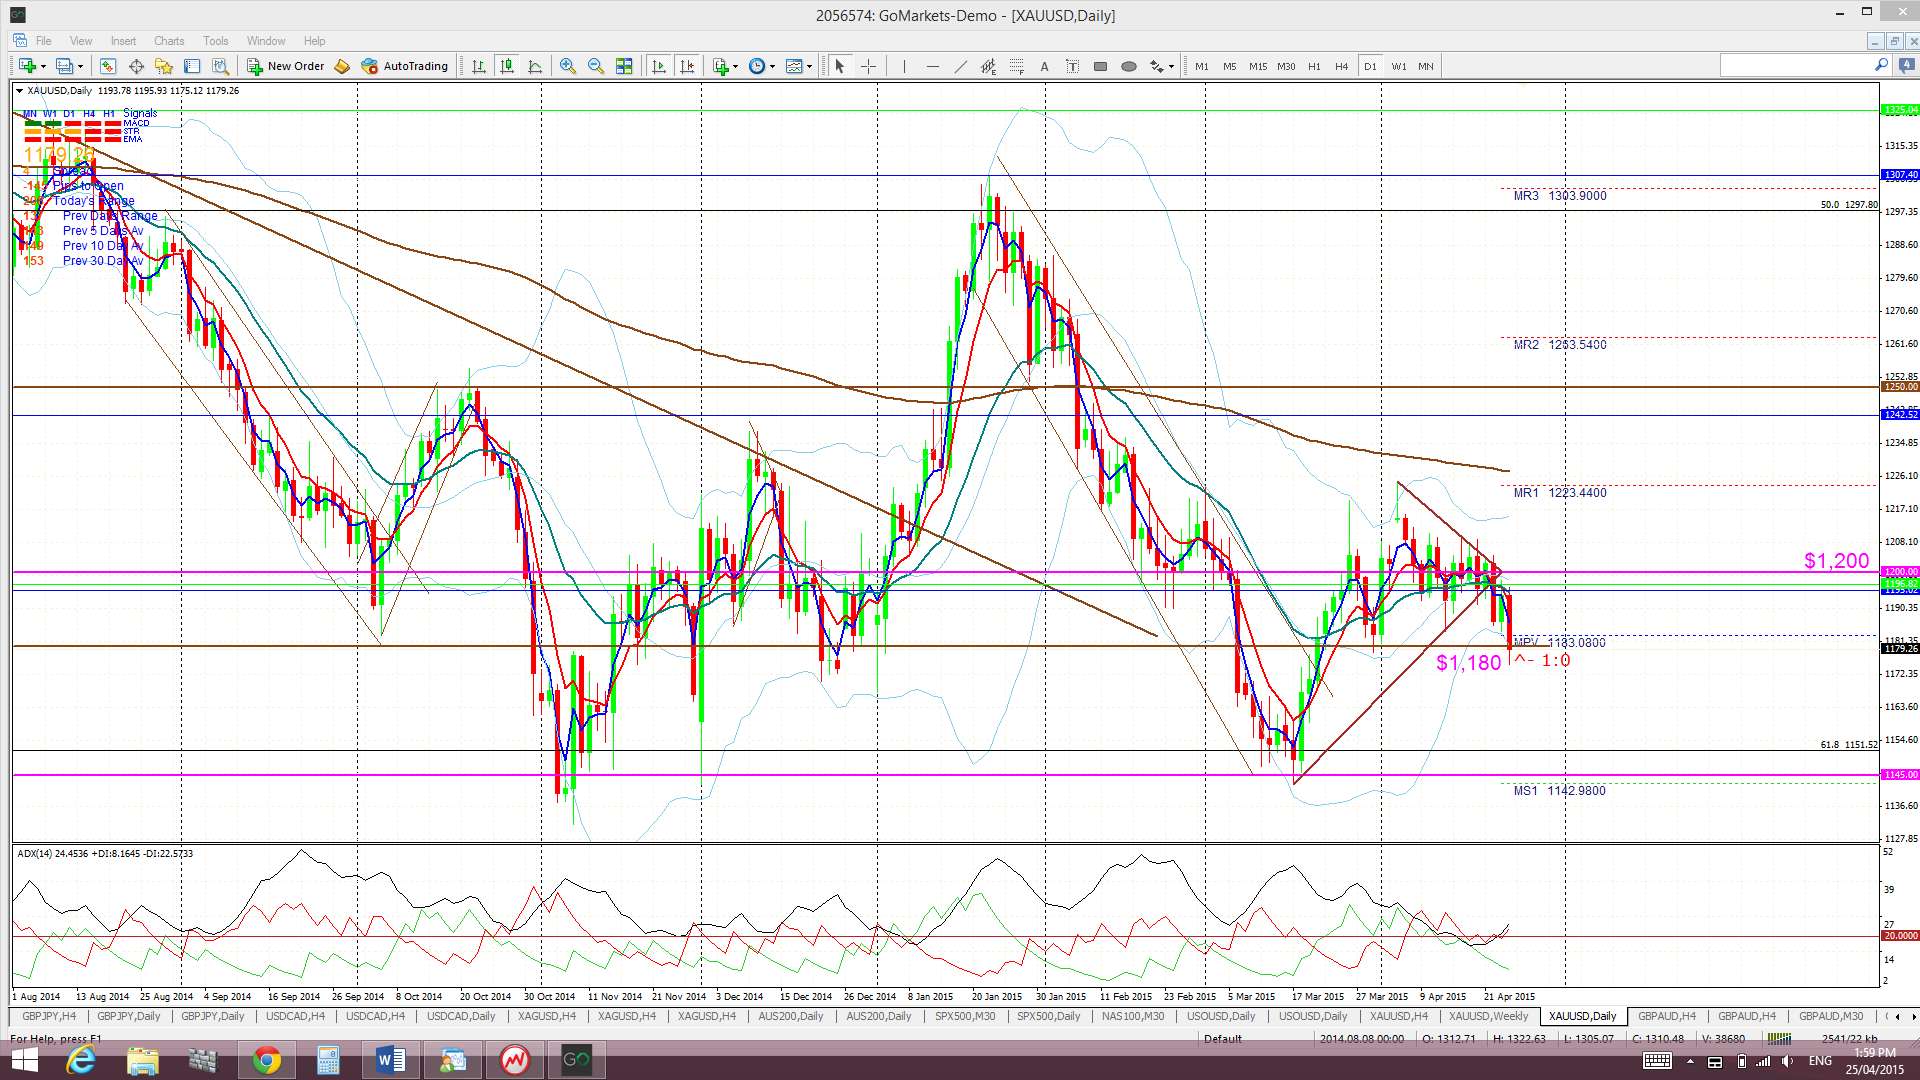
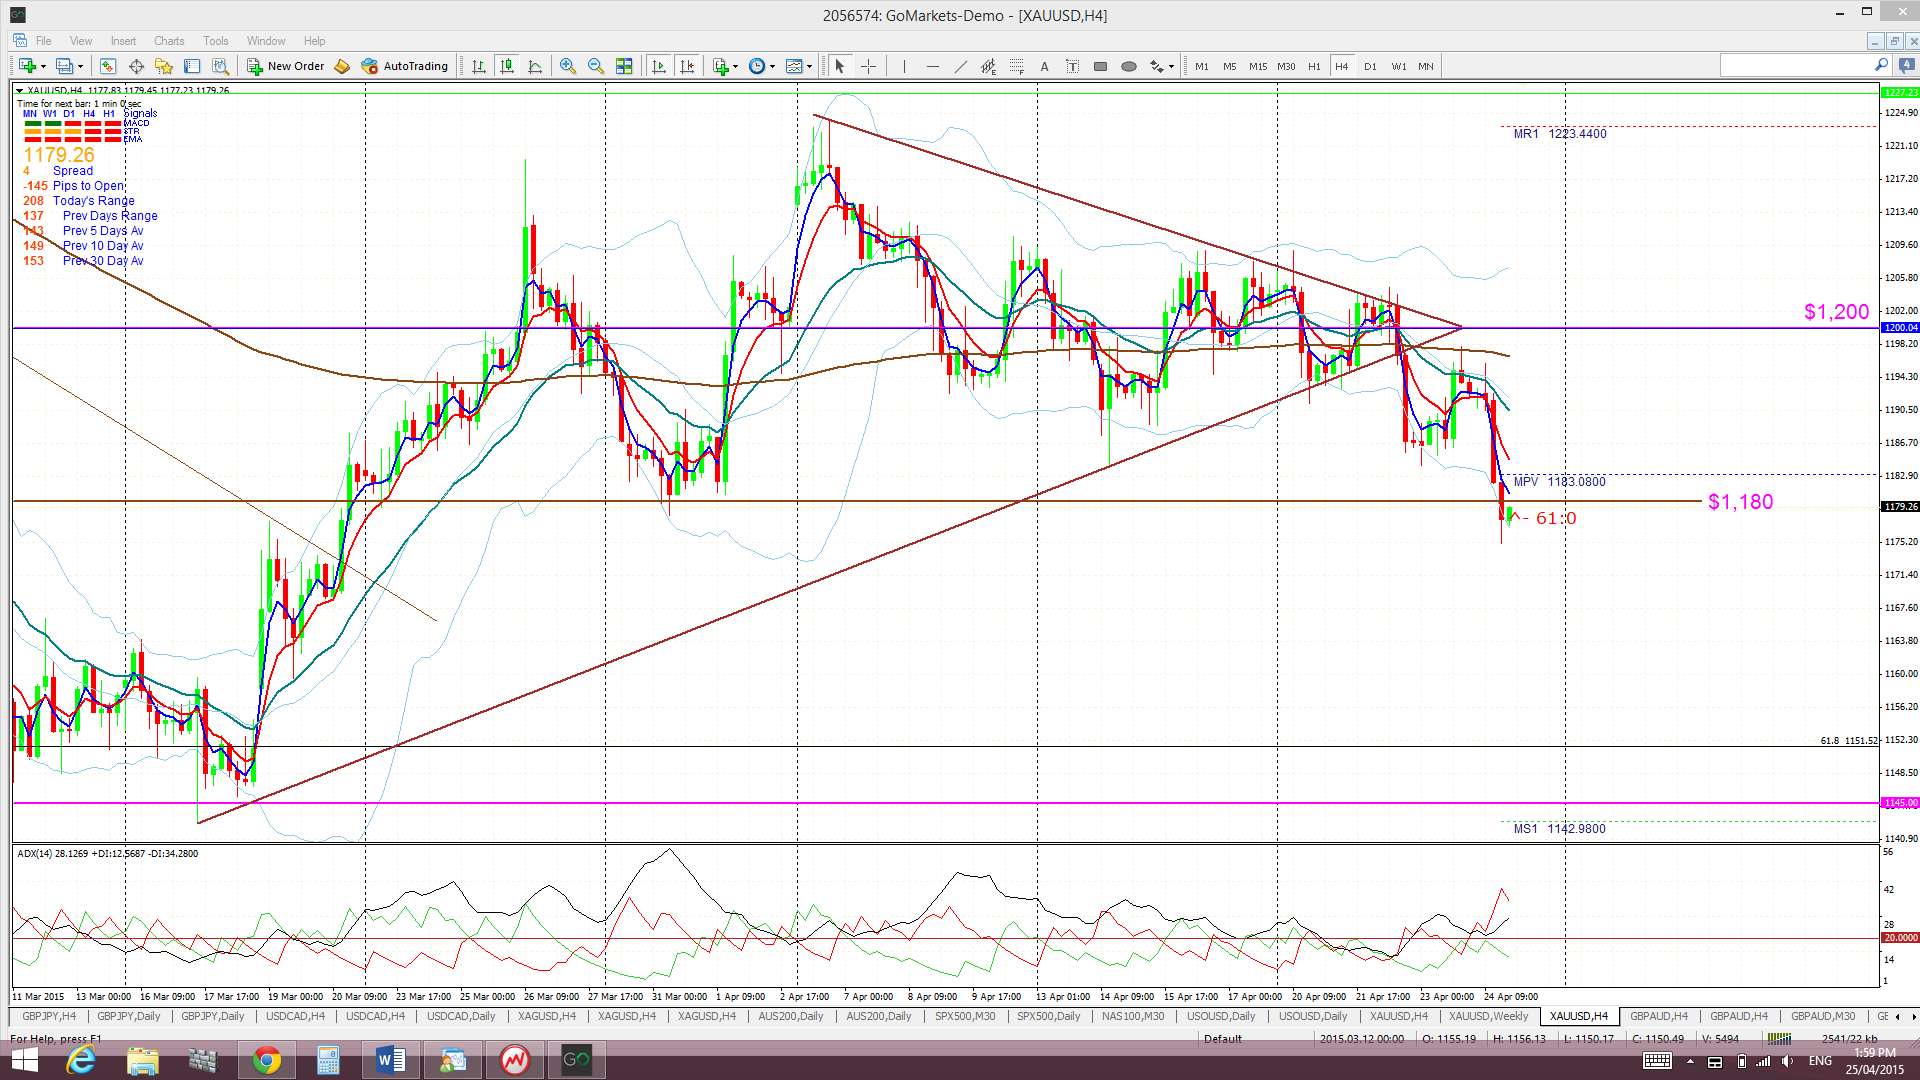
Gold: Gold also broke down from a triangle and below $1,200 support early in the week as the US$ rallied. The pull back with the US$ later in the week saw price try to reclaim the $1,200 level but it wasn’t successful. The metal then fell further to close the week below $1,180 support.
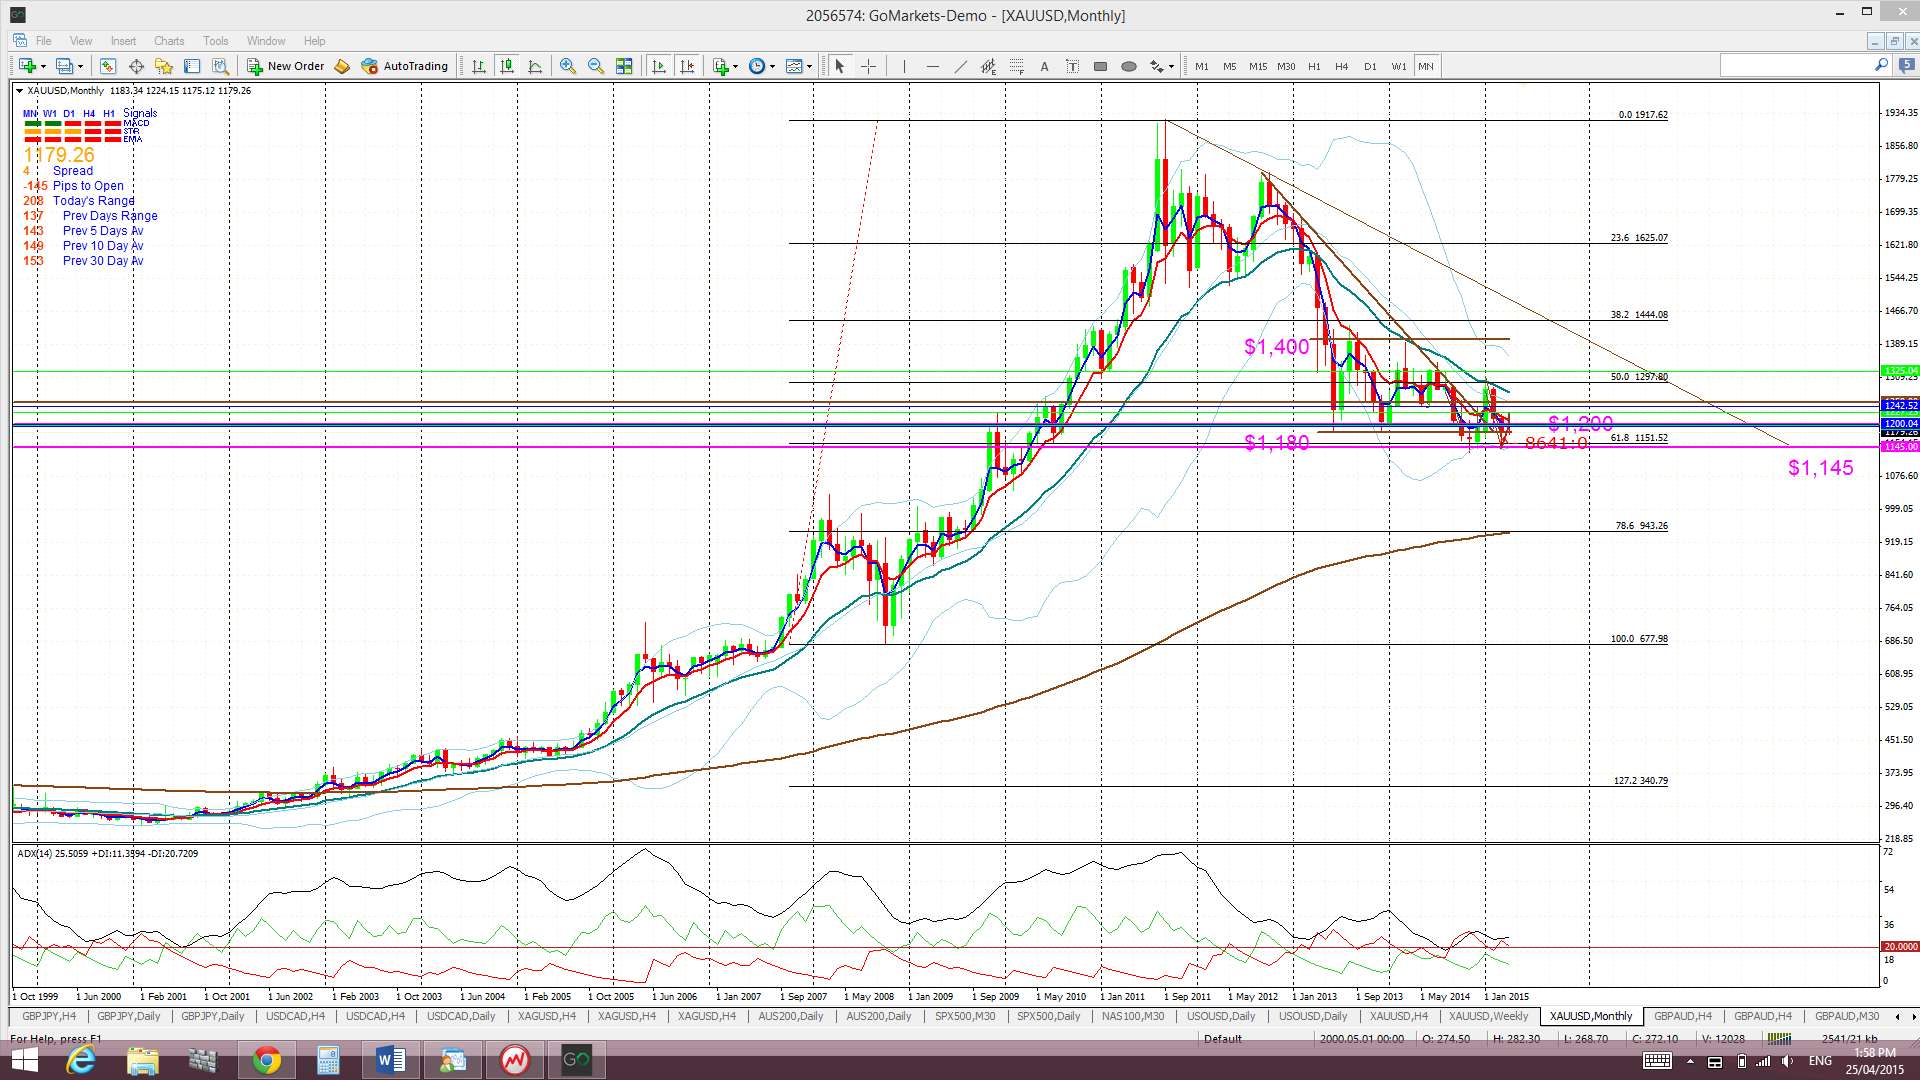
Gold does continue to hold above the 61.8% Fib retracement of the 2008-2011 bull run that is near $1,145 though. Like Silver, it seems to be forming a base here and could continue with gains if the US$ continues to weaken at all.
However, any new break and hold below $1,145 would suggest a pull back. Bearish targets below $1,145 include the $1,000 psychological level and, then, the 78.6% fib near $950.
Gold is trading below the Ichimoku Cloud on the 4hr chart, just below the bottom of the Cloud on the daily chart and below the Cloud on the weekly and monthly charts.
Note how this metal is best traded at the moment during the US session and off 30 minute charts:
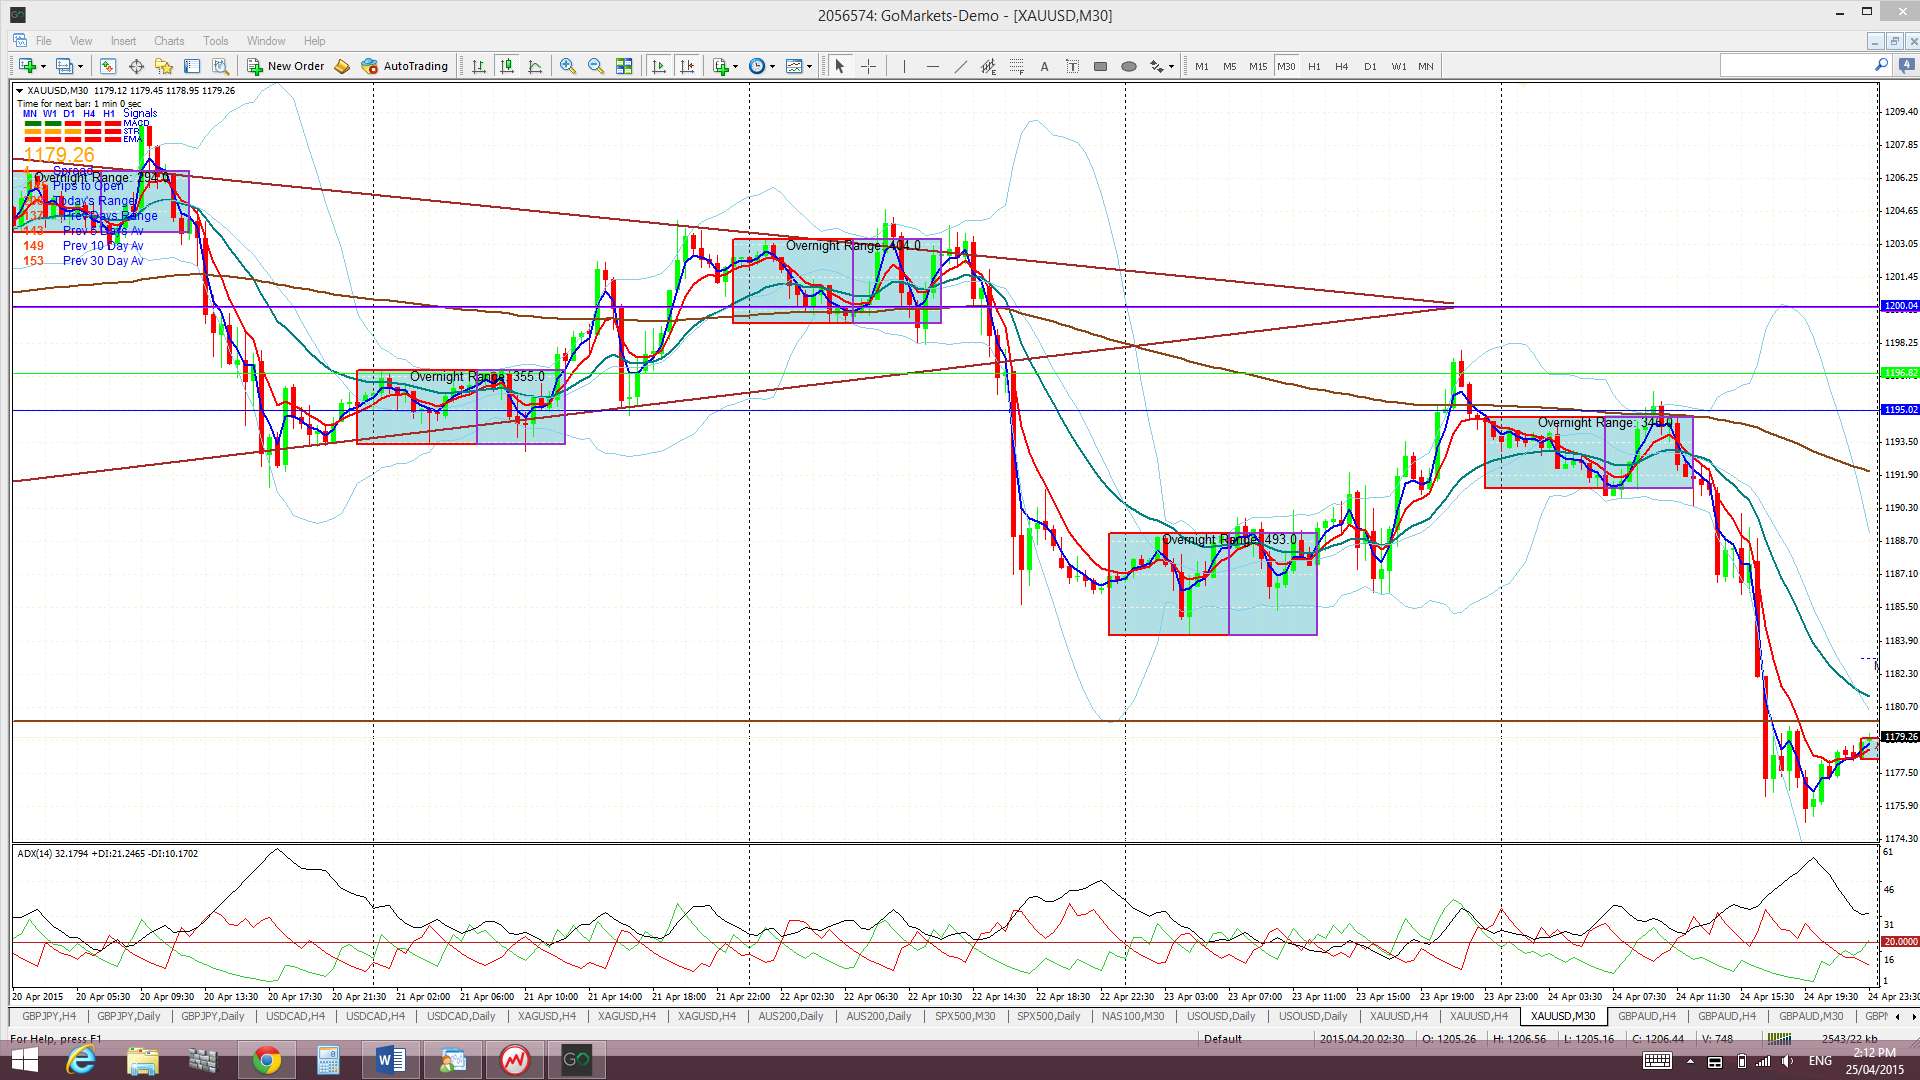
As for Silver, the risk event for Gold this week is FOMC and the Federal Funds Rate announcement. Any continued US$ weakness might end up supporting the metal.
The weekly candle closed as a bearish candle.
- I’m watching for any new TC signal, the triangle trend lines and the $1,200 and $1,180 levels.
The post Weaker US$ but global stocks rally. Cross-pairs in greater focus. appeared first on www.forextell.com.