The two main Aussie stock market indices look like they could be building up towards a breakout move following a lengthy period of consolidation. Both are now forming up within symmetrical triangle patterns and so traders should be on the lookout for any potential breakout; bullish or bearish. However, if I was to hazard a guess, I would err towards the breakouts being of a bullish nature.
The two indices have spent most of 2014 consolidating around the 61.8% fib levels of the bear move from the GFC. The XAO is just below this key fib level but the XAO is just above. The 61.8% is one of the major Fibonacci levels and it is therefore not surprising to see these two indices hover there throughout this year. Both are testing the upper trend line of recent triangle patterns but this isn’t why I suspect the breakout might be bullish.
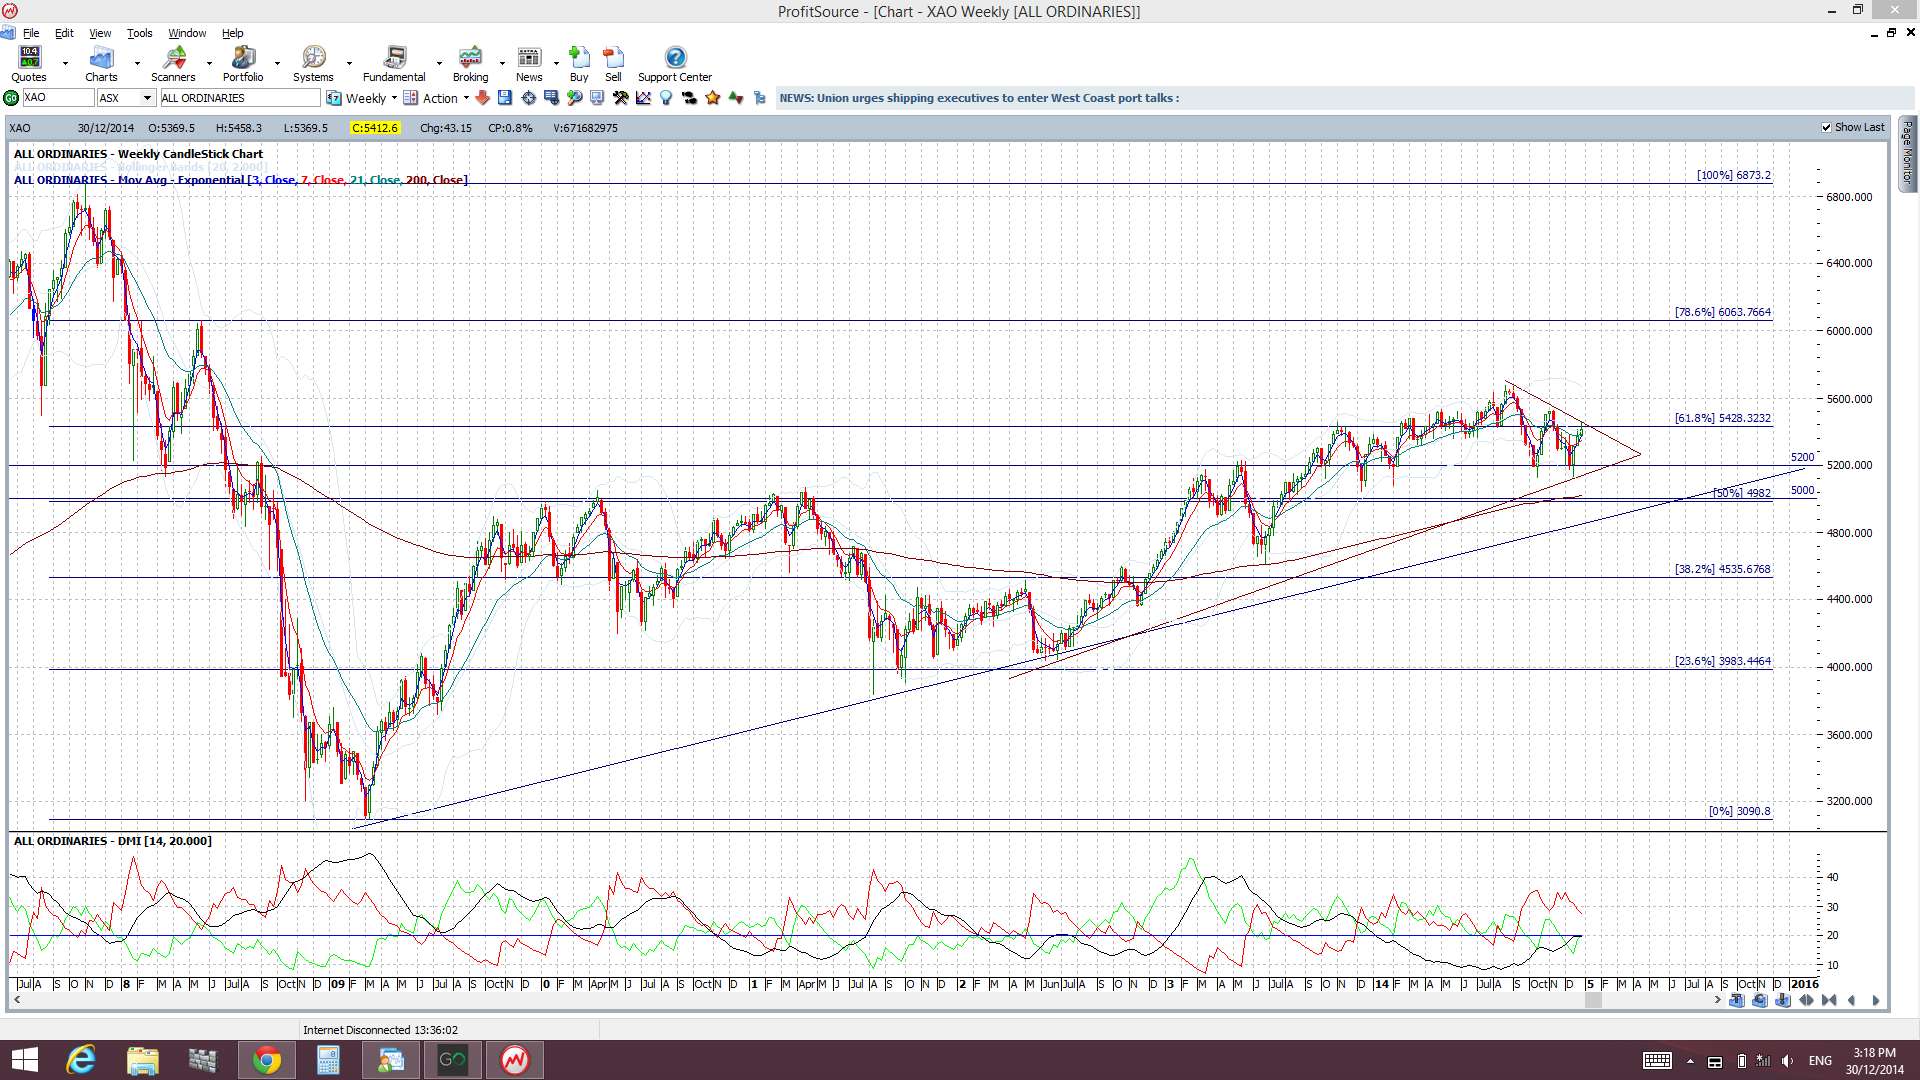
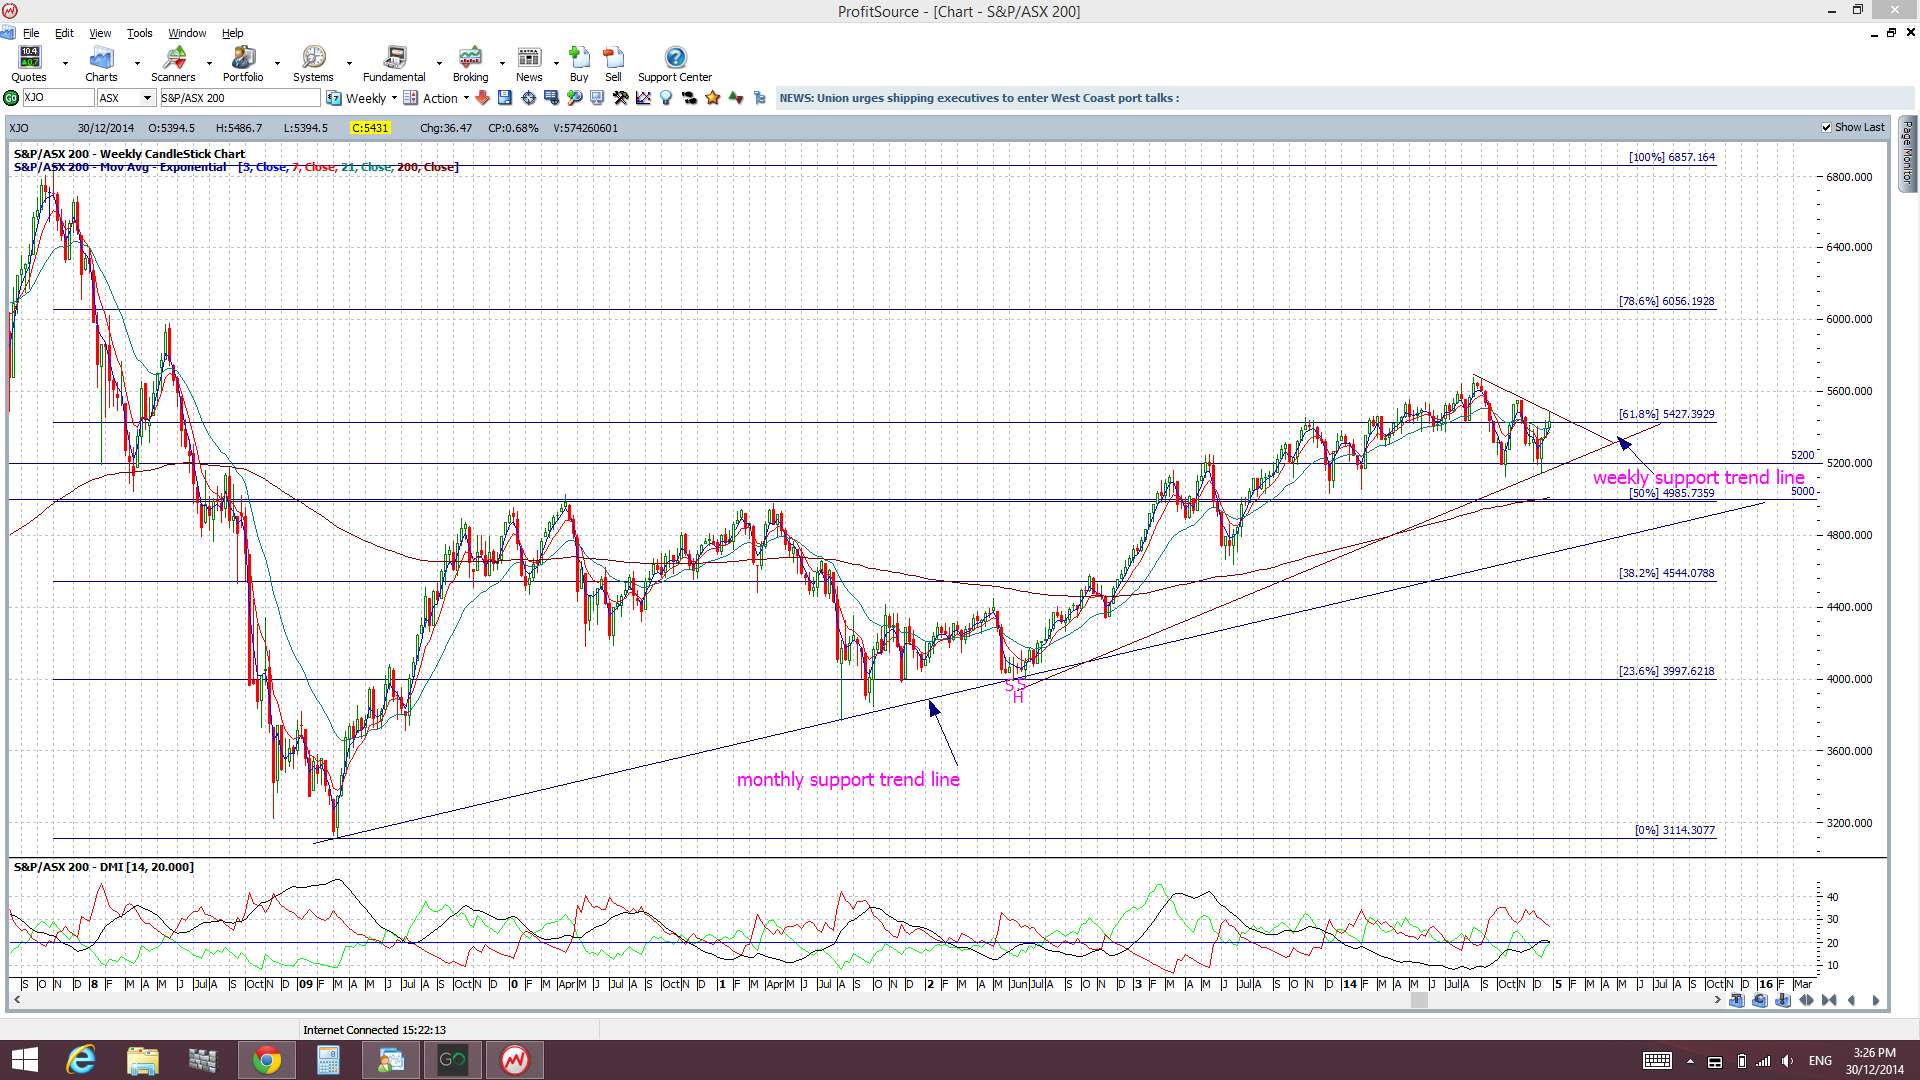
XAO: The All Ordinaries Index: this index covers about 95% of Australian shares. The main chart in focus here is the weekly chart (see below):
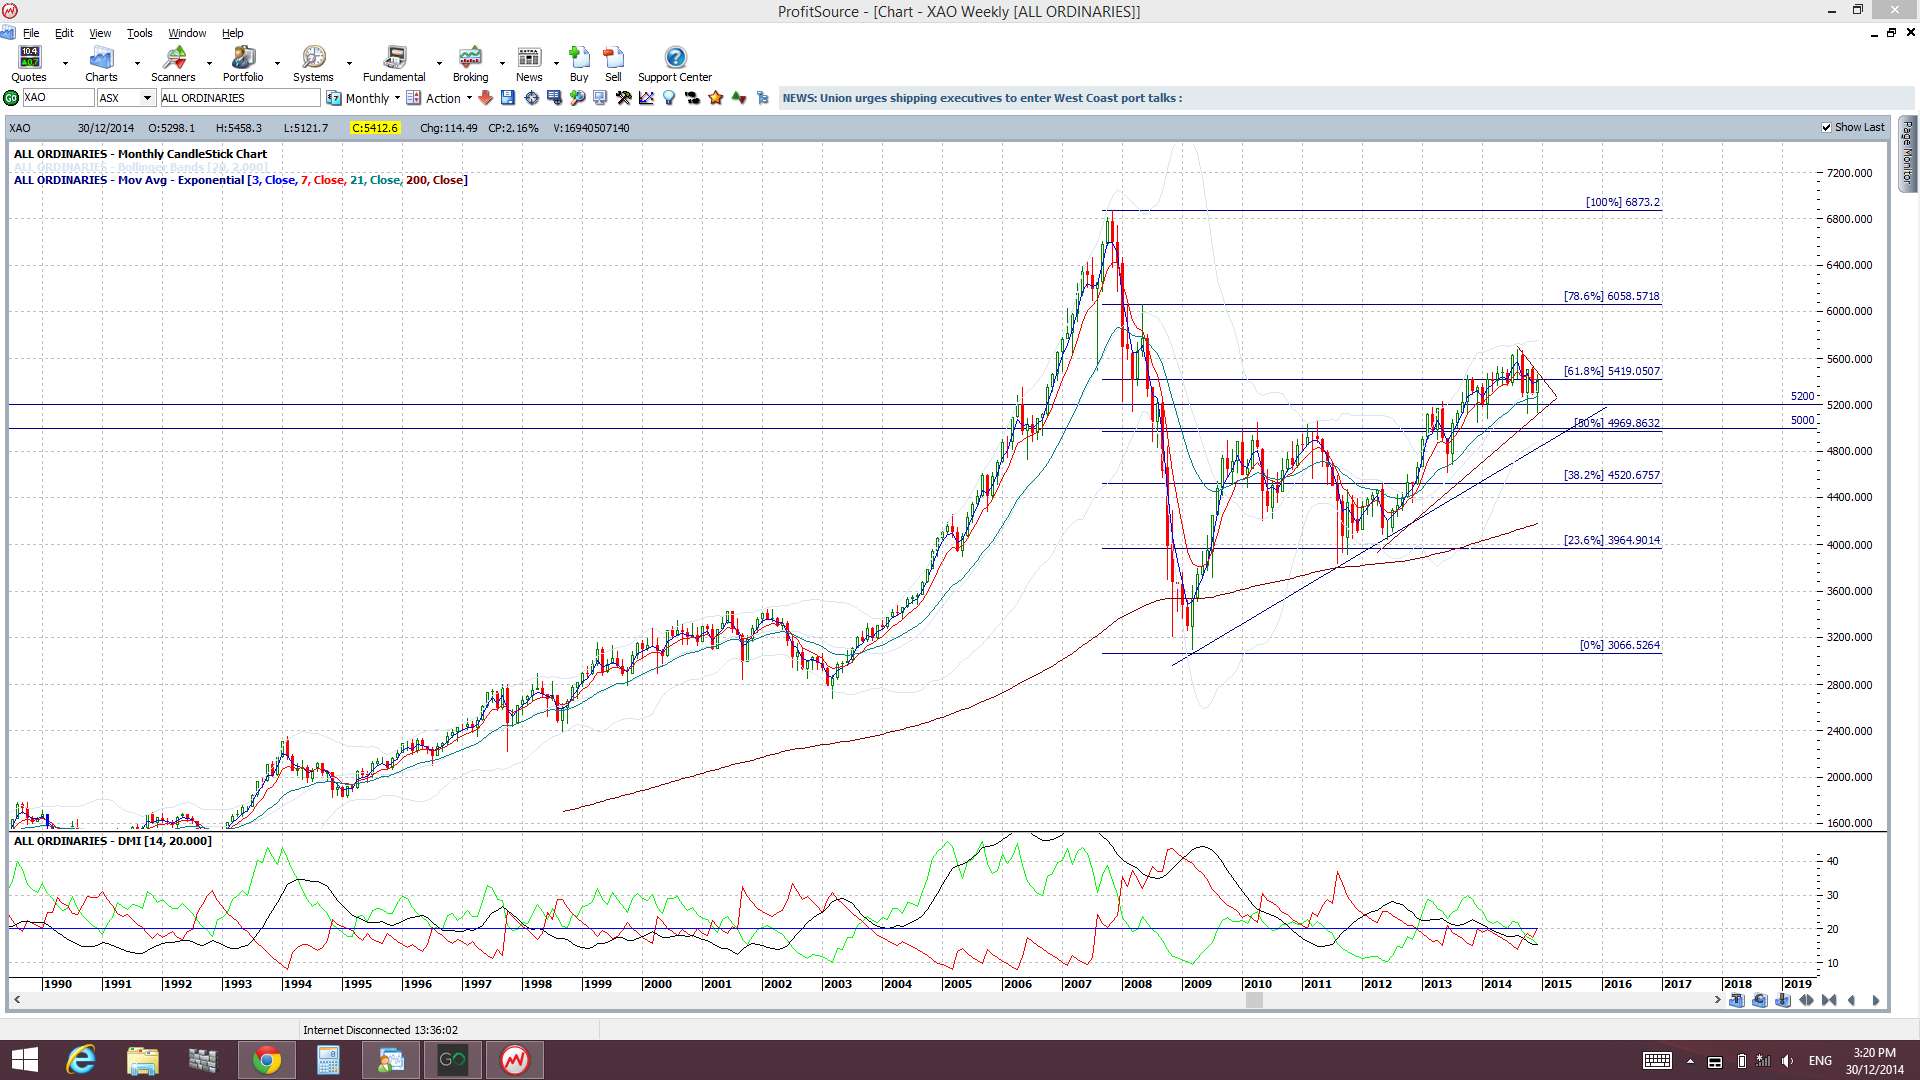
XAO monthly: consolidation seen around the 61.8% fib of the GFC decline:
XAO weekly: the key feature to note here is that of the ADX indicator. The black ADX momentum line dipped to start 2014 but has been slowly building since then and is heading up towards the 20 level. Selling momentum (red line) is waning and buying momentum (green line) is building. Thus, I would expect from this that any triangle breakout might be to the upside:
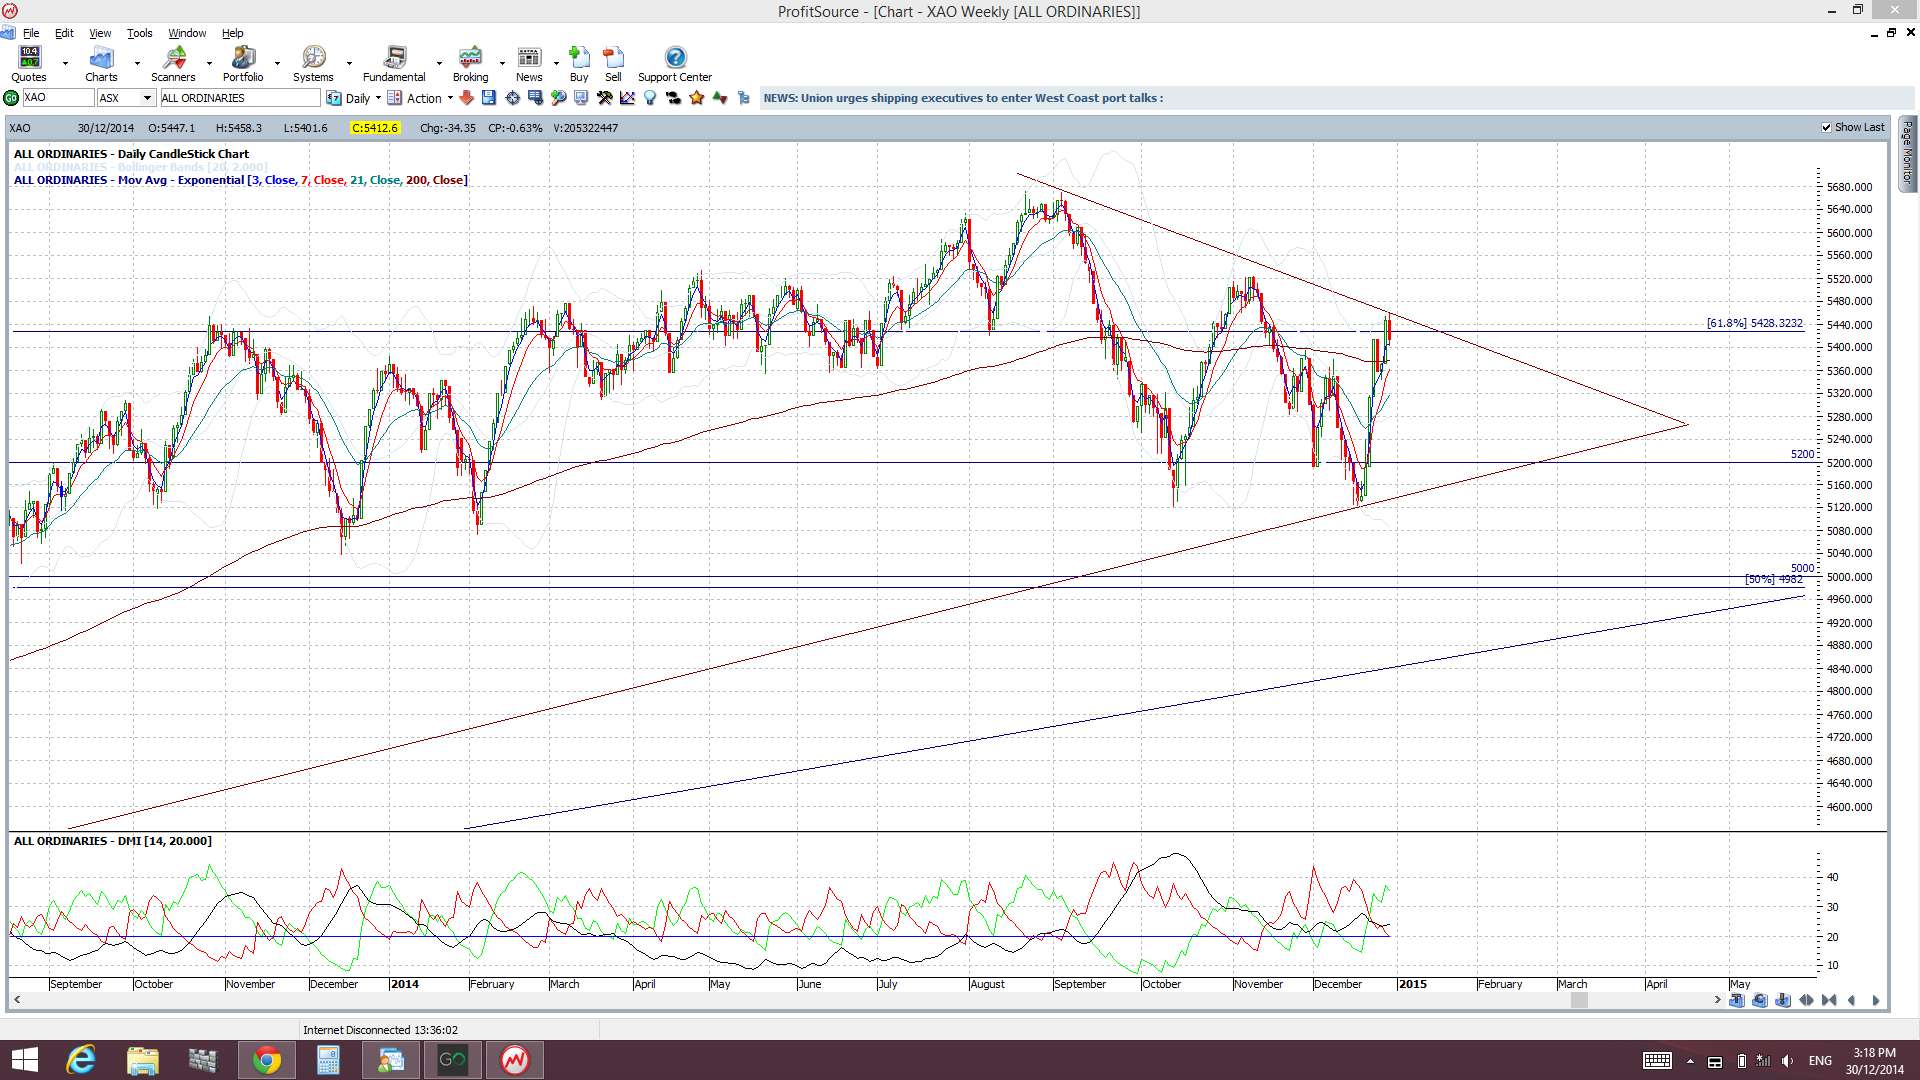
XAO daily: the impact of the 61.8% fib can be seen clearly here. Watch for any triangle breakout:
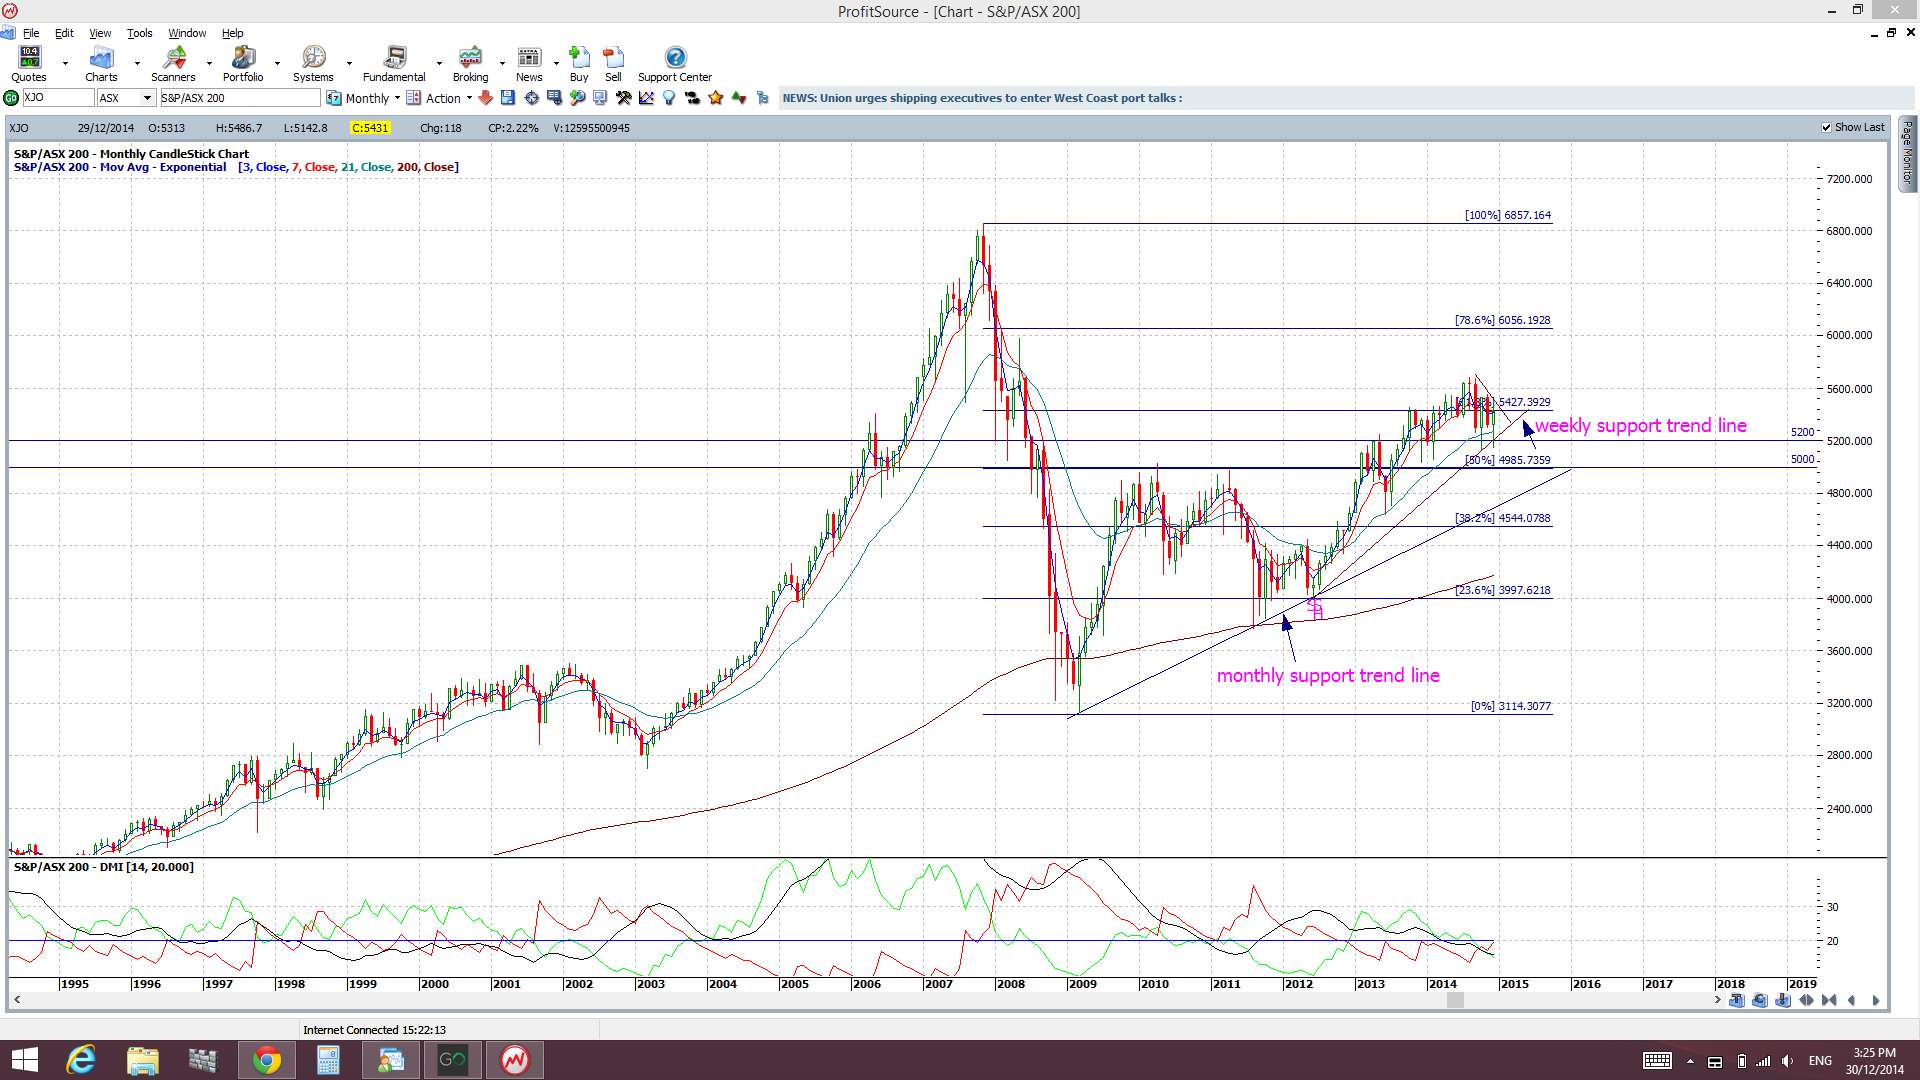
XJO: S&P/ASX 200: the charts here are very similar to that of the XAO.
XJO monthly: consolidation seen around the 61.8% fib level post GFC here as well:
XJO weekly: The balck ADX momentum line is moving higher here too. Selling pressure is declining and buying pressure is also building. There is no guarantee but on this current tangent I would expect a bullish breakout:
XJO daily: watch for any triangle breakout here:

Comparison to US Indices:
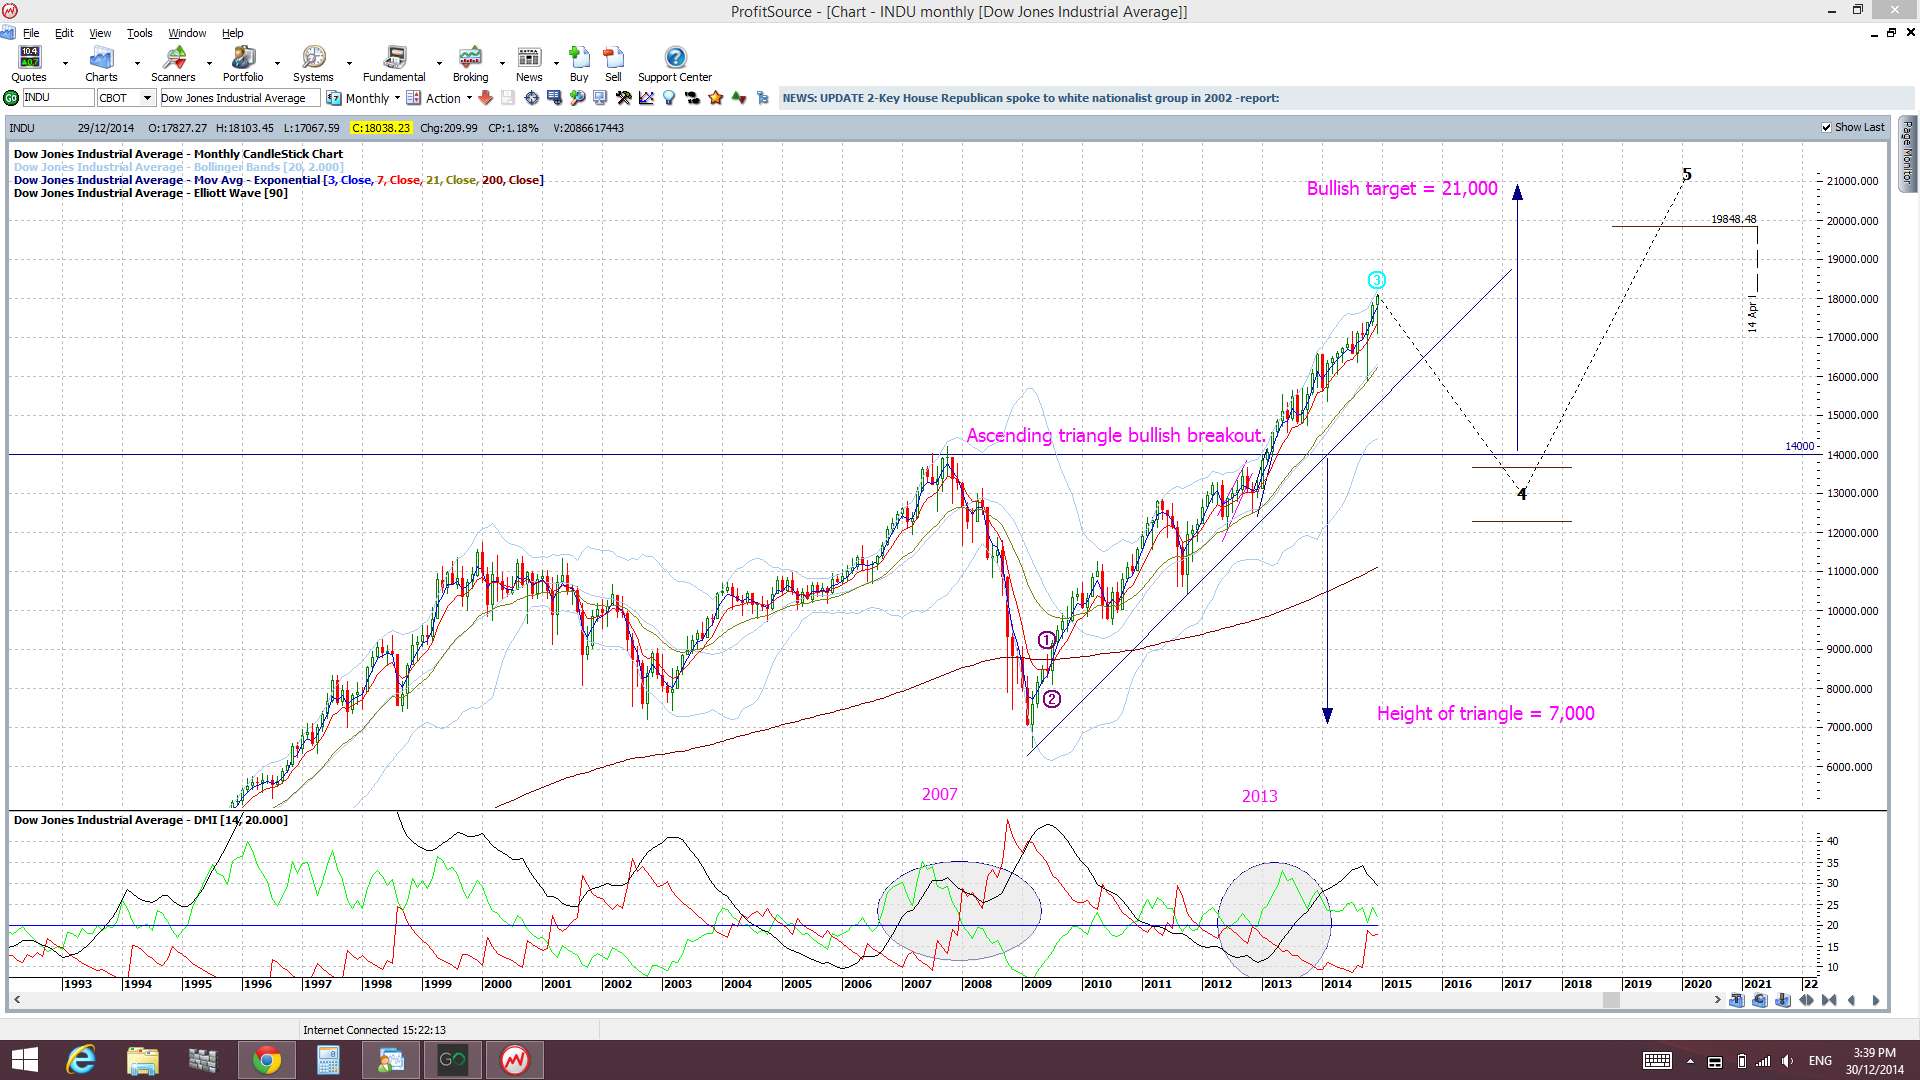
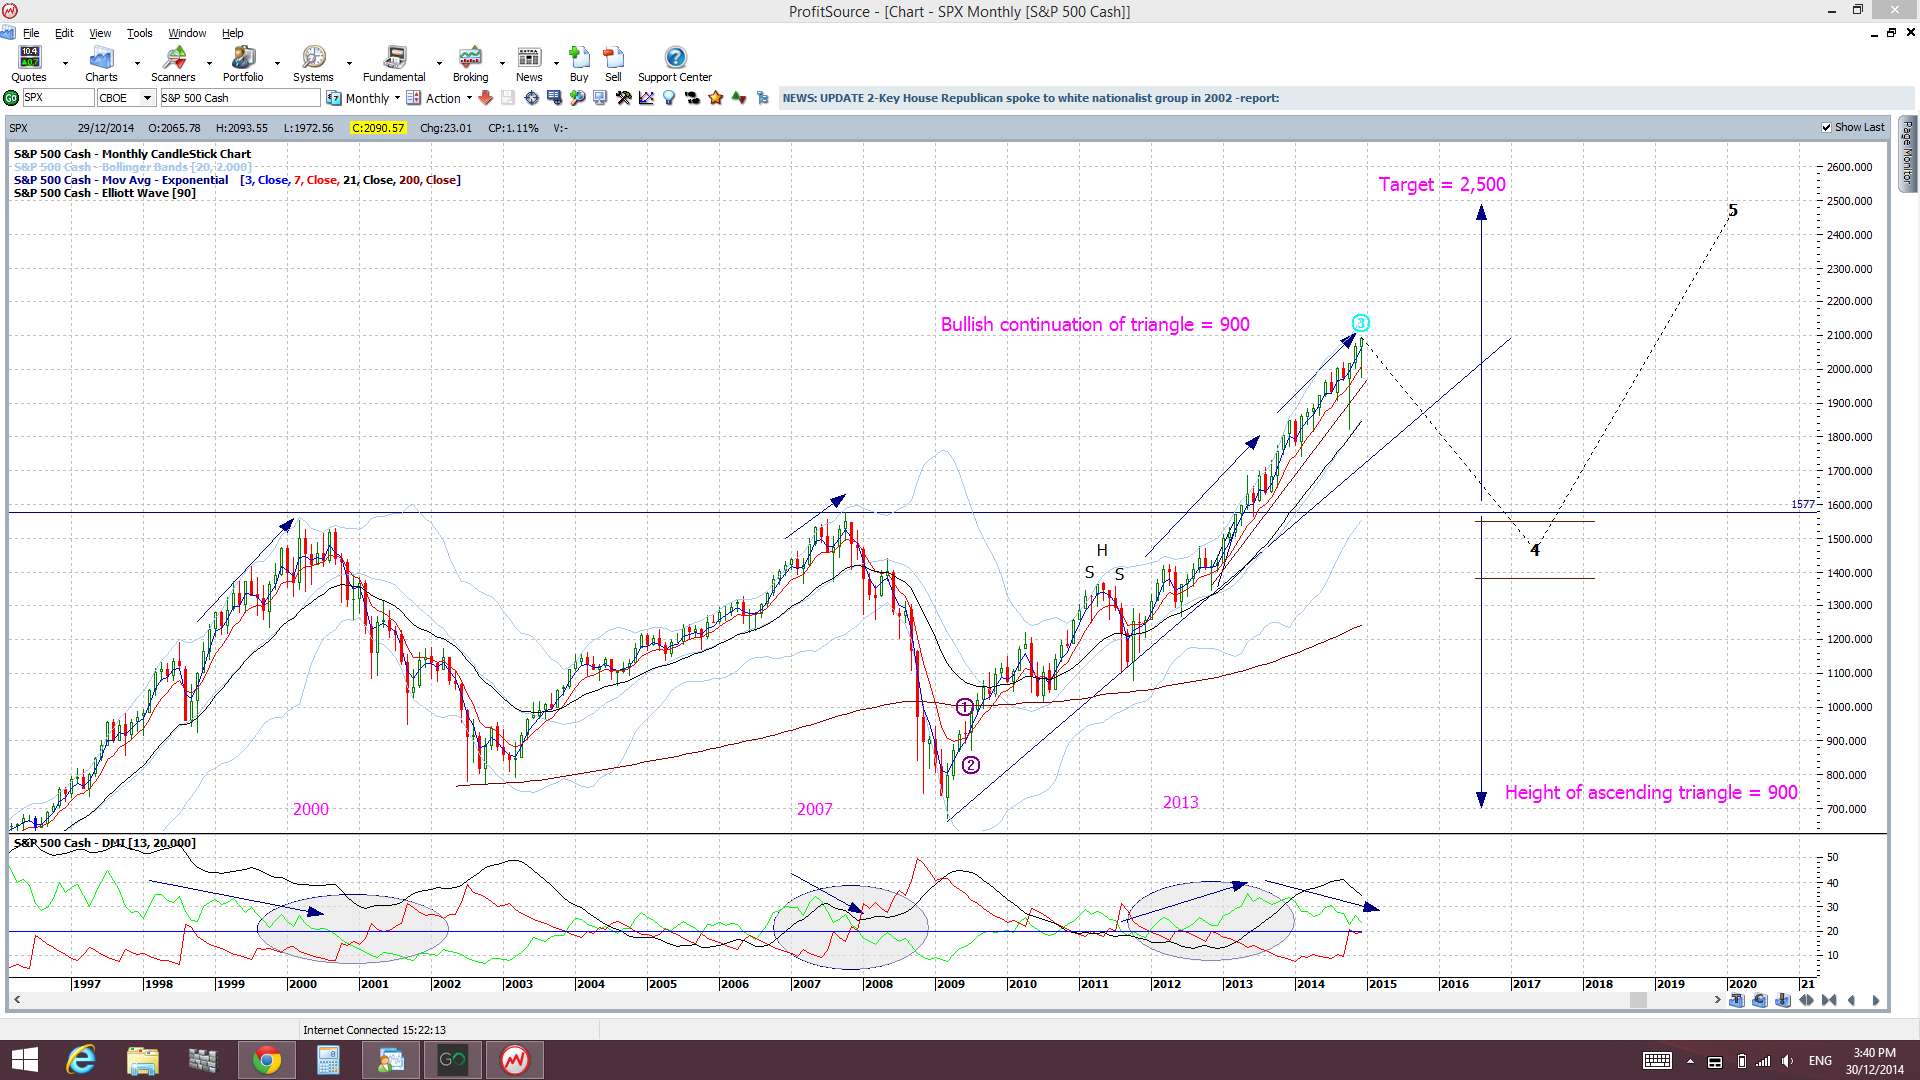
The two Aussie indices have lagged in their recovery following the GFC compared to indices like the US DJIA and the S&P500. The DJIA and S&P500 have retraced all of their GFC loss and… then some! This is another reason for holding some positive outlook for the Aussie stock market to post a recovery:
DJIA monthly:
S&P500 monthly:
Summary:
The Aussie XAO and XJO market indices have lagged in their recovery following the GFC compared to many other market indices.
The XAO and XJO Aussie stock market indices are both consolidating within weekly chart triangle patterns. Any breakout could be bullish or bearish but the current formation on the ADX indicator would suggest a bias towards a bullish breakout.
The post XAO & XJO: Aussie Stock Indices. appeared first on www.forextell.com.