The US$ looks to be under some short term downside pressure on Monday following the data miss on Friday and selling rallies appears to be the short term play although I suspect that the generally choppy conditions are going to continue – and will be very much data driven – as we head towards the next FOMC meeting. Elsewhere stocks and commodities look pretty much neutral although the ASX looks to have some medium term weakness in store. On the crosses, the Aud looks a bit soft against the yen and the Euro, but I don’t think we should be looking for too much either way today.
—————————————————————————————————————————
*Trade of the day: 5/15/2017 8:10 AM (AET)
Buy EurUsd @ 1.0900. SL @ 1.0860, TP @ 1.0980
or
Sell EurUsd @ 1.0995. SL @ 1.1035, TP @ 1.0880
*This is a personal opinion only, based on the look of the table below, and carries no guarantee of success.
—————————————————————————————————————————
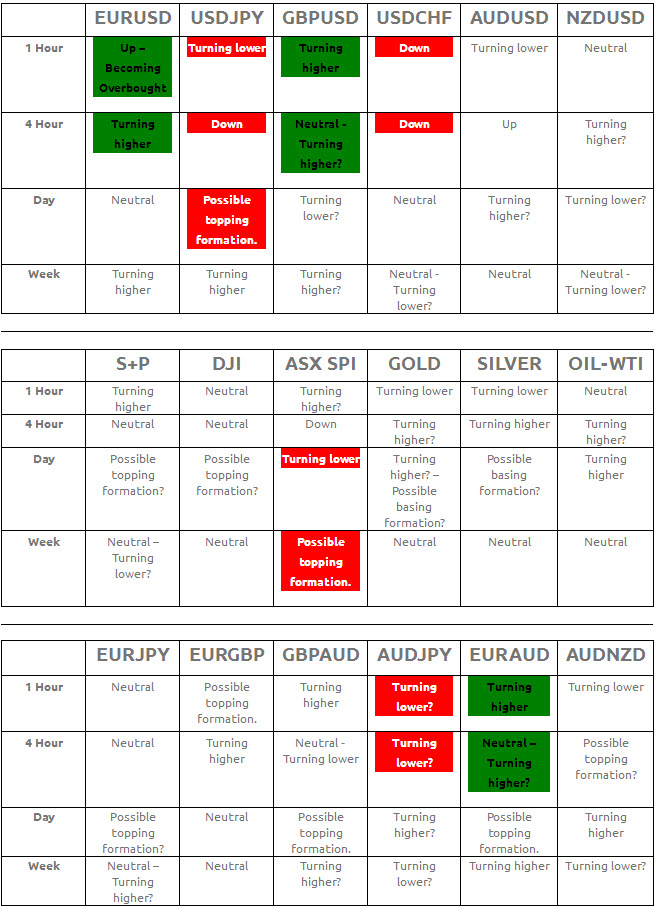
Red = Possible Sell Opportunity.Green= Possible Buy Opportunity.
The products marked in red/green suggest either a short term (1hour/4 hour charts), a medium term trend (4 hour/daily charts) or a longer term trend, where the dailies are aligned or seem to be aligning with the weekly indicators.
The shorter term (1+4 hour)) momentum indicators may also be aligned with the longer term charts, but equally likely, they may be pointing in the opposite direction and may suggest a buy or sell level on a pullback, in which case they may show a short term bias that differs from the longer term trend. In order to work out the short term trades, or to look for levels at which to enter the market hoping to take advantage of the longer term trend, this table should be used in conjunction with the daily outlook onwww.fxcharts.net using the buy/sell support/resistance levels mentioned in the individual currency pairs, commodities or indices as a guide.
The trend tables are based on the direction of the oscillators for the various time frames, using a combination of MACDs, RSIs and Slow Stochastics.
By May 15, 2017
Source: FXCharts