Fibonacci retracements are ratios often used by traders to help identify potential targets in any pull-back move. One of the most powerful of these levels is the 61.8% level but the 50% and 78.6% levels figure highly as well. Fibonacci analysis is quite widely used and so even technical analysis ‘doubters’ should respect the science of self-fulfilling prophecy here. That is, that price action often adheres to these norms given the large number of traders who observe Fibonacci and apply it in their trading! It’s really nothing more than herd mentality in operation. In this post I show some example of trades that have demonstrated respect of Fibonacci levels. I have also posted a section at the bottom with some charts that I will be keeping track of to see if they head to respect noted Fibonacci levels.
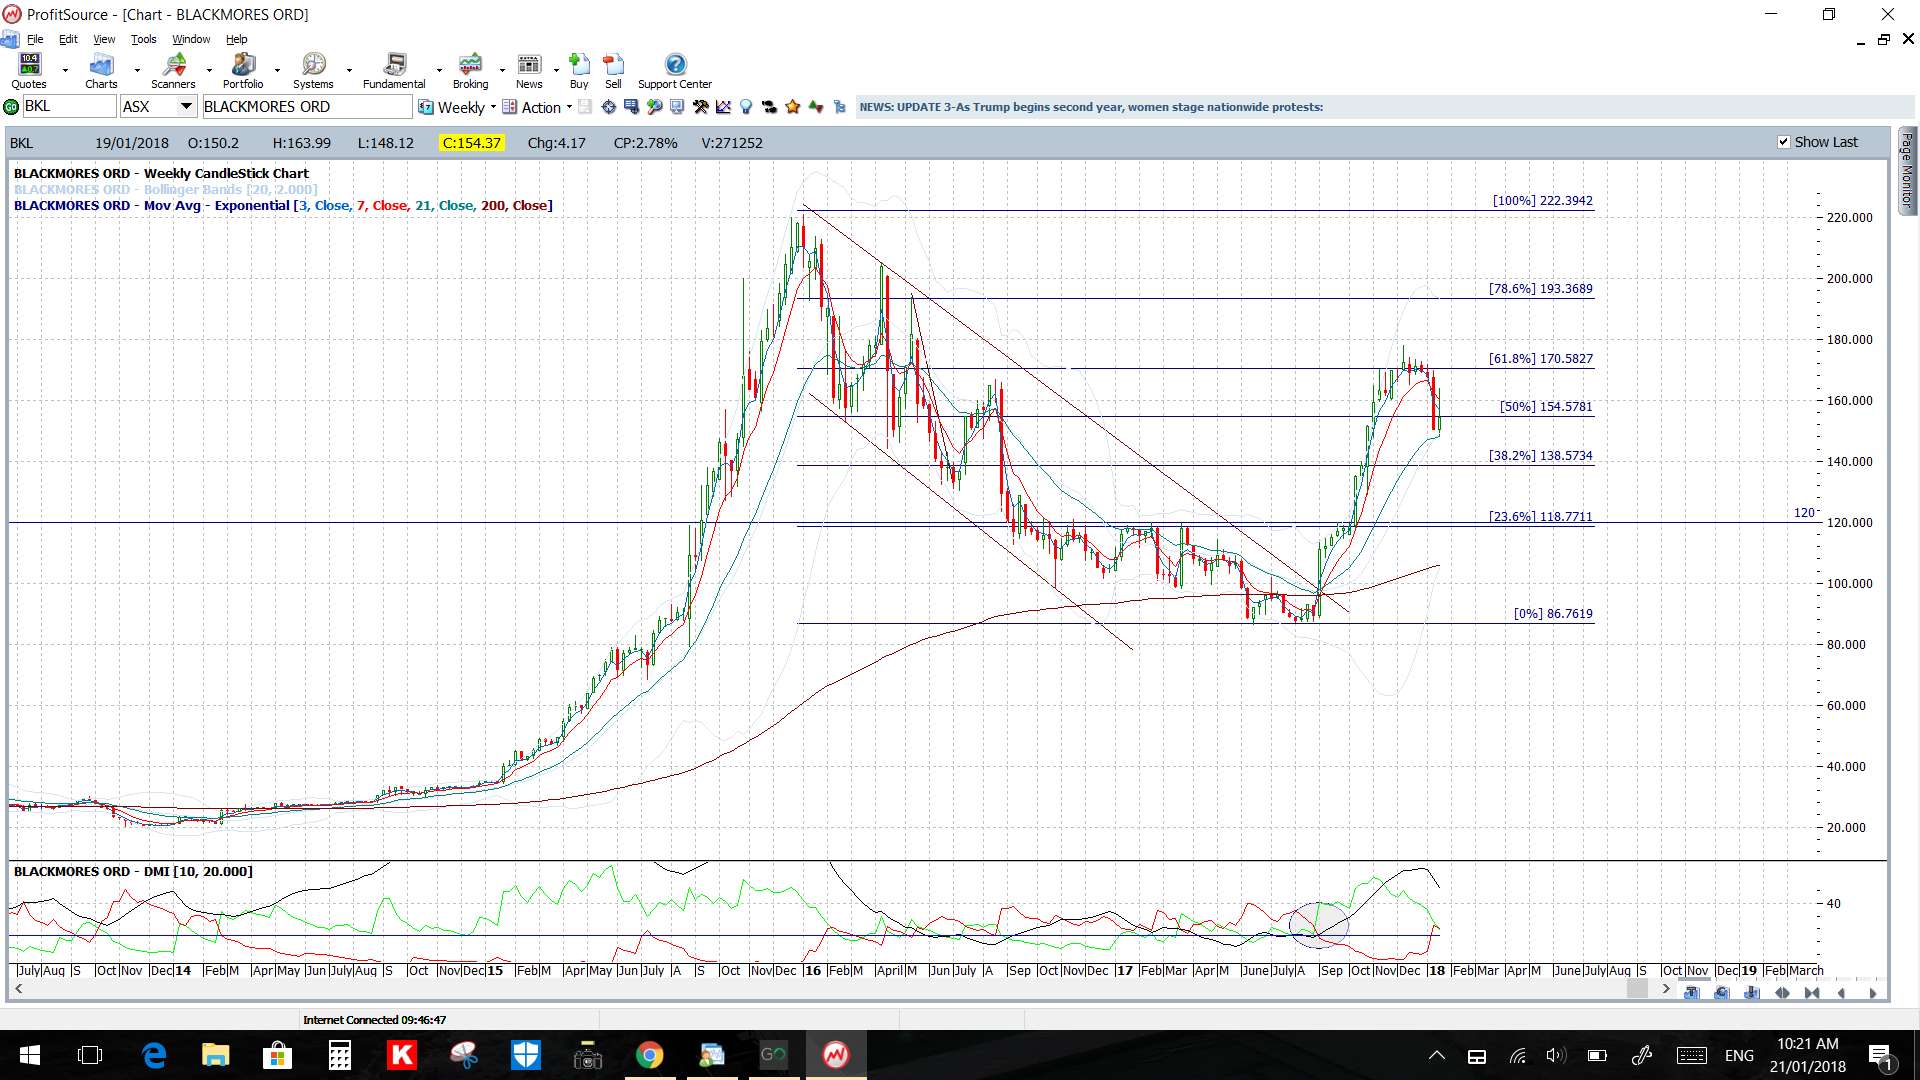
Example: Blackmores: BKL Jan 2018.
Note the respect of the weekly 61.8% fib for price action on BKL.
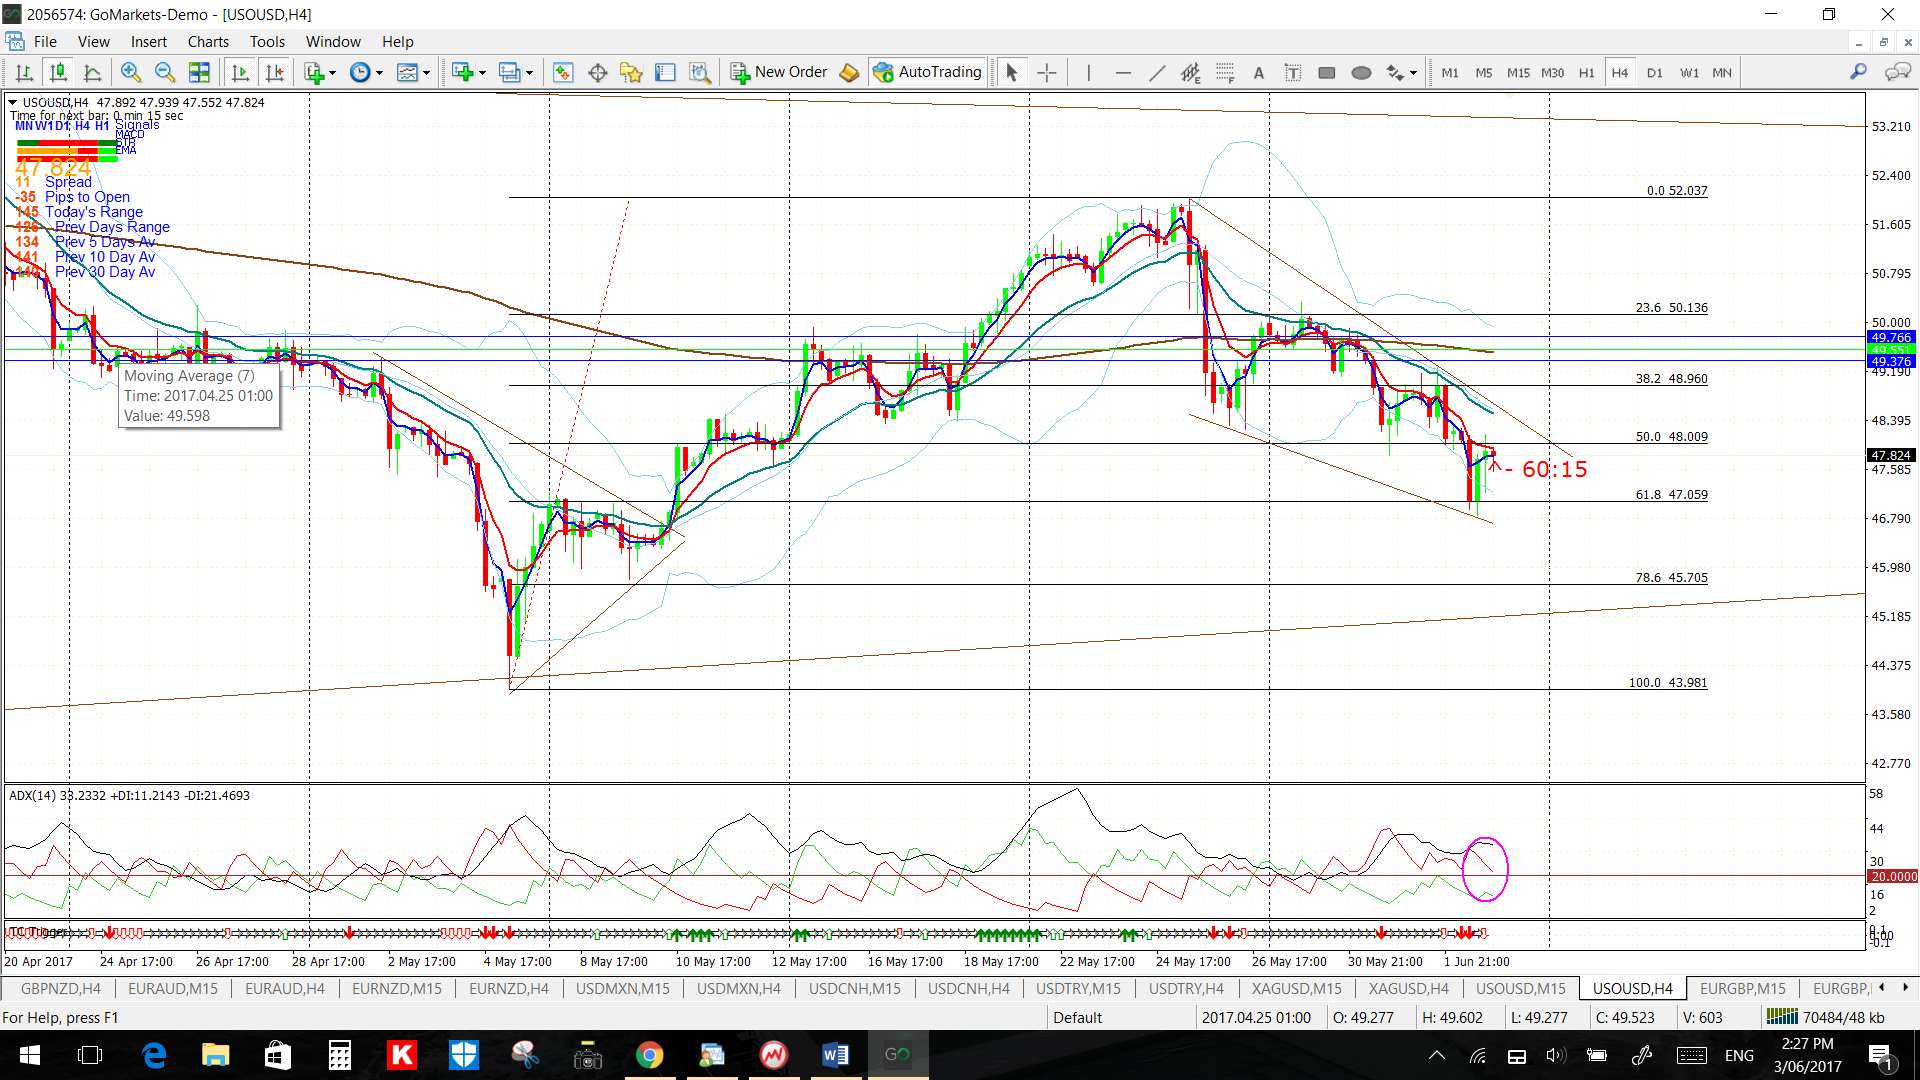
Example: Oil June 2017.
Towards the end of May I noted the 61.8% Fibonacci level might be one to watch on the 4hr chart of Oil. Here was the chart from that post:
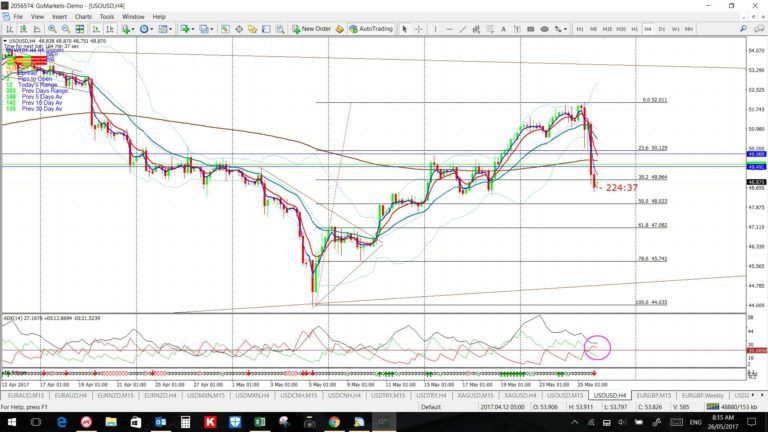
By the end of the next week this 61.8% Fib level had been tested and acted as support:
Example: Gold May 2017
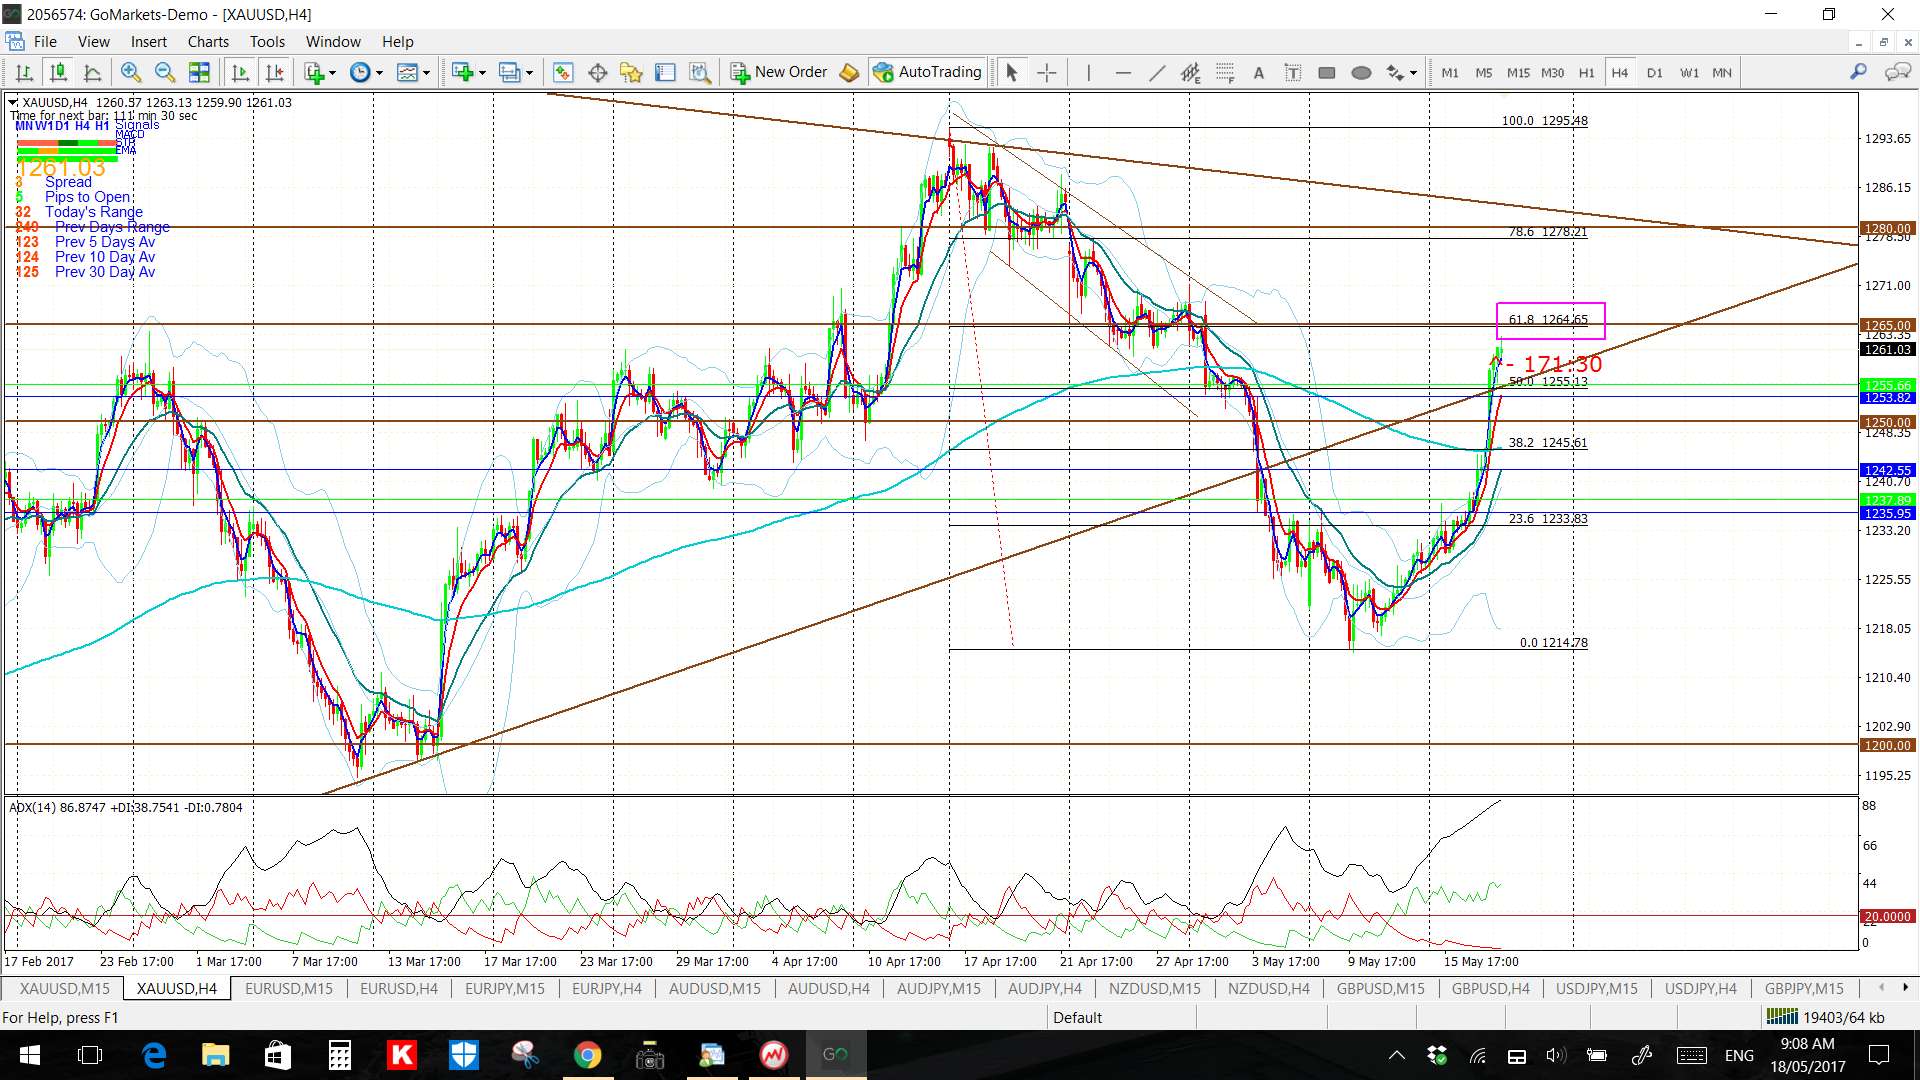
On Tuesday May 16th I had warned traders to watch for any bounce with Gold to possibly test the 61.8% Fibonacci level on the 4hr chart. This was the chart from that post:
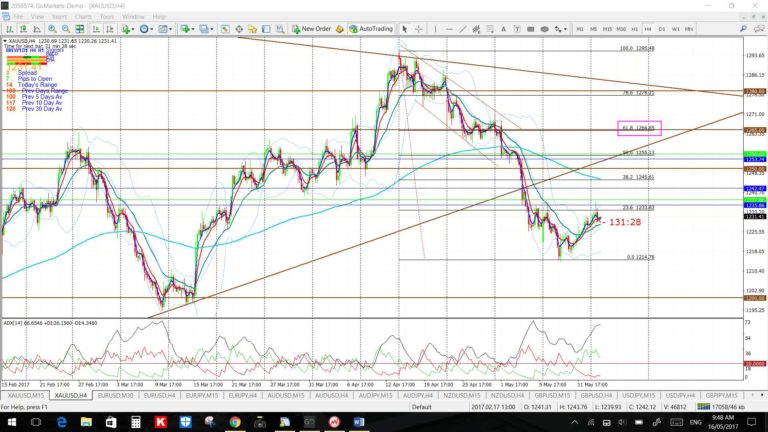
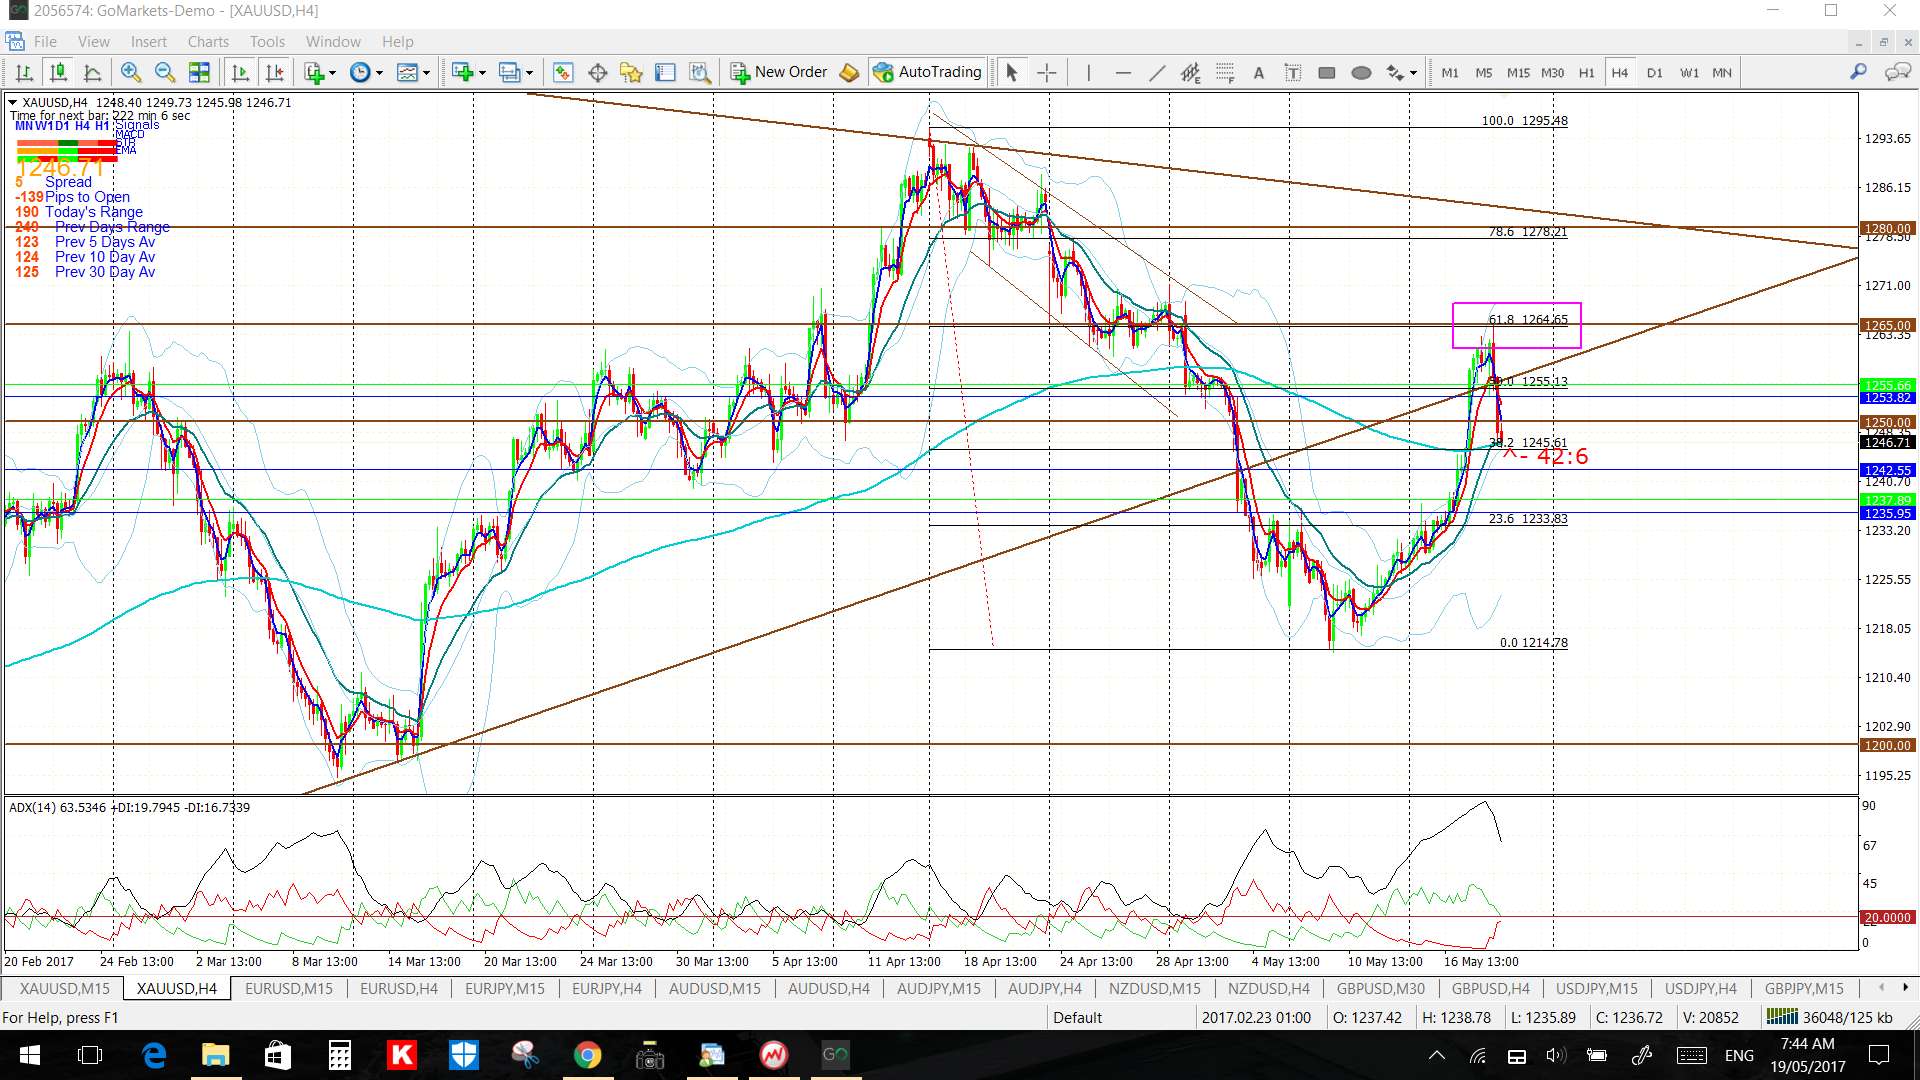
By Thursday May 18th price action had tested this key 61.8% Fib region:
The Friday 19th chart show how this 61.8% Fibonacci region proved to be effective resistance:
Example: USD/JPY May 2017
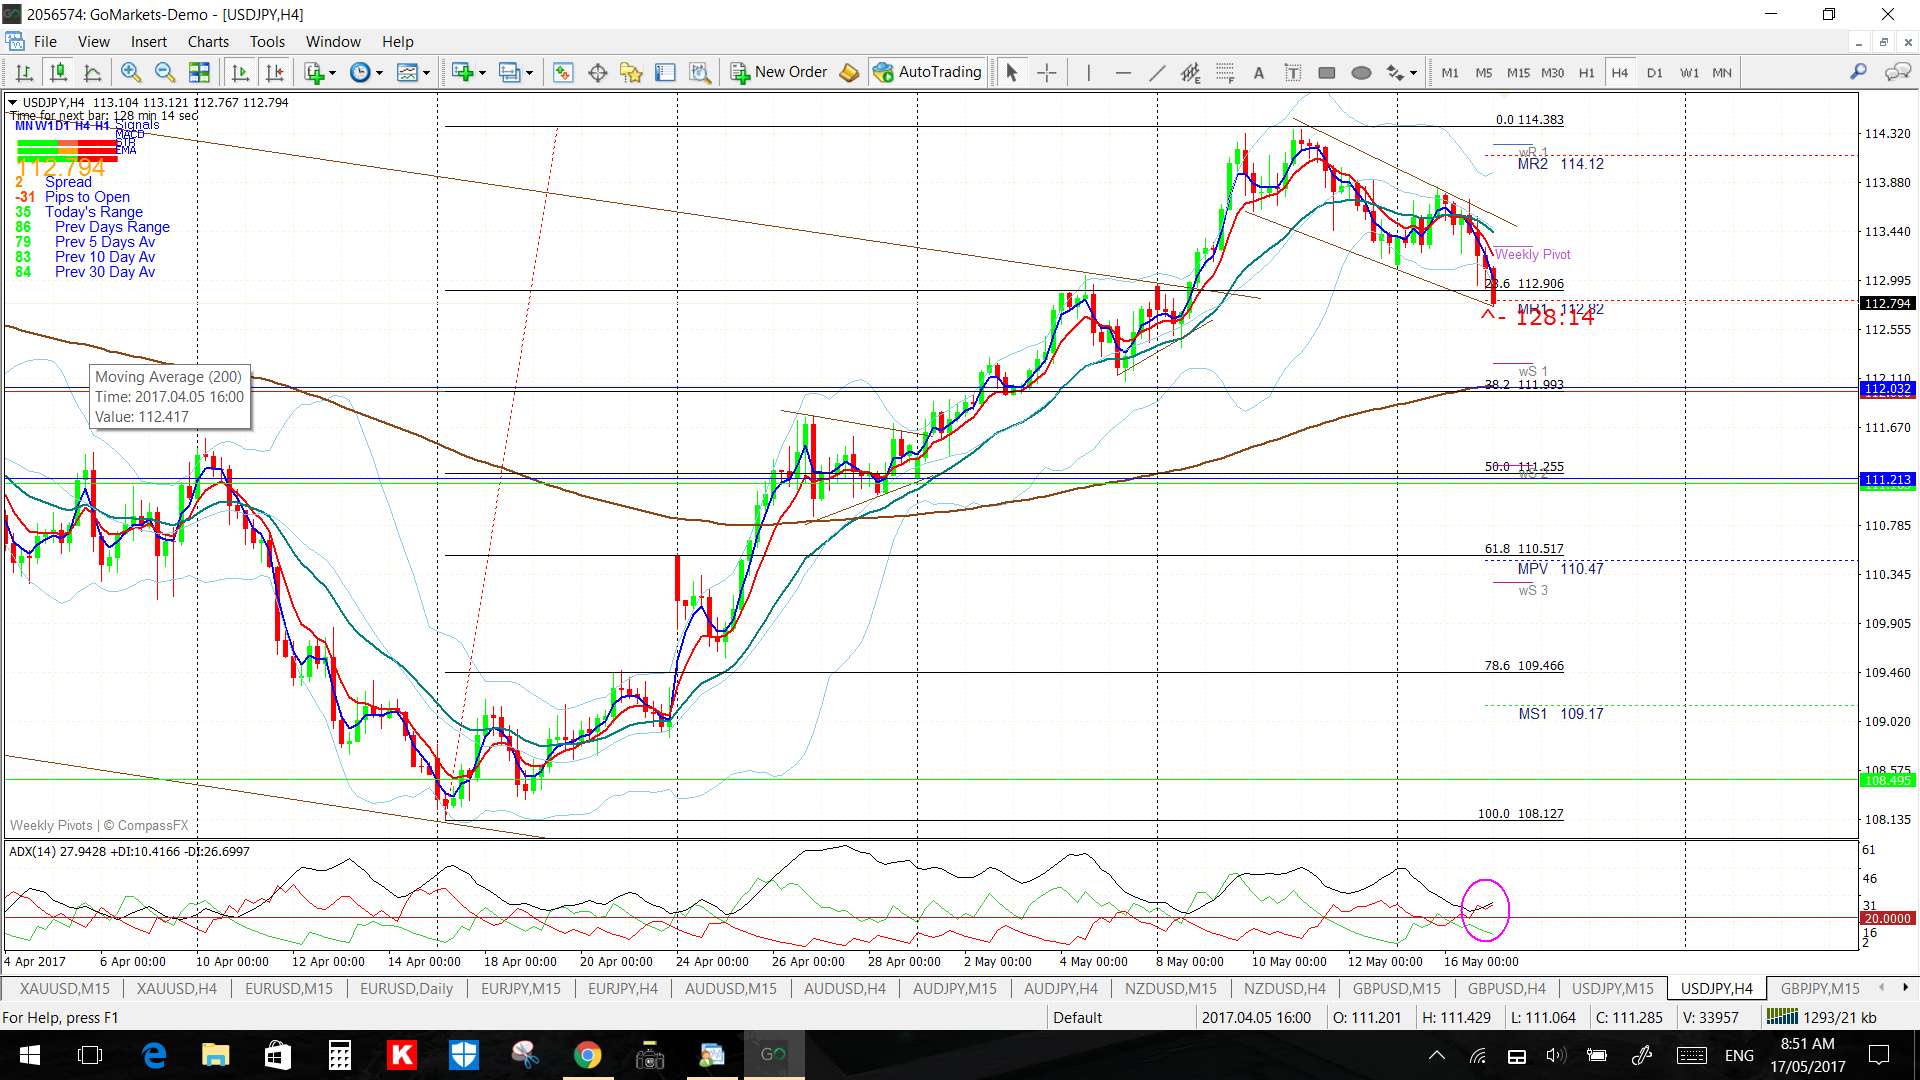
I’d mentioned to traders to watch the Flag brewing on the 4hr chart of the USD/JPY and that any breakdown might target the 61.8% Fibonacci level. This was the chart from that post:
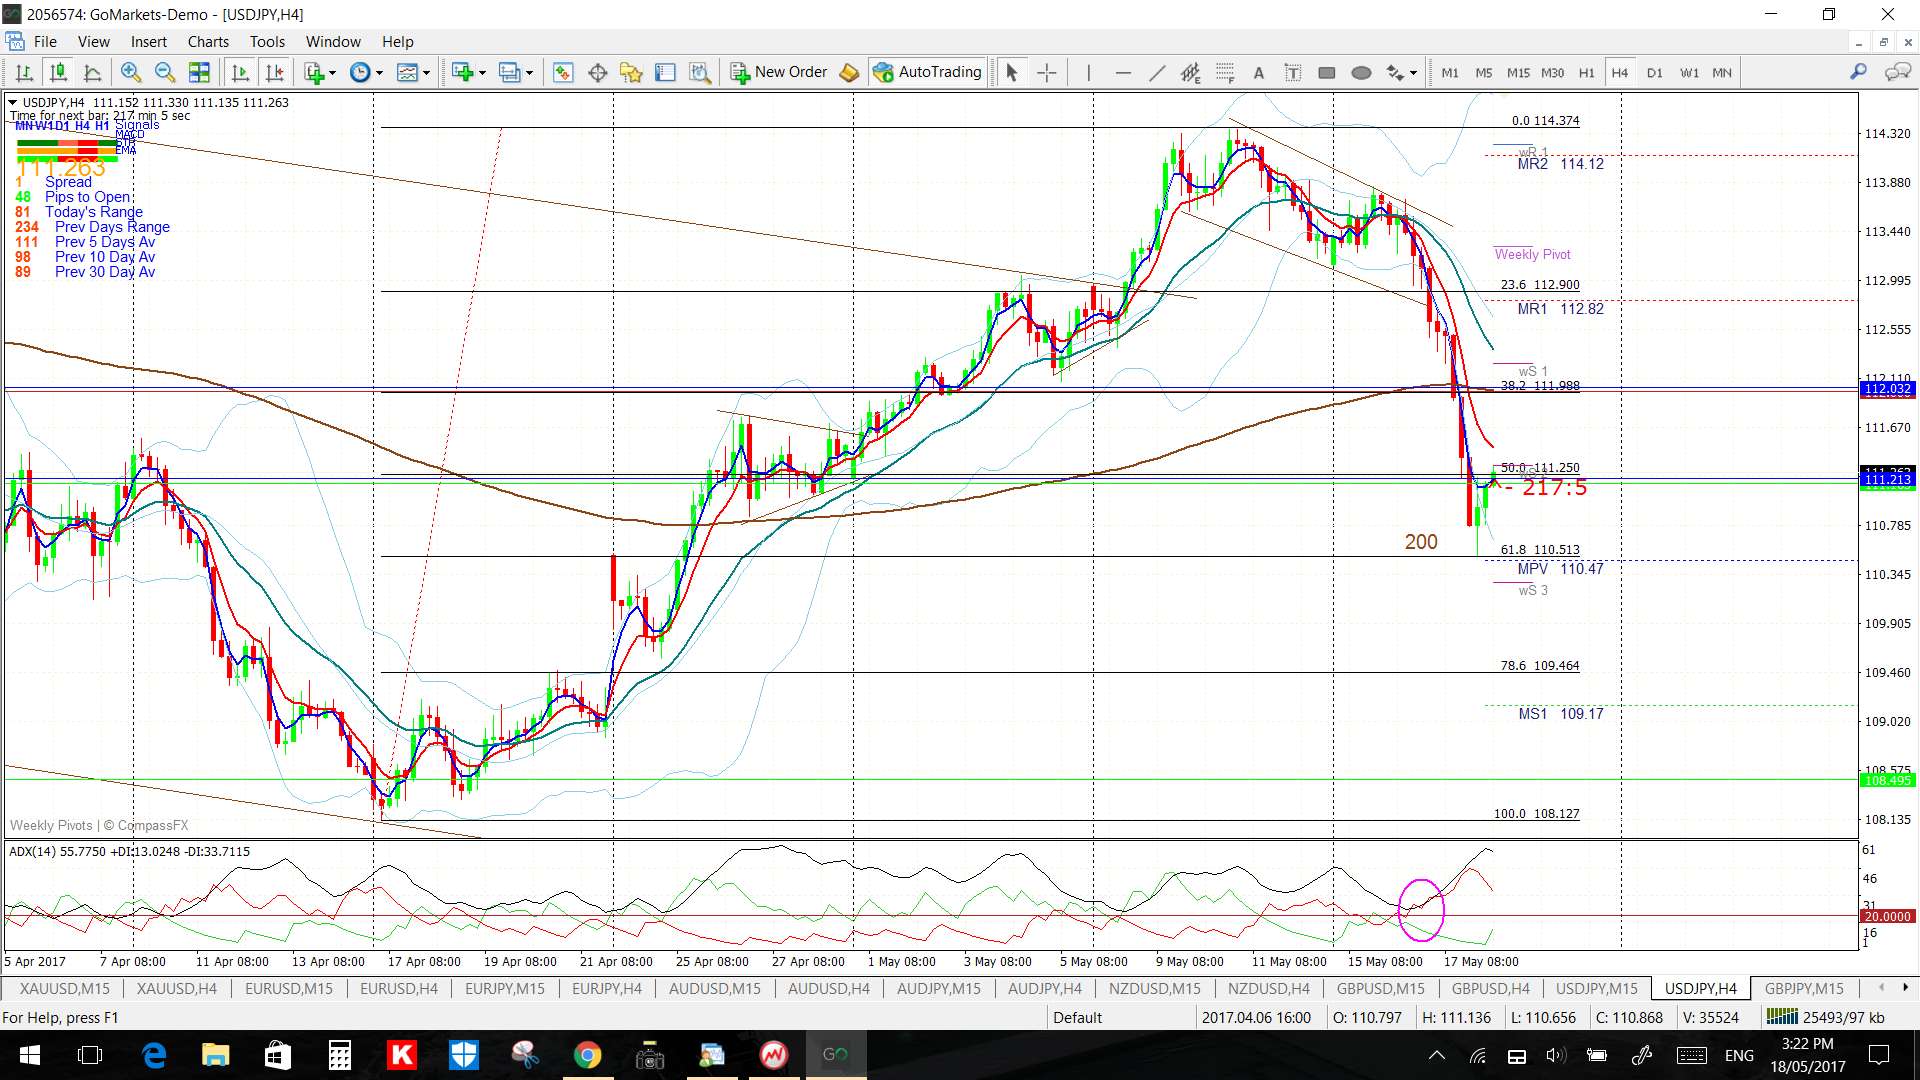
This was the chart showing the breakout move and how the 61.8% Fibonacci did actually act as a target for price action and then offered support:
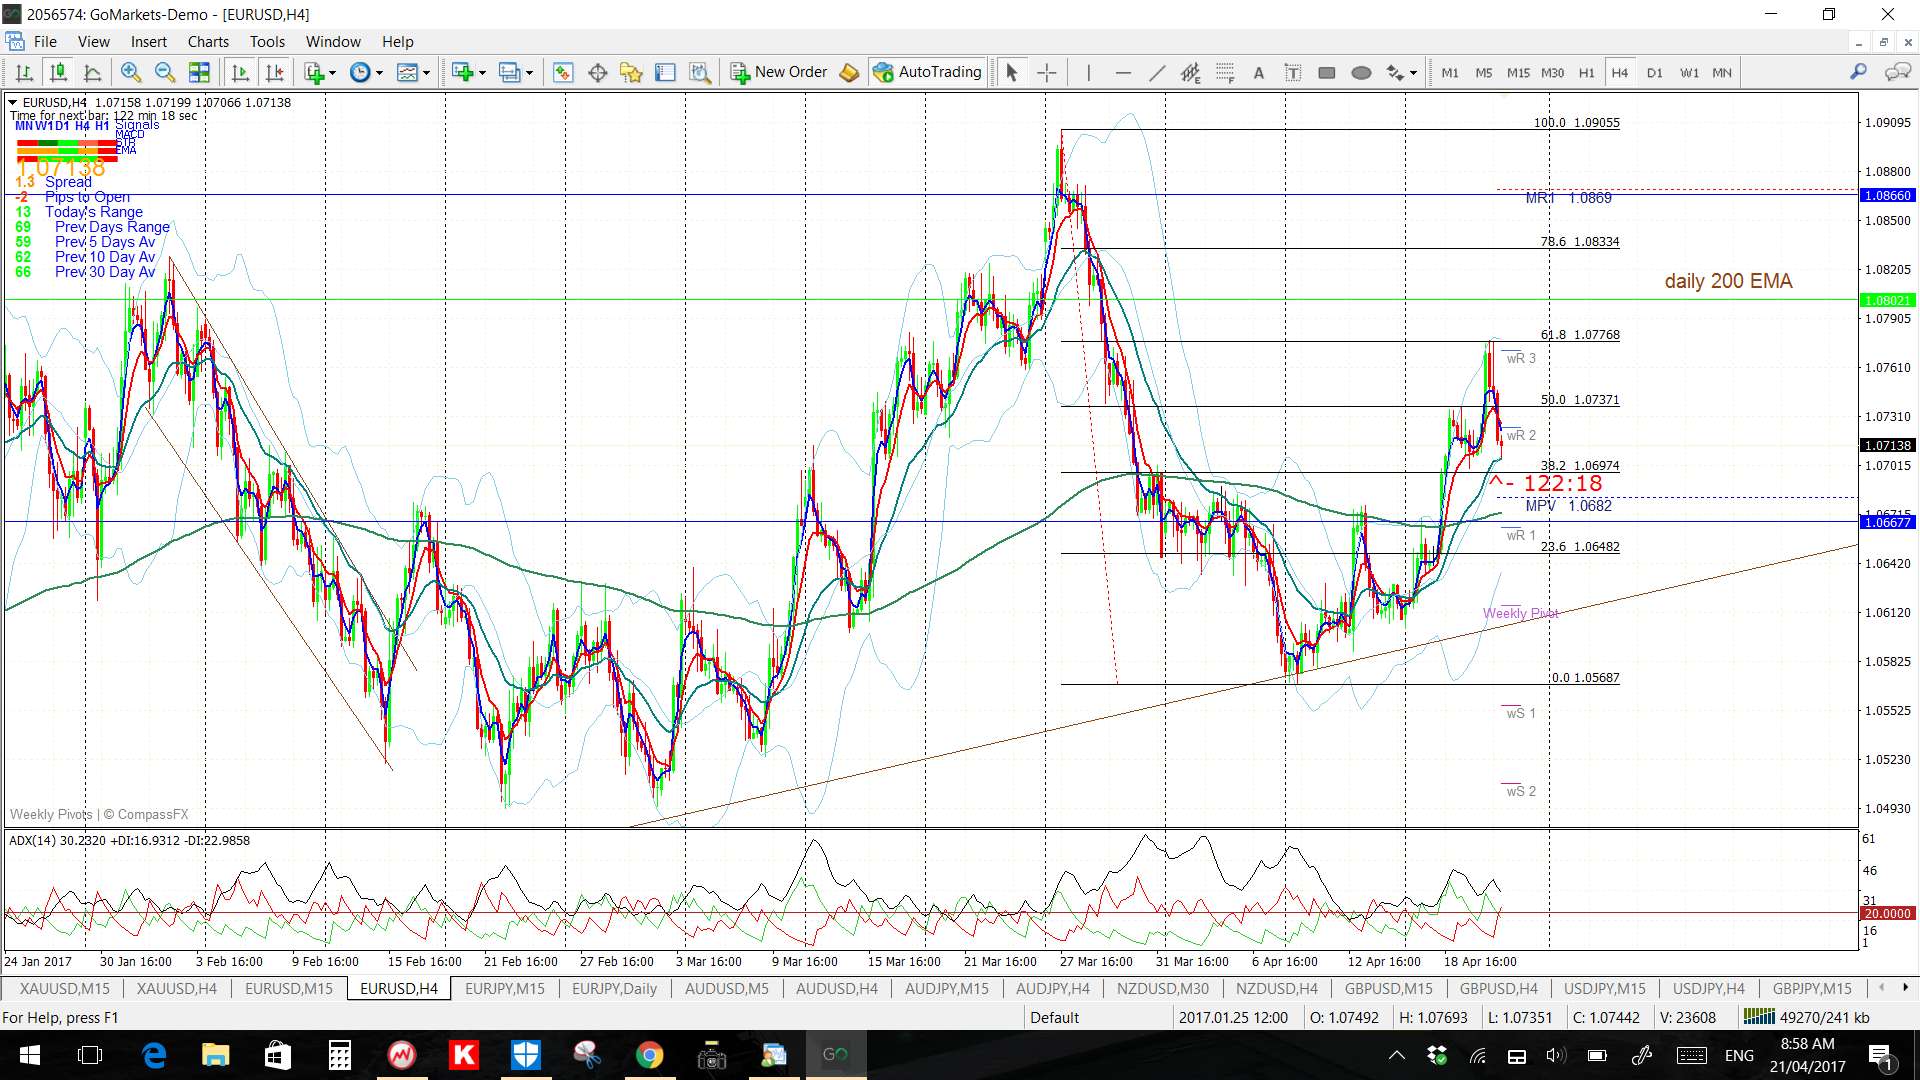
Example: EUR/USD April 2017
The EUR/USD had been ranging in a triangle pattern on the daily chart time frame during April 2017 but note how the ranging activity respected the 61.8% fib during this period:
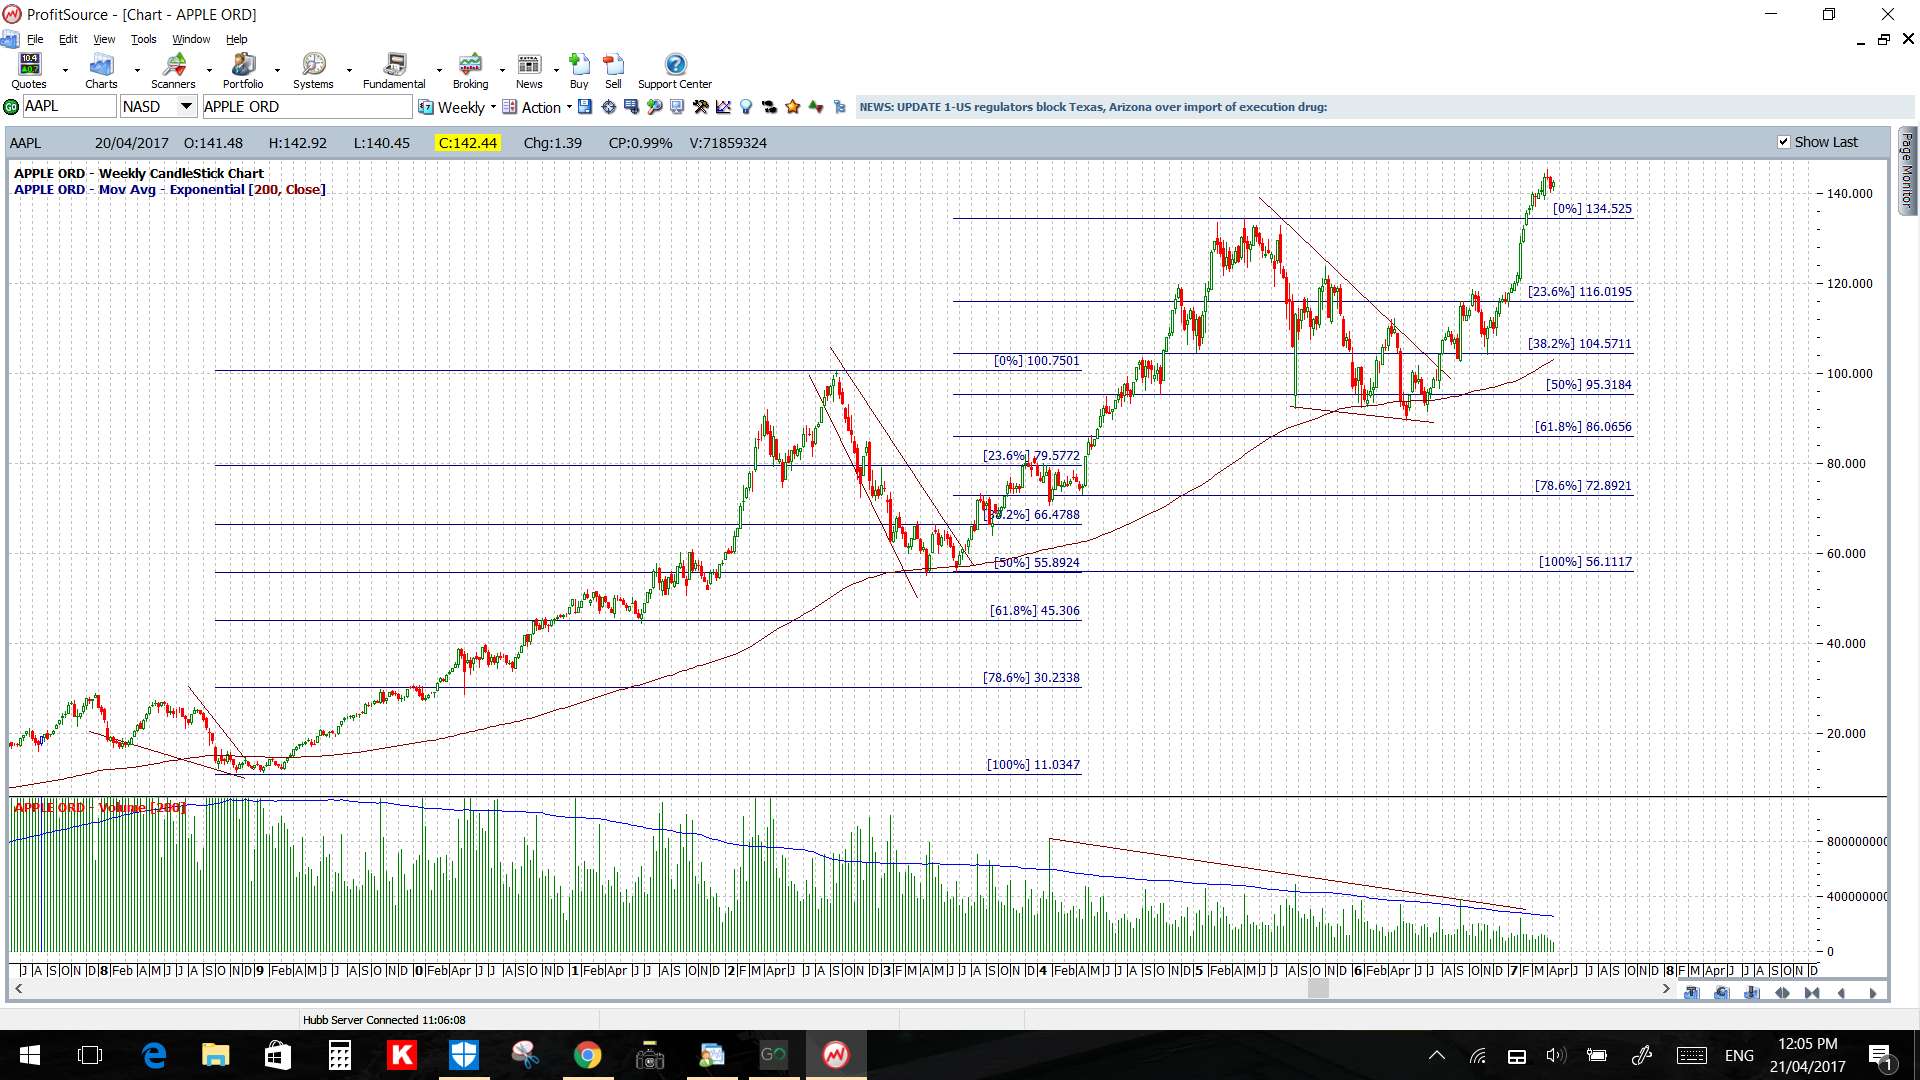
Example: Apple Stock 2017
Apple stock has made a significant recovery off the lows experienced in 2009. Note how the first recovery period was followed by a pullback to the 50% Fibonacci level. The subsequent recovery after this lasted almost two years before it slowed and eventually pulled back. Note how this second pullback also retreated to and respected the 50% Fibonacci level though:
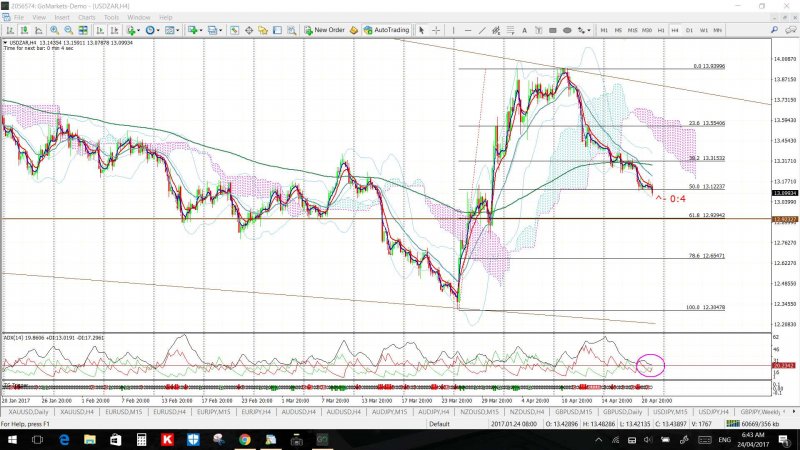
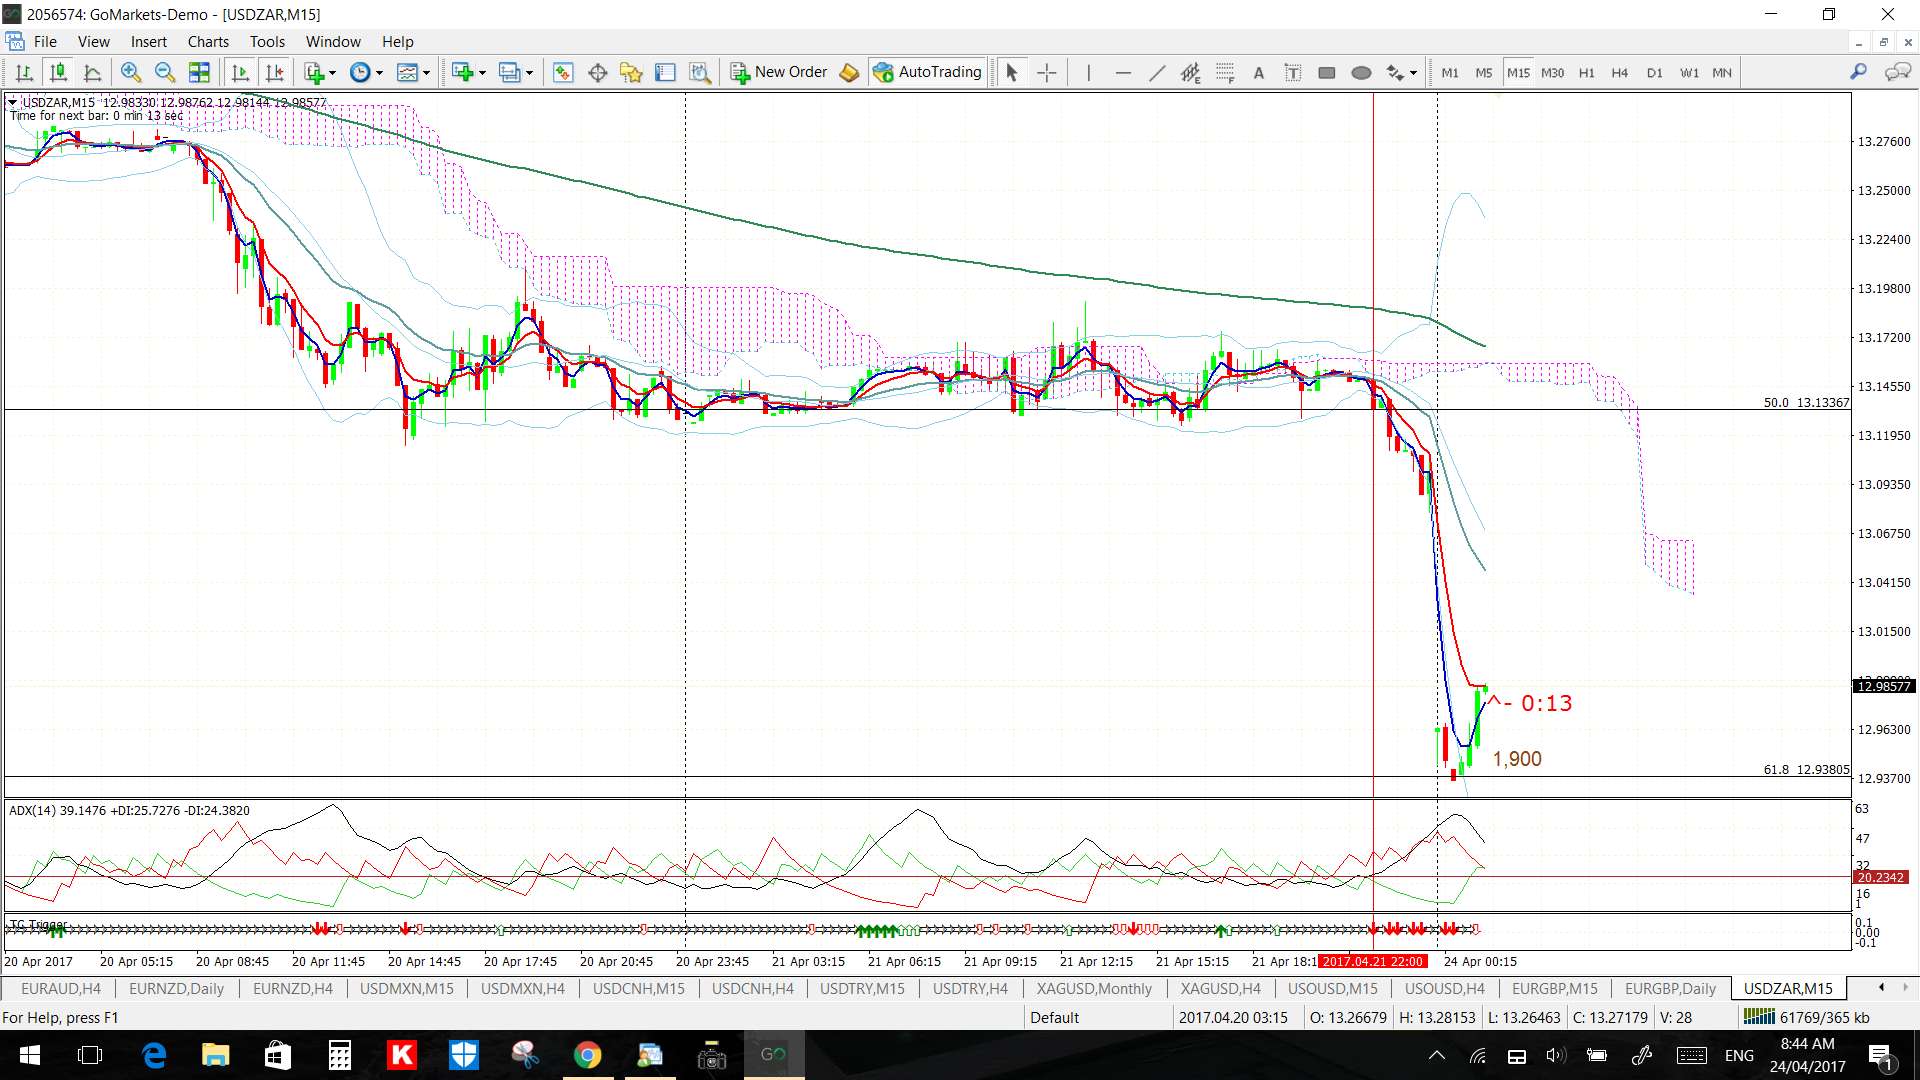
Example: USD/ZAR April 2017.
On Sunday 23rd April I was asked via Twitter about my thoughts on the USD/ZAR and I replied with the following chart noting that the 61.8% fib looked like a good target due to also being a zone of previous S/R:
This exchange of ideas was over the weekend of the French Election and, at market open on Monday 24th, the USD/ZAR had already fallen to test this 61/8% Fib region:
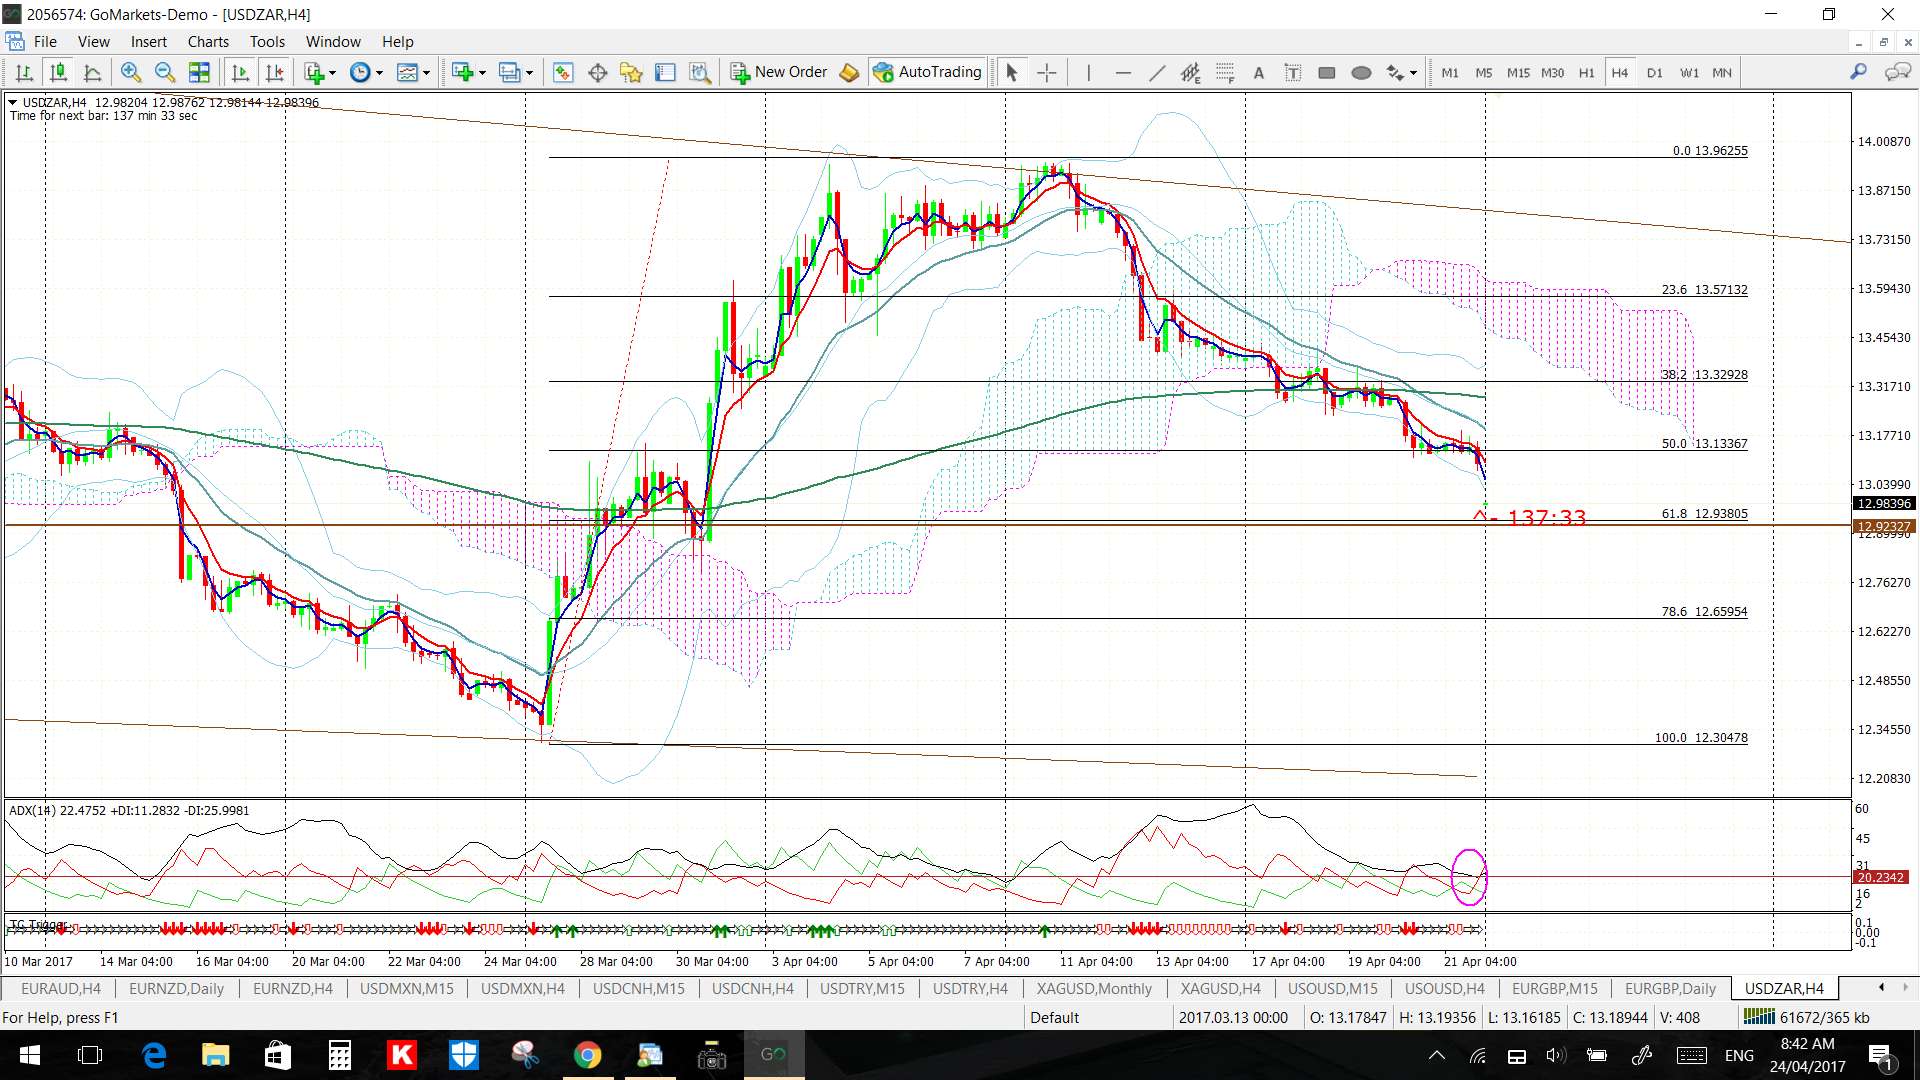
When I dropped down to check the 15 min chart I noticed that there had already been a TC LONG signal that had triggered on the previous Friday; late in the US session. How fortuitous this would have been as the gap at market open ended up giving a SHORT move worth 1,900 pips!
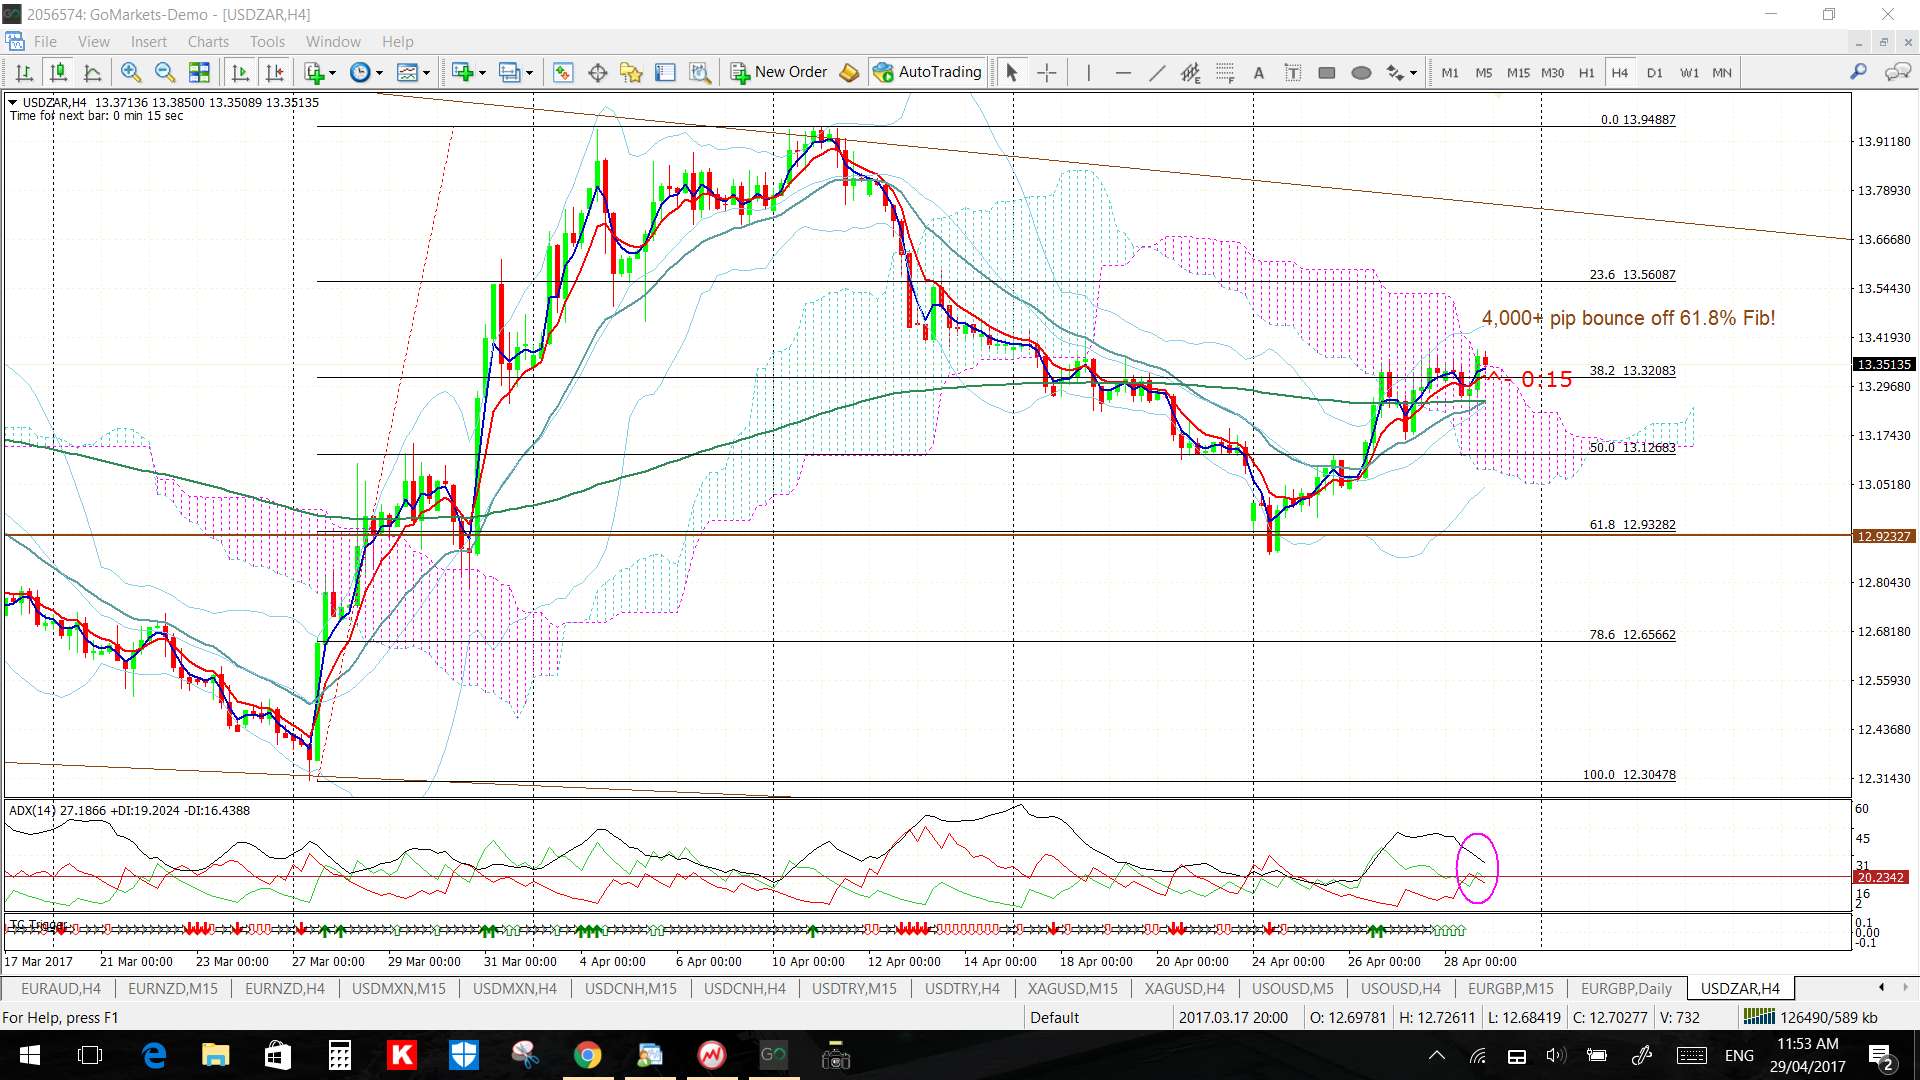
Checking this chart at the end of the week revealed that price action continued to bounce up from this 61.8% Fib region and this move, alone, gave over 4,000 pips:
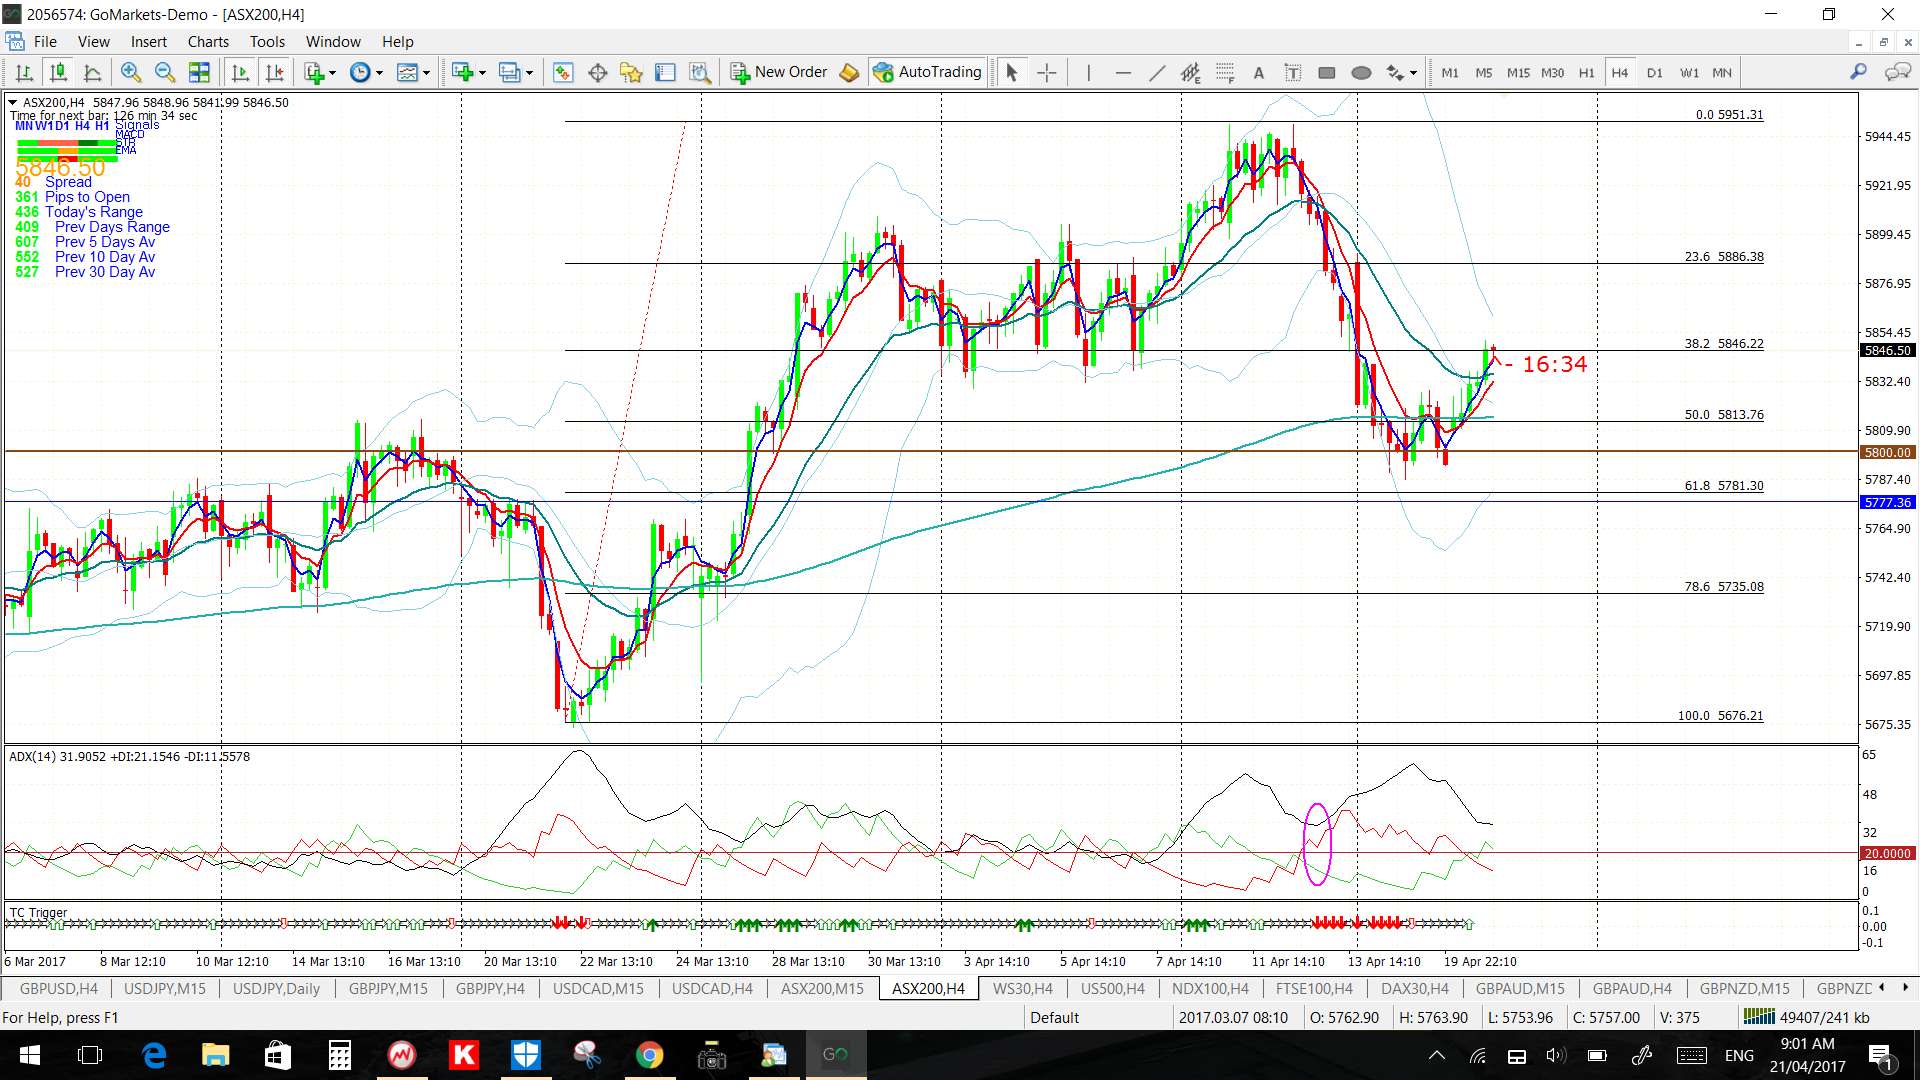
Example: ASX-200 April 2017
Note the respect of the 61.8% fib on the ASX-200 Aussie stock index:
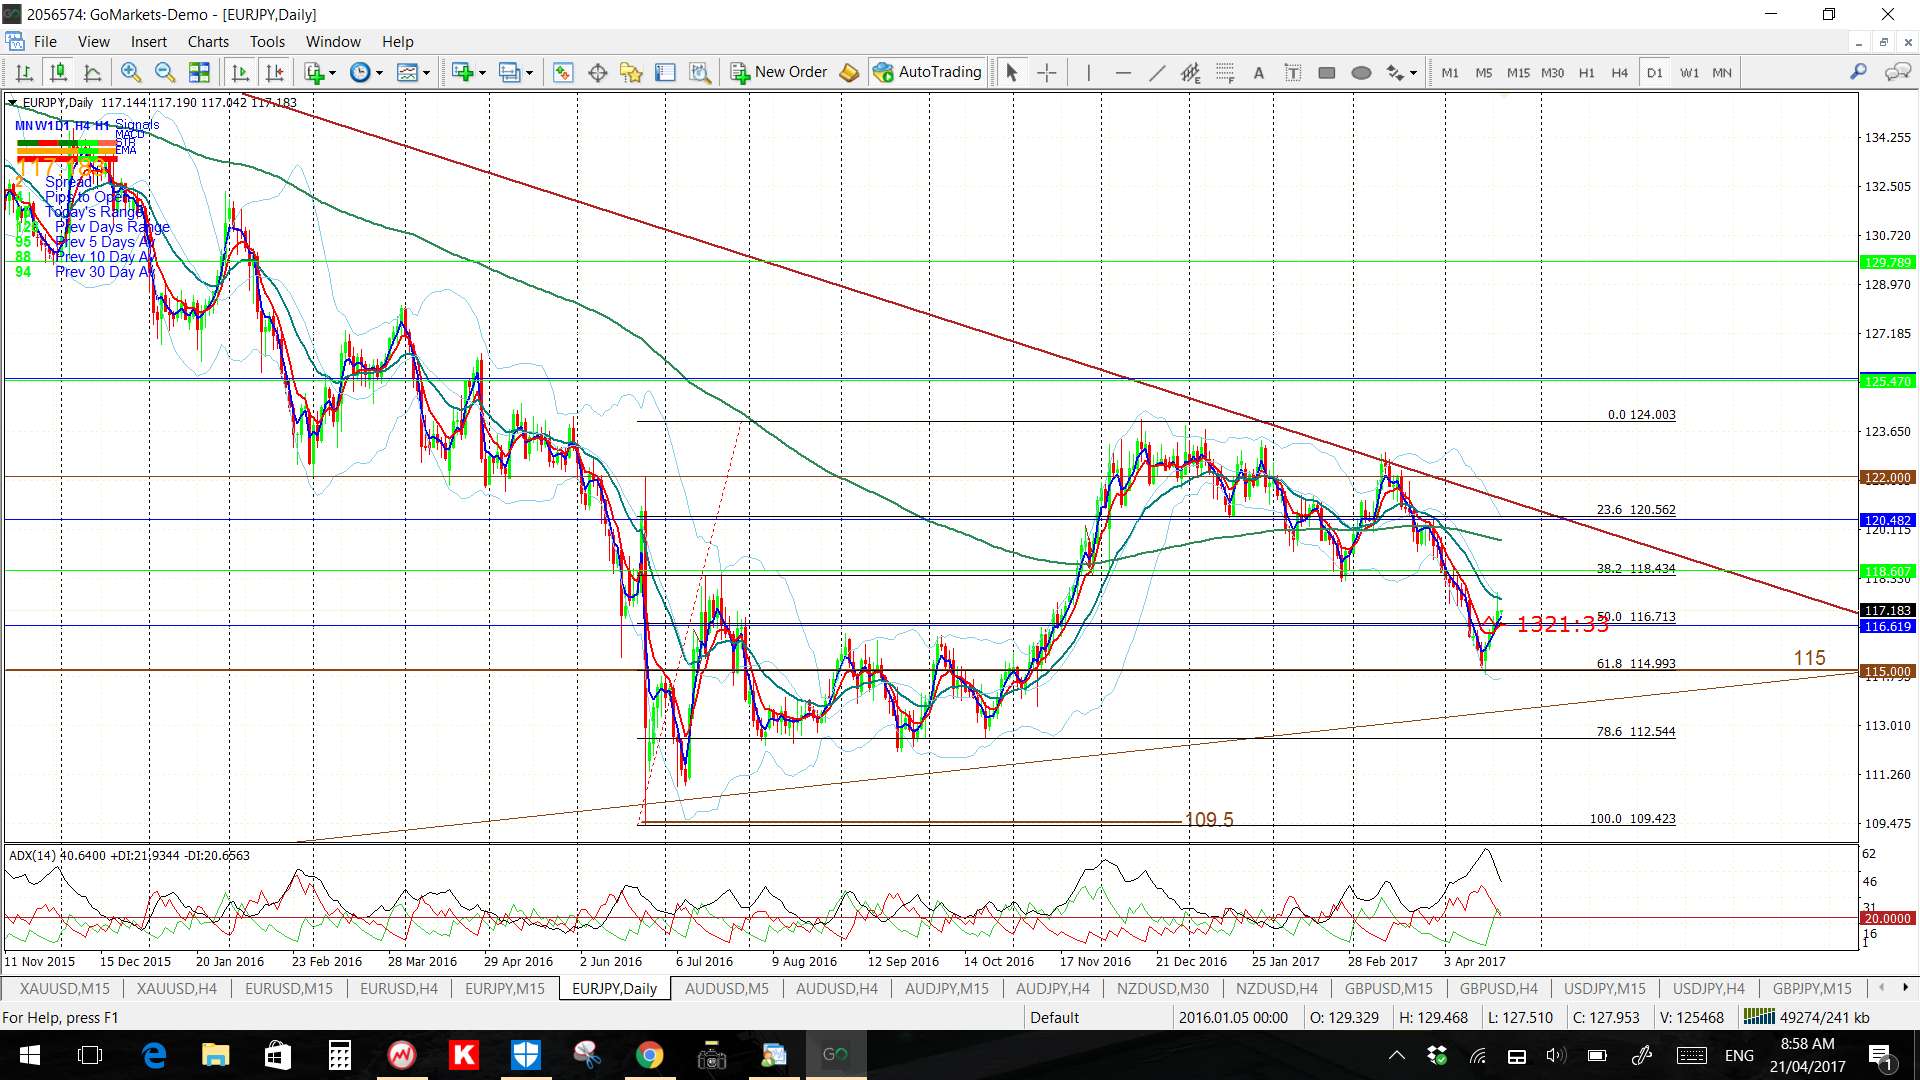
Example: EUR/JPY in April 2017
Note how the EUR/JPY respected the daily chart’s 61.8% fib whilst ranging within a larger triangle pattern:
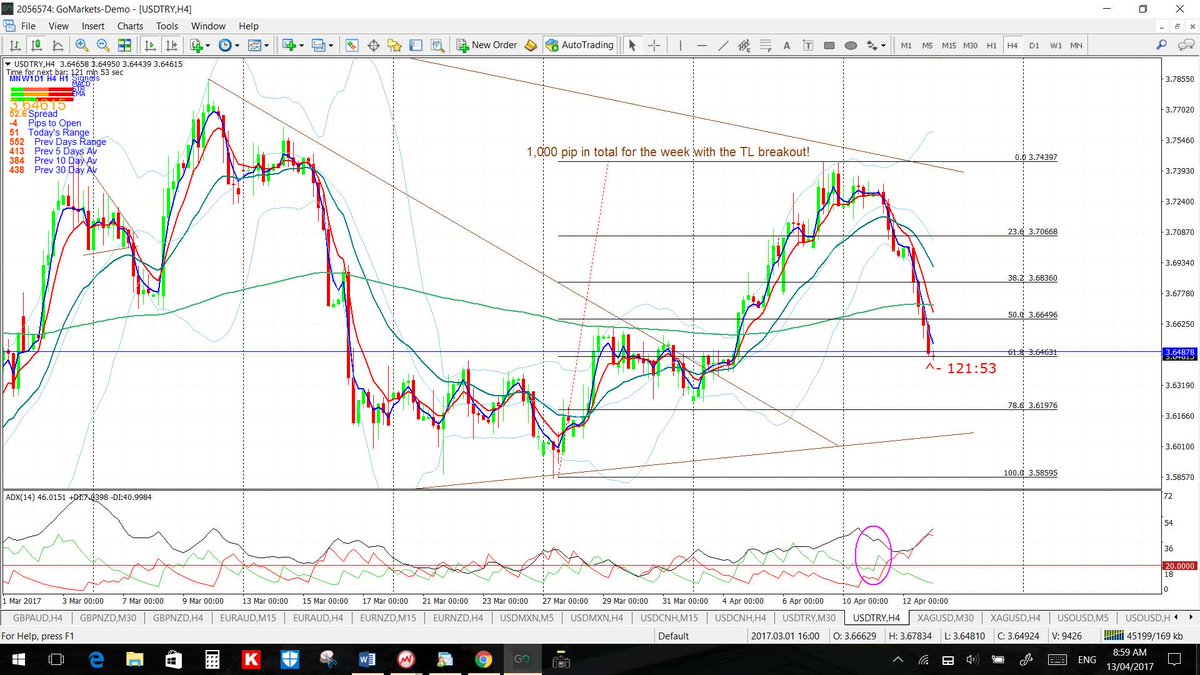
Example: USD/TRY in April 2017
I had warned about the potential for the 61.8% fib to act as support here in a post I wrote on April 13th 2017. Price had retreated from a bear trend line and reached down to the 61.8% Fibonacci level of this recent swing high move as seen in the chart below:
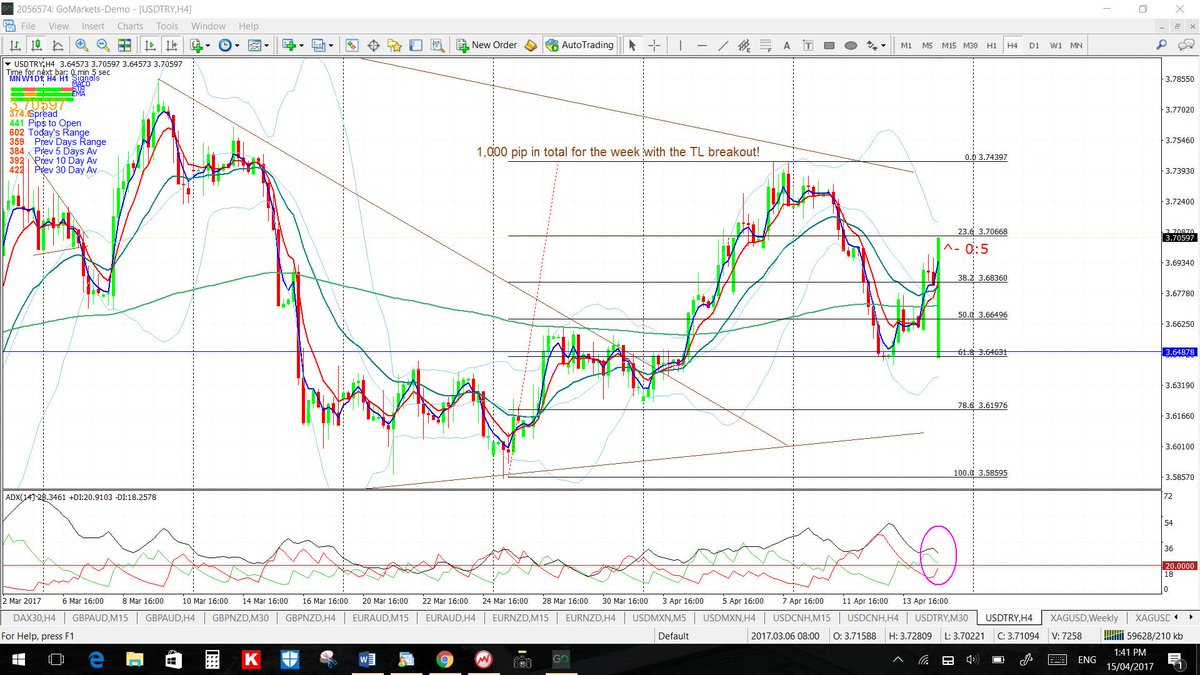
This screen shot was taken the following day and note how the 61.8% Fib level did indeed act as support not once, but twice!
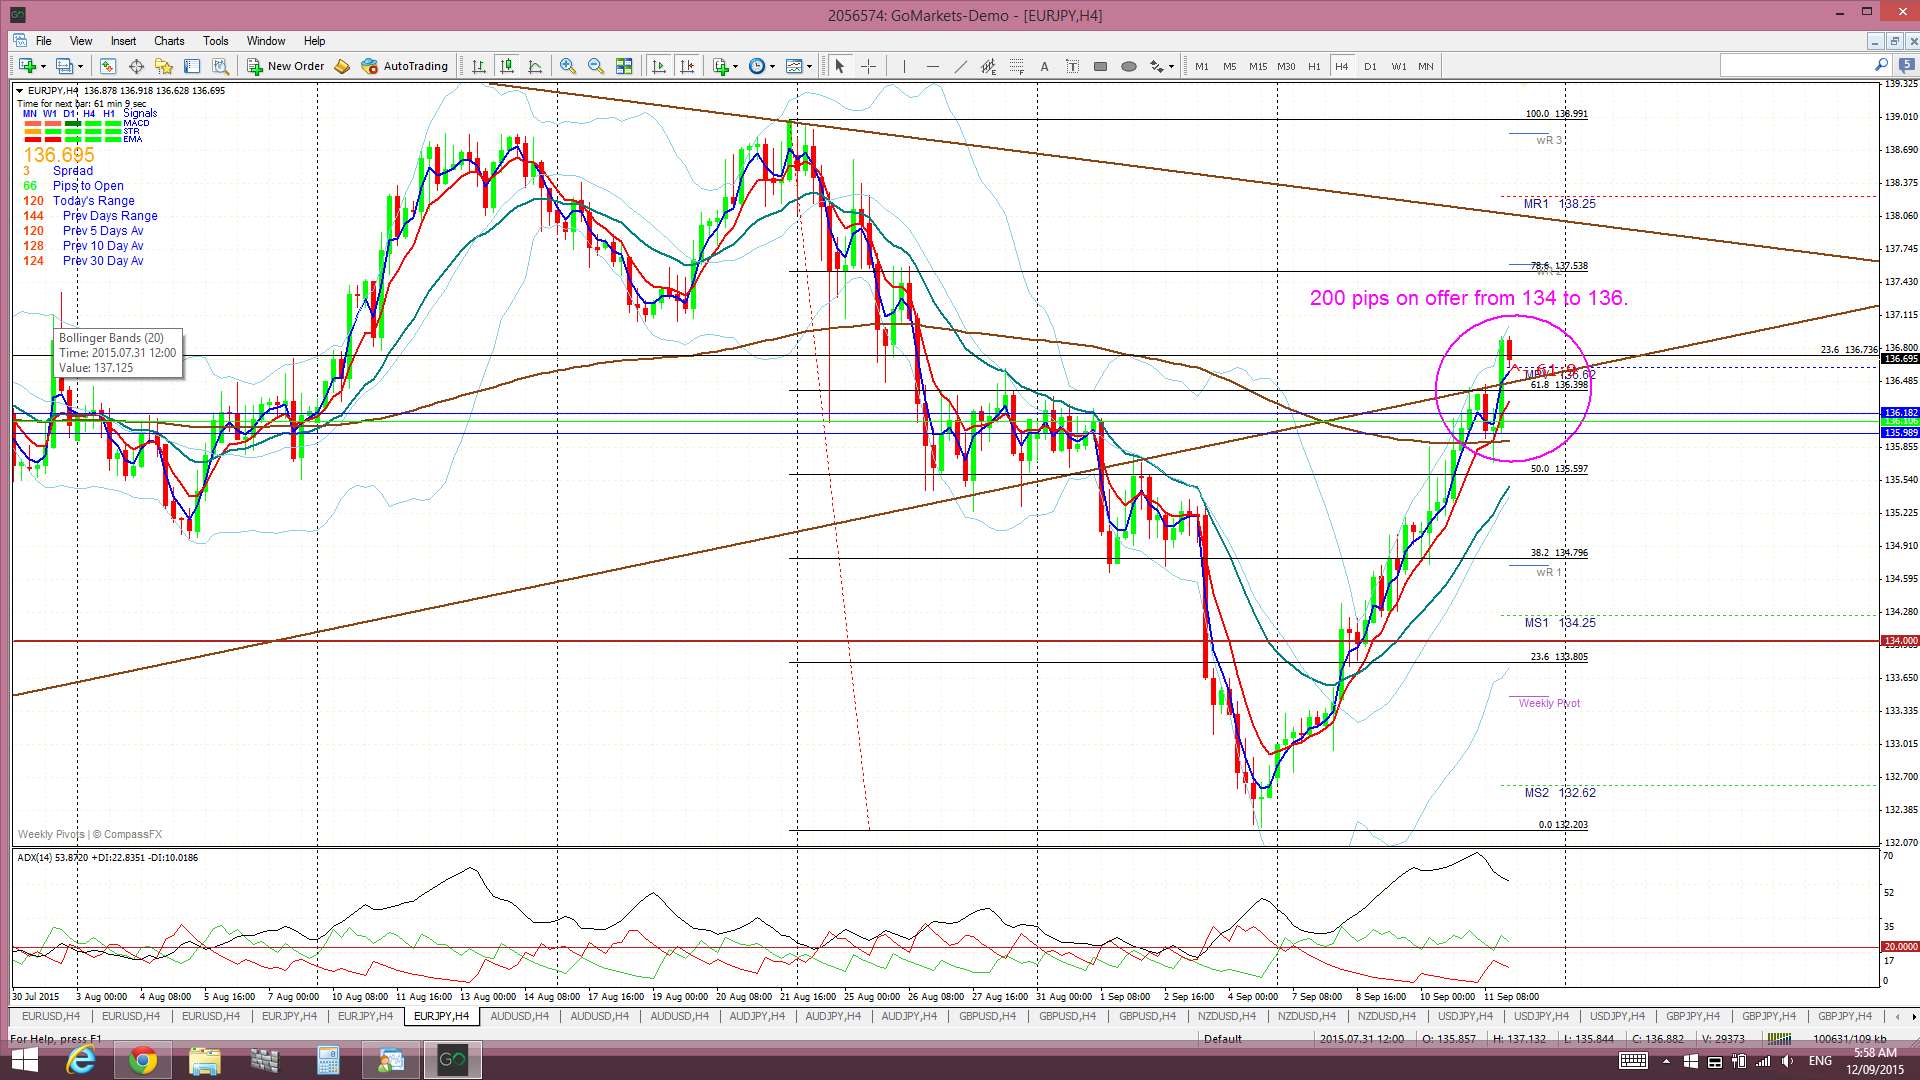
Example: EUR/JPY trade in September 2015
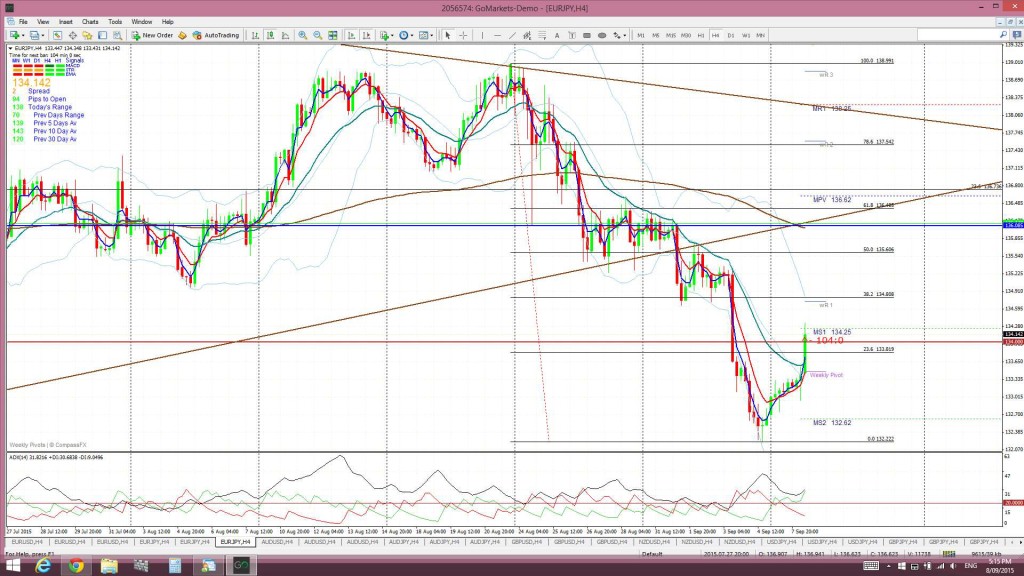
Sept 8th 2015: I wrote an article on Sept 8th suggesting traders watch price action for any close and hold above 134 to possibly target the 136 region as this hugely congested with a number of potential resistance levels. It was the region of the previously broken triangle trend line, the monthly pivot, the 61.8% fib of the recent swing low move and 4hr 200 EMA. This was how the chart appeared at this time:
Sept 11th 2015:
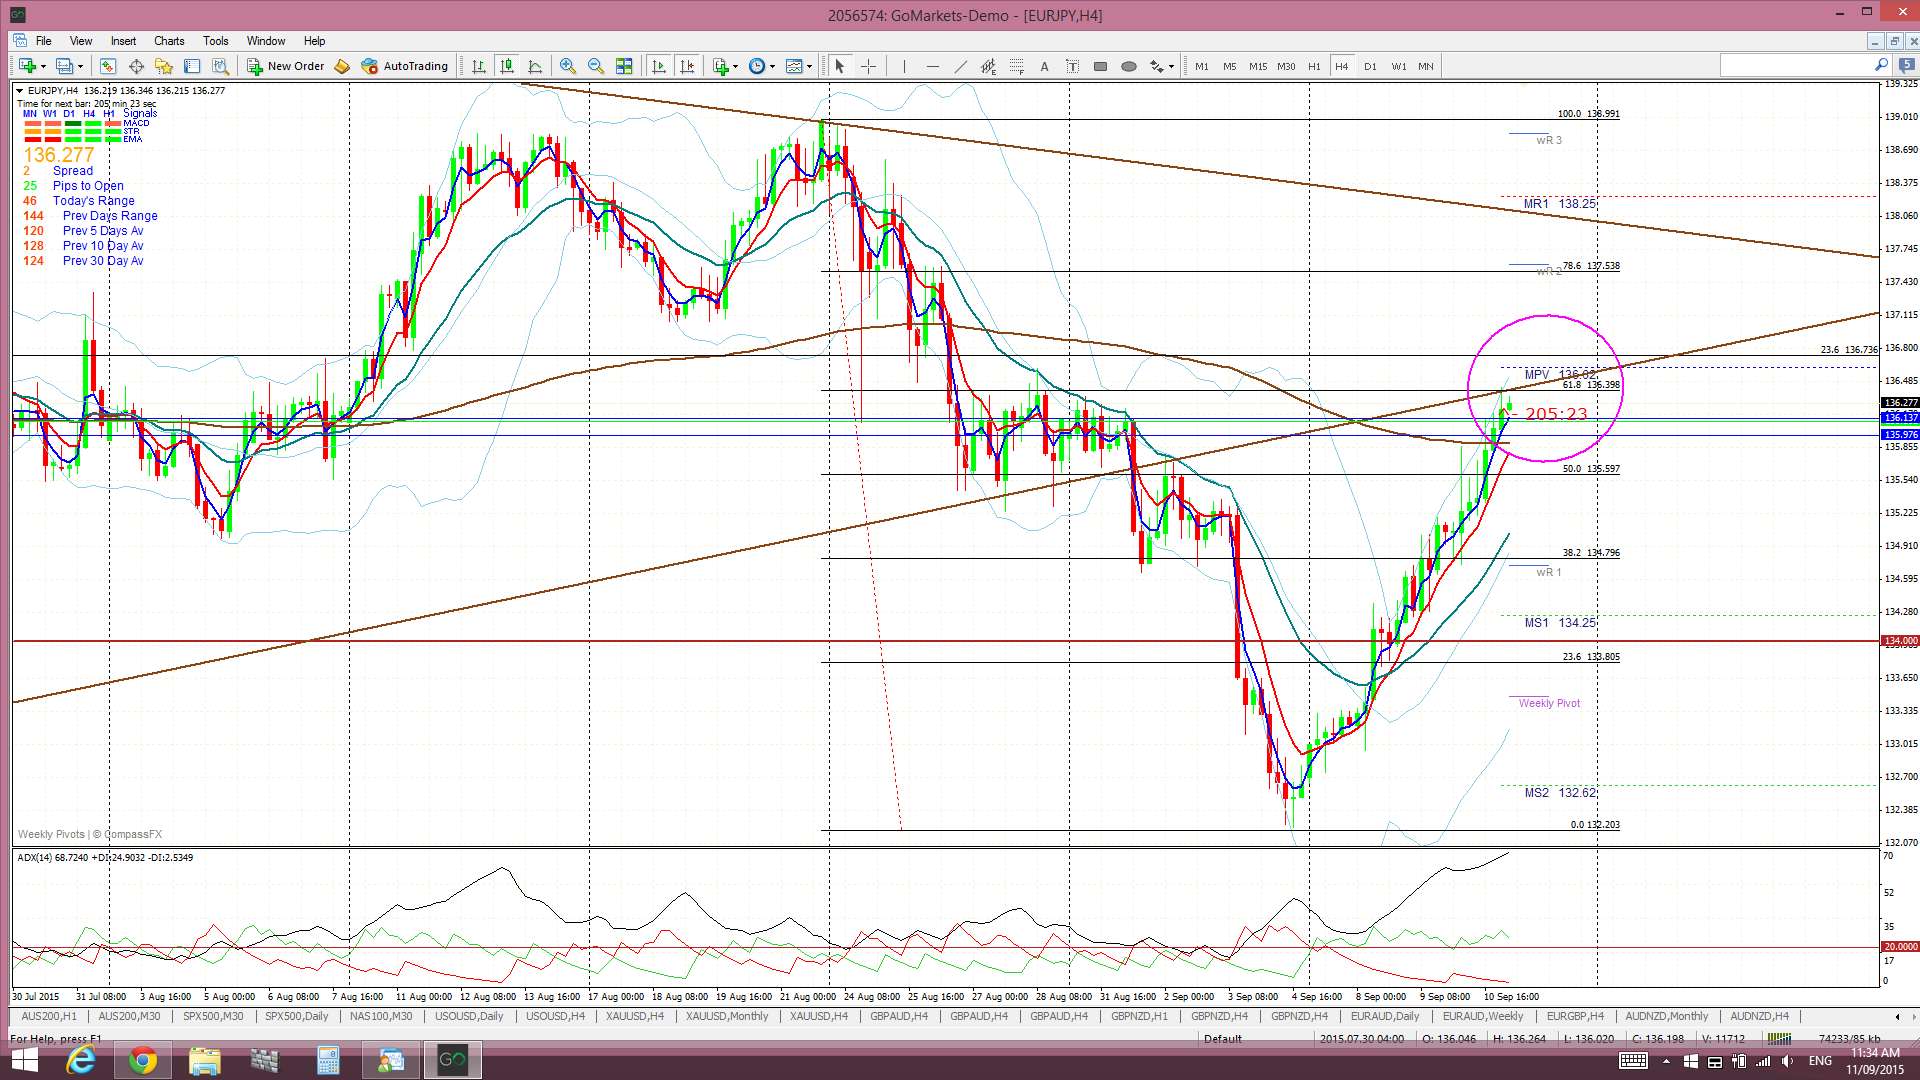
Sat Sept 12th: the target area was reached and offered some resistance but price eventually continued higher. There were 200 pips on offer though in the move from 134 to 136 and even just a section of this move would have been profitable!
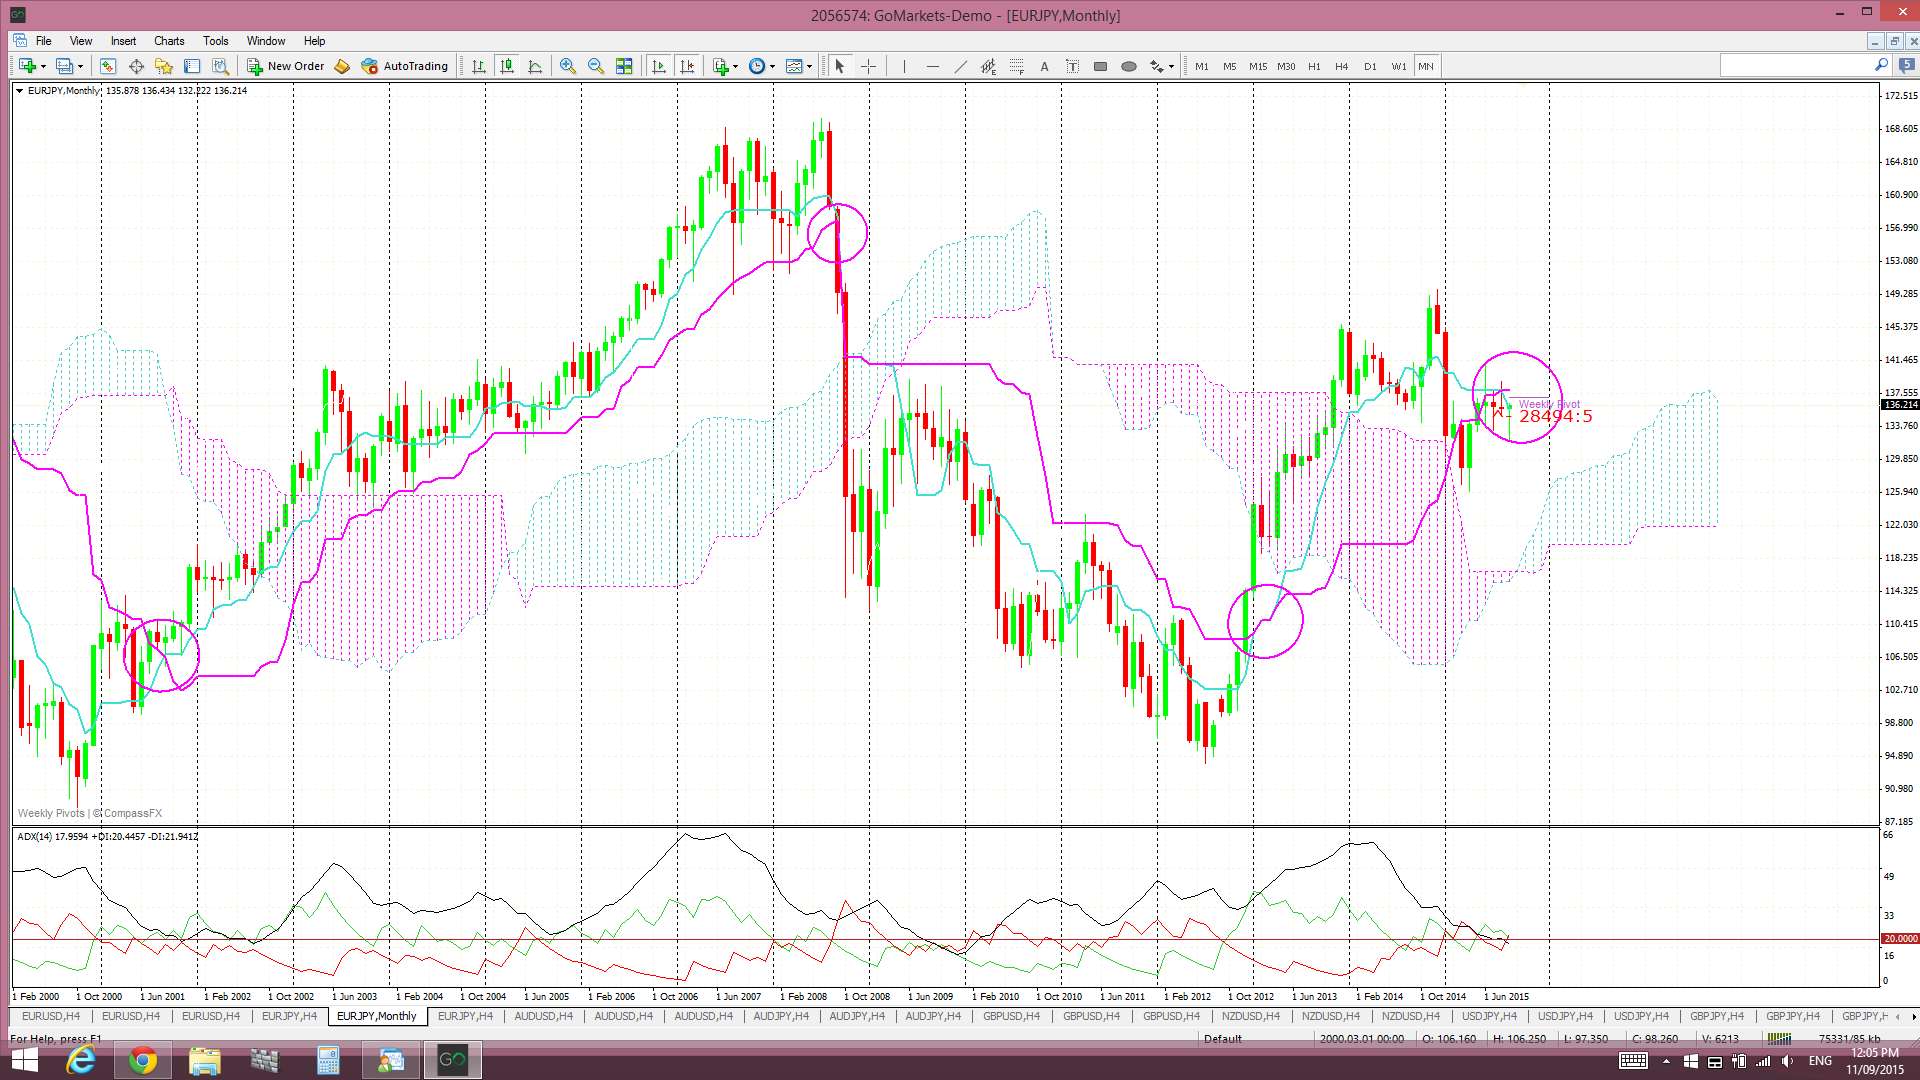
E/J monthly cloud:
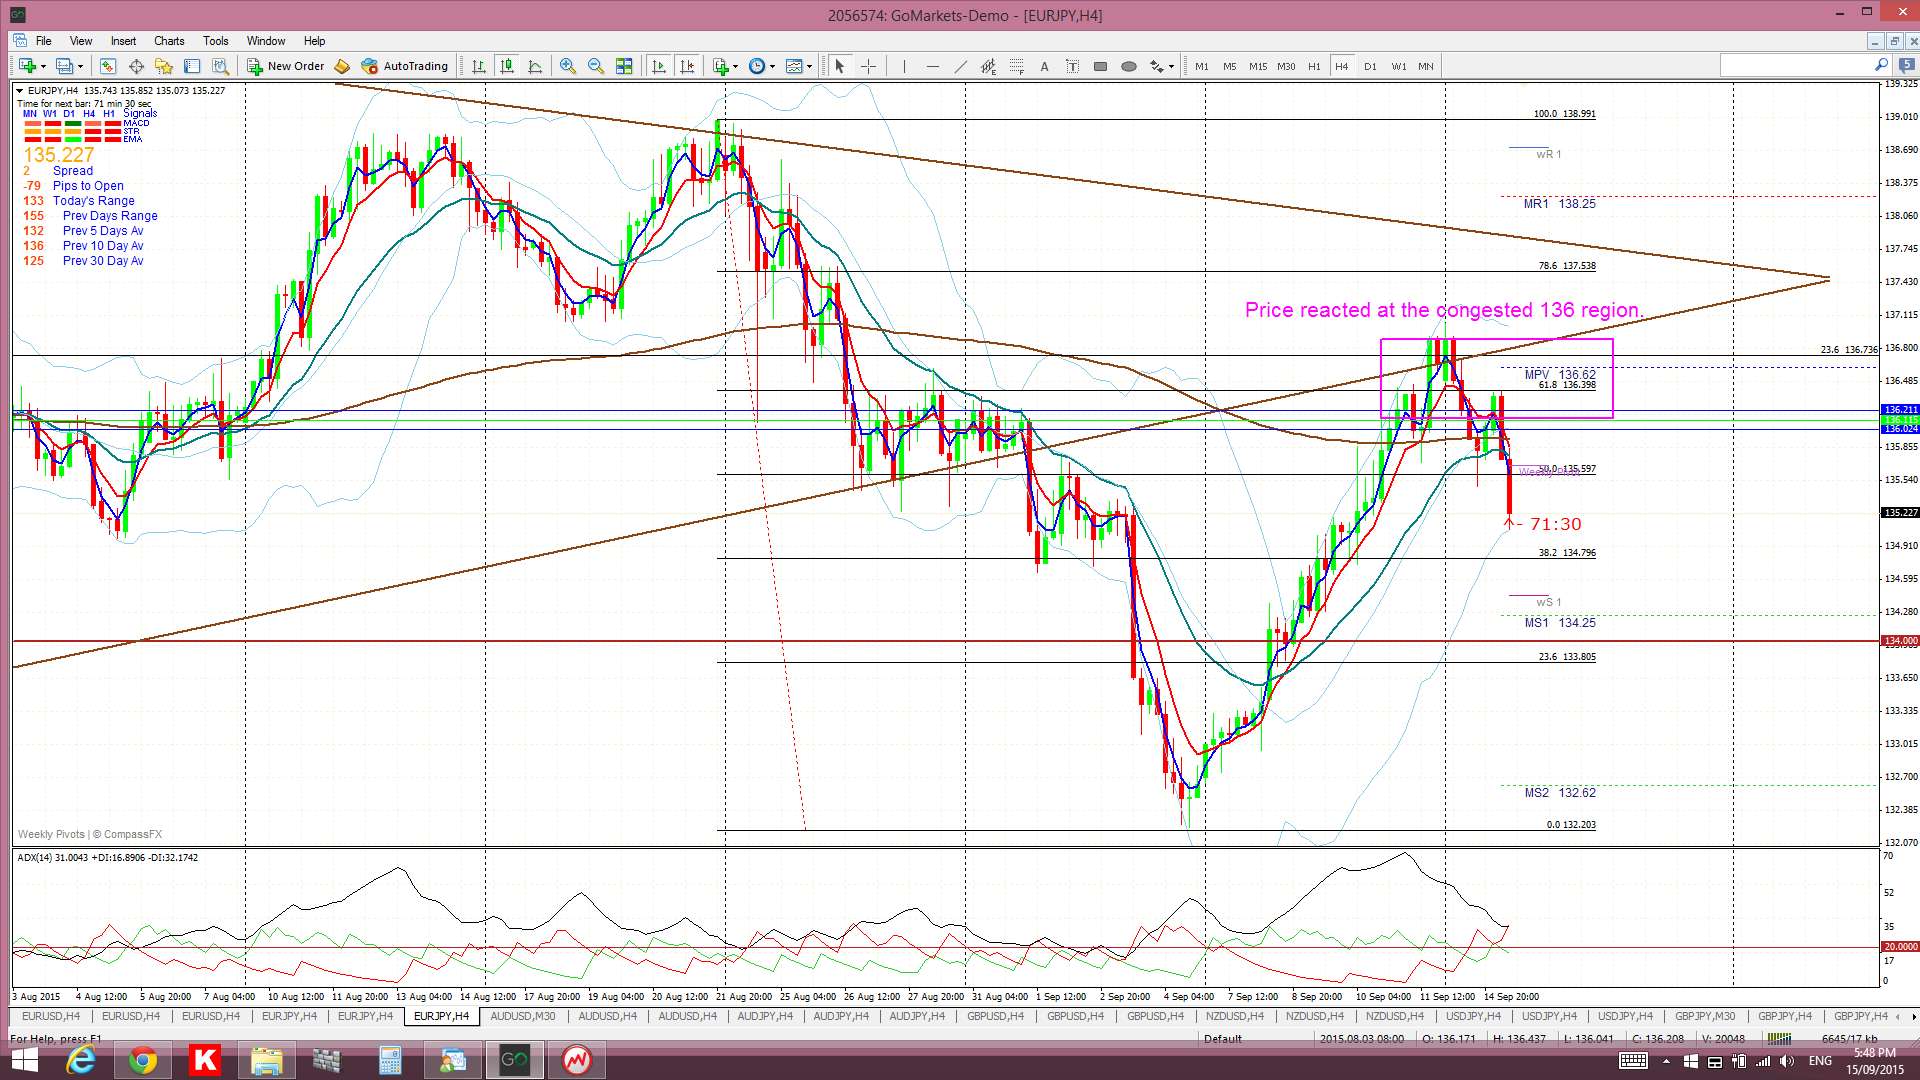
Tue Sept 15th: Price action did eventually react at the congested resistance zone near 136 and pulled back lower:
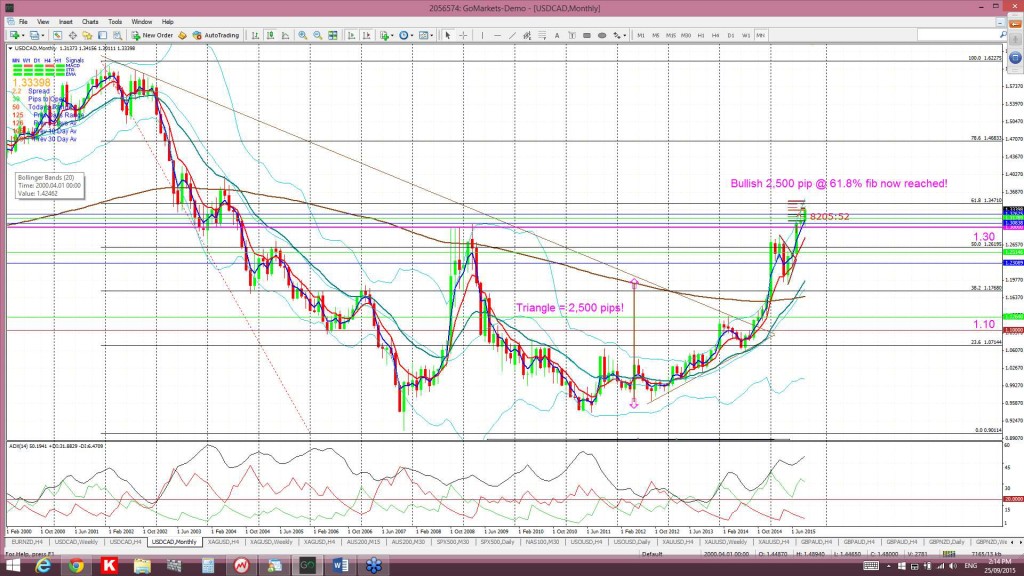
Example: USD/CAD trade September 2014 – 2015:
Yes you read correctly! This trade took over one year to complete but, in doing so, delivered over 2,500 pips! I noted a monthly chart triangle pattern back in September 2014 and the post with this chart and description can be found through the following link. A copy of how the chart appeared back then is copied below:
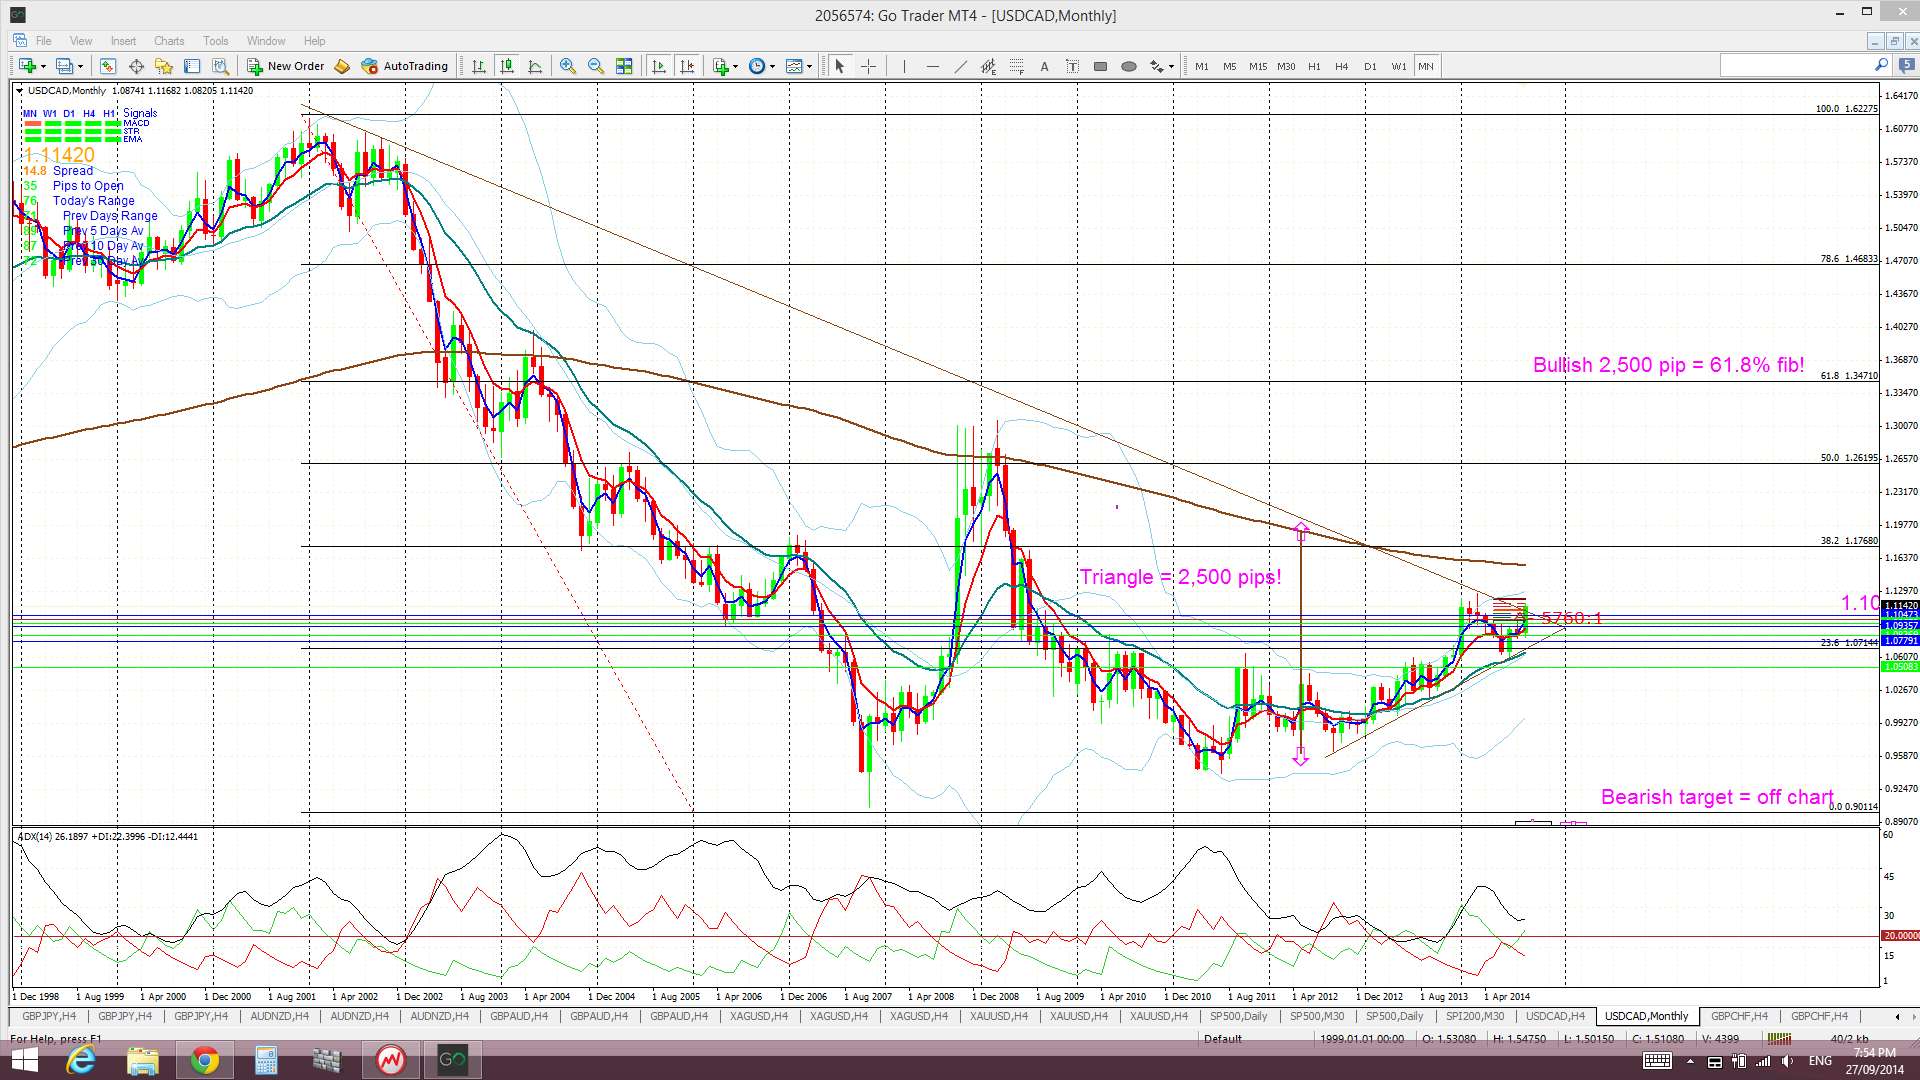
In this post article I explained that, whilst I was looking for a triangle breakout trade, the confluence came from the fact that the triangle breakout target overlapped with the monthly chart’s 61.8% fib of the major 2002-2007 swing low move. It was here that I suggested the target for any breakout move would be worth 2,500 pips and would be at this 61.8% Fibonacci level.
This trade completed with the full 2,500 pip move right up to this 61.8% fib target in September 2015 and was described in a post found through this link. The chart from that post is copied below:
The benefit of the 61.8% Fibonacci level did not end there though. I had warned that any Fibonacci pullback might target the previous S/R level down near 1.30 and this would have been a move worth over 400 pips. This 61.8% Fib pullback move to the 1.30 level evolved, to the pip, on October 10th and the chart showing this move is copied below:
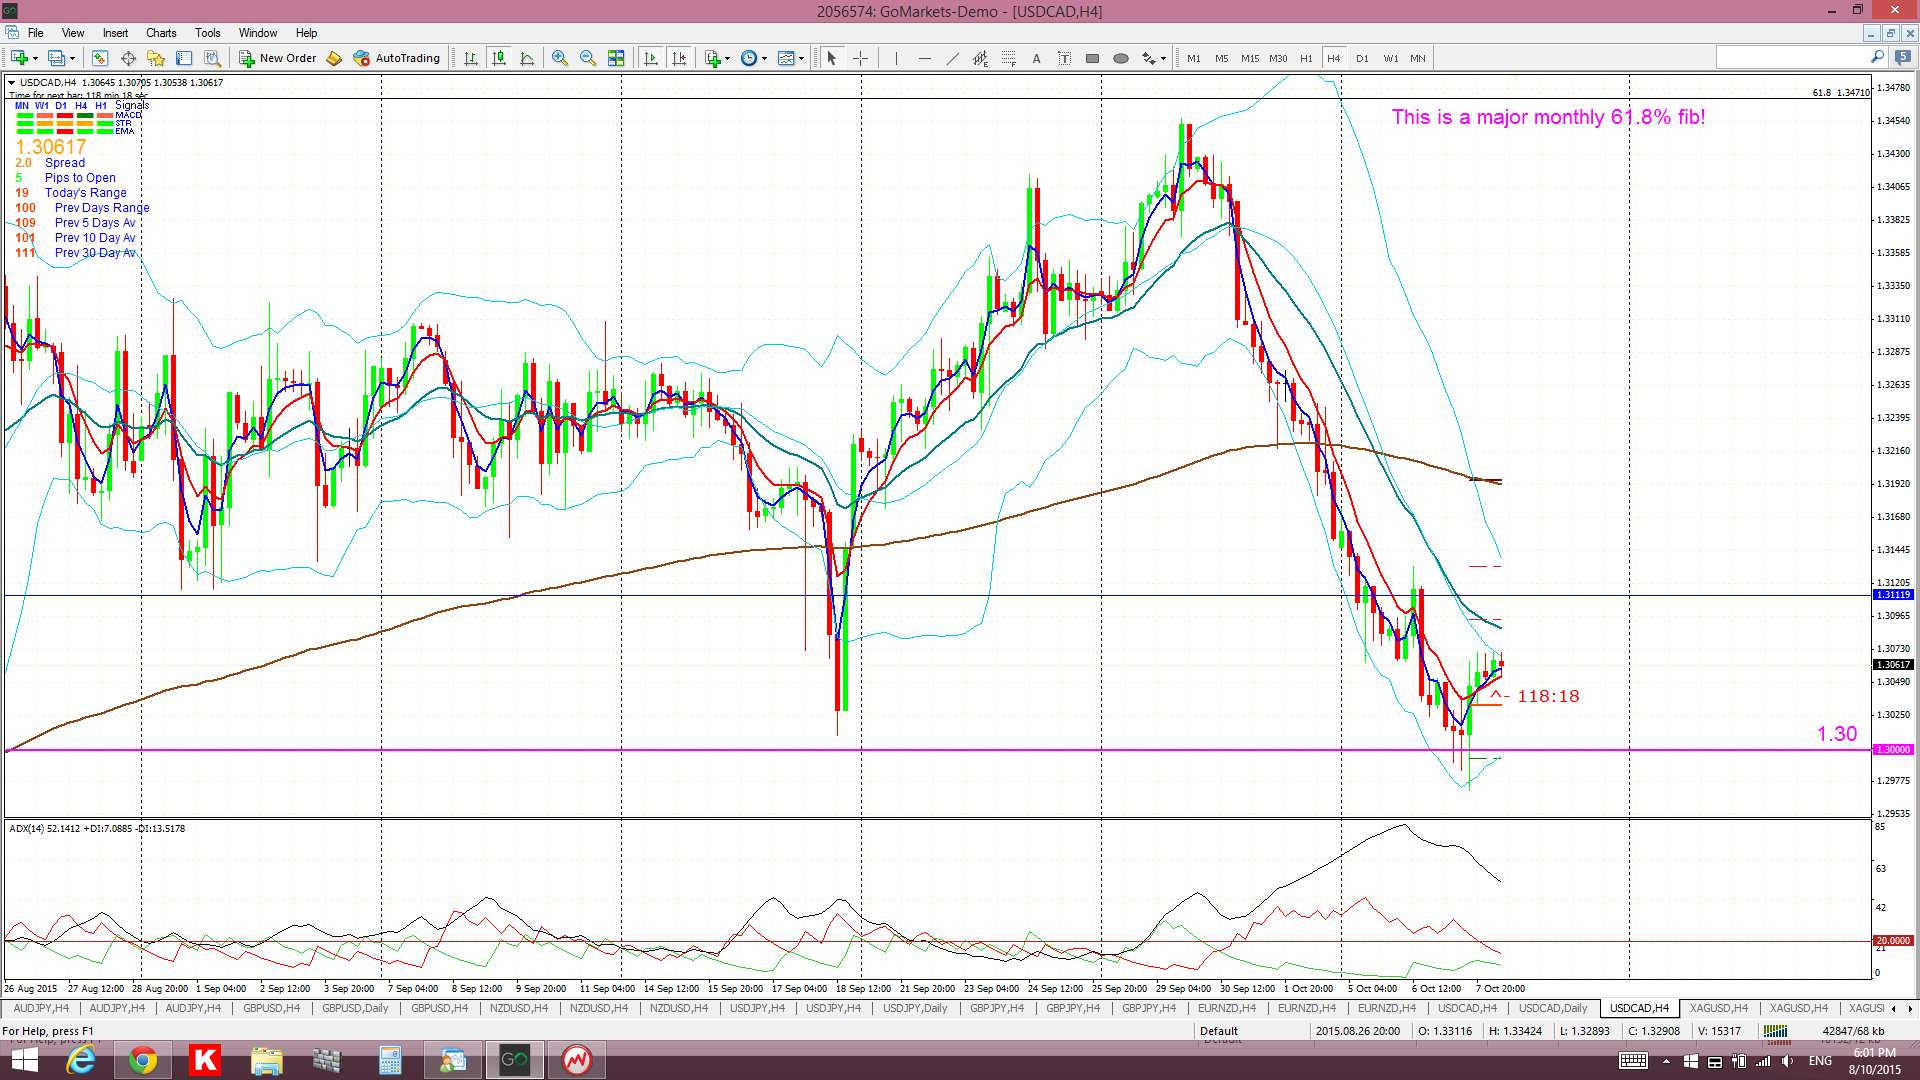
Thus, this 61.8% fib level enabled a 2,500 pip move upwards and then a 400 pip move down to test 1.30 for a total of 2,900 pips!
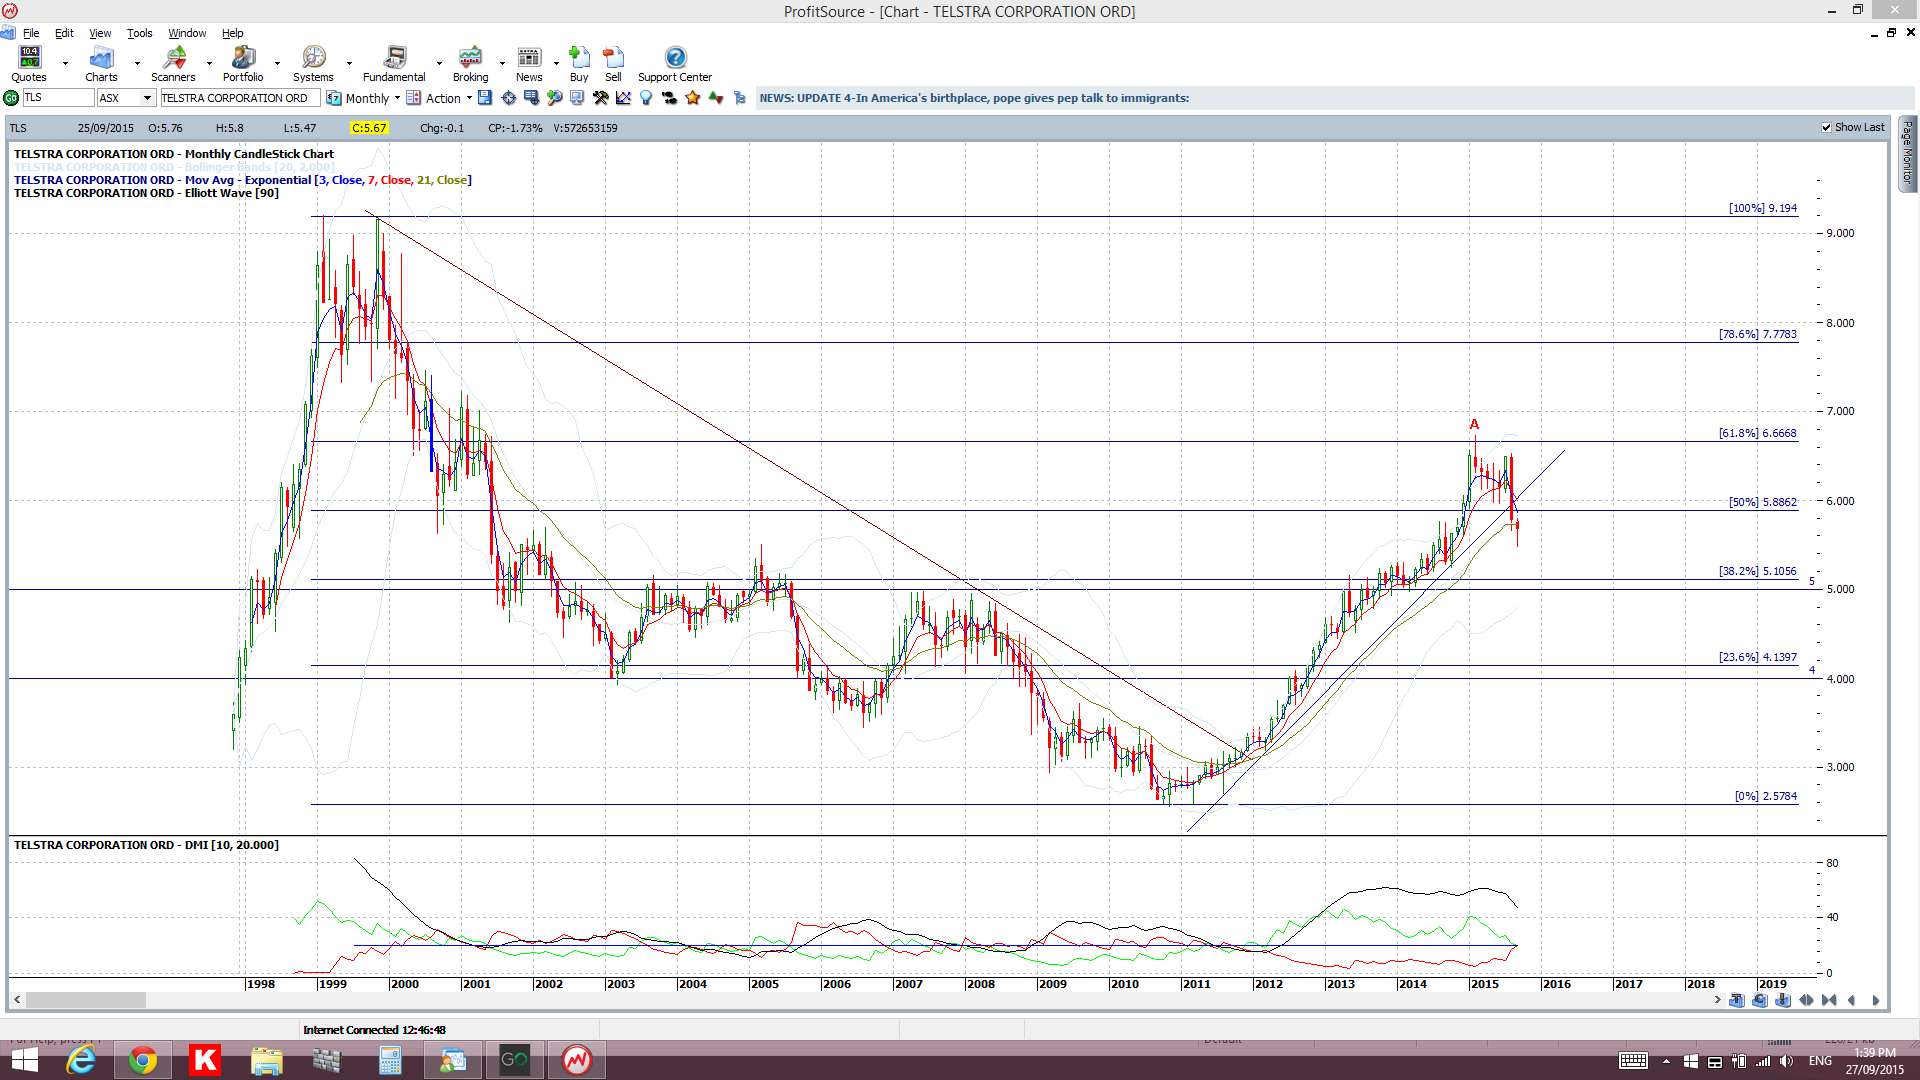
Example: Telstra TLS, an ASX stock September 2015:
Stocks often display a similar respect of Fibonacci and the larger traded stocks even more-so. Telstra is a popularly traded Aussie stock and is quite liquid with volumes around 5 million per day. This recently put in a high right on the 61.8% fib level:
TLS monthly: respecting the 61.8% fib level:
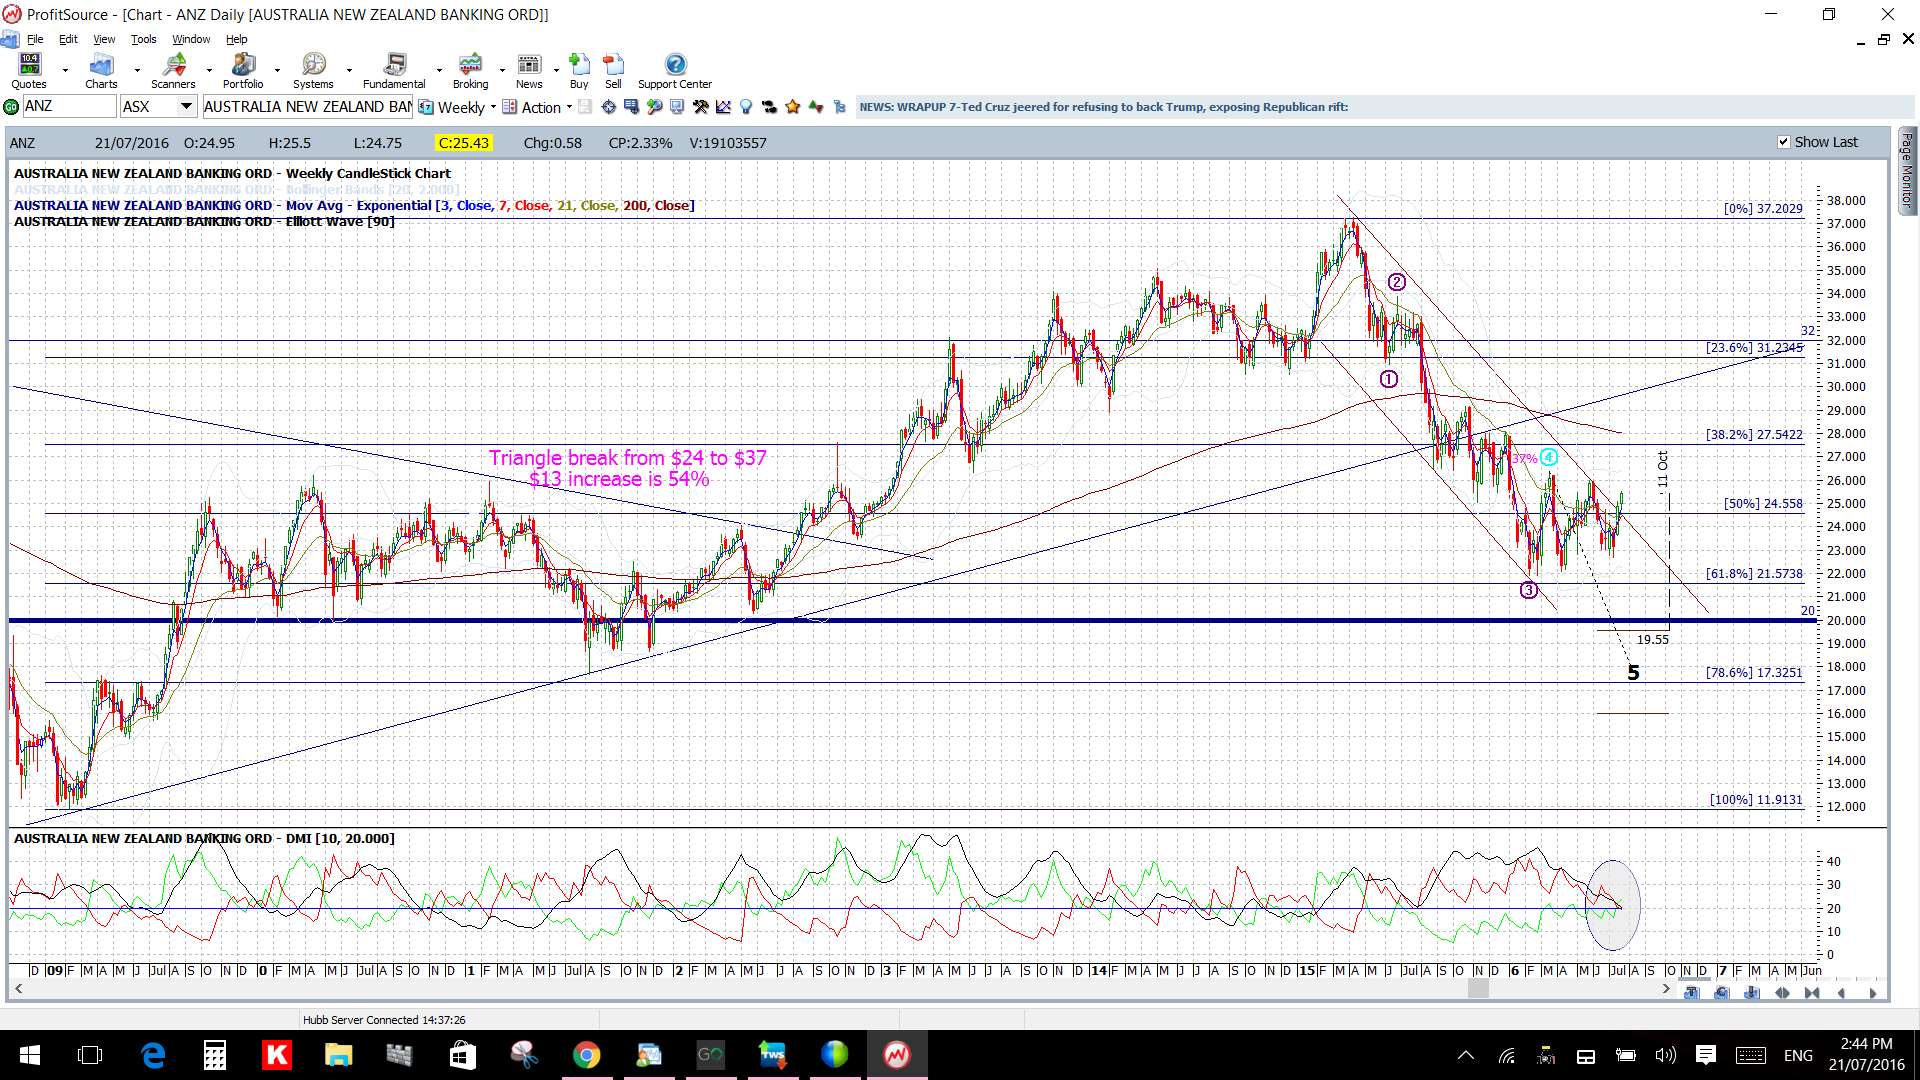
Example: ANZ, an ASX stock; April 2017.
ANZ Bank has struggled for the last few weeks at the 61.8% Fibonacci level of the recent swing low move:
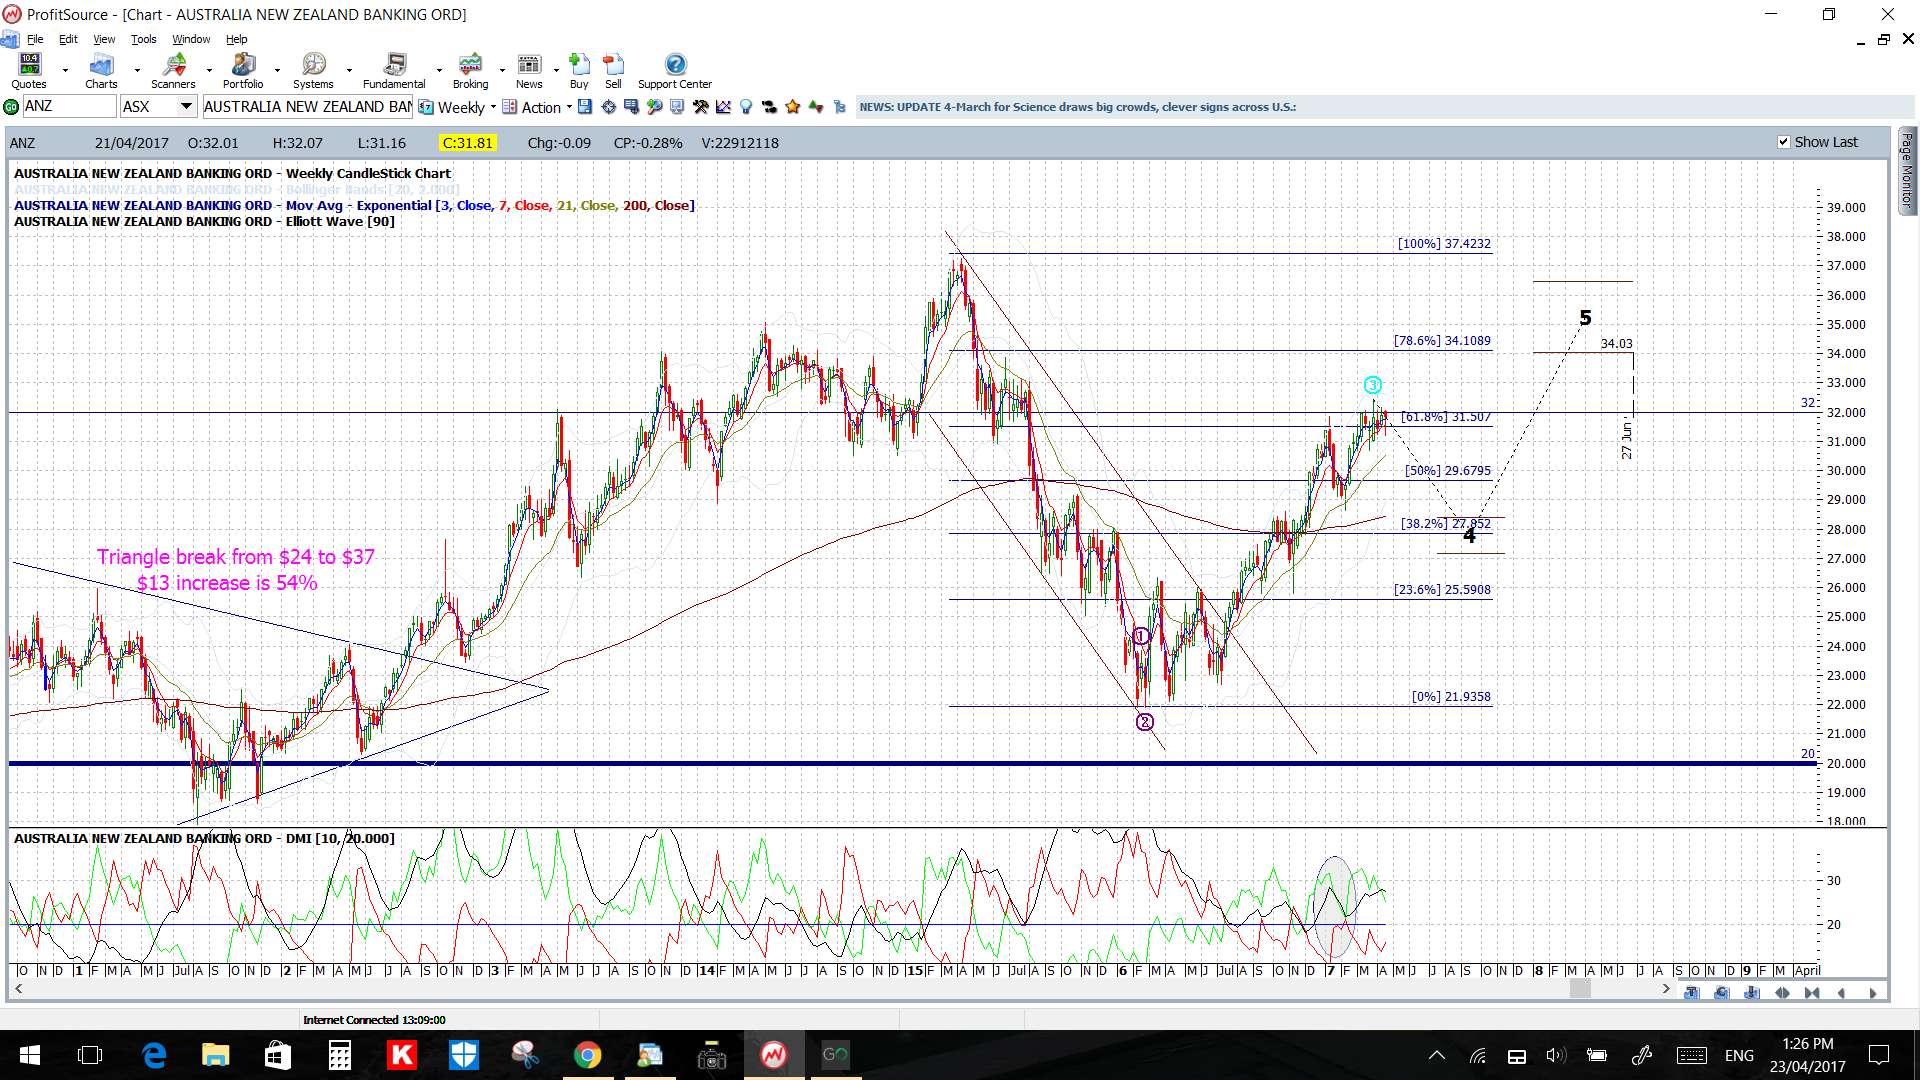
This 61.8% fib was up near previous S/R of $32 and I had this as the potential target when price initially broke out of the descending channel in mid 2016, as per the chart below:
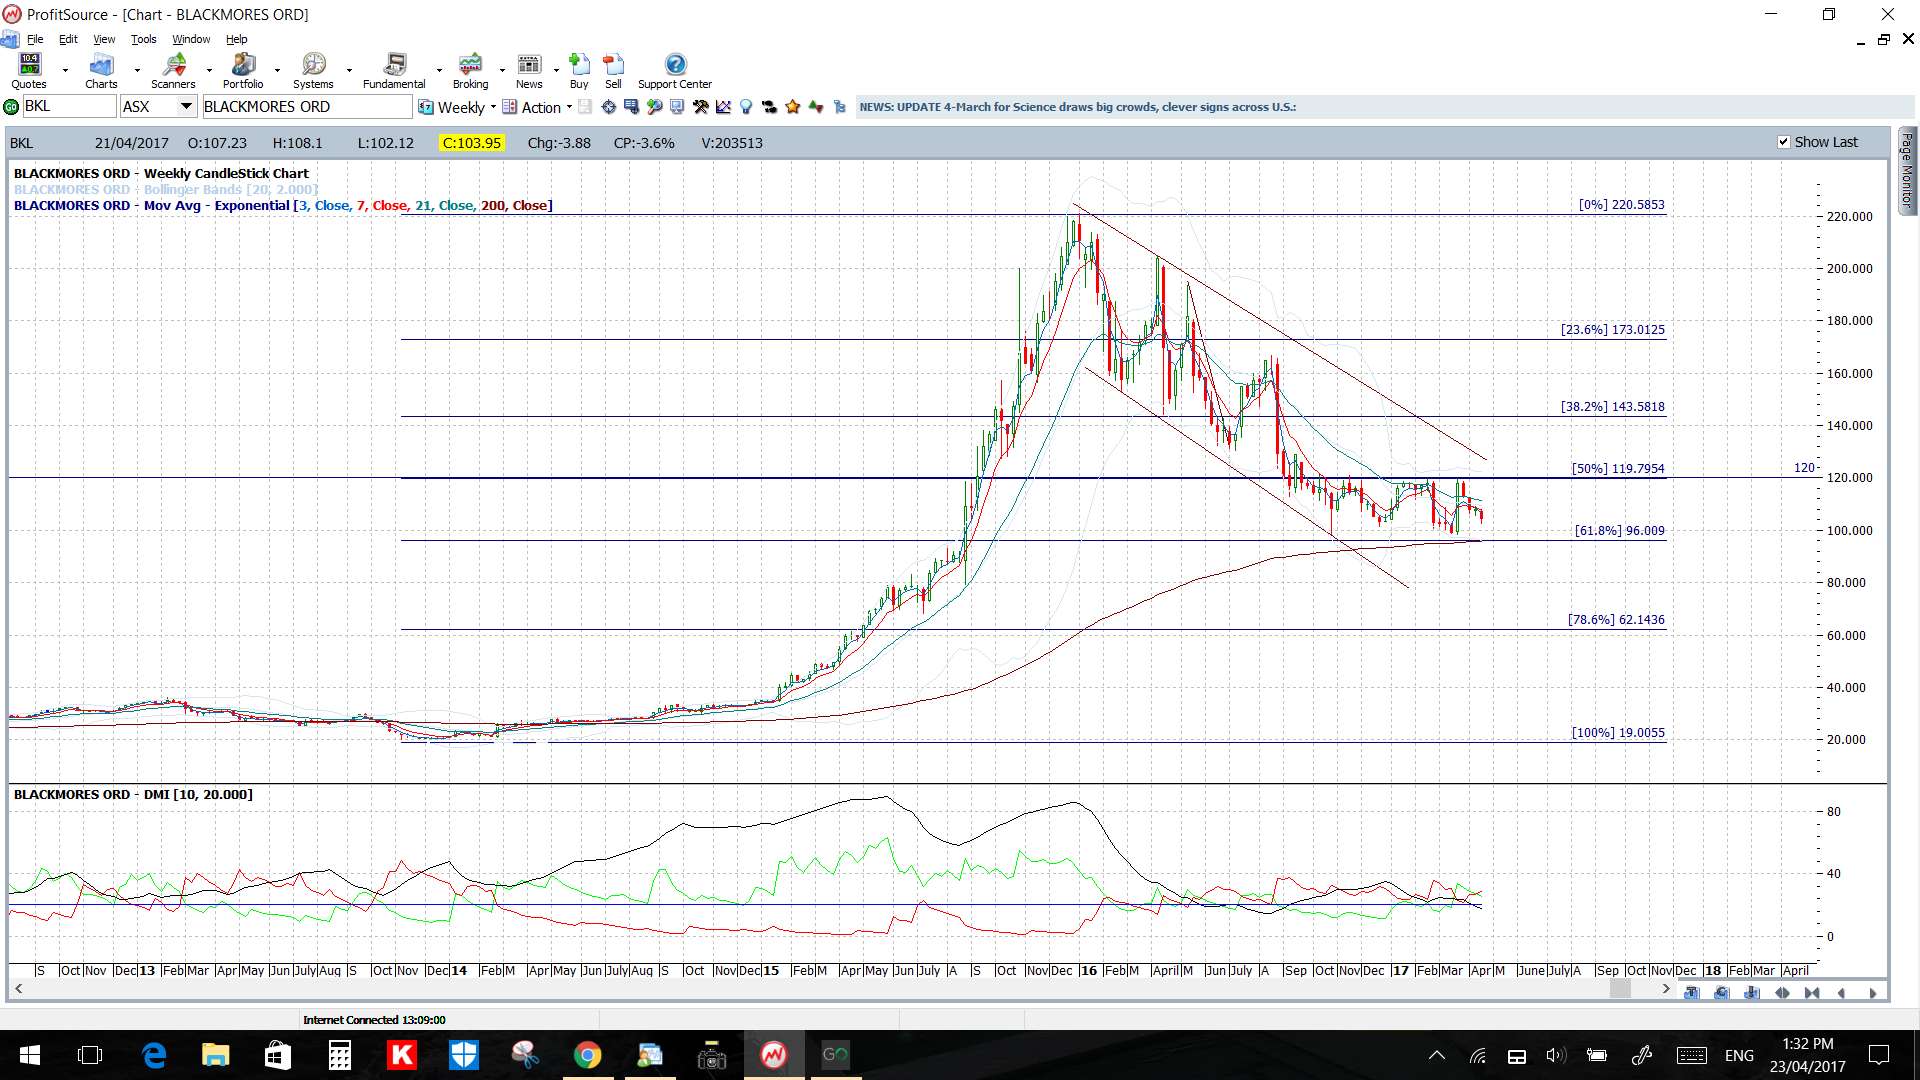
Example: Blackmores BKL, an ASX stock: April 2017.
Blackmores stock has been a huge success story increasing from $40 to $220 during 2015. Since that time though price action has pulled back and the herd mentality has drawn it down to the 61.8% Fibonacci region. The stock has hovered above this 61.8% fib but under $120 resistance for the last seven months.
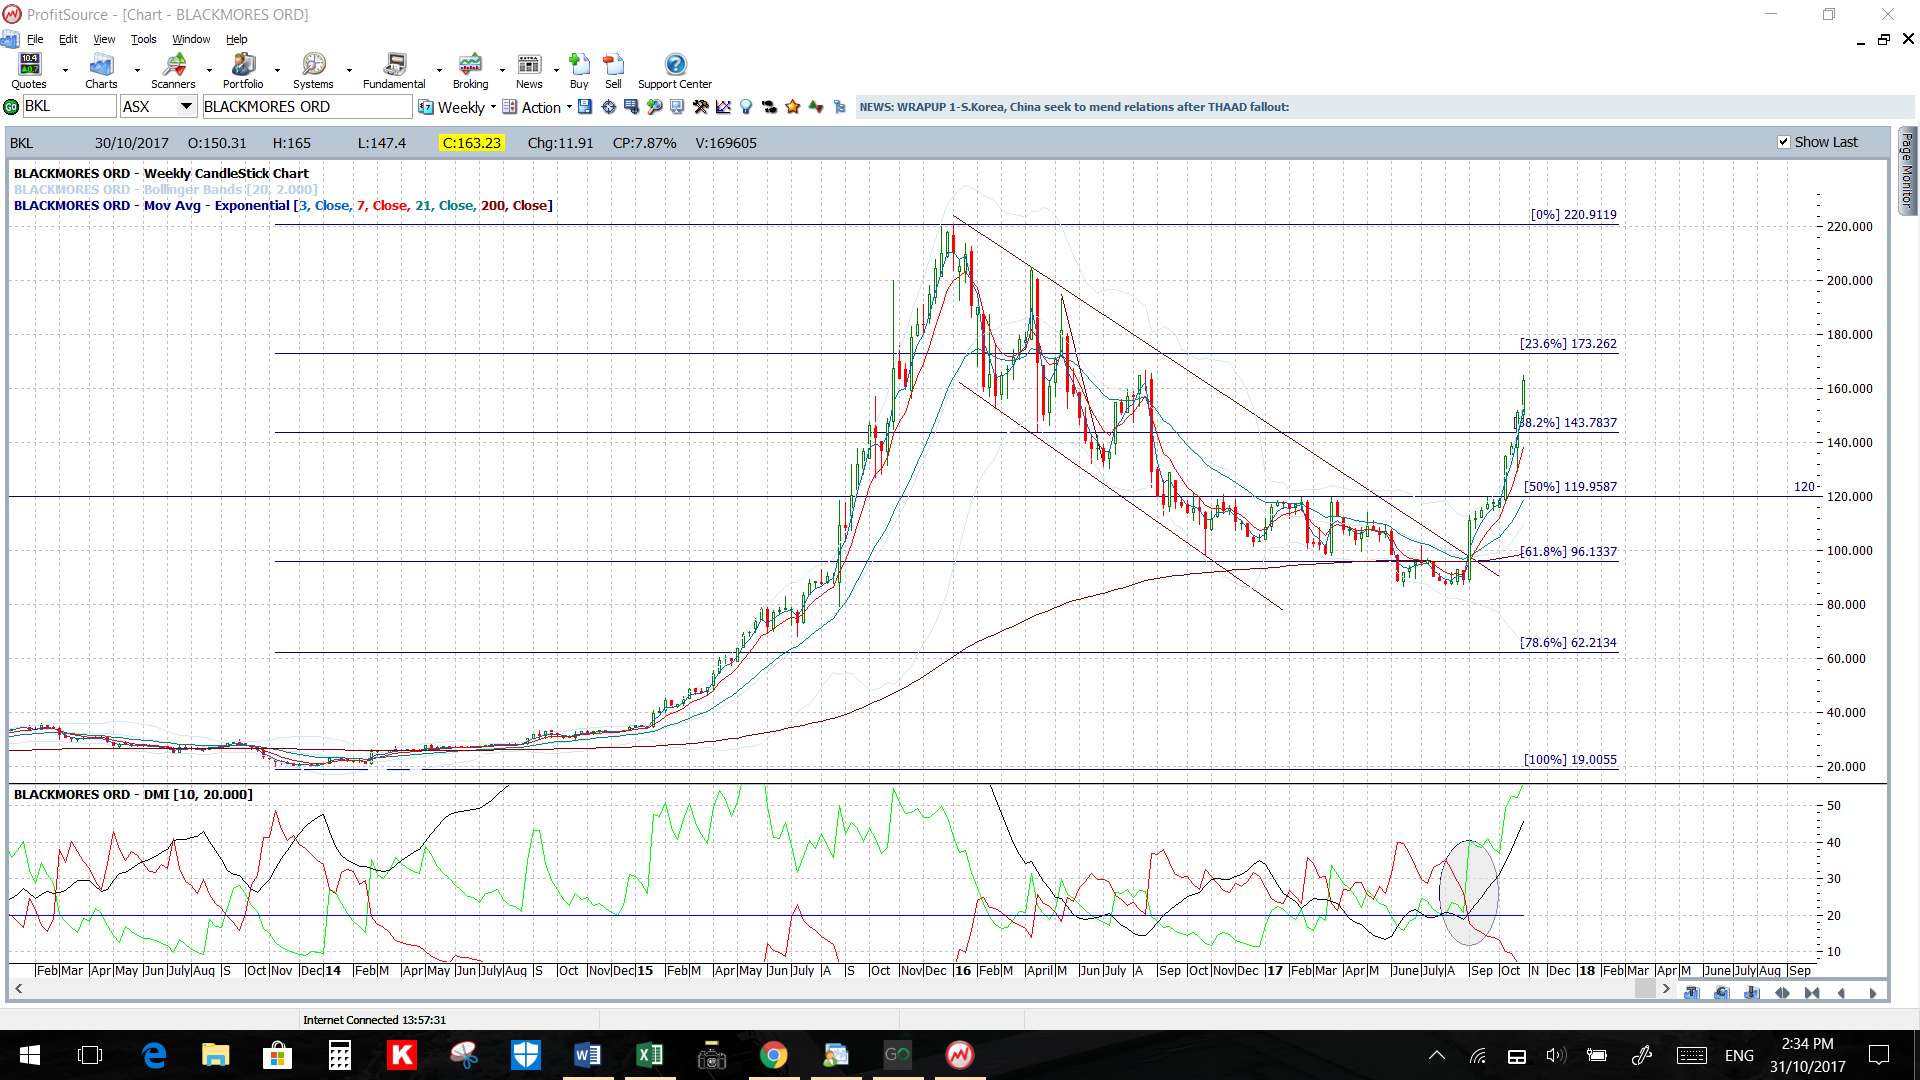
October 2017 update: the 61.8% Fib level held and price has raced higher from the 4100 level up to $160:
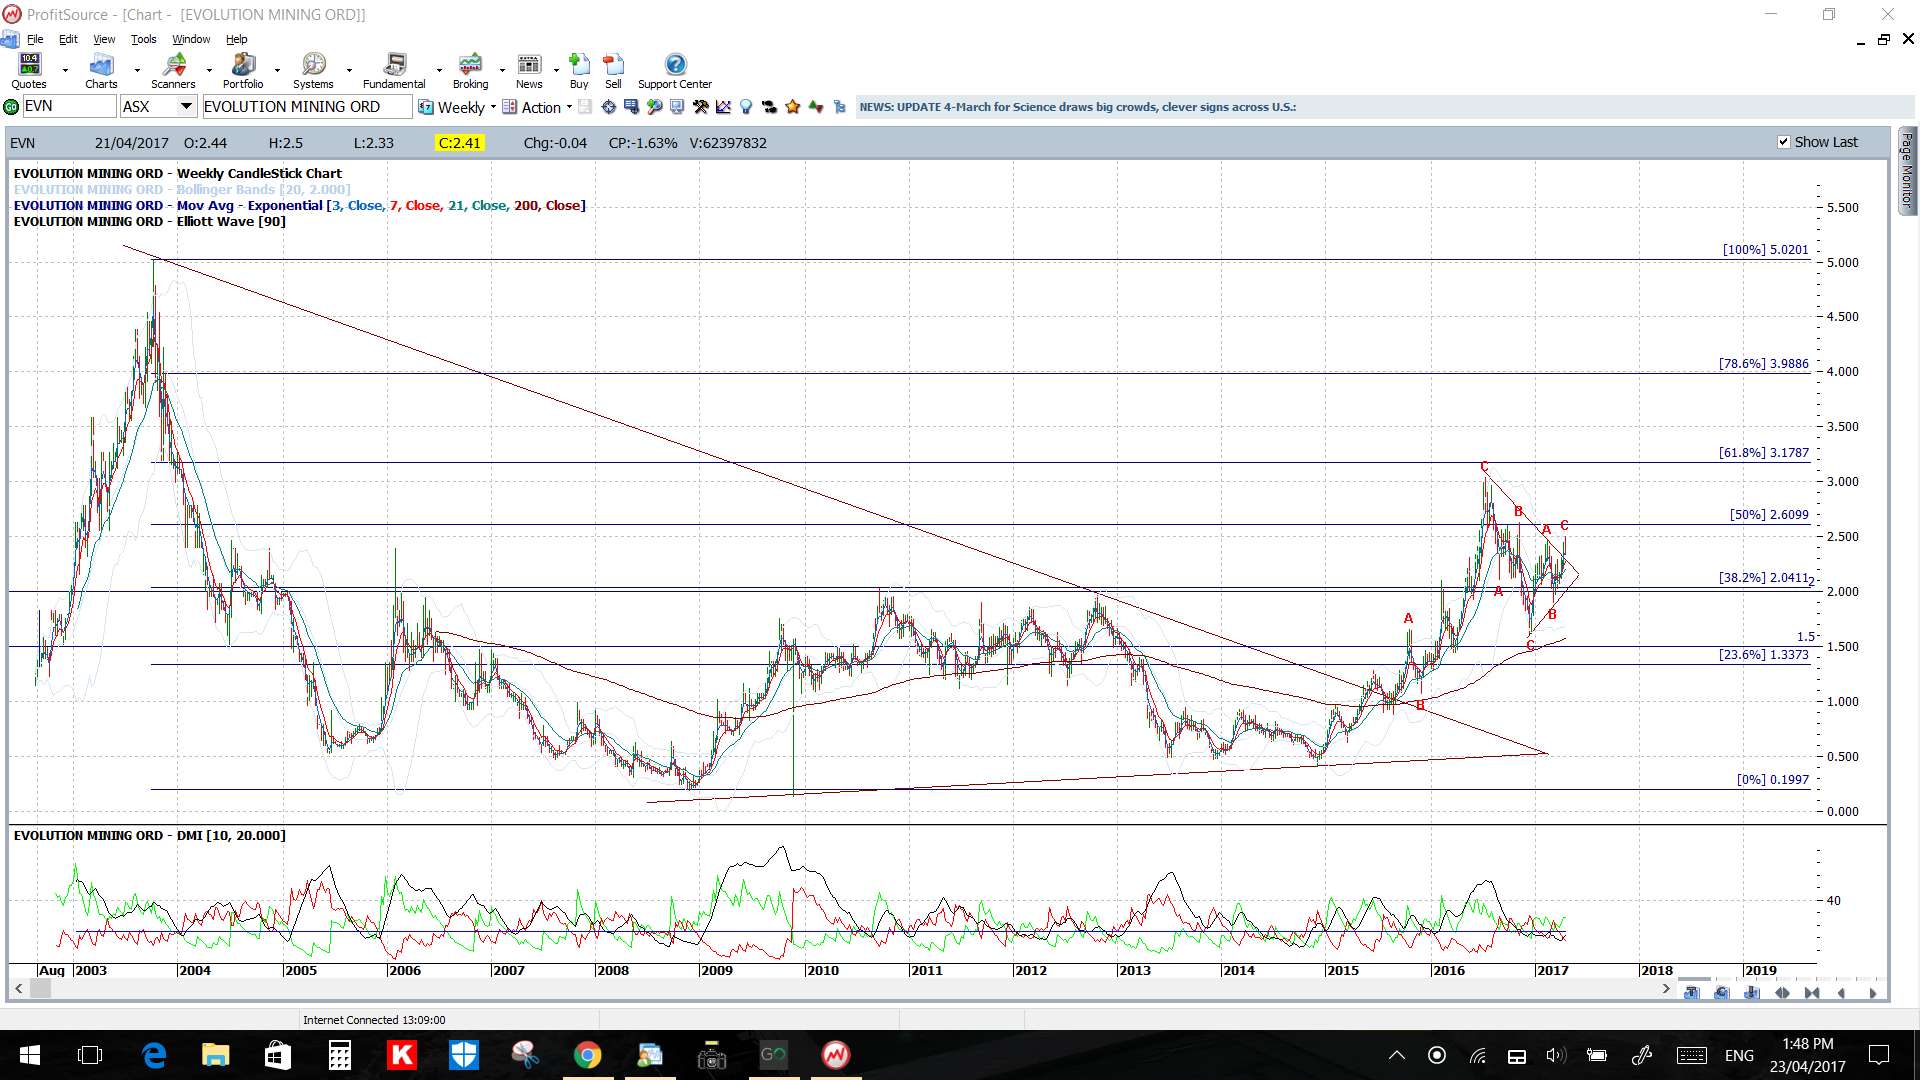
Example: Evolution Mining EVN, an ASX stock: April 2017.
Evolution mining broke up and out from a triangle during 2015 and I captured the move a bit after this here:
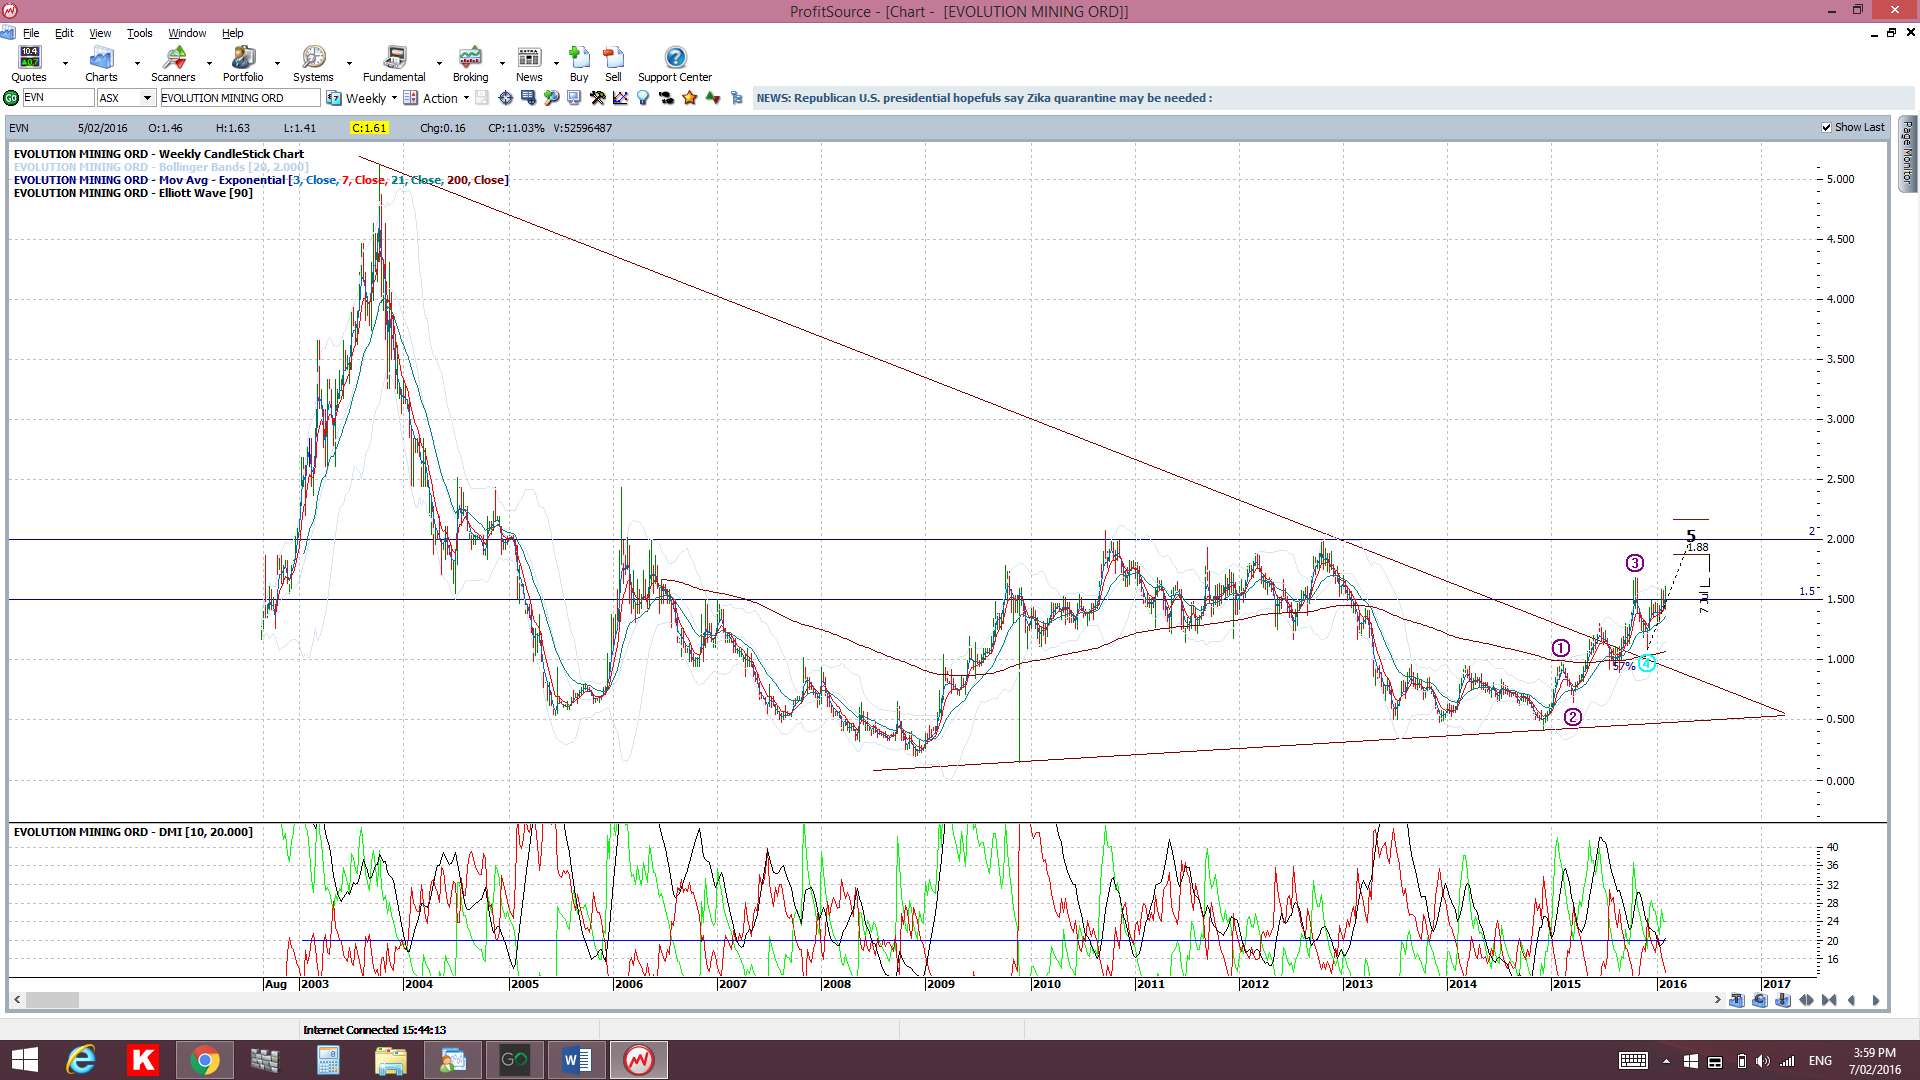
Note where this bullish rally stalled though! At the 61.8% Fibonacci level near the whole-number $3 level:
Example: Village Road Show VRL, an ASX stock: April 2017.
The pullback on this stock paused at the 61.8% Fibonacci so I’ll be keen to see if this level holds from here:

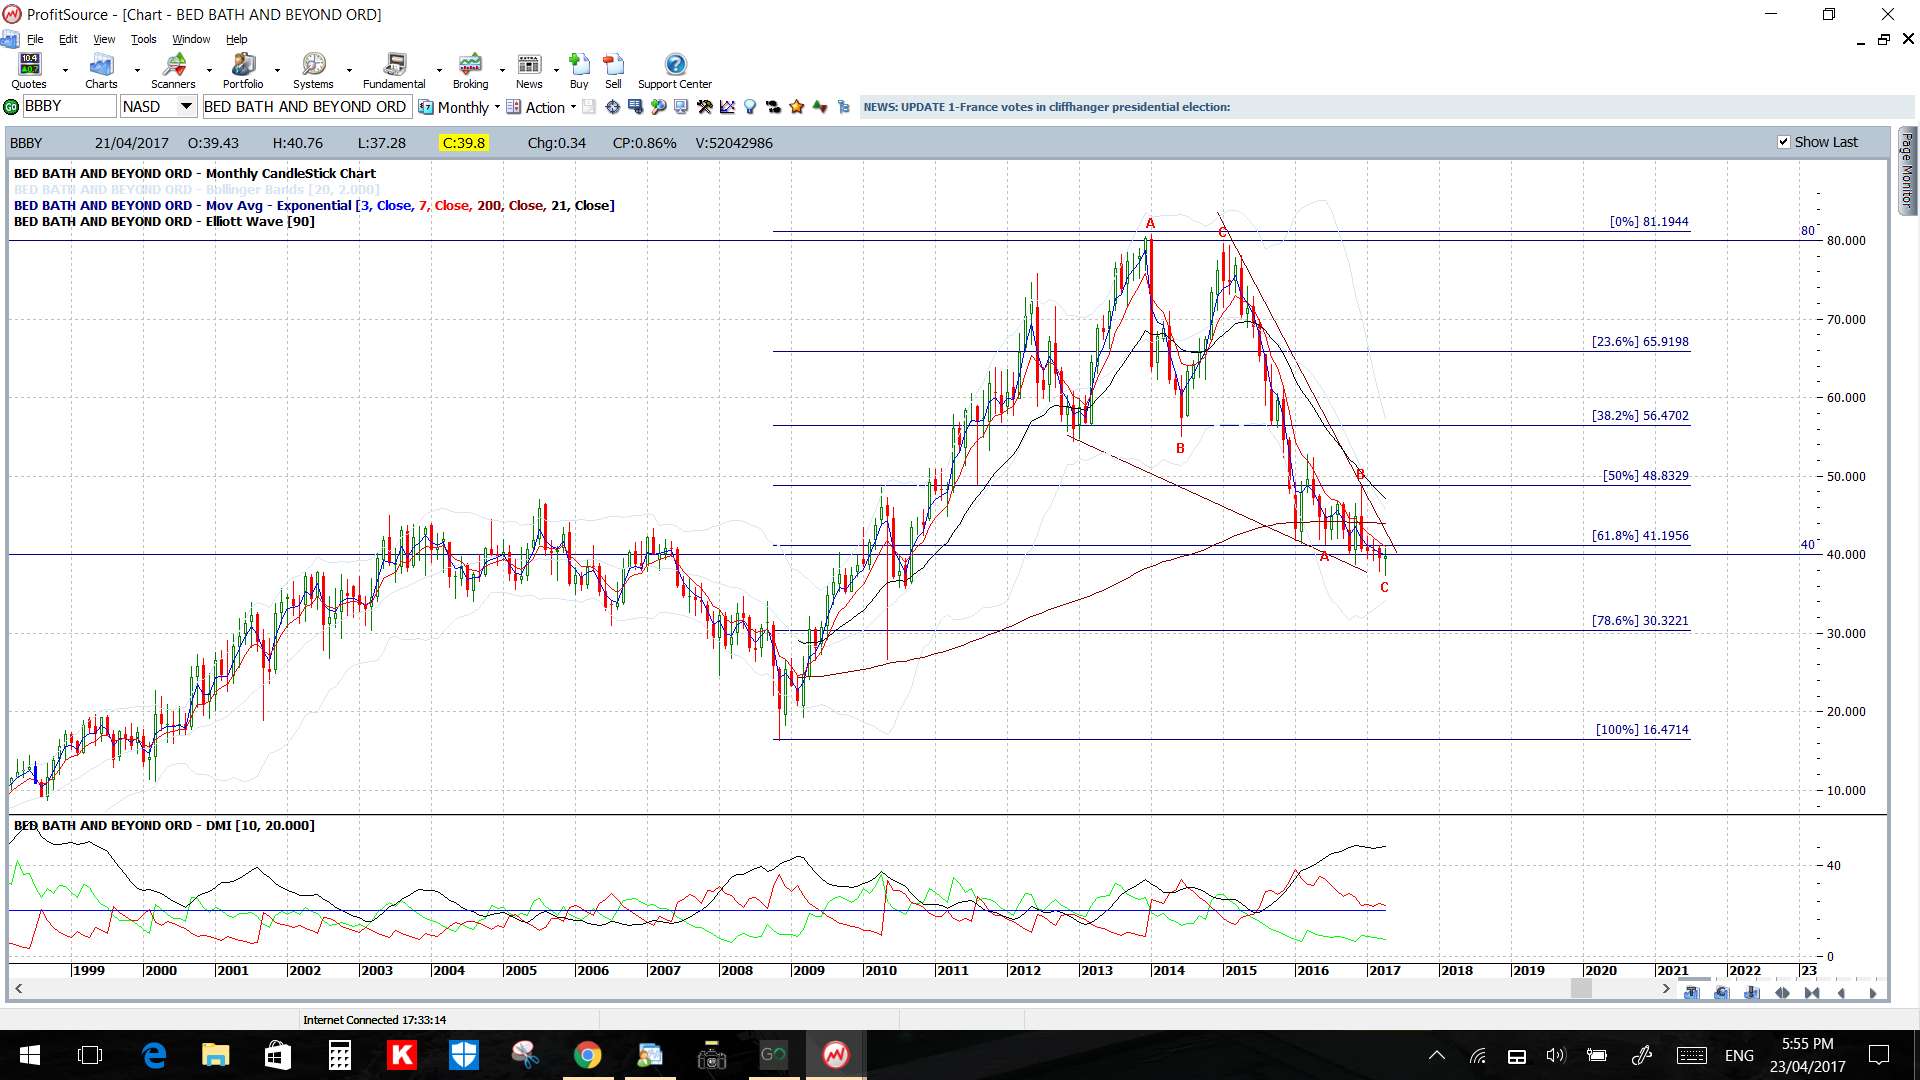
Example: Bed, Bath & Beyond BBBY, a NASDAQ stock: April 2017.
Note how this stock has pulled back to previous S/R at $40 which is also near the 61.8% Fibonacci level:
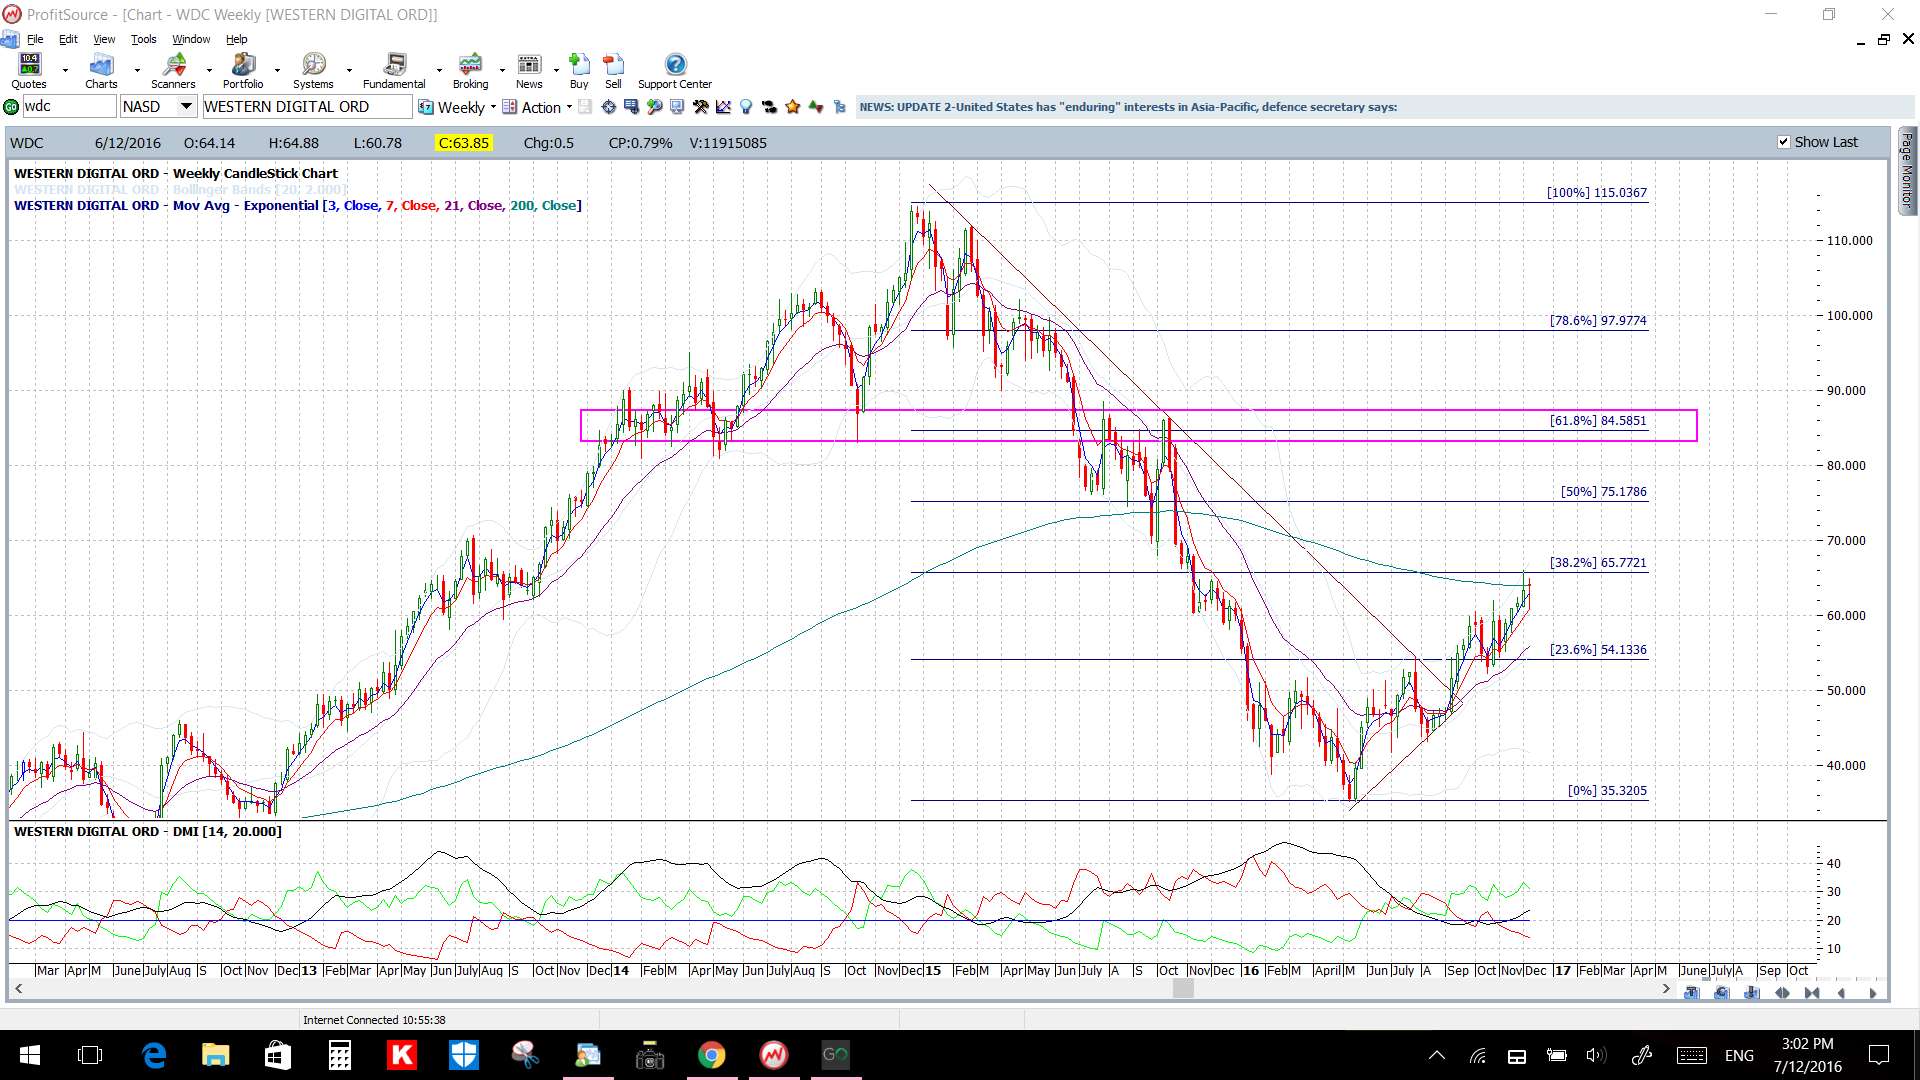
Example: Western Digital WDC, a NASDAQ stock. April 2017.
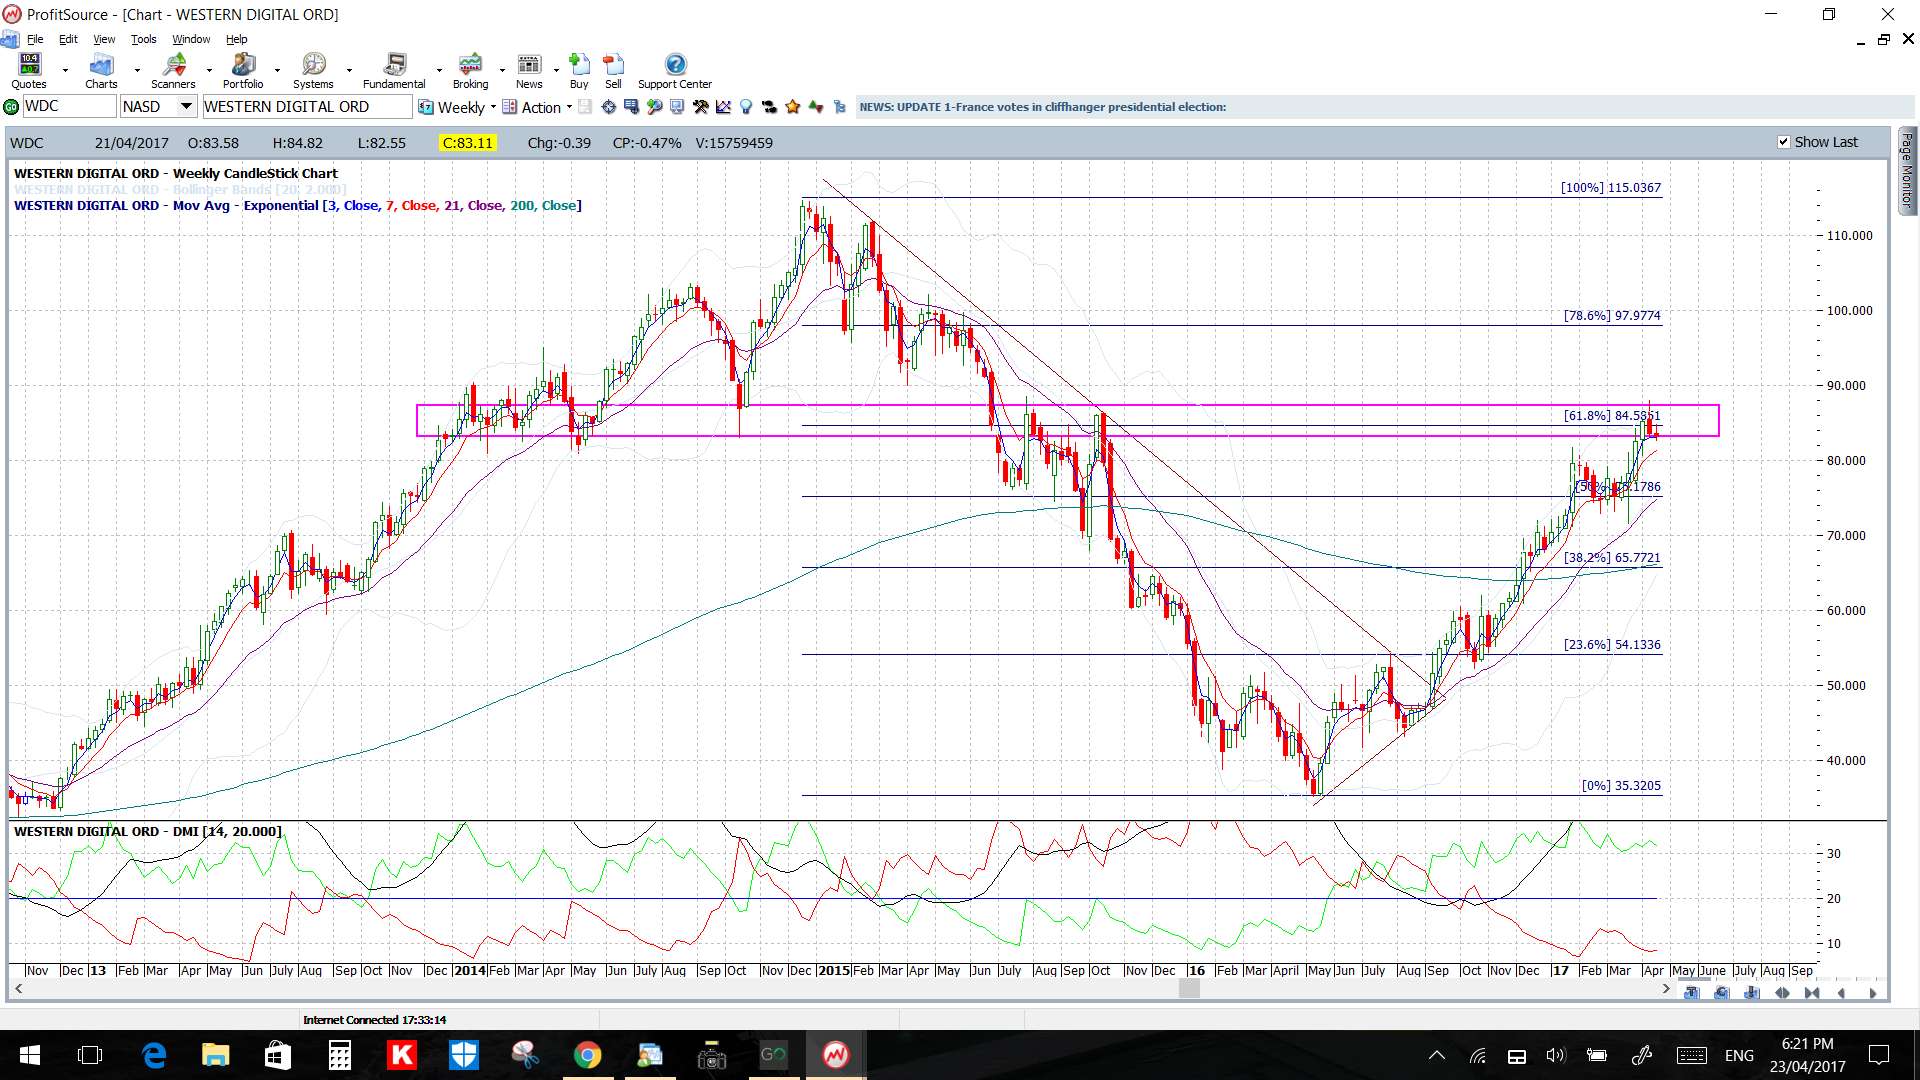
Back in December 2016 I had snapped this WDC chart and noted that any bullish continuation, following the triangle breakout, might target the 61.8% Fibonacci as this was a also previous S/R region near the $85 level.
Note how, four months later, price action has stalled at the 61.8% Fibonacci level
Ones to watch: I’m keeping an eye on the following charts to see if price action heads to test the noted Fibonacci levels.
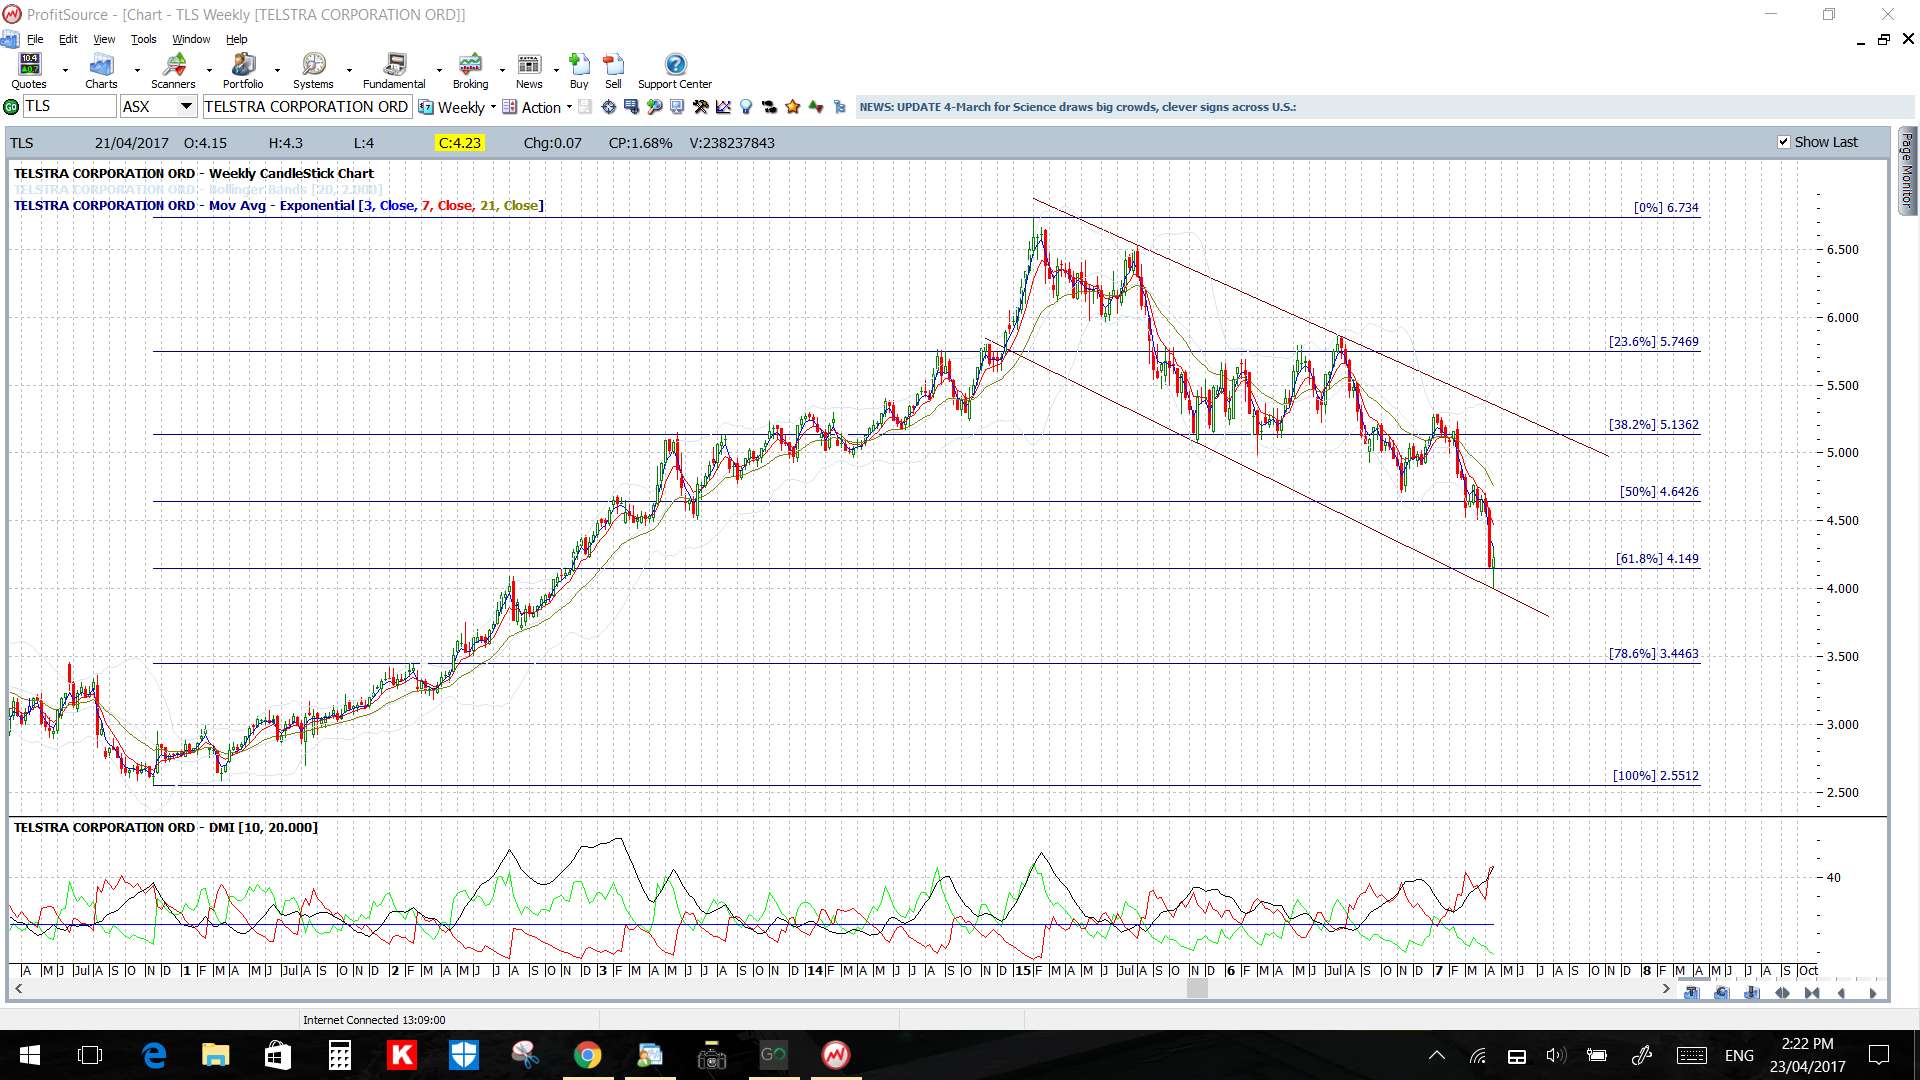
Example: Telstra TLS, an ASX stock: April 2017.
This is a very popularly traded Aussie stock and I have been watching this chart since it respected a monthly 61.8% Fibonacci resistance level and began its pullback (this example was discussed in the section above). Now price has reached down to the weekly chart’s 61.8% Fibonacci retracement and potential support level so I’ll be watching to see if it might bounce from here. The latest weekly candle was a bullish-reversal ‘Hammer’ candle for some extra confluence here:
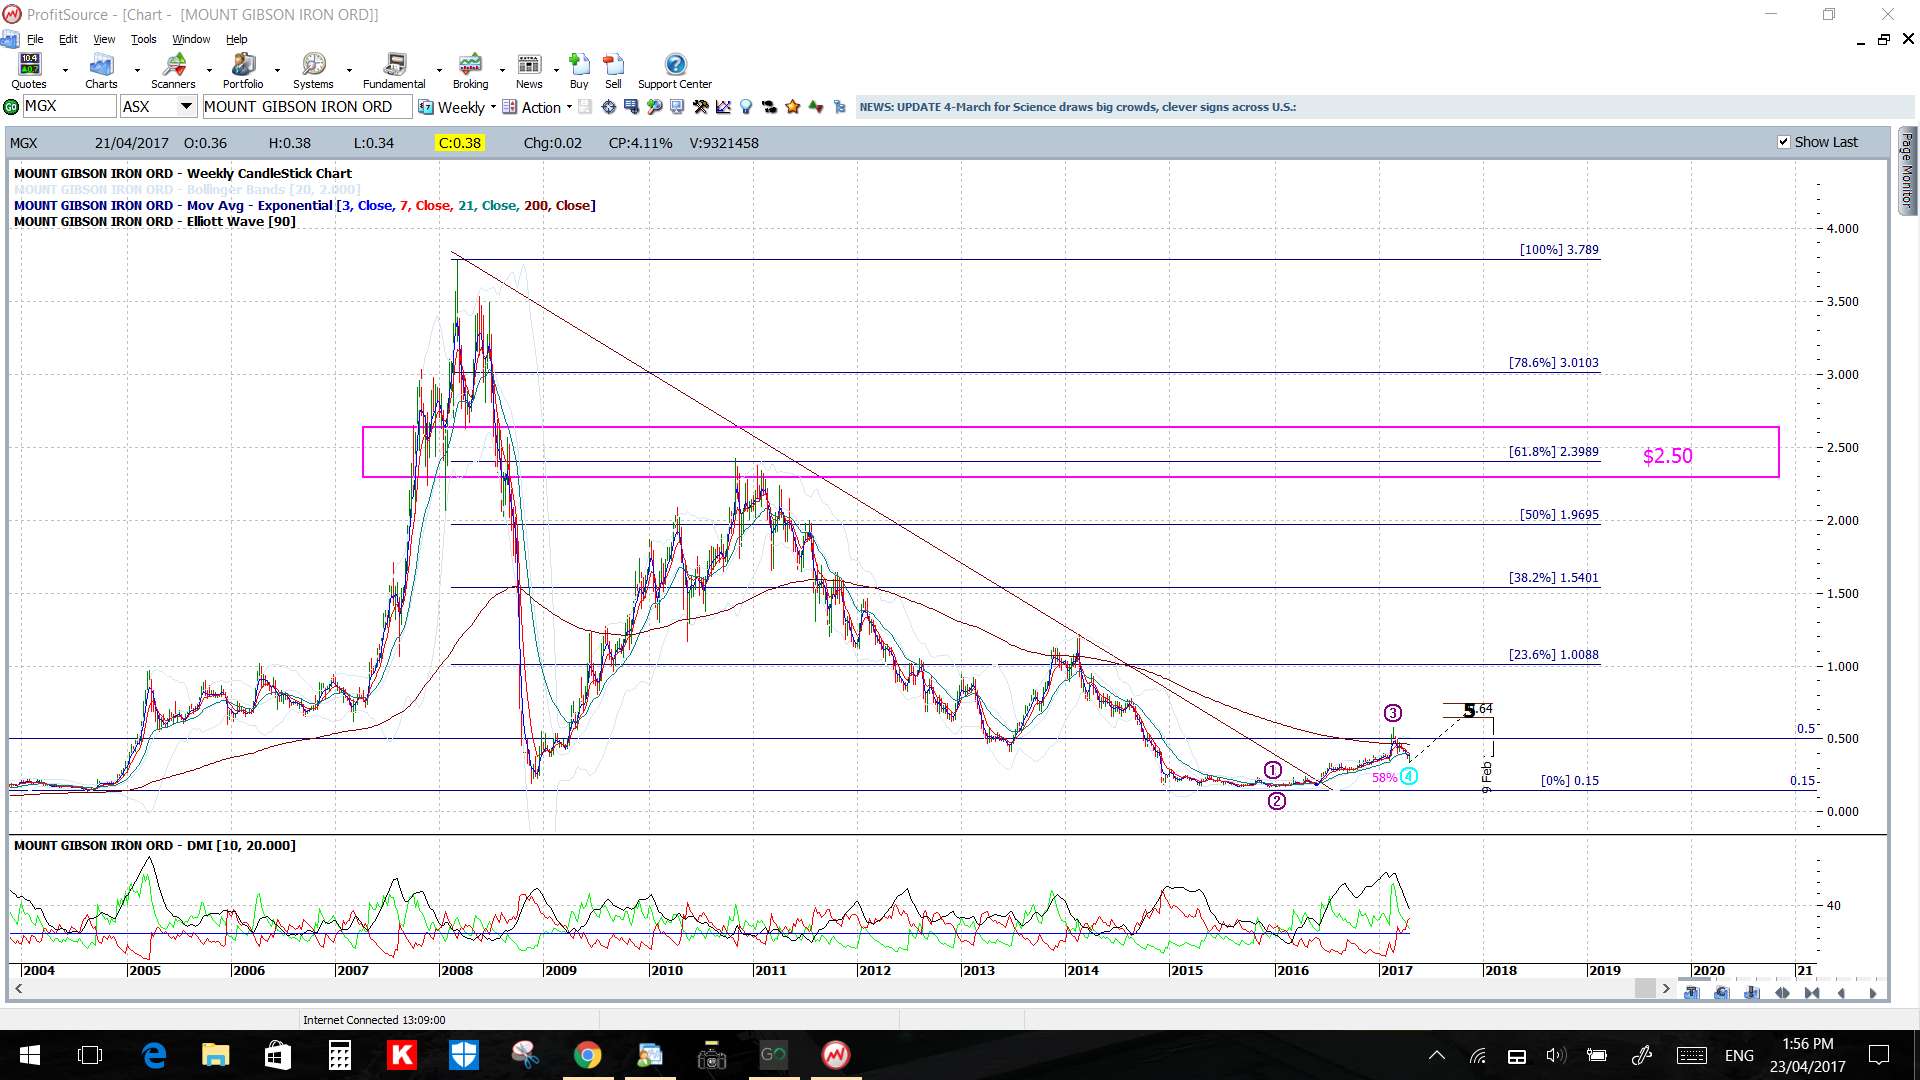
Example: Mt Gibson Iron MGX, an ASX stock: April 2017.
I’m going to keep an eye on this stock as I would expect any bullish continuation, following the triangle breakout, to target the previous S/R region near $2.50 as this is also near the 61.8% Fibonacci level. We’ll see if this ever evolves!
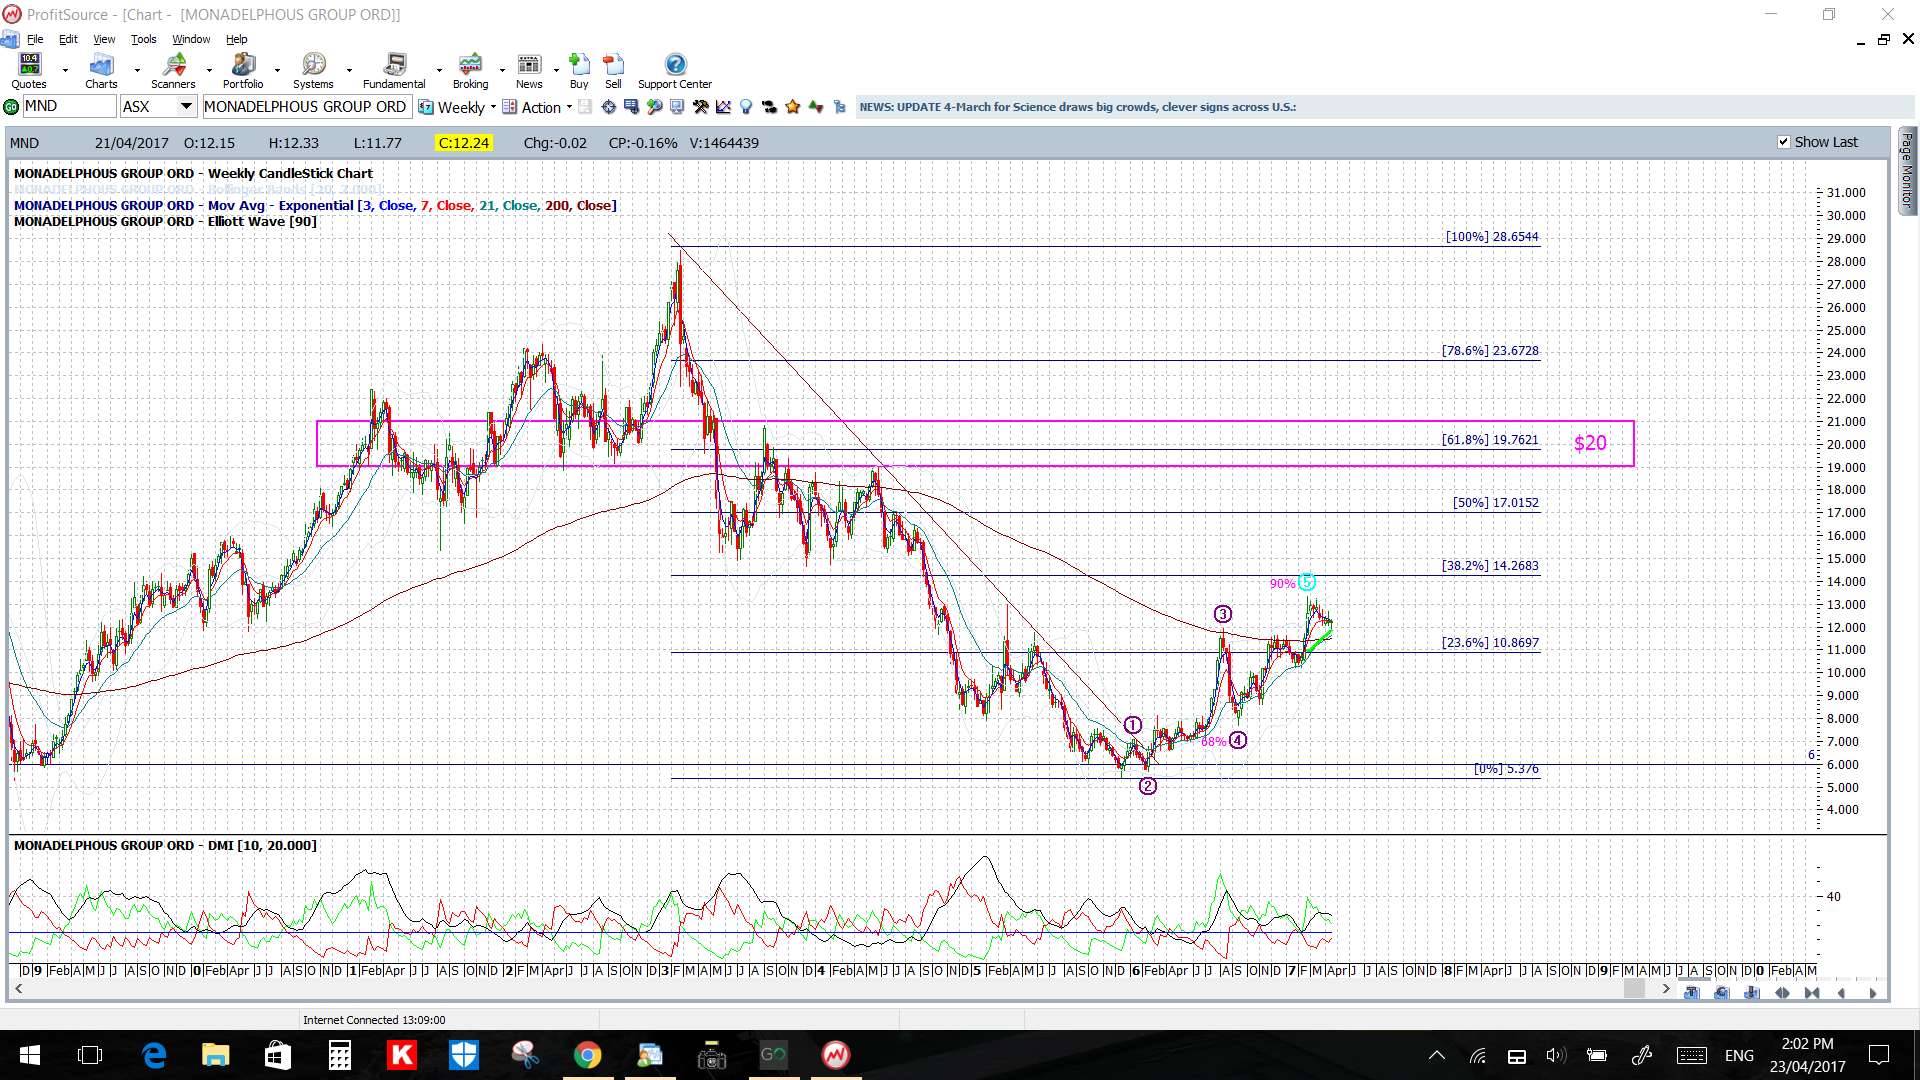
Example: Monadelphous Group MND, an ASX stock: April 2017.
This is another stock that I would be watching for any bullish follow-through to target previous S/R near $20 as this is also near the 61.8% Fibonacci level:
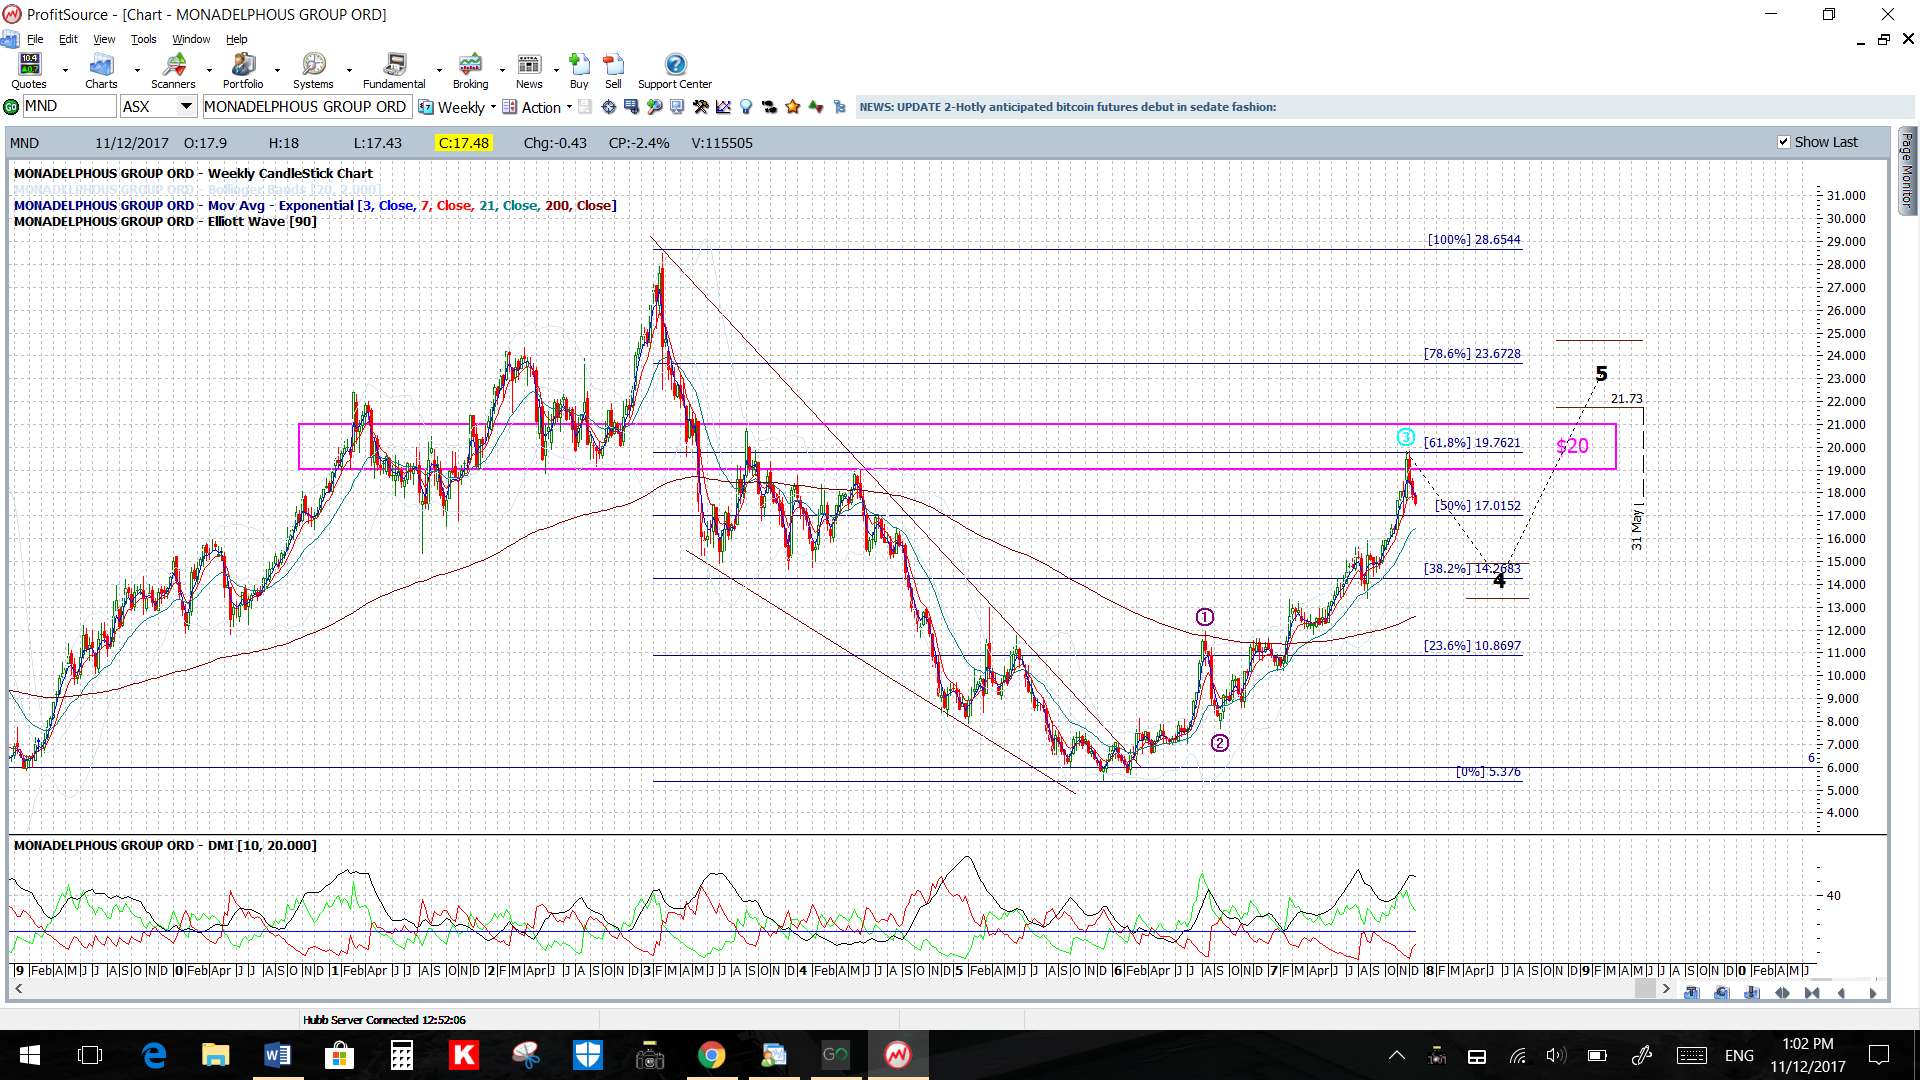
December 2017 Update: the $20 target near the 61.8% fib has been reached for a 43% gain:
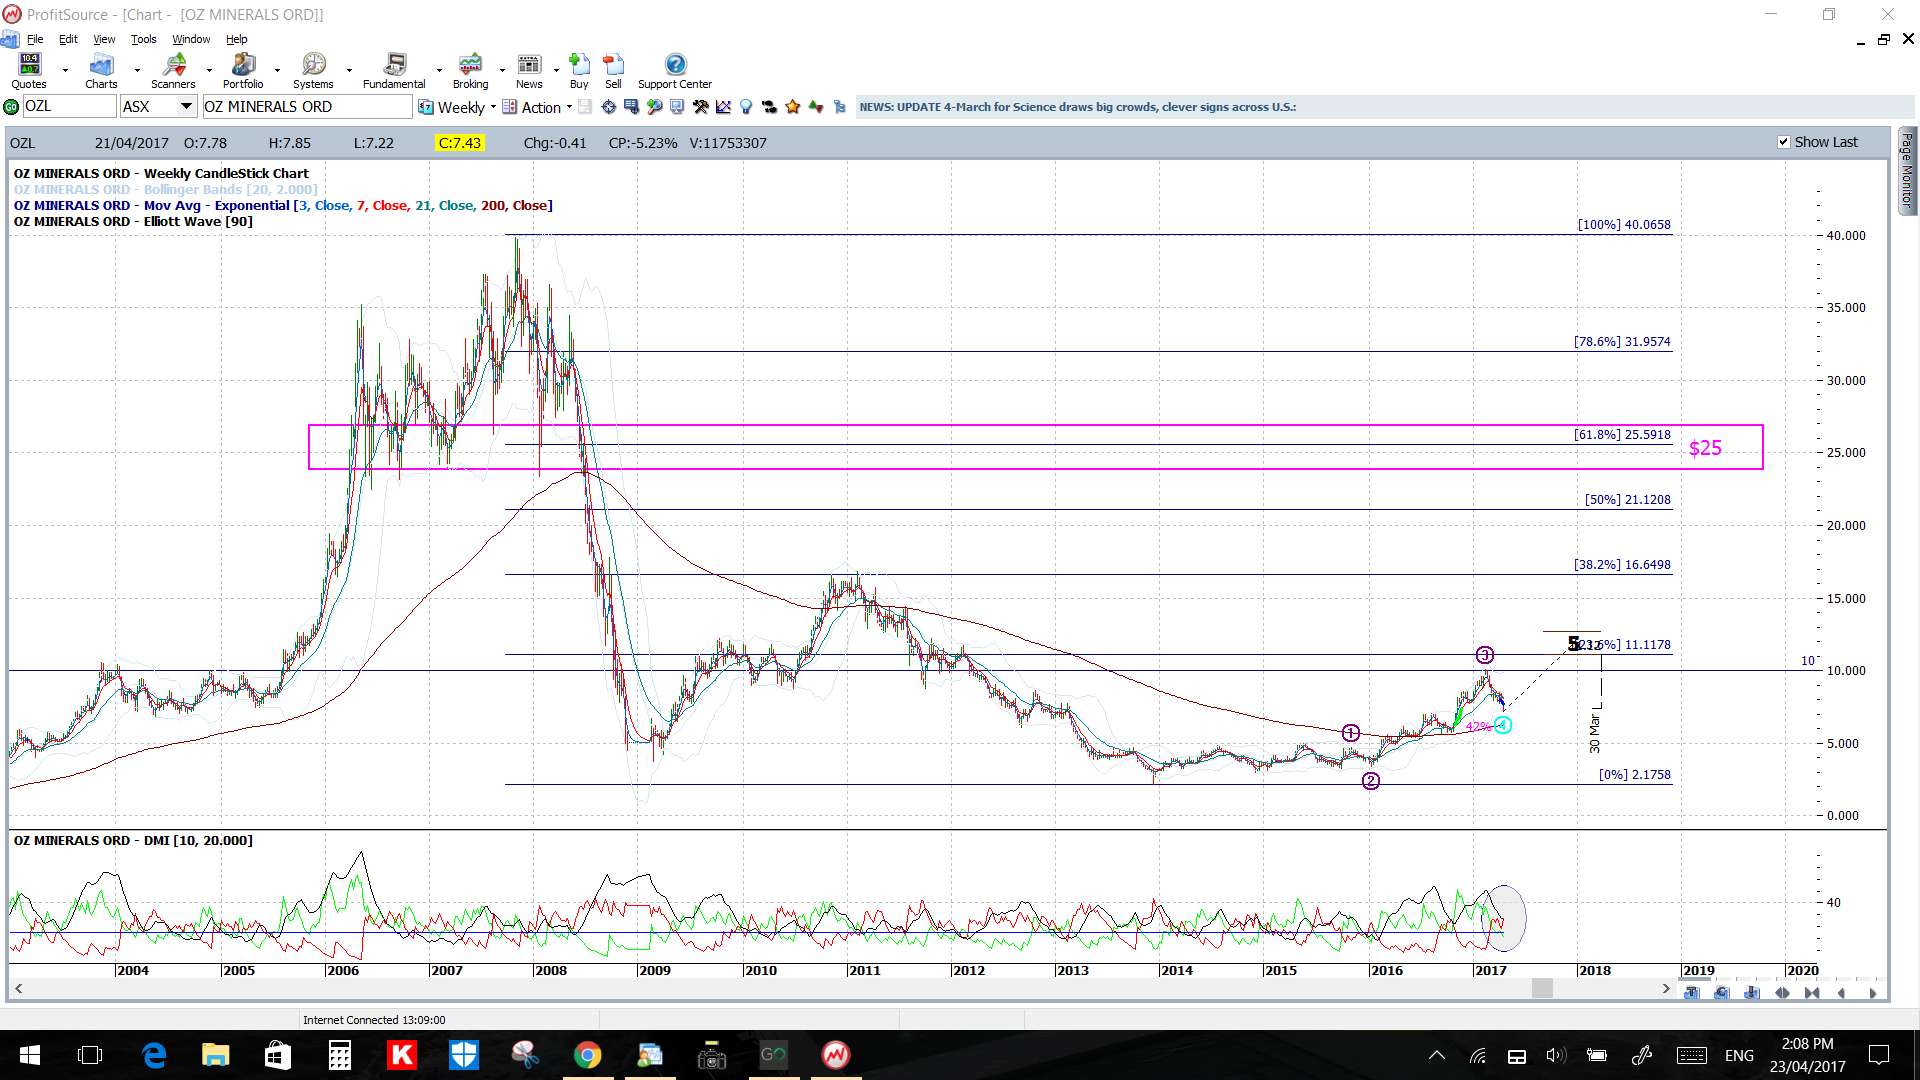
Example: Oz Minerals OZL, an ASX stock. April 2017.
This is another stock where, if it can break and hold above $10, then I’d be watching for any continuation move to target the previous S/R level of $25 as this is also near the 61.8% Fibonacci level.
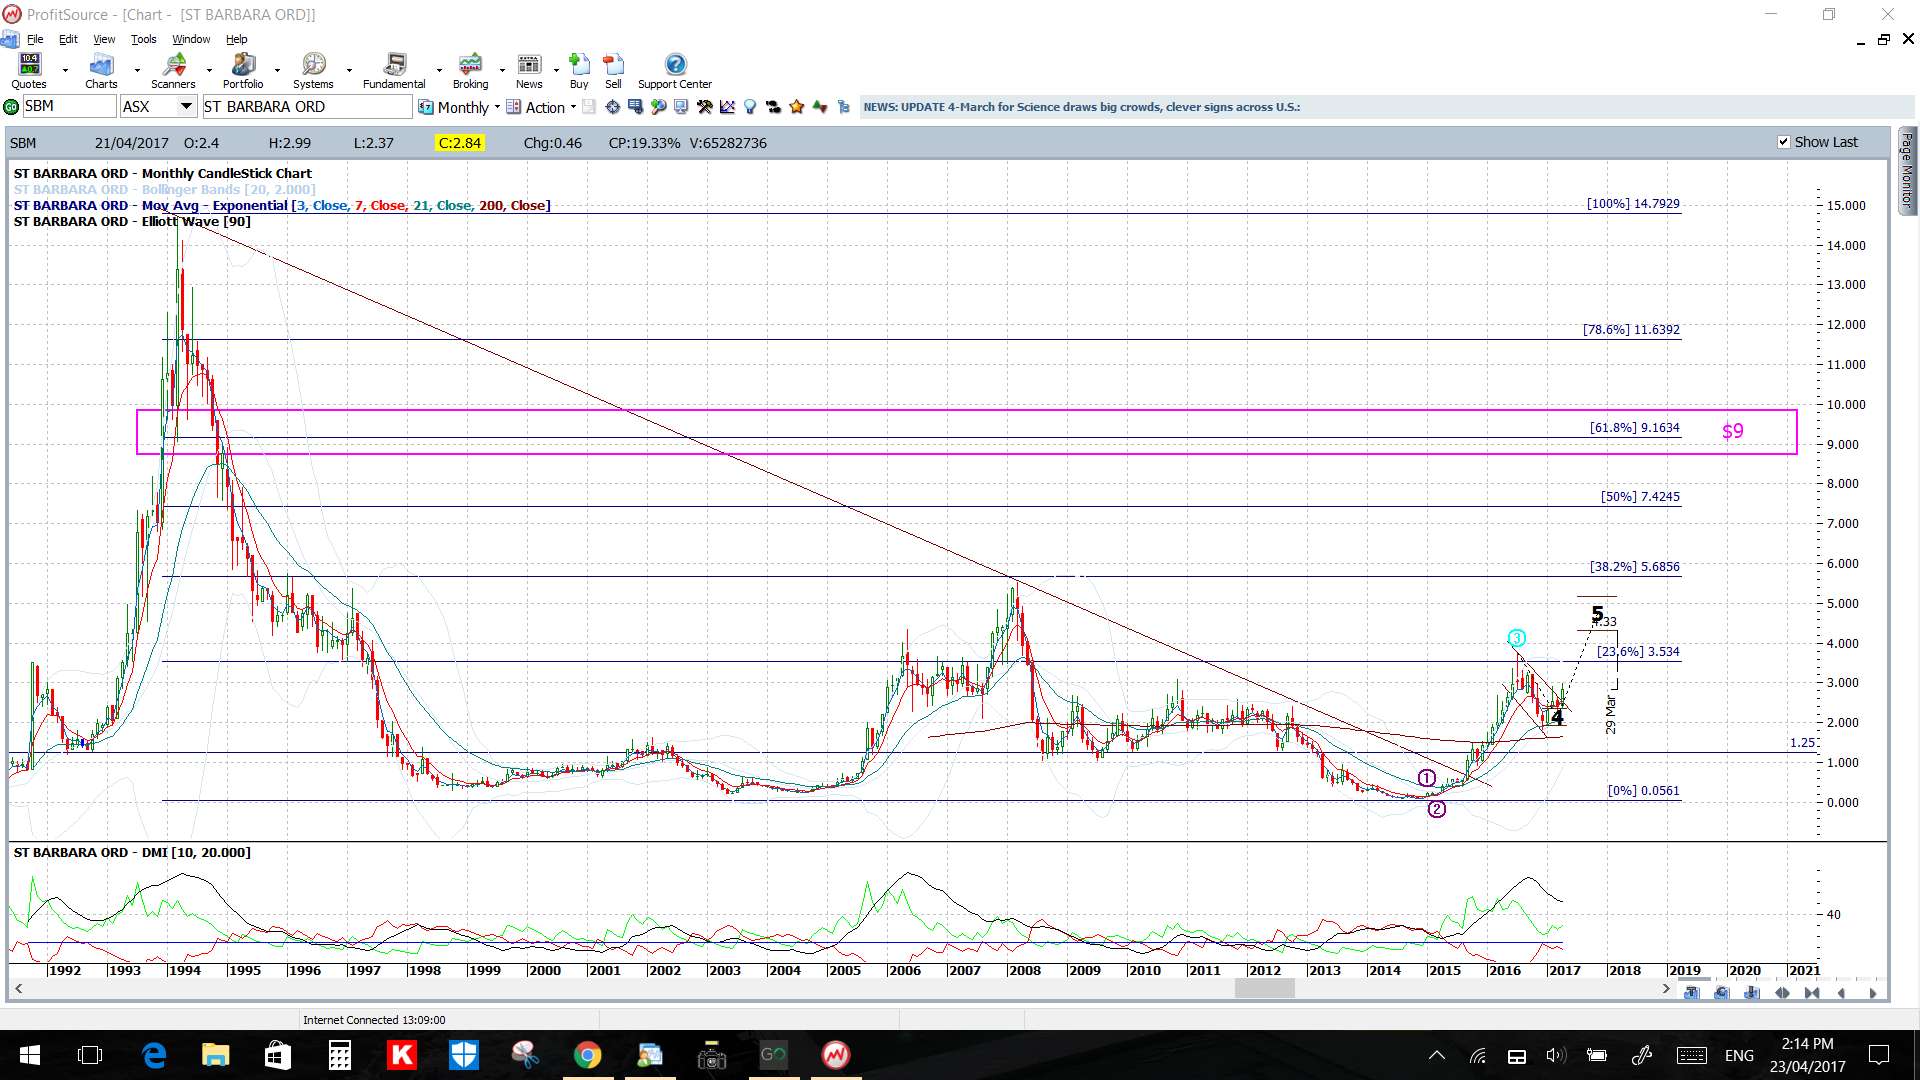
Example: St Barbara SBM, an ASX stock: April 2017.
This is another stock that has made a bullish triangle breakout and I’ll be watching for any continuation to test the $9 S/R region as this is also near the 61.8% Fibonacci level.
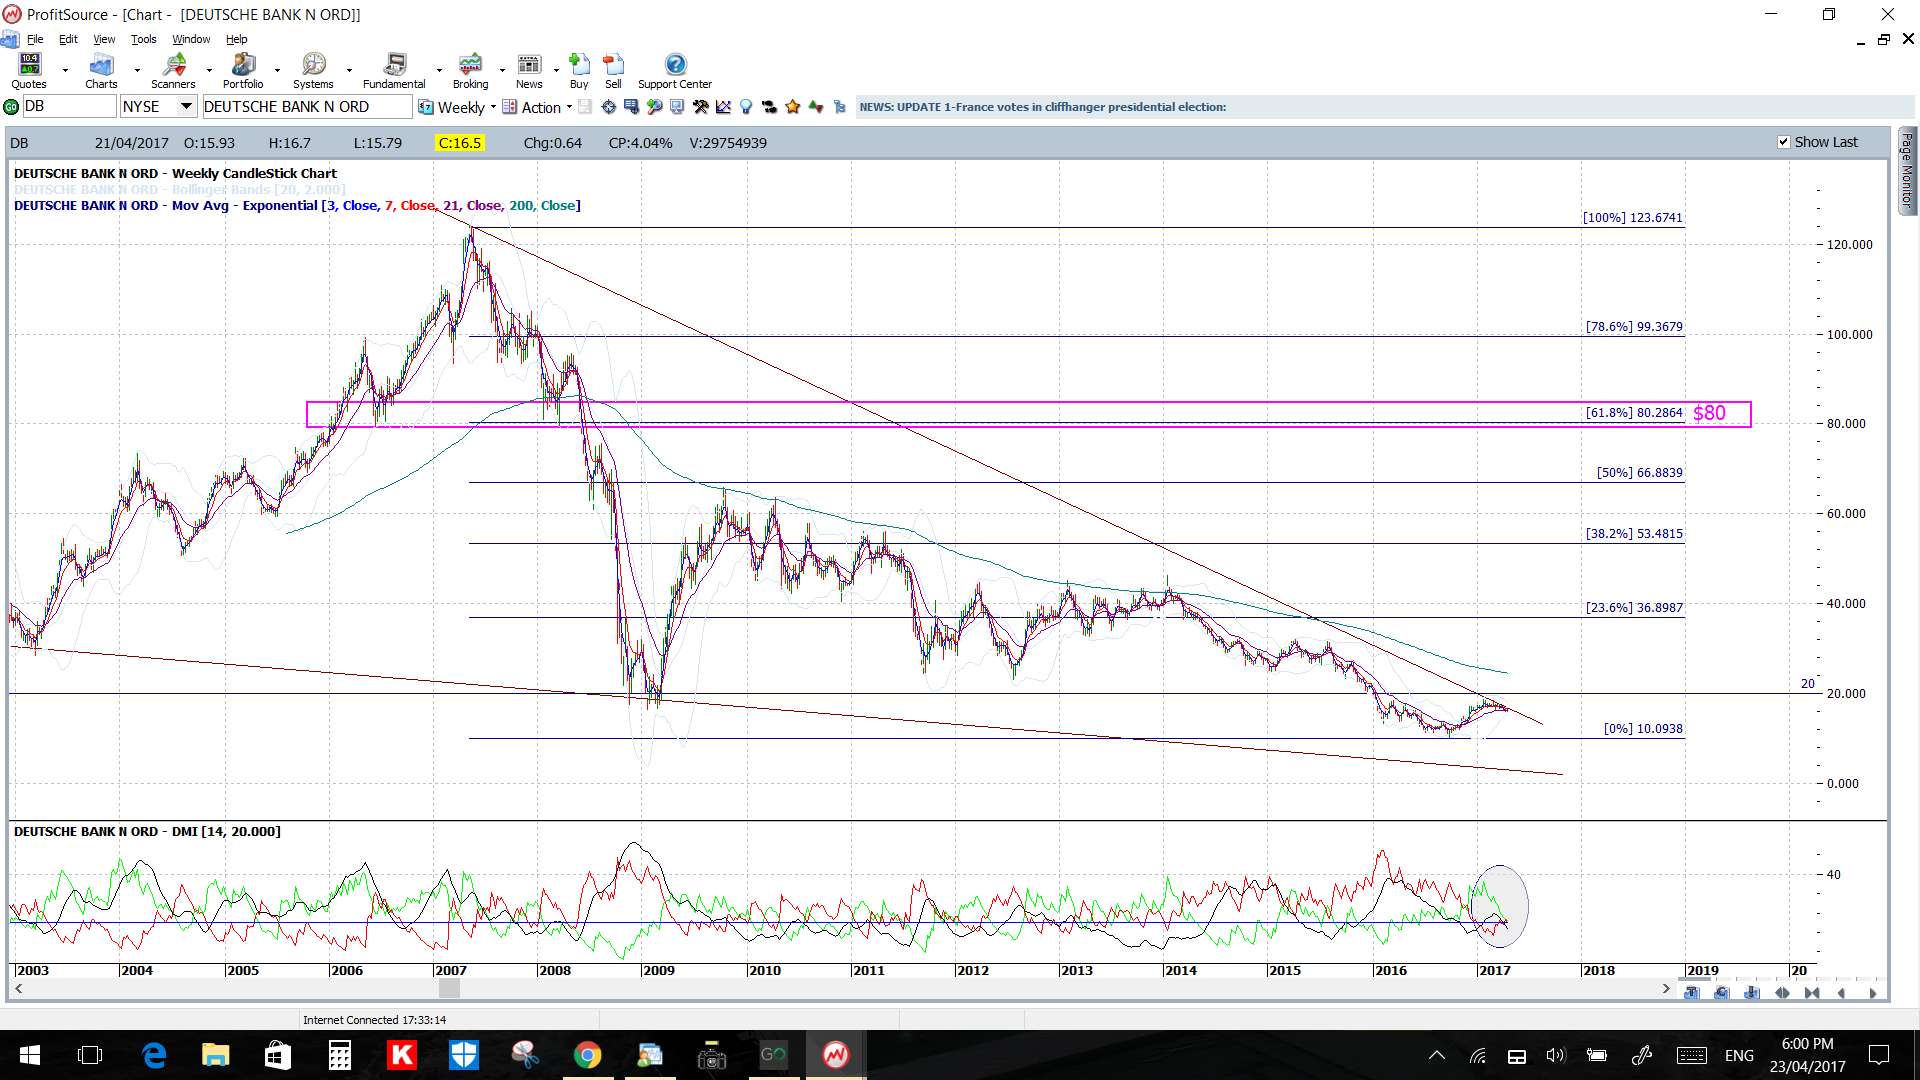
Example: Deutsche Bank DB an NYSE stock: April 2017.
Price action is currently within a bullish-reversal descending wedge and so I’ll be watching to see if any bullish breakout heads up to test previous S/R at $80 that is also near the 61.8% Fibonacci.
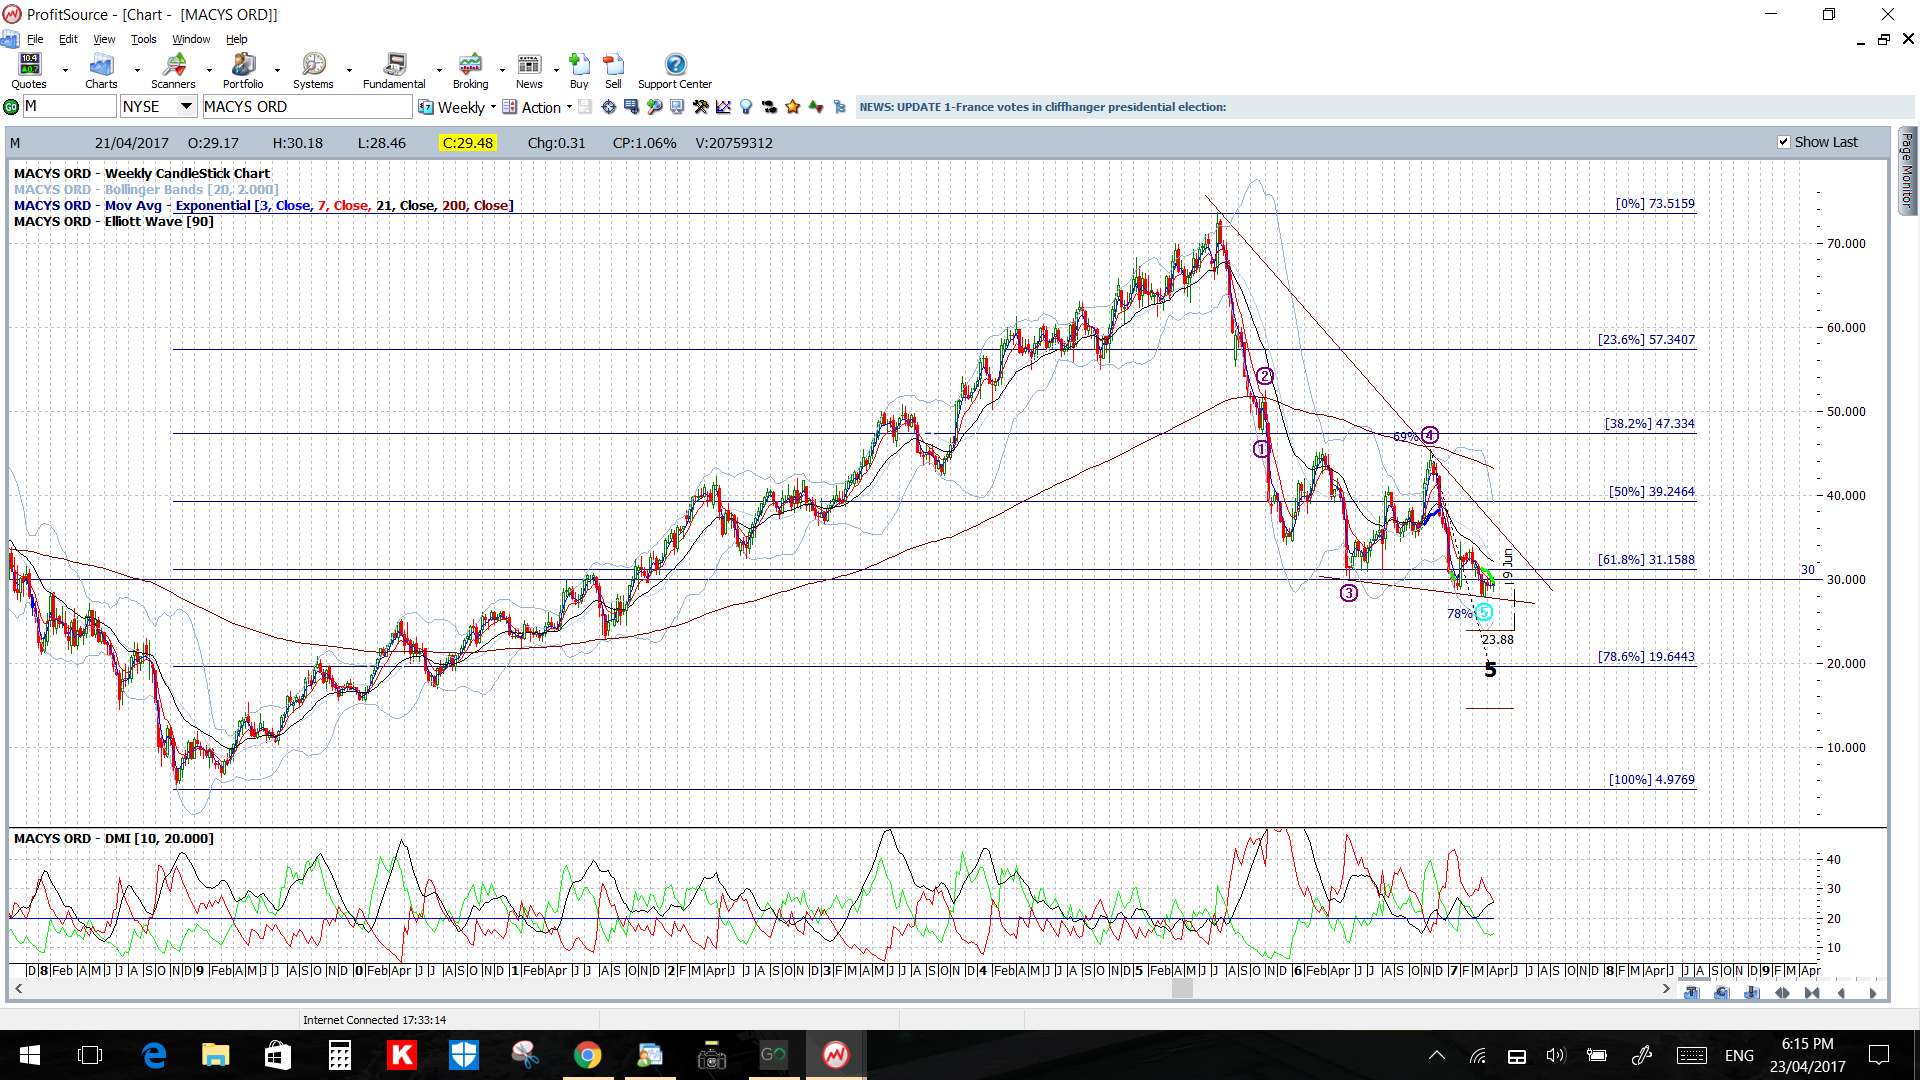
Example: Macy’s M, an NYSE stock: April 2017.
I’ll be watching to see if the 61.8% Fibonacci region, near the $30 S/R level, can act as support here:
NB: I will load more examples onto this page as they become available.
Questions: Please address any questions to: [email protected]