Last week: It was another volatile week for trading and this again limited the potential for smooth momentum signals off the 4hr chart time frame. Trading off shorter time frame charts during the US session continued to offer higher probability and lower risk trading opportunities as I noted again on Friday with the discussion of Silver. The markets had been watching for reaction to FOMC but BoJ easing during the Asian session on Friday triggered the biggest reaction with major moves on the Yen pairs.
This week:
There is a lot of high impact data next week with interest rate decisions for the AUD, GBP and EUR and then NFP on Friday being the most significant. These news items are of particular interest whilst the E/U, GBP/AUD and A/U are currently trying to hold above major support levels.
The USDX has now closed above a major resistance trend line and this move marks a monthly triangle breakout. Technical theory would suggest bullish continuation from this point and, if so, this could have a significant impact on a number of FX pairs. A review of the FX indices can be found through this link. Traders need to watch how the USD reacts to Friday’s NFP though as any jobs data weakness could unsettle the USD rally.
Friday was the last day of the trading month and so traders need to watch for new monthly pivots on Monday.
The BoJ surprised the markets on Friday by announcing an easing program which triggered a Yen sell off and big moves for these pairs. Traders will be watching to see if these moves will continue and, if so, which pair or pairs might offer a reasonable trade entry. The GBP/JPY and EUR/JPY are both sitting right near major S/R levels and these two could prove to be a reasonable choice first up. I would not be surprised to see some pull back on these pairs though, even if there is to be eventual bullish continuation.
Gold and Silver had a huge sell off during the week and both have broken through key support levels. Further bearish target levels are now being monitored.
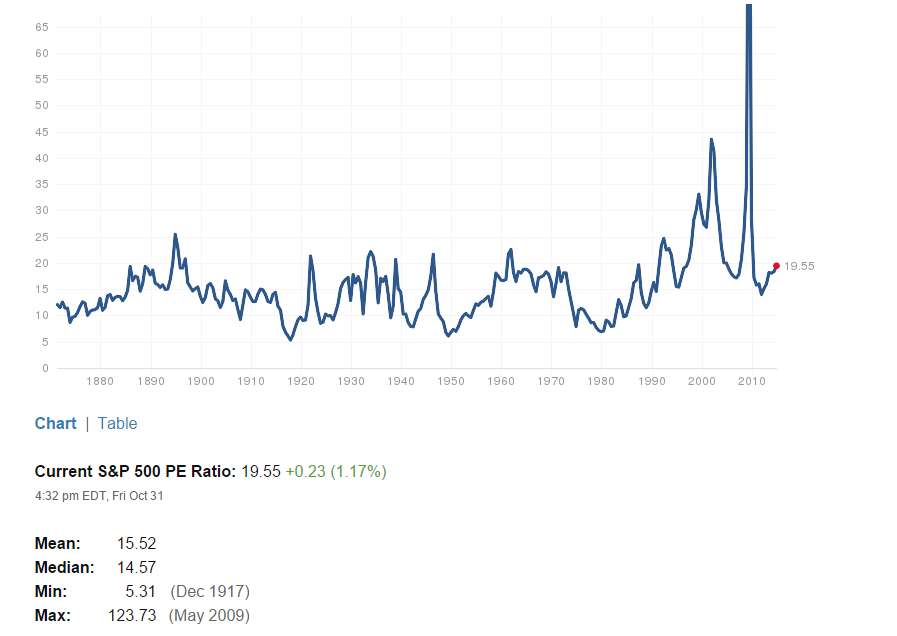
The S&P500 has reached a new high and many would be thinking that stock prices must also be at all time highs. The S&P500 P/E ratio tells a bit of a different story here though.
Chinese Manufacturing PMI was released on Saturday and came in below expectation although still above the key 50 level. Traders need to watch for any market reaction to this news, especially for the AUD and NZD pairs.
Events in the Ukraine and the Middle East, as well as with Ebola, continue to have the potential to undermine any developing ‘risk’ appetite and need to be monitored.
Stocks and broader market sentiment:
Stocks continued with their extraordinary recovery last week and a few of the most noteworthy achievements include:
- The four US indices, the S&P500, DJIA, NASDAQ and Russell 2000, printed large bullish weekly candles and also bullish monthly candles.
- The S&P500 and DJIA both achieved a record monthly close.
- The Russell 2000 ‘small caps’ index appears to have made a ‘Bull Flag’ breakout.
- The S&P500 printed a bullish engulfing candle for October and closed above the key 2,000 level.
Some traders will be looking at these highs and thinking stocks must be at extremes and way too expensive. The current S&P500 P/E ratio might shed a bit of light here and put the index in some perspective. Sitting just under 20, the P/E ratio is only a bit higher than the historical mean and median. I am trading a basket of stocks many of which are well off their all time highs. I would expect that demand could remain high, even at these levels, whist US interest rates remain low and traders and investors seek yield:
S&P500 P/E ratio:
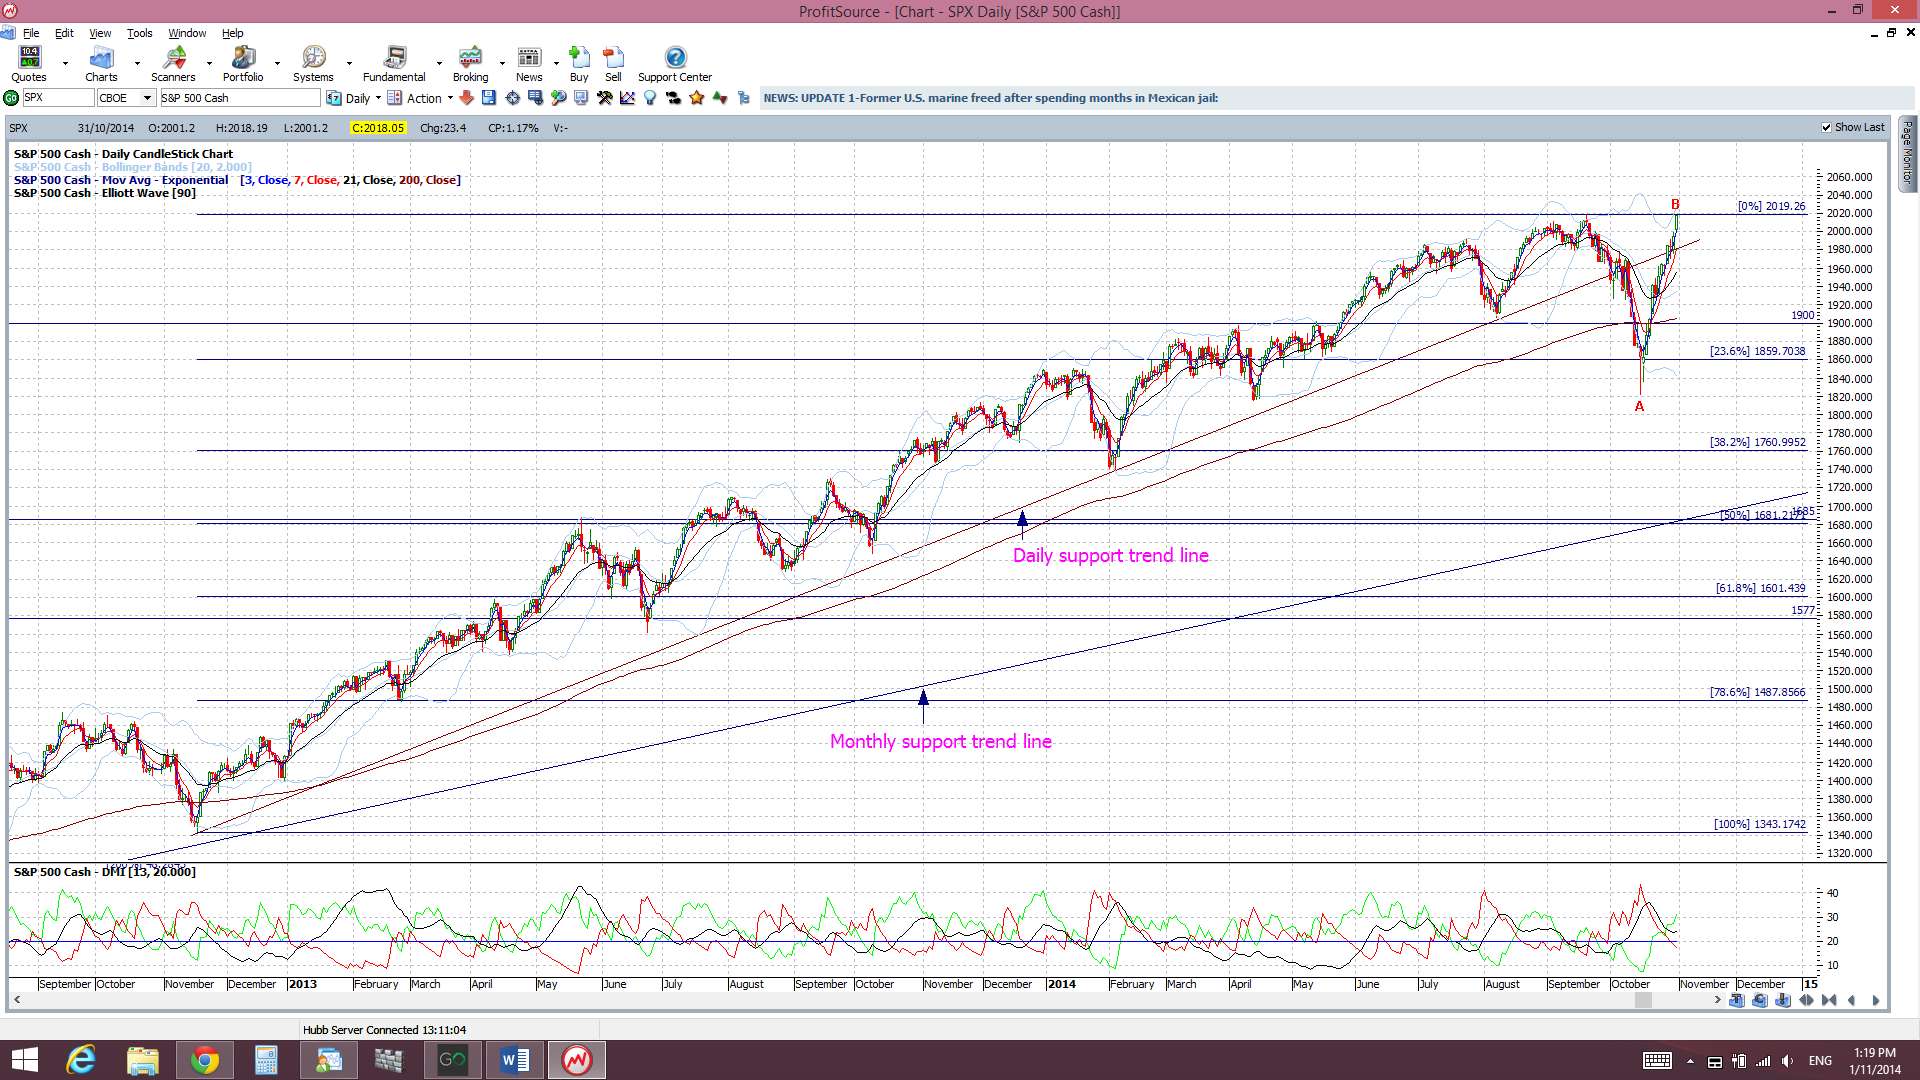
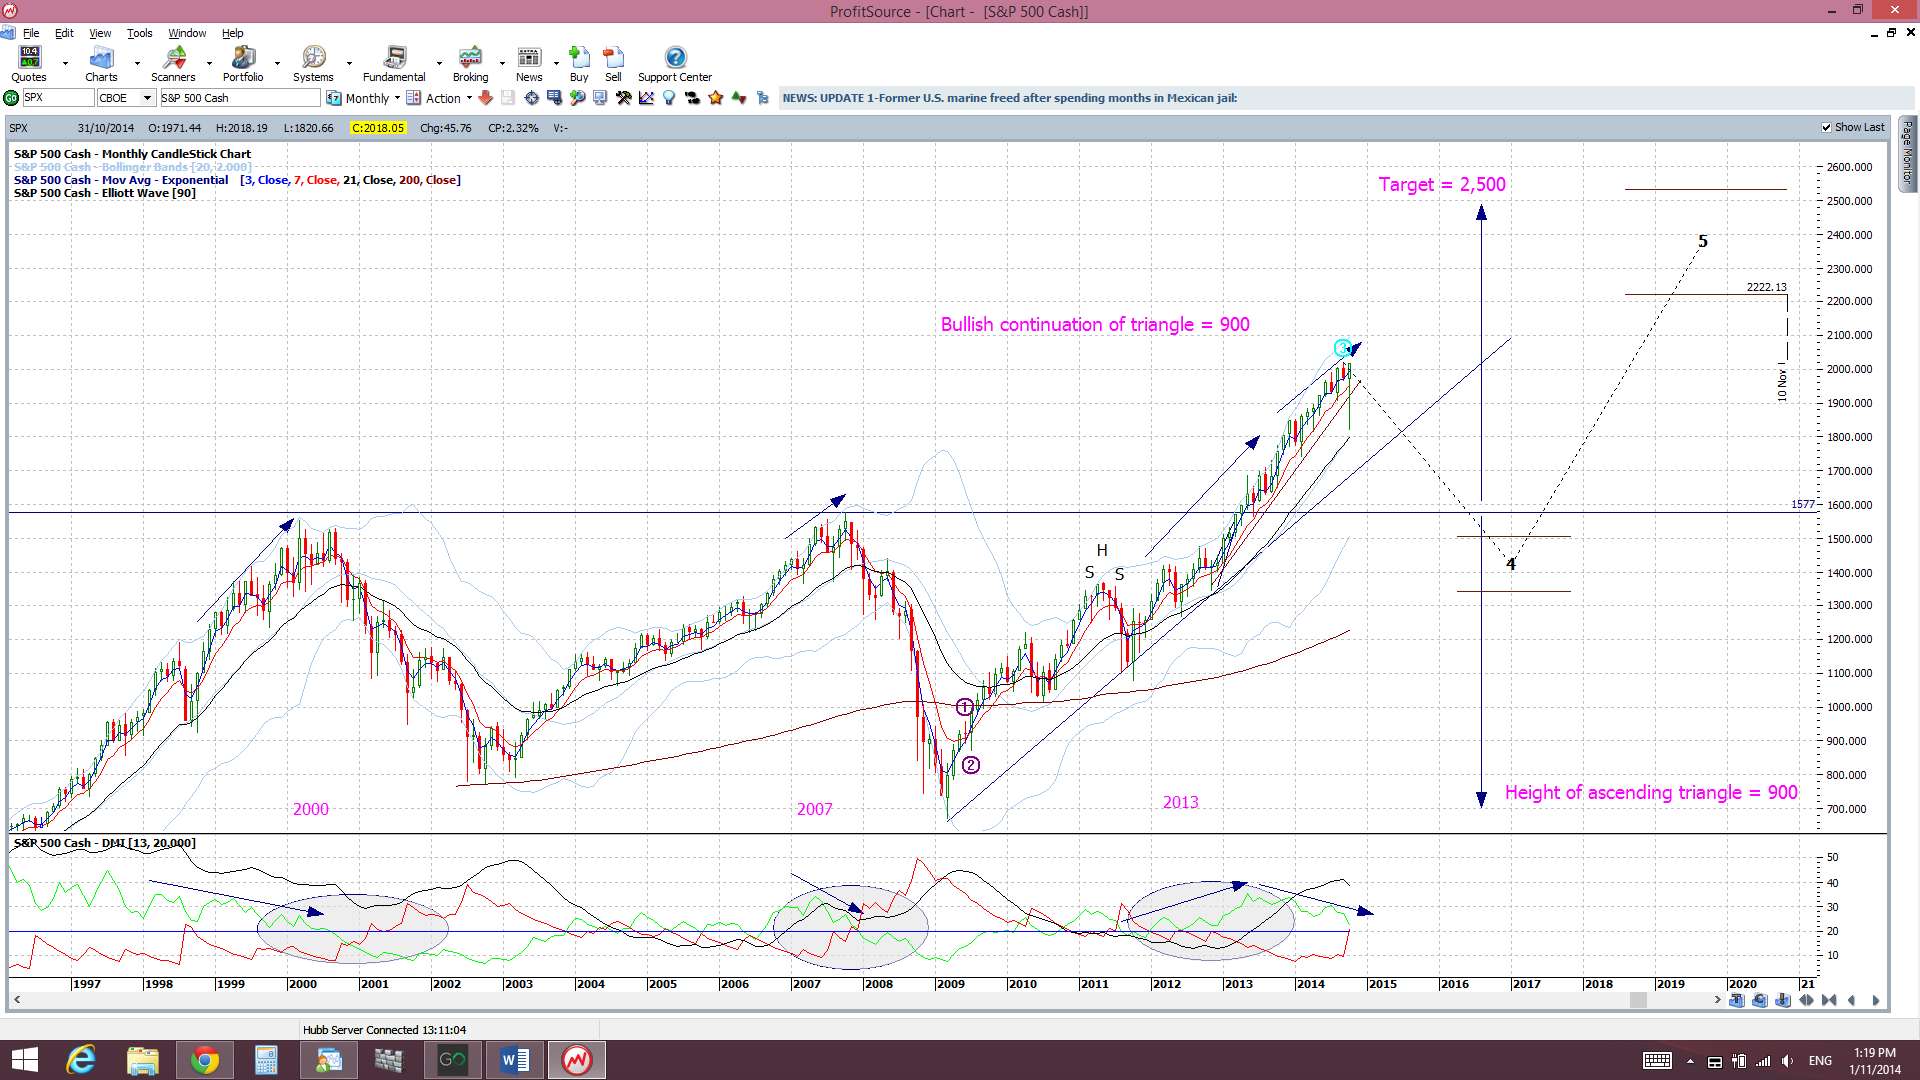
However, I am still seeing some technical divergence on the monthly S&P500 monthly chart and whilst this might just be warning of a pause, as the index navigates these new highs up at the 2000 region, the chance of a pullback cannot be ruled out either. There has not been any real deep pull back since the break up through the 1,577, 1,600, 1,700 and 1,800 levels and the major break of the 1,577 level was only tested once.
Thus, with all of this, I continue to watch out for further clues as to any new momentum move, long or short though! In particular I’m looking out for:
S&P500 daily chart: The index is back above the previous daily trend line and also above the key 2,000 level.
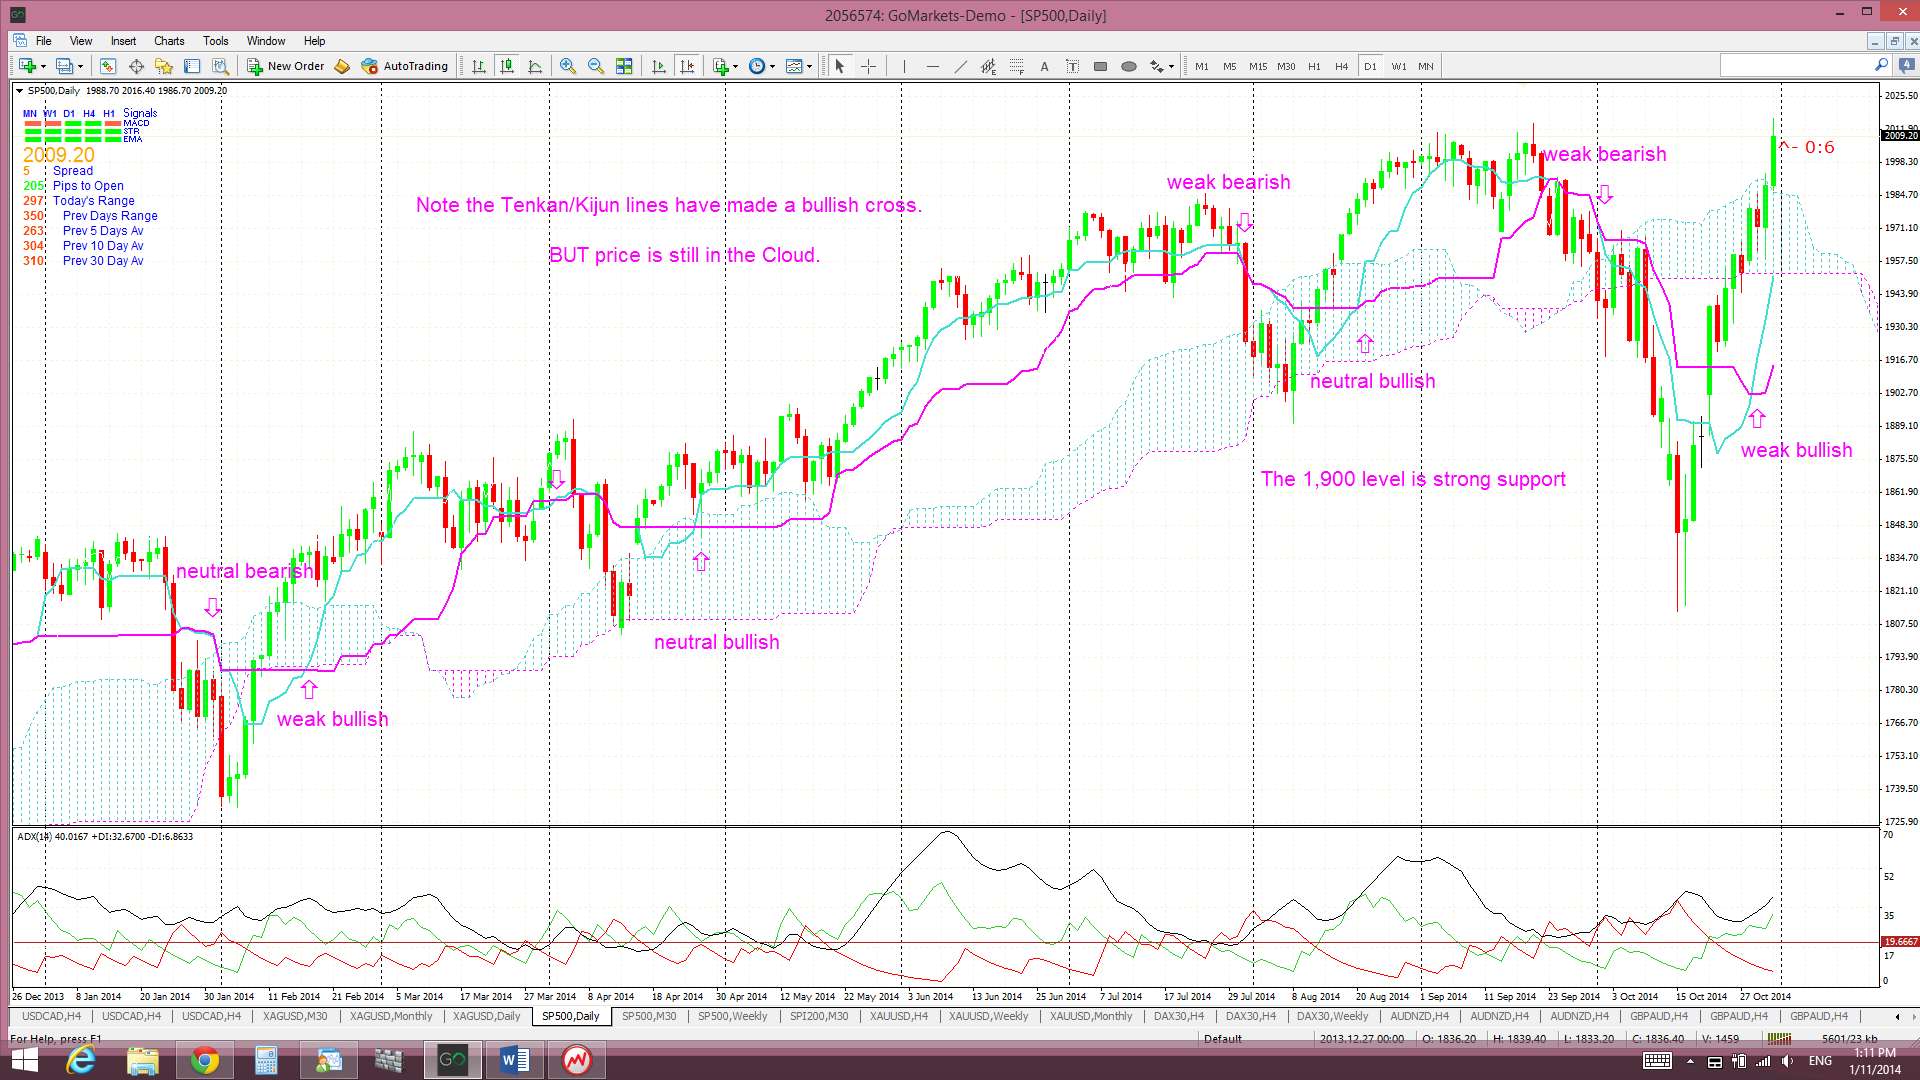
Ichimoku S&P500 chart: a clear cross of the blue Tenkan-sen line below the pink Kijun-sen line. There has been a recent bullish Tenkan/Kijun cross and the index is back trading above the Cloud.
S&P500 monthly chart: a break of the monthly support trend line (see monthly chart). The monthly trend line remains intact.
Russell 2000 Index: this ‘small caps’ index is a bit of a US market ‘bellwether’ and I see the 1,080 level as key support here. The index closed above this key support and has now also made a ‘Bull Flag’ breakout:

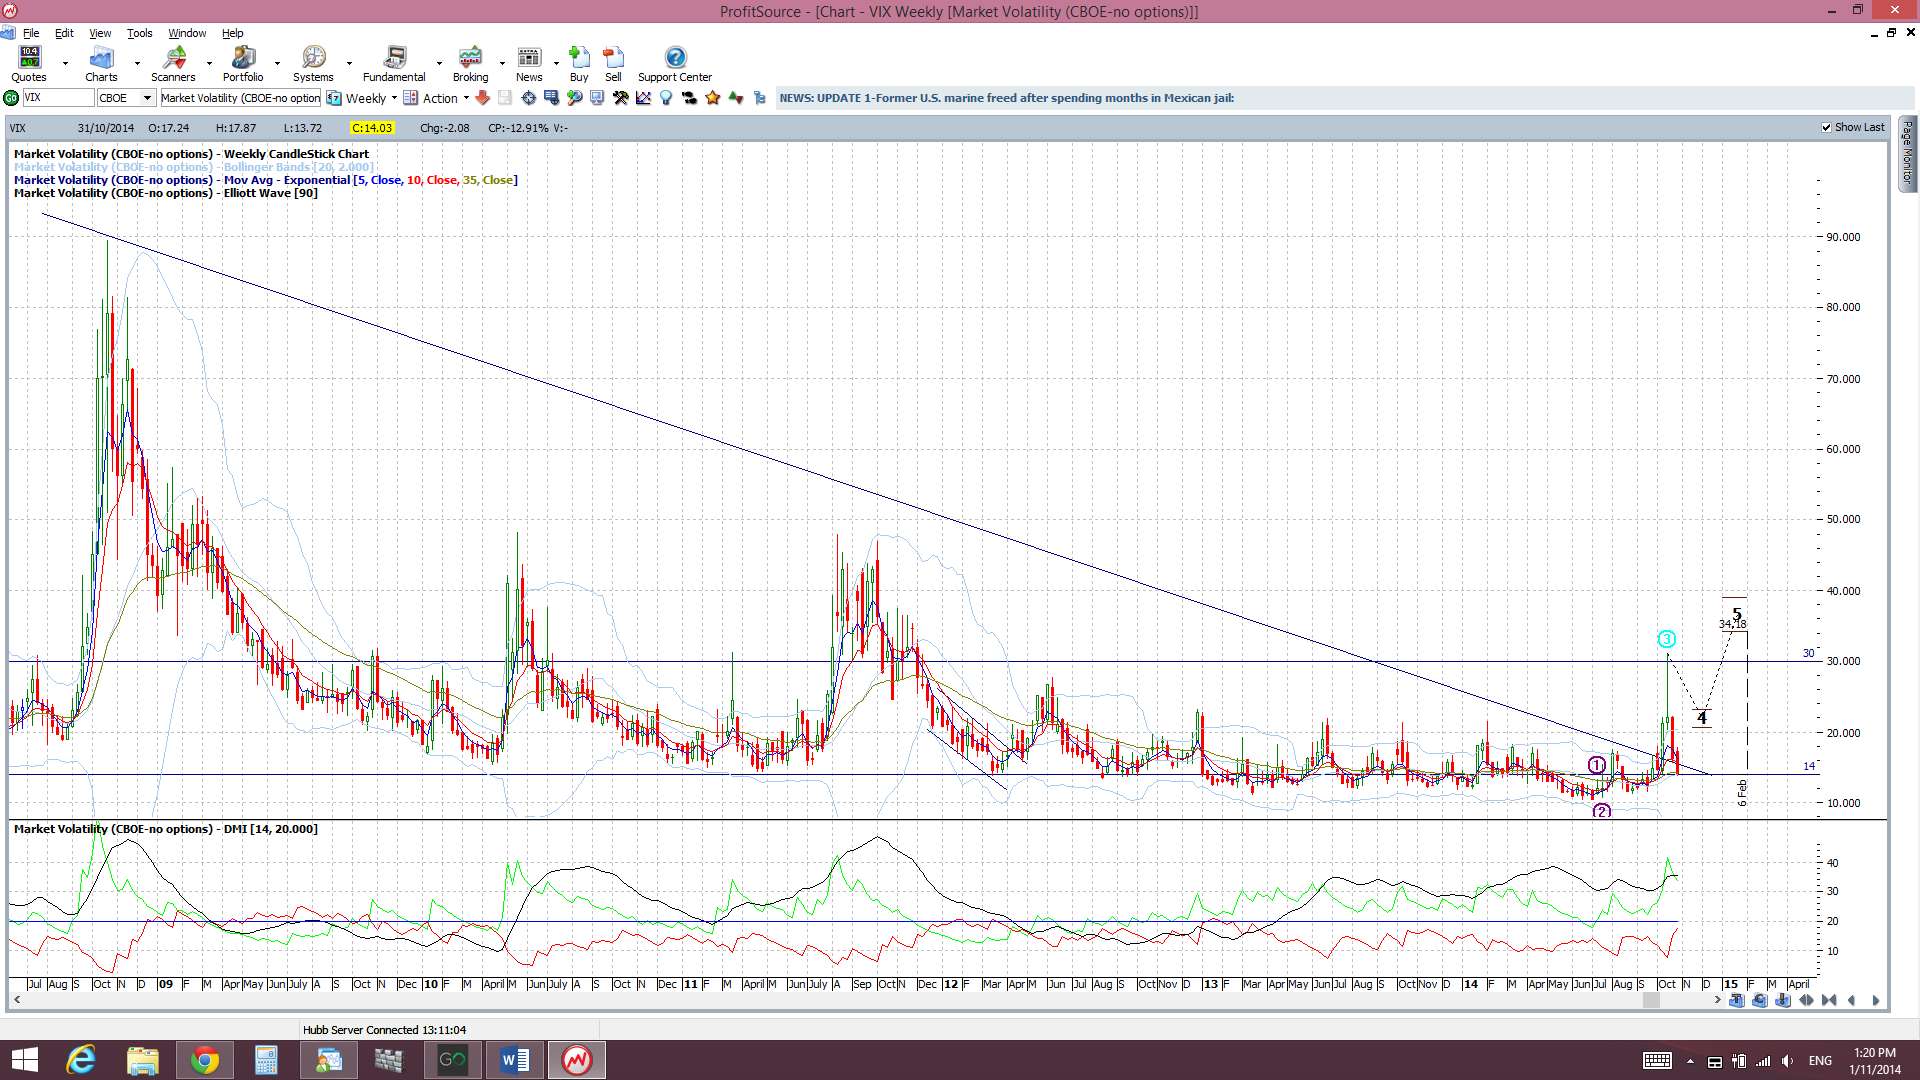
VIX Index: this recently broke up and out of a descending triangle pattern but is back below the 20 level.
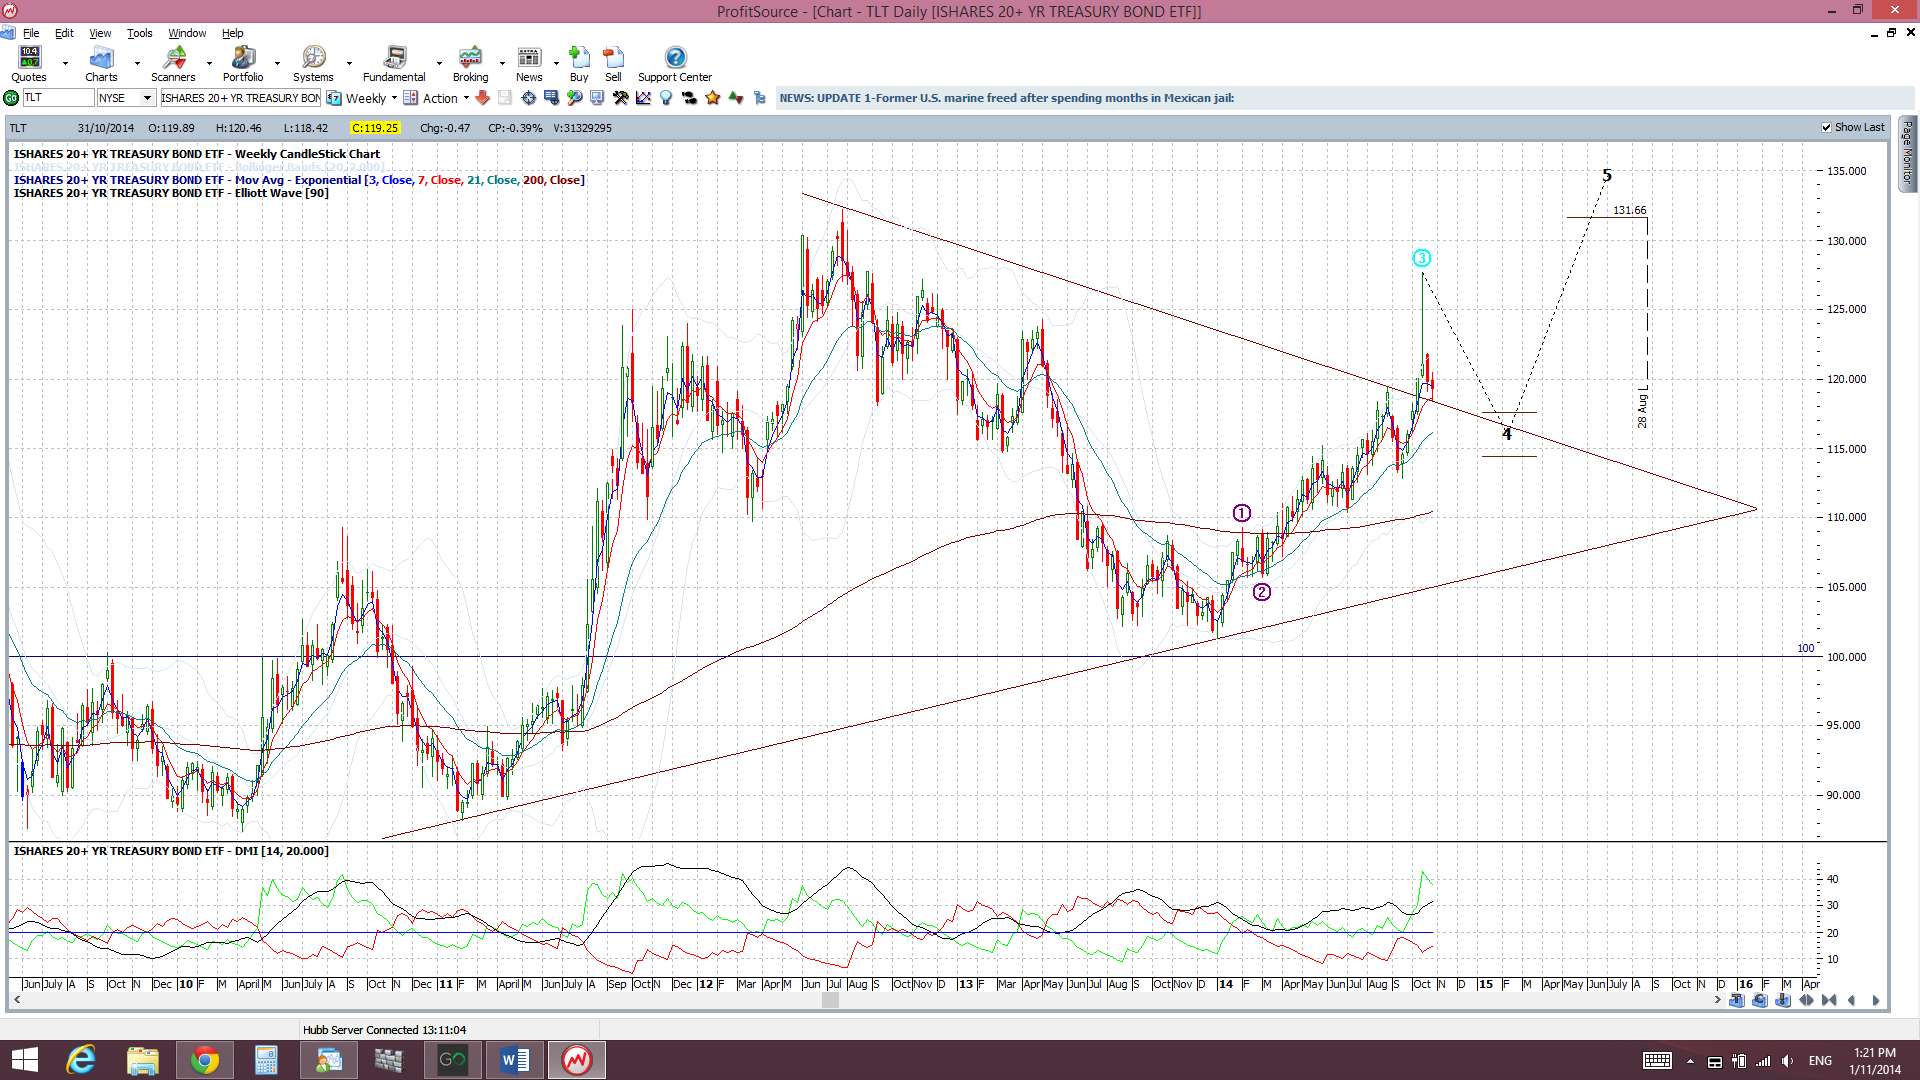
Bonds: The bond ETF remains above the triangle breakout:
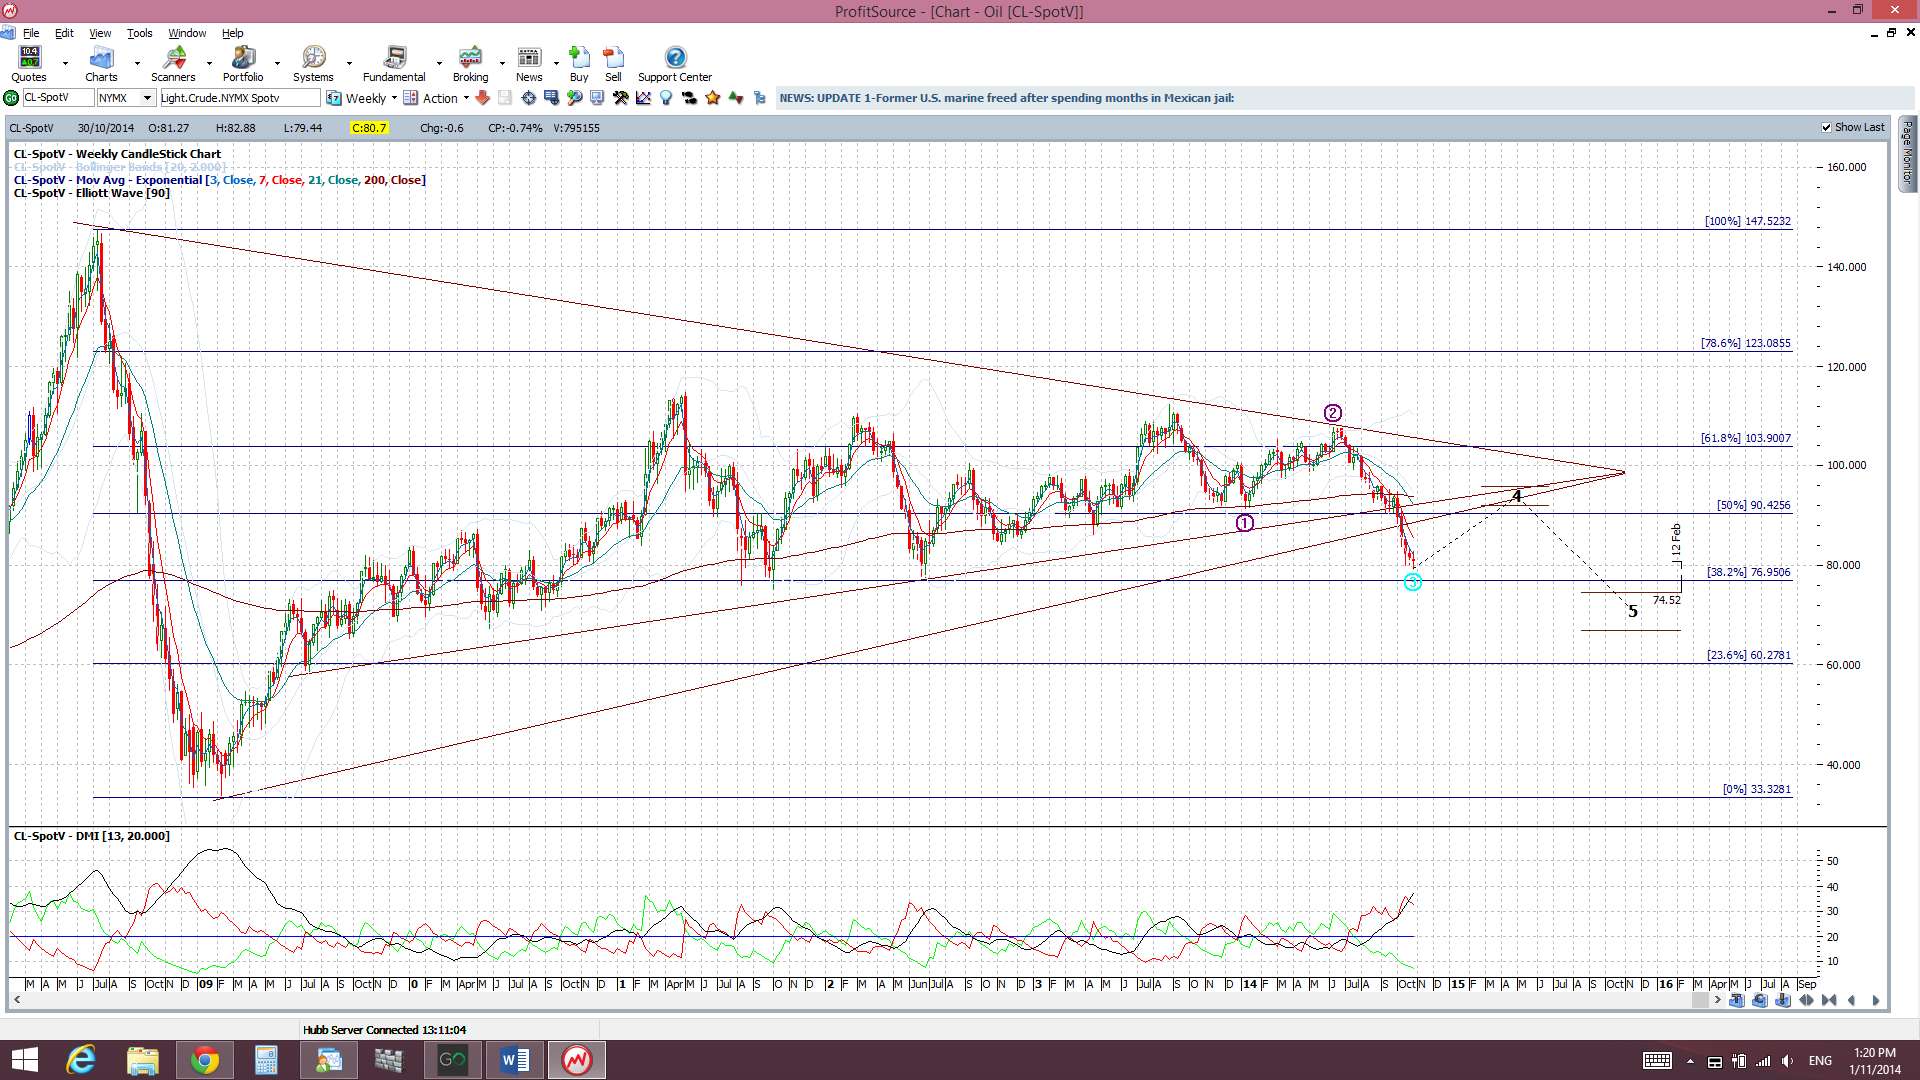
Oil: Oil remains bearish after the triangle breakdown but is managing to hold above $80 support:
Trading Calendar Items to watch out for:
- Sat 1st: CNY Manufacturing PMI. (result was below expectation but still above 50)
- Mon 3rd: JPY Bank Holiday. AUD Building approvals. CNY HSBC Final Manufacturing PMI. GBP Manufacturing PMI. USD ISM Manufacturing PMI. CAD BoC Gov Poloz speaks.
- Tue 4th: AUD Retail Sales, Trade Balance, Cash rate & RBA statement. GBP Construction PMI. CAD Trade Balance. USD Trade Balance.
- Wed 5th: NZD GDT Price Index & Employment data. JPY BoJ Gov Kuroda speaks. GBP Services PMI. USD ADP NFP & ISM Non-Manufacturing PMI.
- Thurs 6th: AUD Employment data. GBP Manufacturing production & Interest Rates. EUR Interest rates & press conference. CAD Building permits & Ivey PMI. USD Unemployment claims.
- Fri 7th: AUD RBA Monetary Policy statement. CAD Employment data. USD NFP.
- Sat 8th: CNY Trade Balance.
Forex:
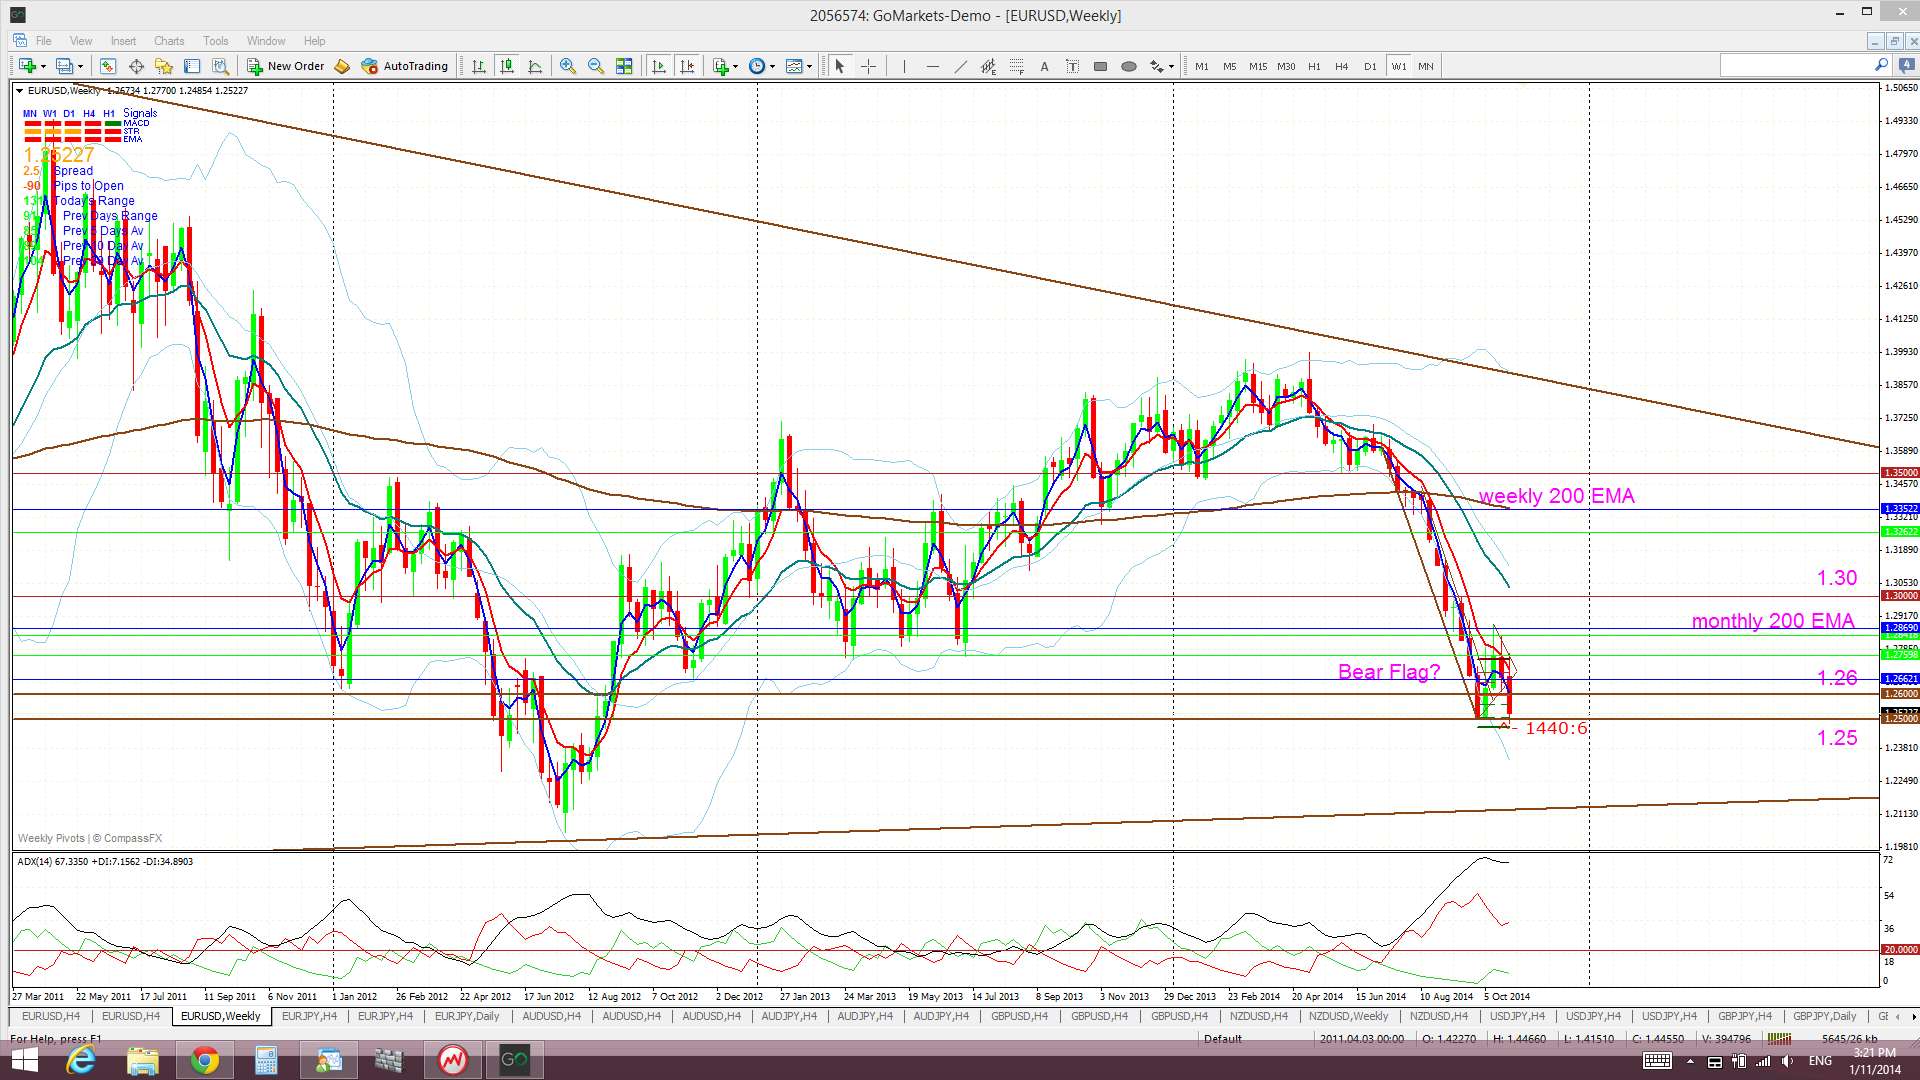
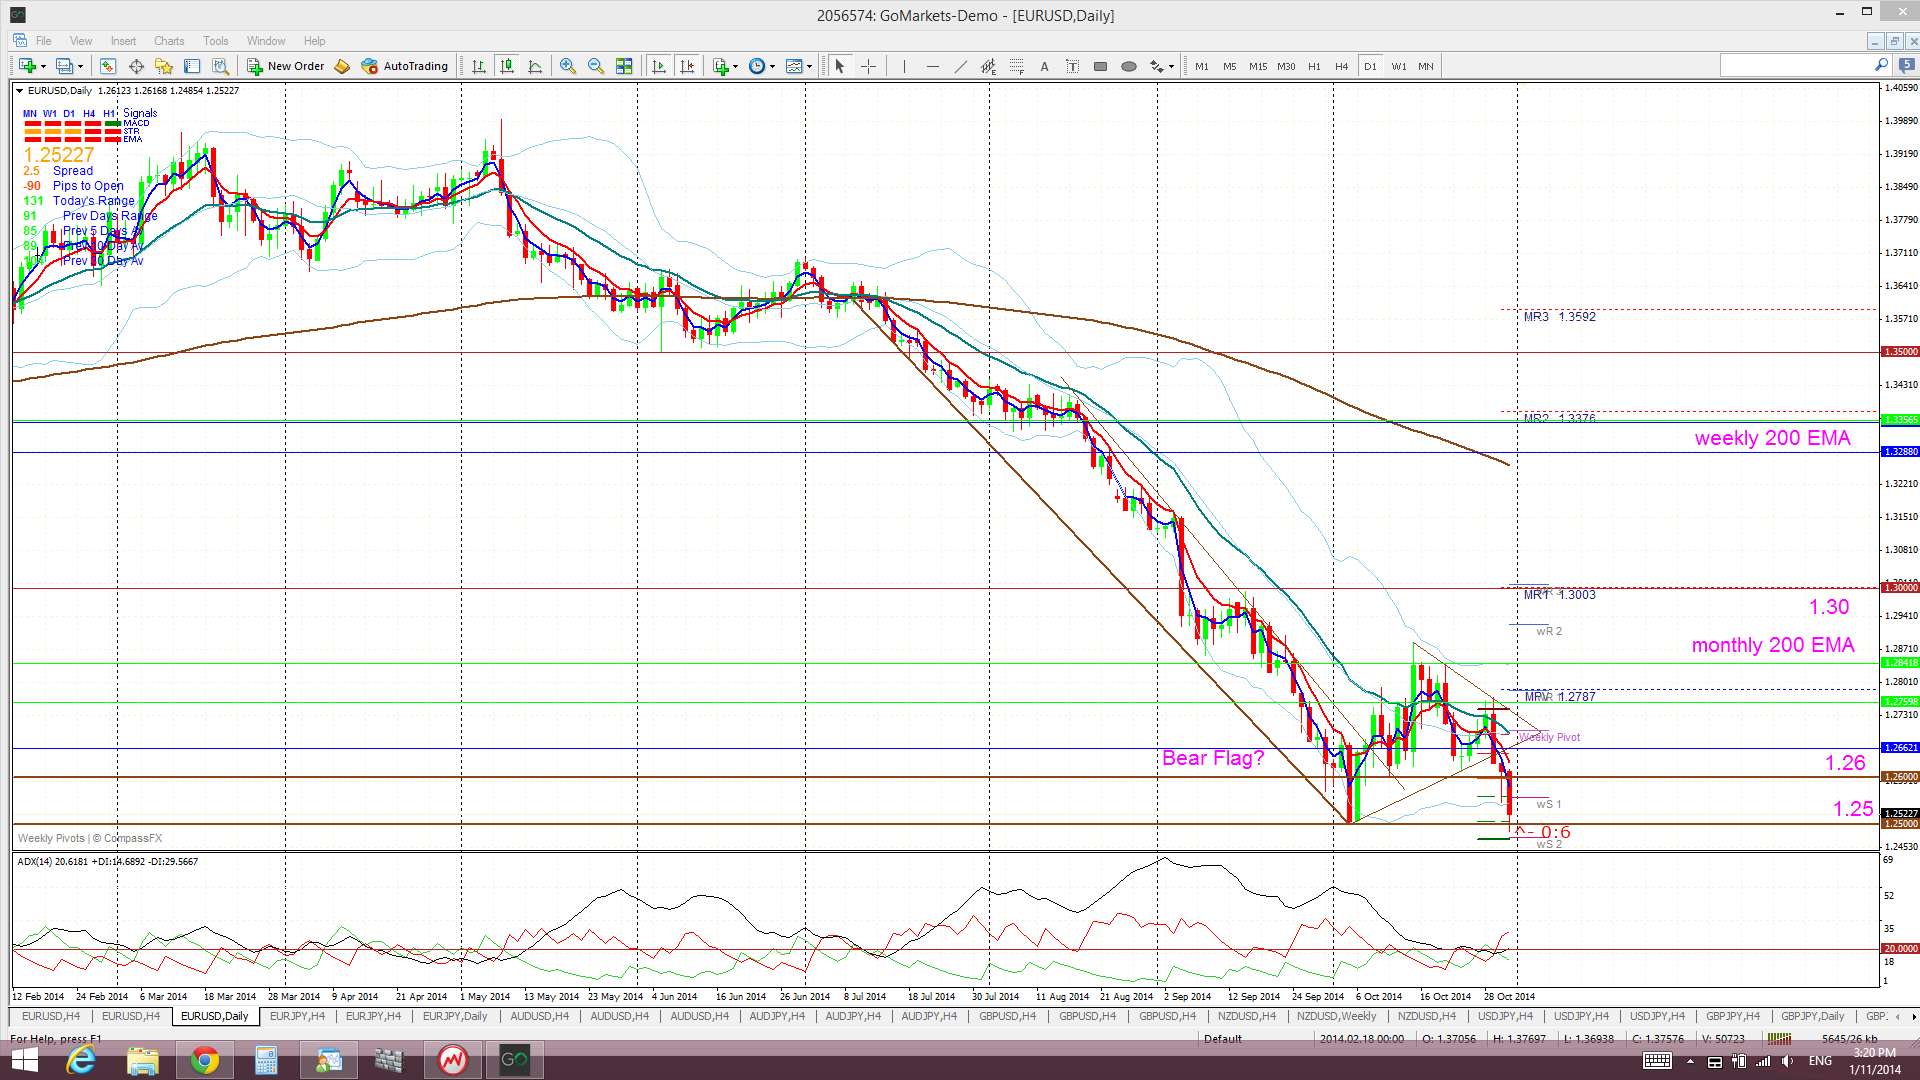
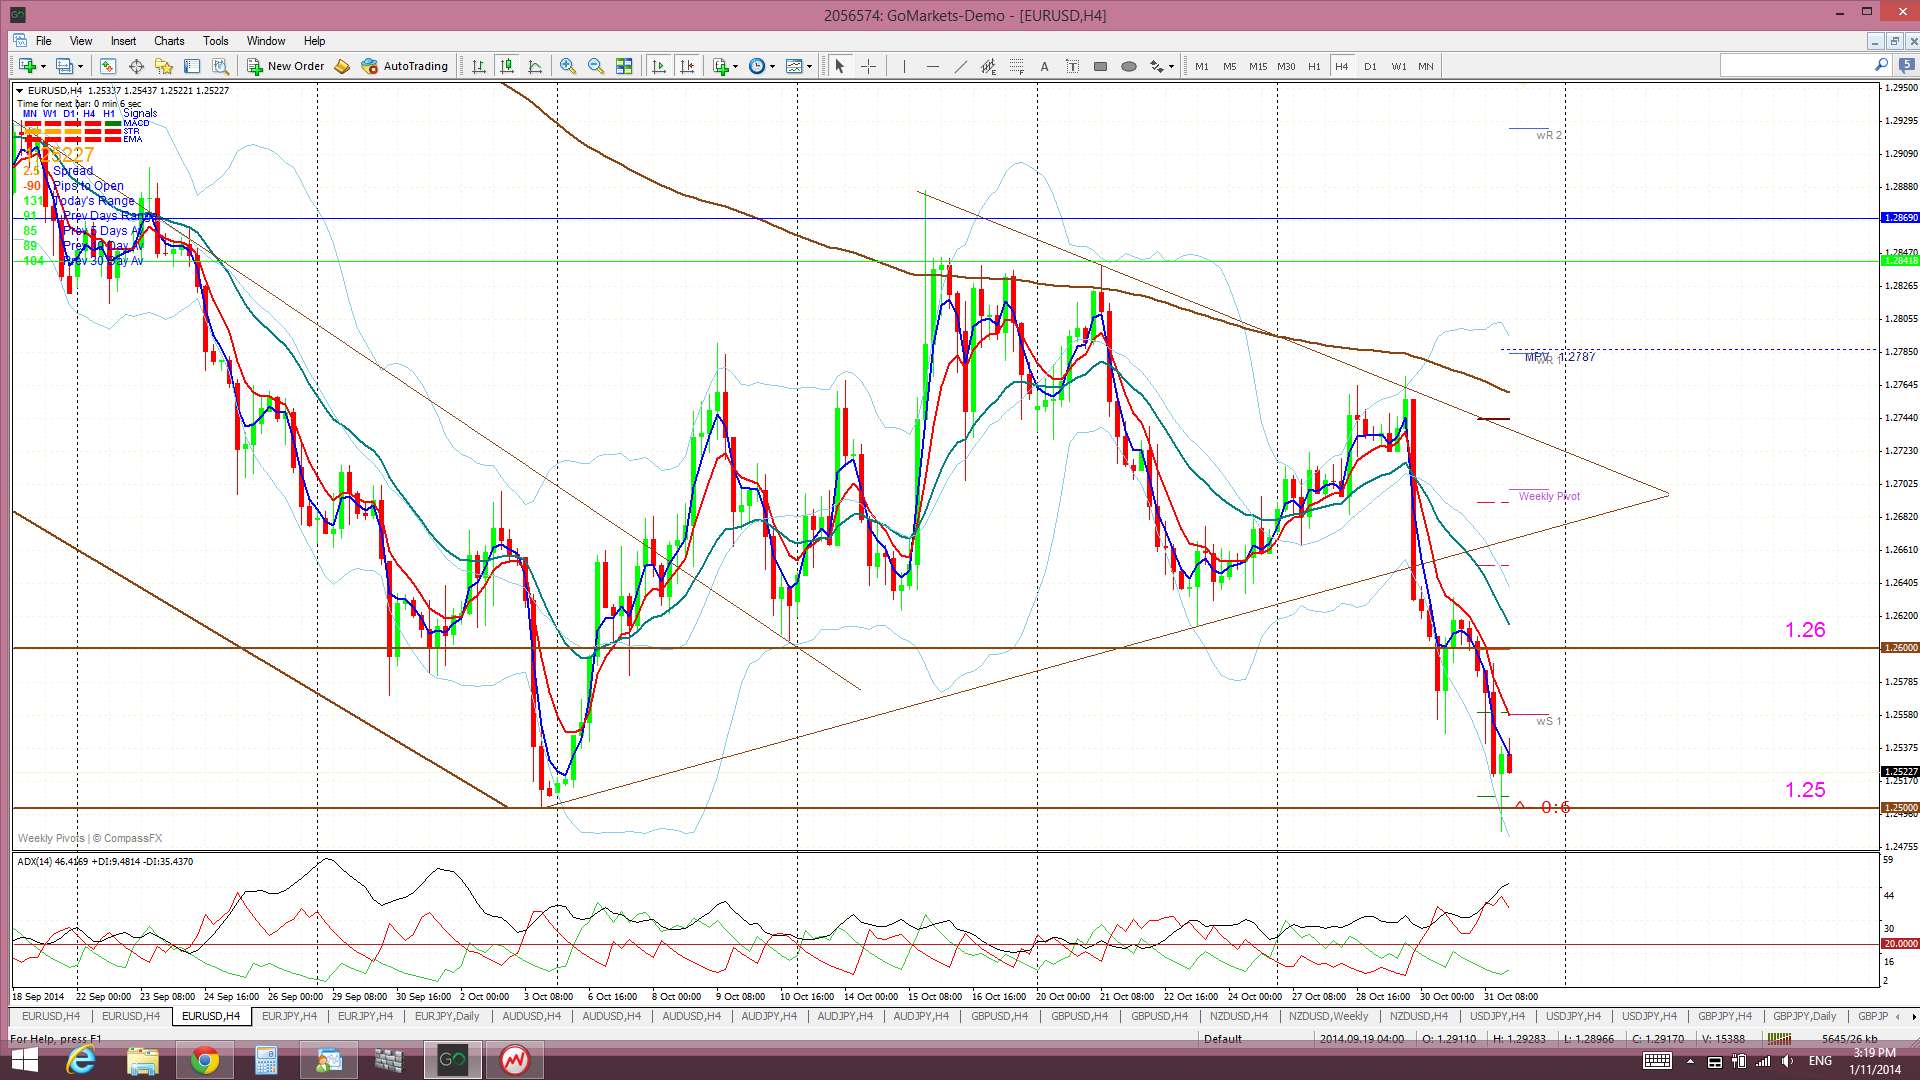
E/U: The E/U chopped higher ahead of FOMC but USD strength following this news sent the E/U tumbling. The 1.26 level was tested a few times after that but it managed to support price until Friday. BoJ easing caught the market by surprise and the resulting USD rally ended up pushing the E/U below 1.26 support and down to 1.25. I am still seeing a ‘Bear Flag’ building here and, whilst the 4hr chart shows the Bear Flag trend line to have broken already, the 1.25 level remains the ‘line in the sand’ level for me as explained below.
Bear Flag: The daily chart shows the developing ‘Bear Flag’ on the E/U. The ‘Flag Pole’ of this pattern is about 1,000 pips. This is minimum target as I have only measured the daily chart’s trading channel. Thus, technical theory would suggest a continuation move of at least about 1,000 pips. The bear trend line of this Flag has already been broken BUT I will be waiting for any close and hold below 1.25 to confirm this breakout. If so, then I’ll be looking for a possible target down near 1.18, being the triangle base, and then 1.15, being the ‘Bear Flag’ target.
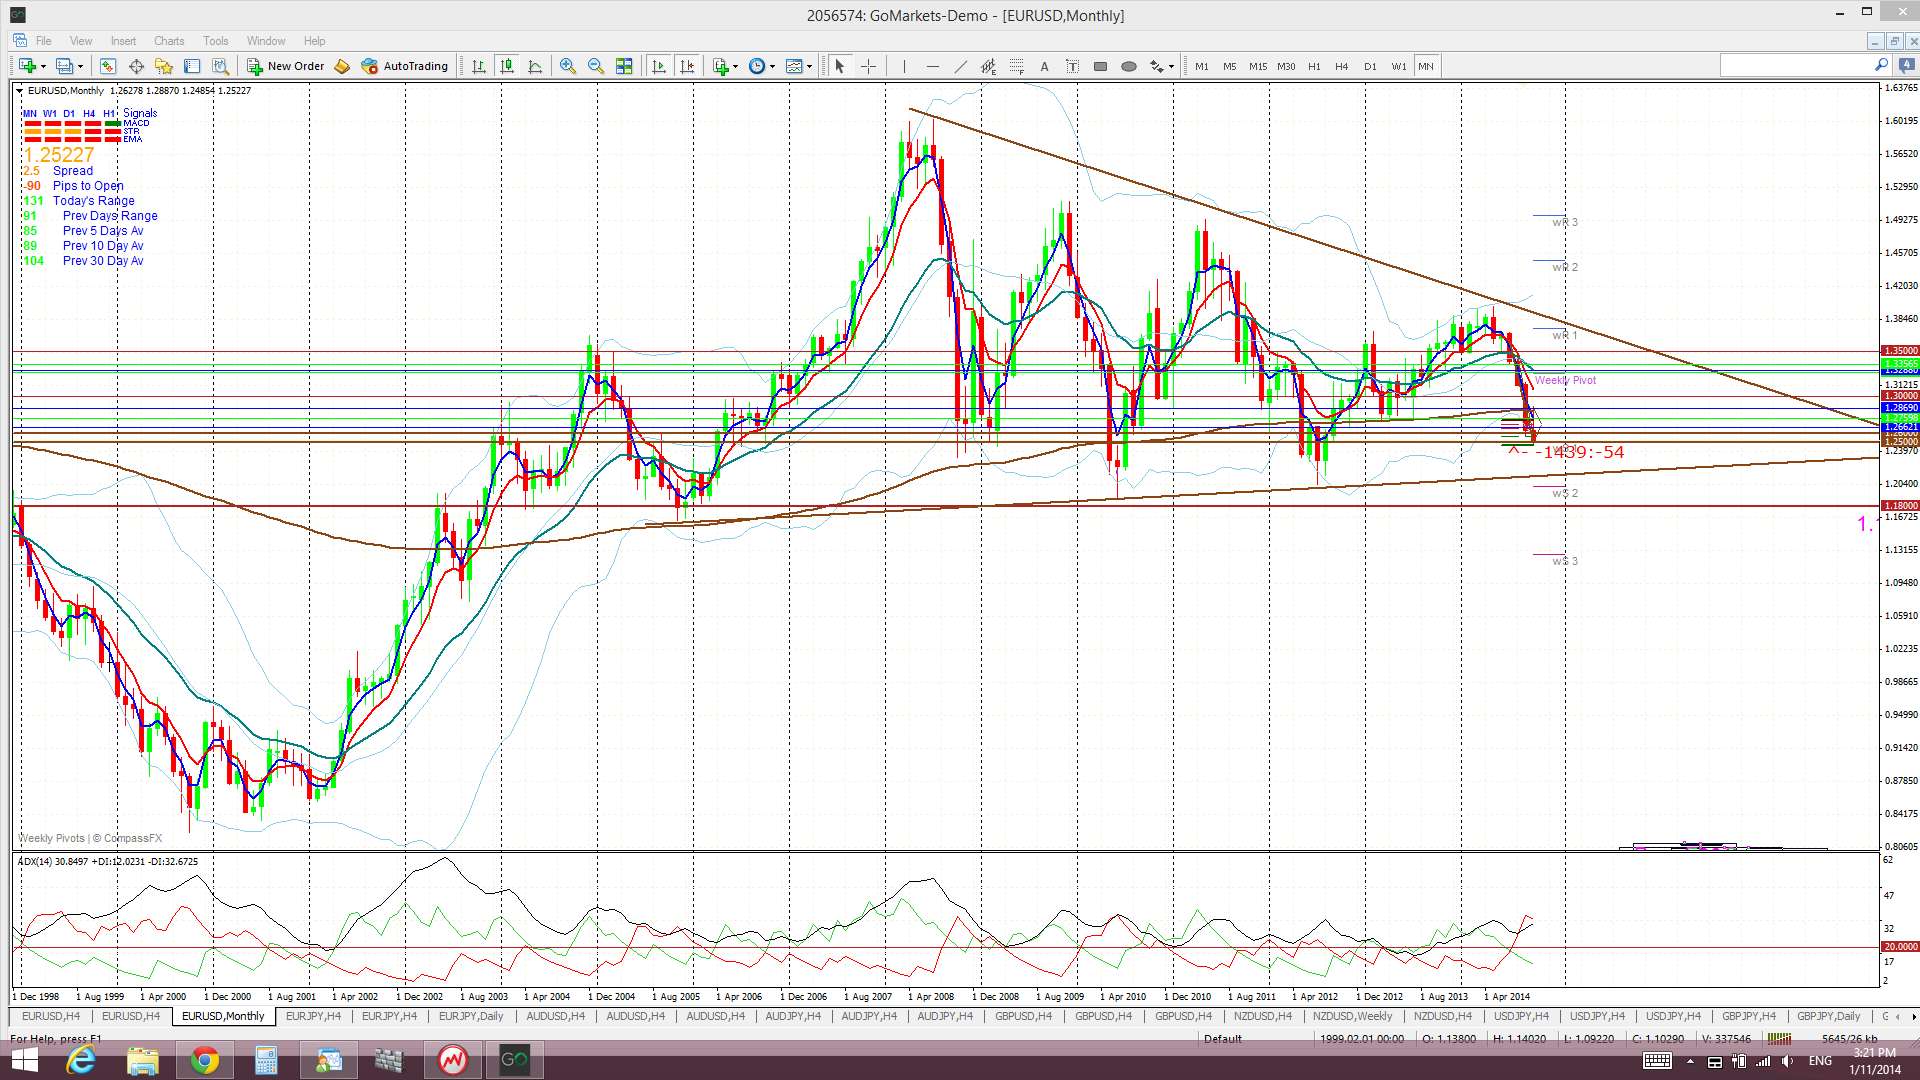
Traders need to remember that this pair is also trading within a bearish descending triangle pattern on the larger-scale monthly chart.
Descending triangle on the monthly chart: the descending triangle pattern is a bearish continuation pattern and has a base at around the 1.18 level. The height of this triangle is about 4,000 pips. Technical theory would suggest that any bearish breakdown of this triangle at 1.18 might see a similar move. It is worth noting that this would bring the E/U down near 0.80 and to levels not seen since 2000/2001!
Price is still trading below the Ichimoku Cloud on the 4hr, daily, weekly and monthly charts which is bearish.
The weekly candle closed as a large bearish candle. The monthly candle was bearish; the fourth in a row.
ECB interest rate data is not released until Thursday and I would not be surprised to see price battle it out near 1.25 until then. NFP on Friday will be significant here too. Ant further discussion of ECB easing could trigger the start of the Bear Flag.
- I’m watching for a new TC signal on this pair, the Bear Flag and the 1.25 level.
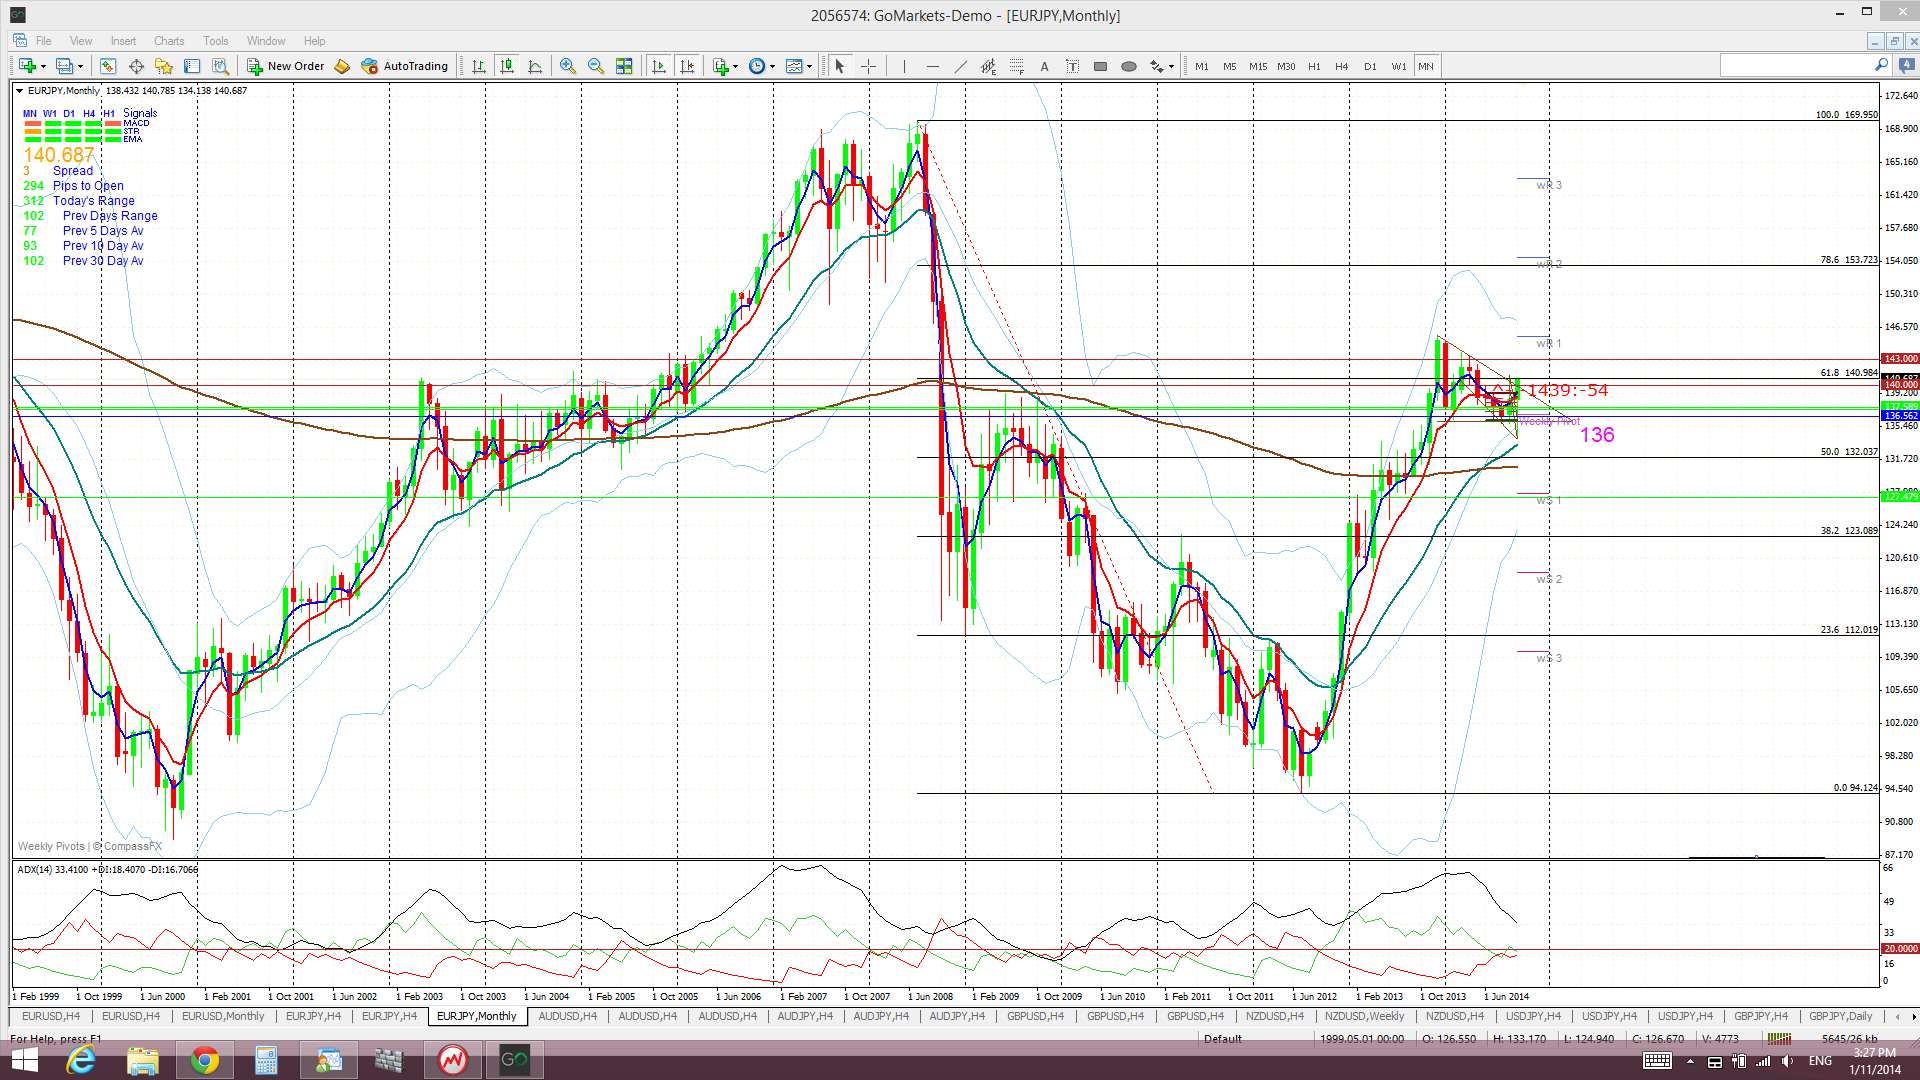
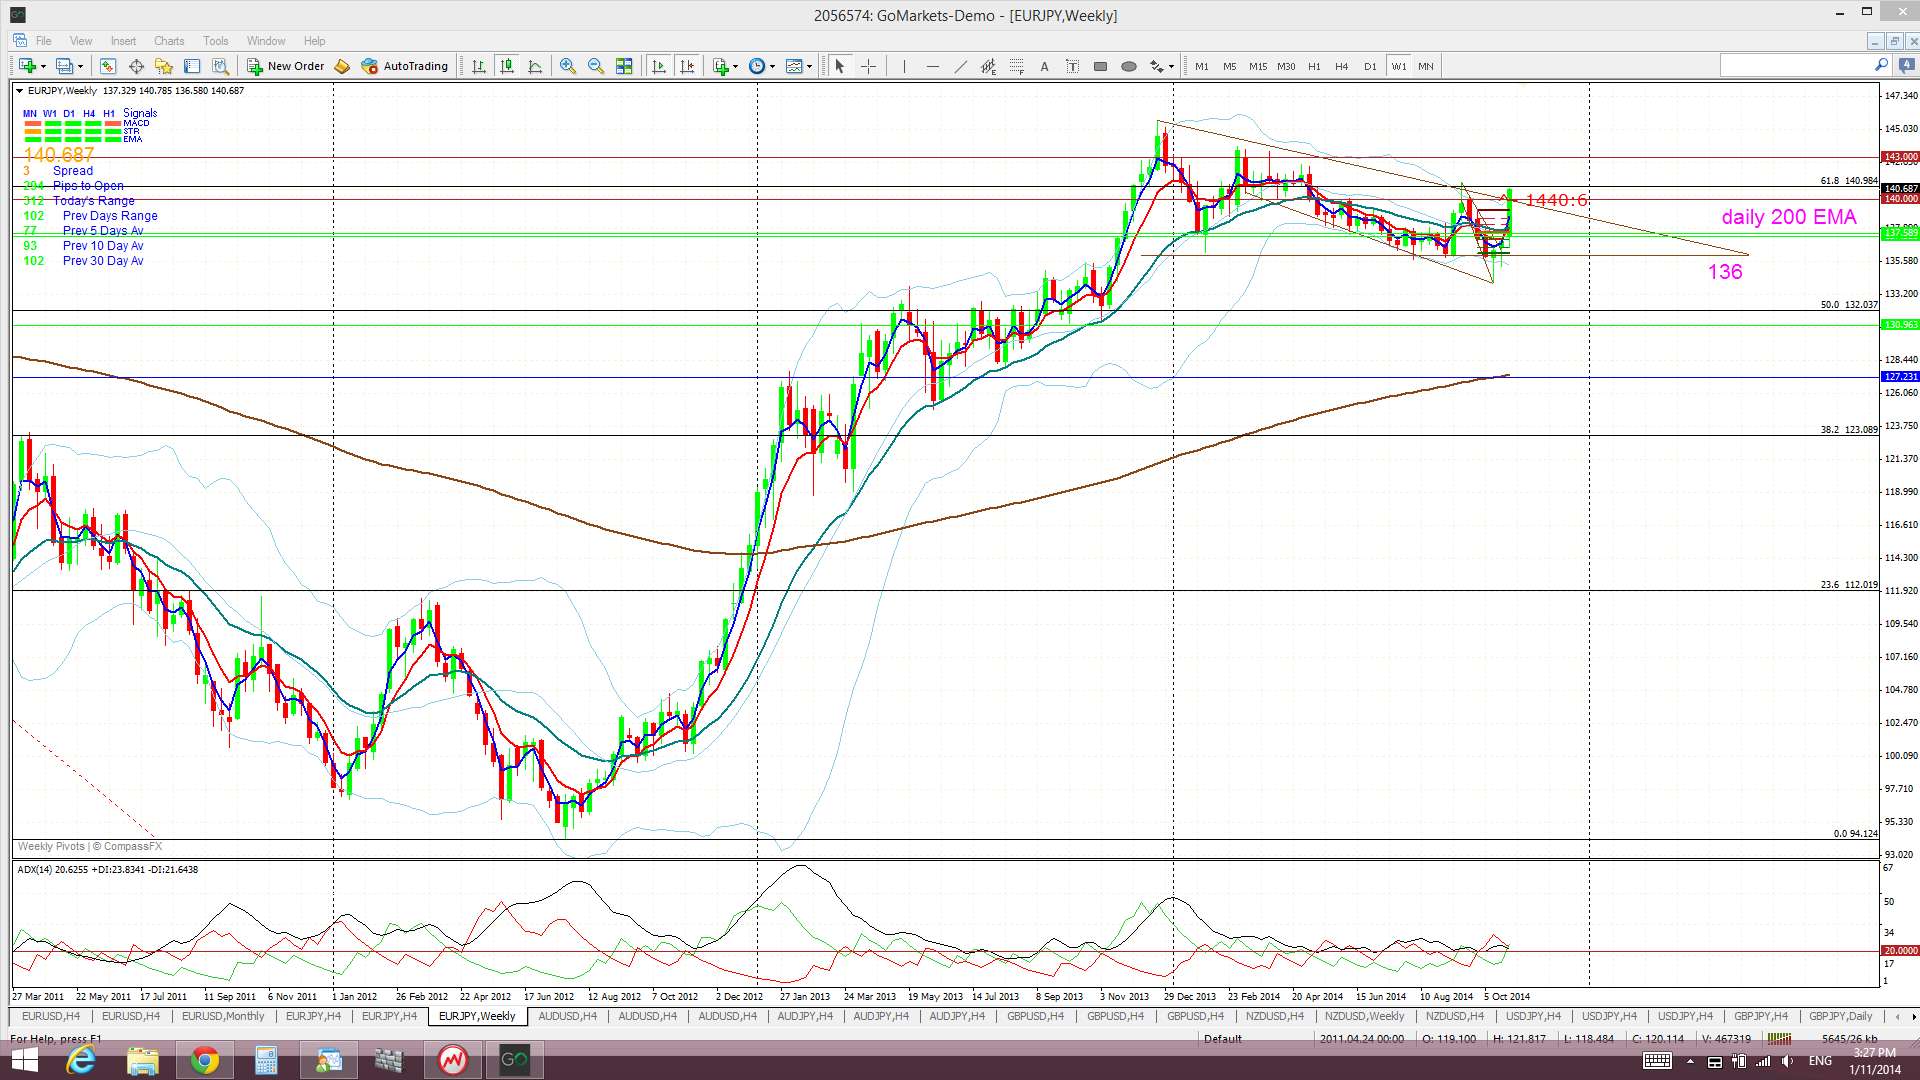
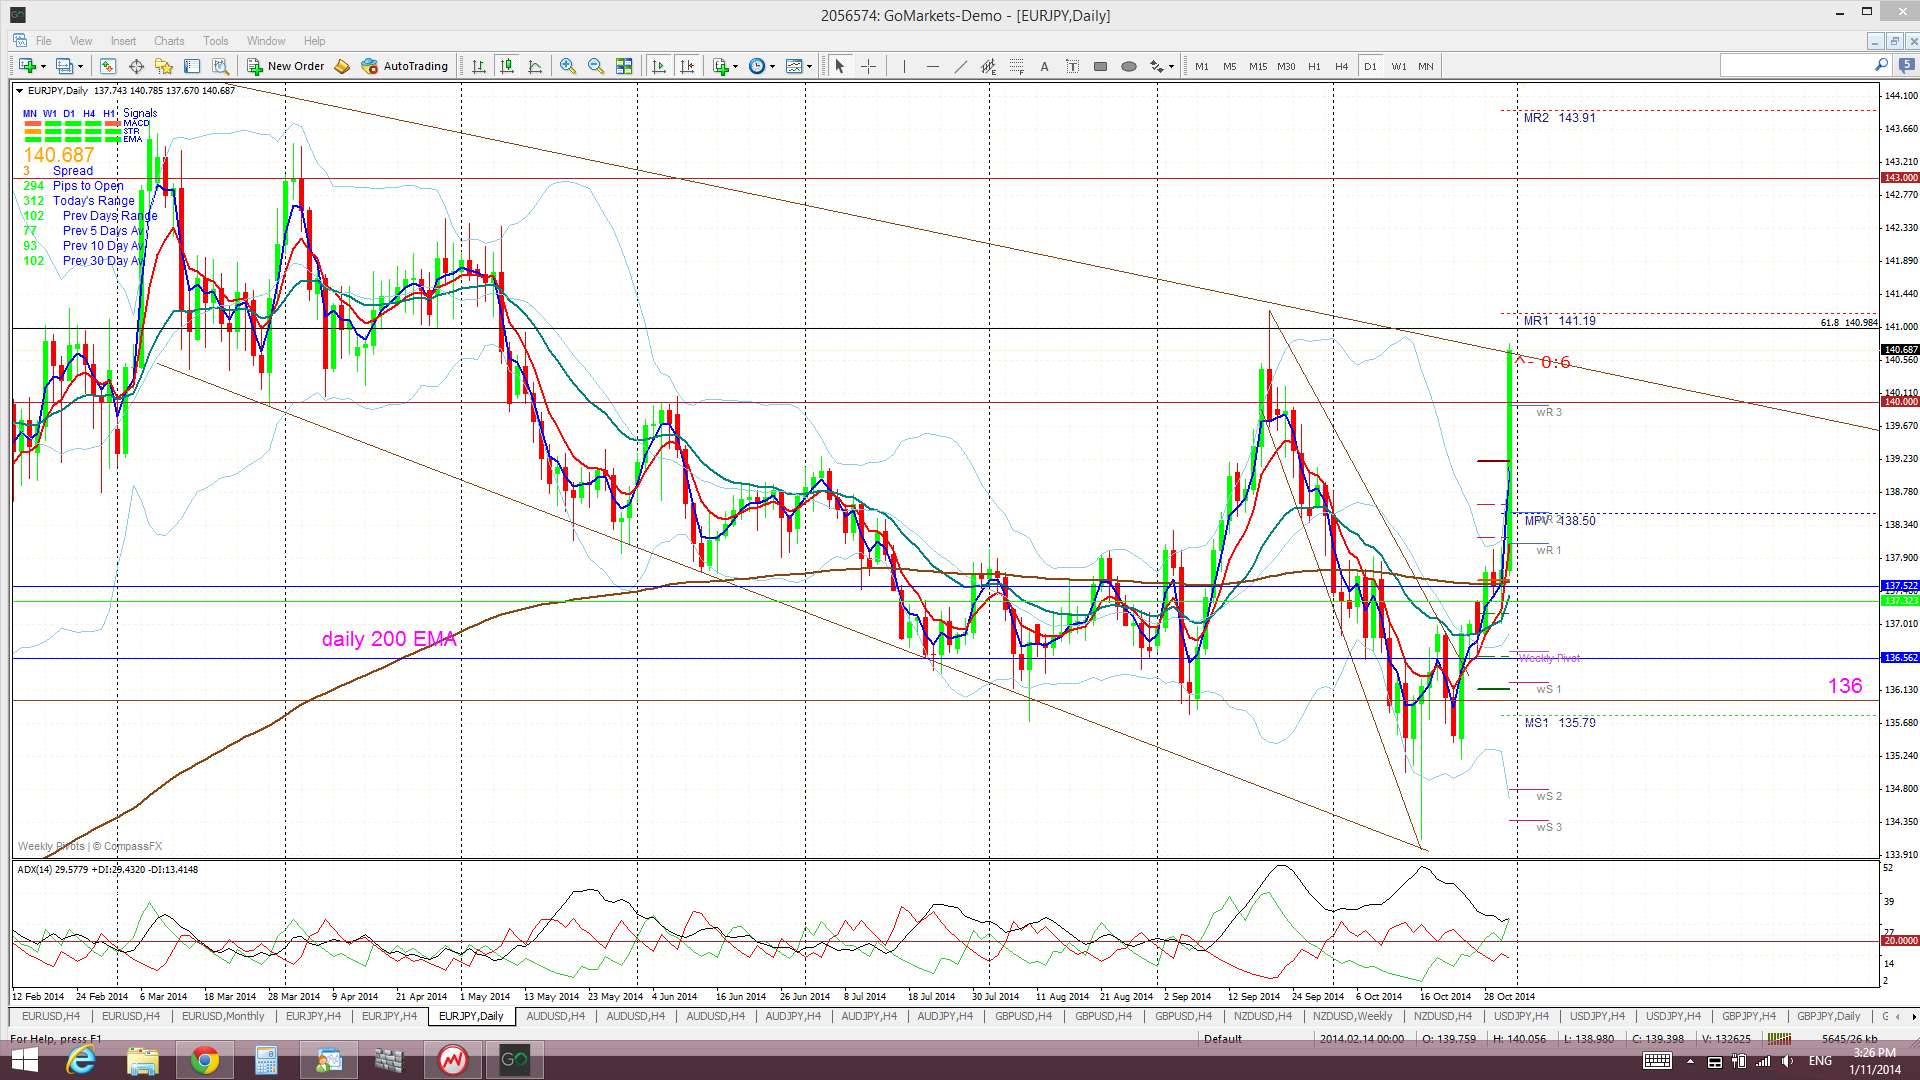
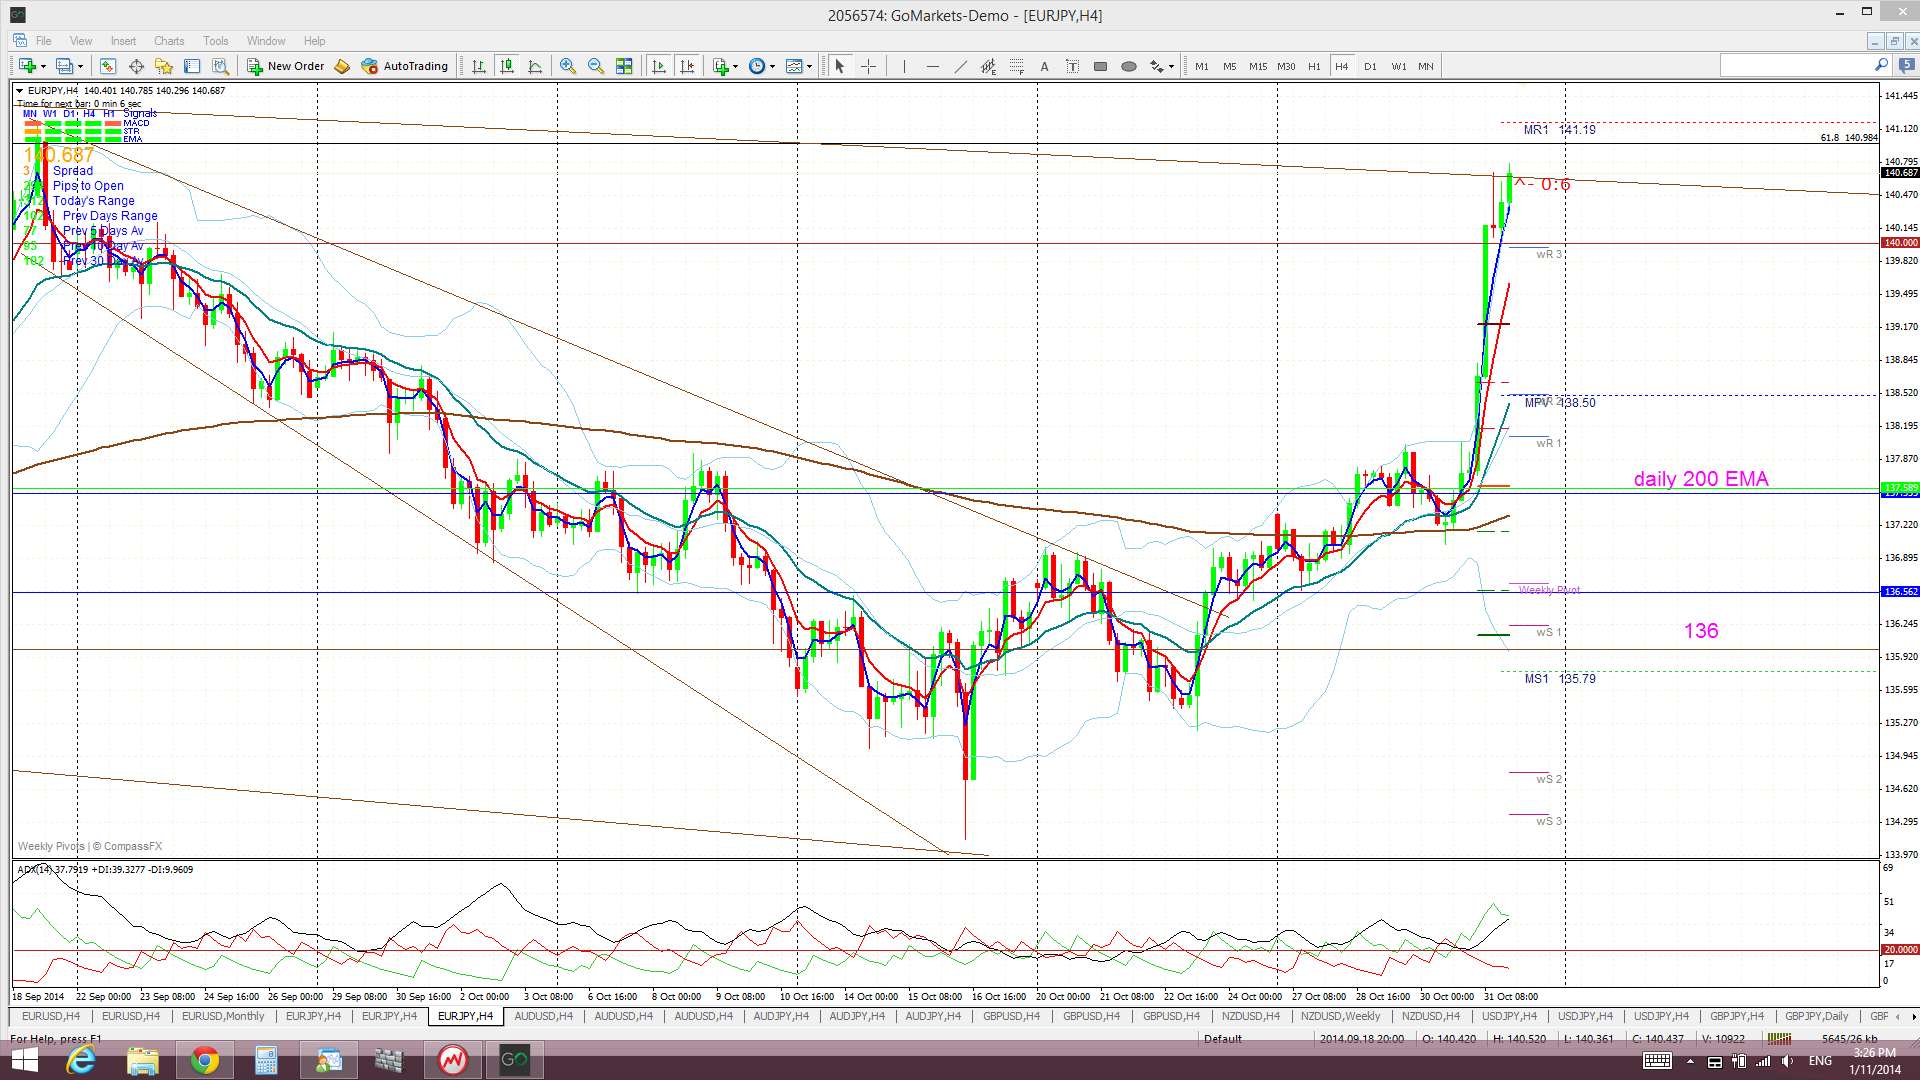
E/J: The E/J spent the first part of last week drifting higher after the previous week’s bullish wedge breakout. It then chopped around ether side of the daily 200 EMA as this level has been strong S/R over recent months. BoJ easing on Friday though resulted in a significant rally for this pair and price ended up rocketing up to test the upper trend line of the weekly chart’s triangle pattern. It closed for the week sitting right on top of this trend line and also just under the important 61.8% fib of the 2008-2012 bear move and so this will be the region to watch next week. Any break and hold above the triangle trend line / 61.8% fib level OR pull back from there might allow for a new trade entry.
The weekly chart triangle is a descending triangle and these are often bearish patterns, however, this is still giving the weekly and monthly charts a bit of a ‘Bull Flag’ appearance and so I’m keeping an open mind here. The height of this triangle is about 900 pips and thus any bullish breakout would suggest a continuation move of 900 pips as well.
Price is now trading above the Cloud on the 4hr, daily, weekly and monthly charts which is a significant bullish development. The November and December candles were the first to close above the resistance of the monthly Ichimoku Cloud since 2008. Check out the monthly Cloud chart below. The E/J made its last break back above the Cloud in 2003 and the consolidation pattern following that breakout is very similar to the consolidation we’re seeing now. Note how, back then, price eventually rallied and I wonder if history will repeat itself here?
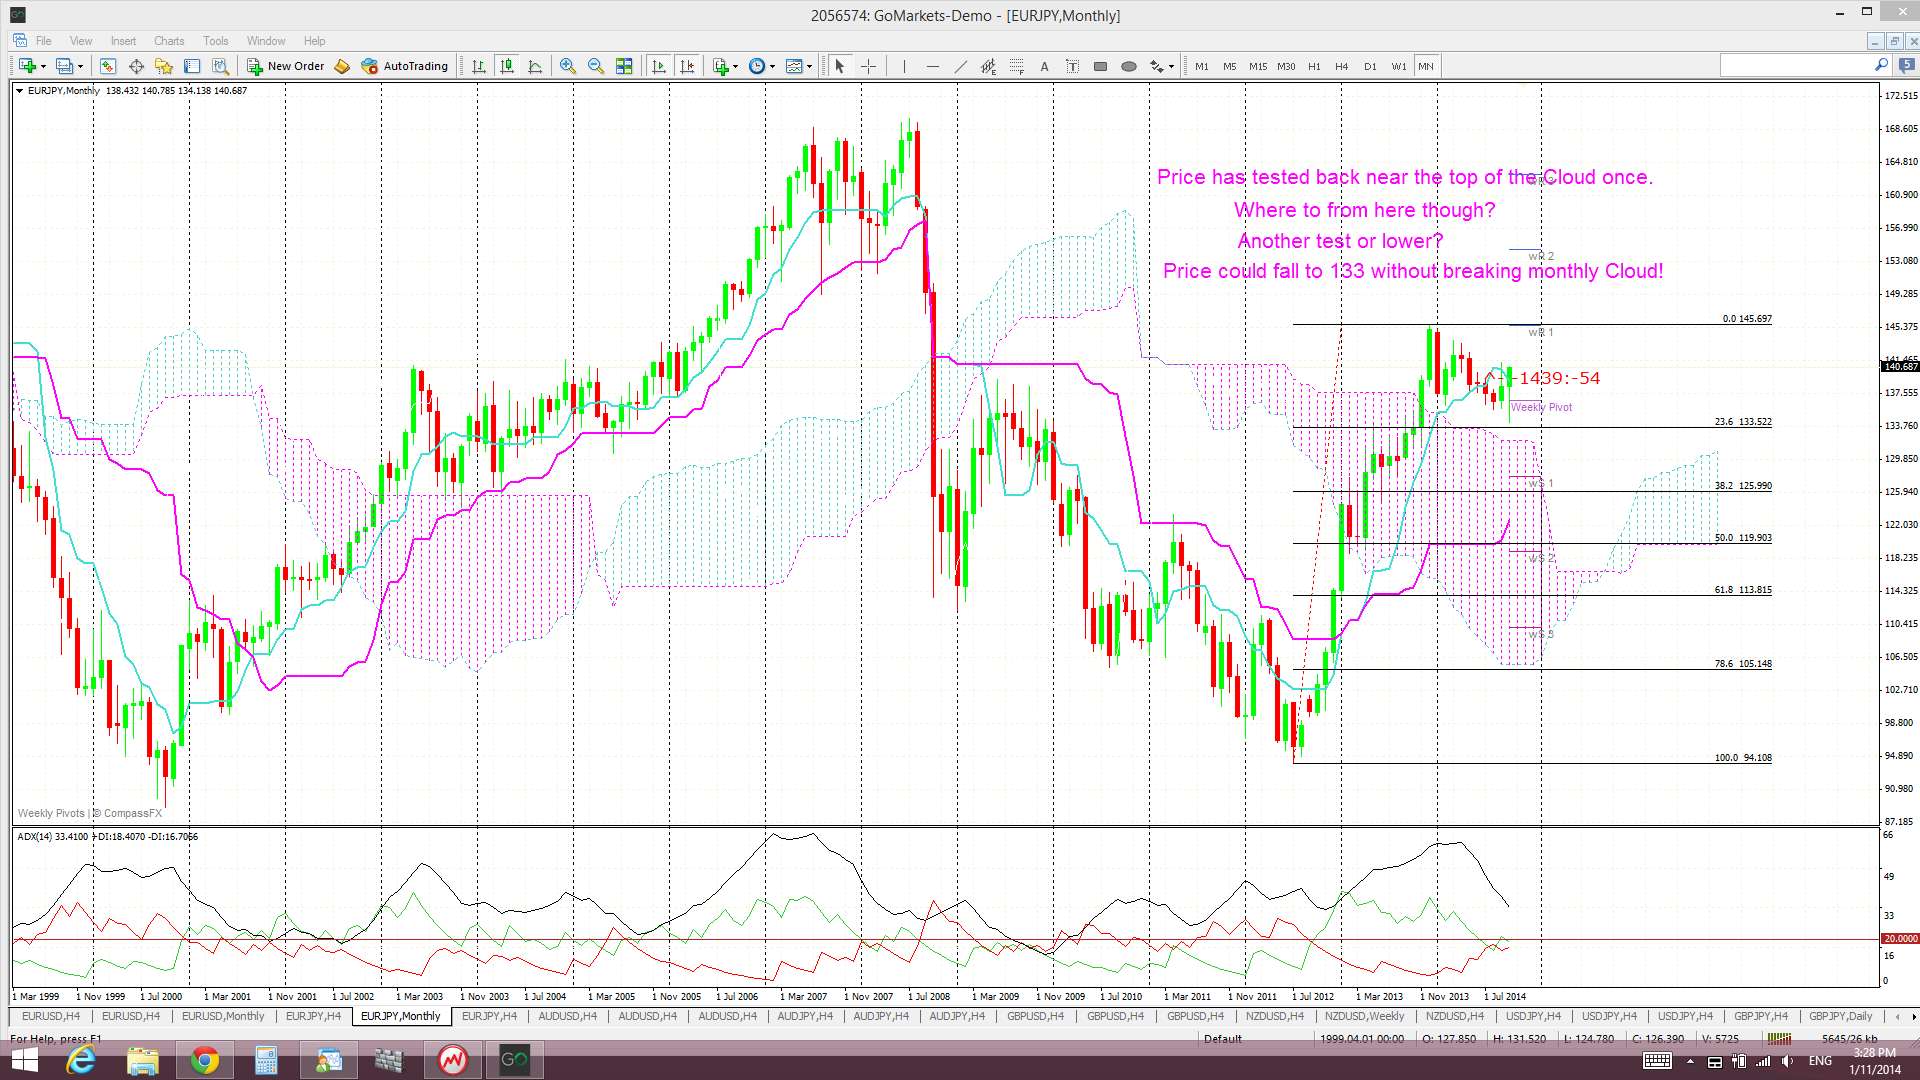
The weekly candle closed as a large bullish candle. The monthly candle closed as bullish too.
Thursday’s ECB interest rate news could impact here too and E/J traders need to monitor this data release.
- I’m watching for any new TC signal on this pair and the region of the 61.8% fib and weekly chart’s triangle trend line.
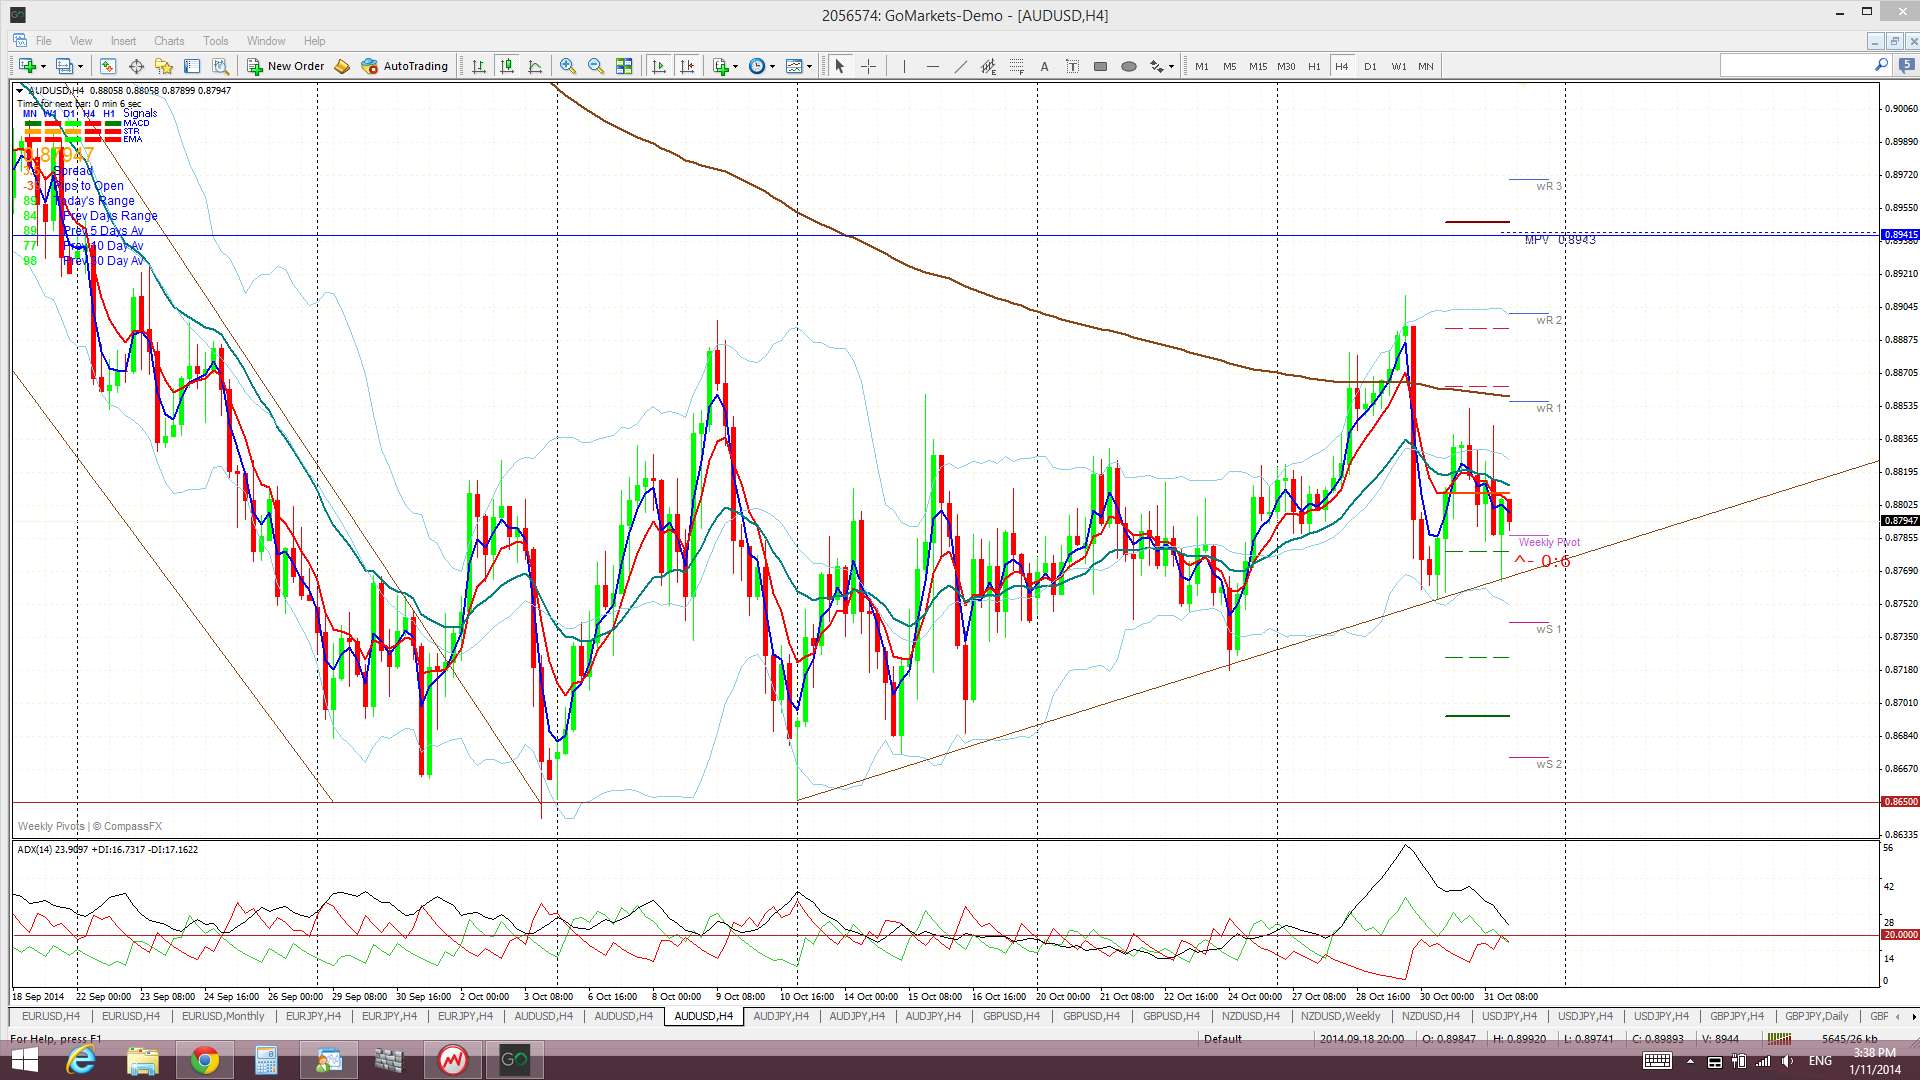
A/U: The A/U chopped higher last week until FOMC at which time USD strength then resulted in a pull back to a recent, three week support trend line. This support remained in place however even though the USD rallied further on Friday following the BoJ easing and this is quite noteworthy.
The Bear Flag still looks to be forming up though and it remains to be seen whether the A/U will continue to hold up if USD strength continues. The 0.865 remains the ‘line in the sand’ for me with this pair. The 0.865 level underpins the previous swing low printed back in June 2014 and, prior to that, this level was last printed back in July 2010. Any break and hold below this level would suggest the Bear Flag’ has started.
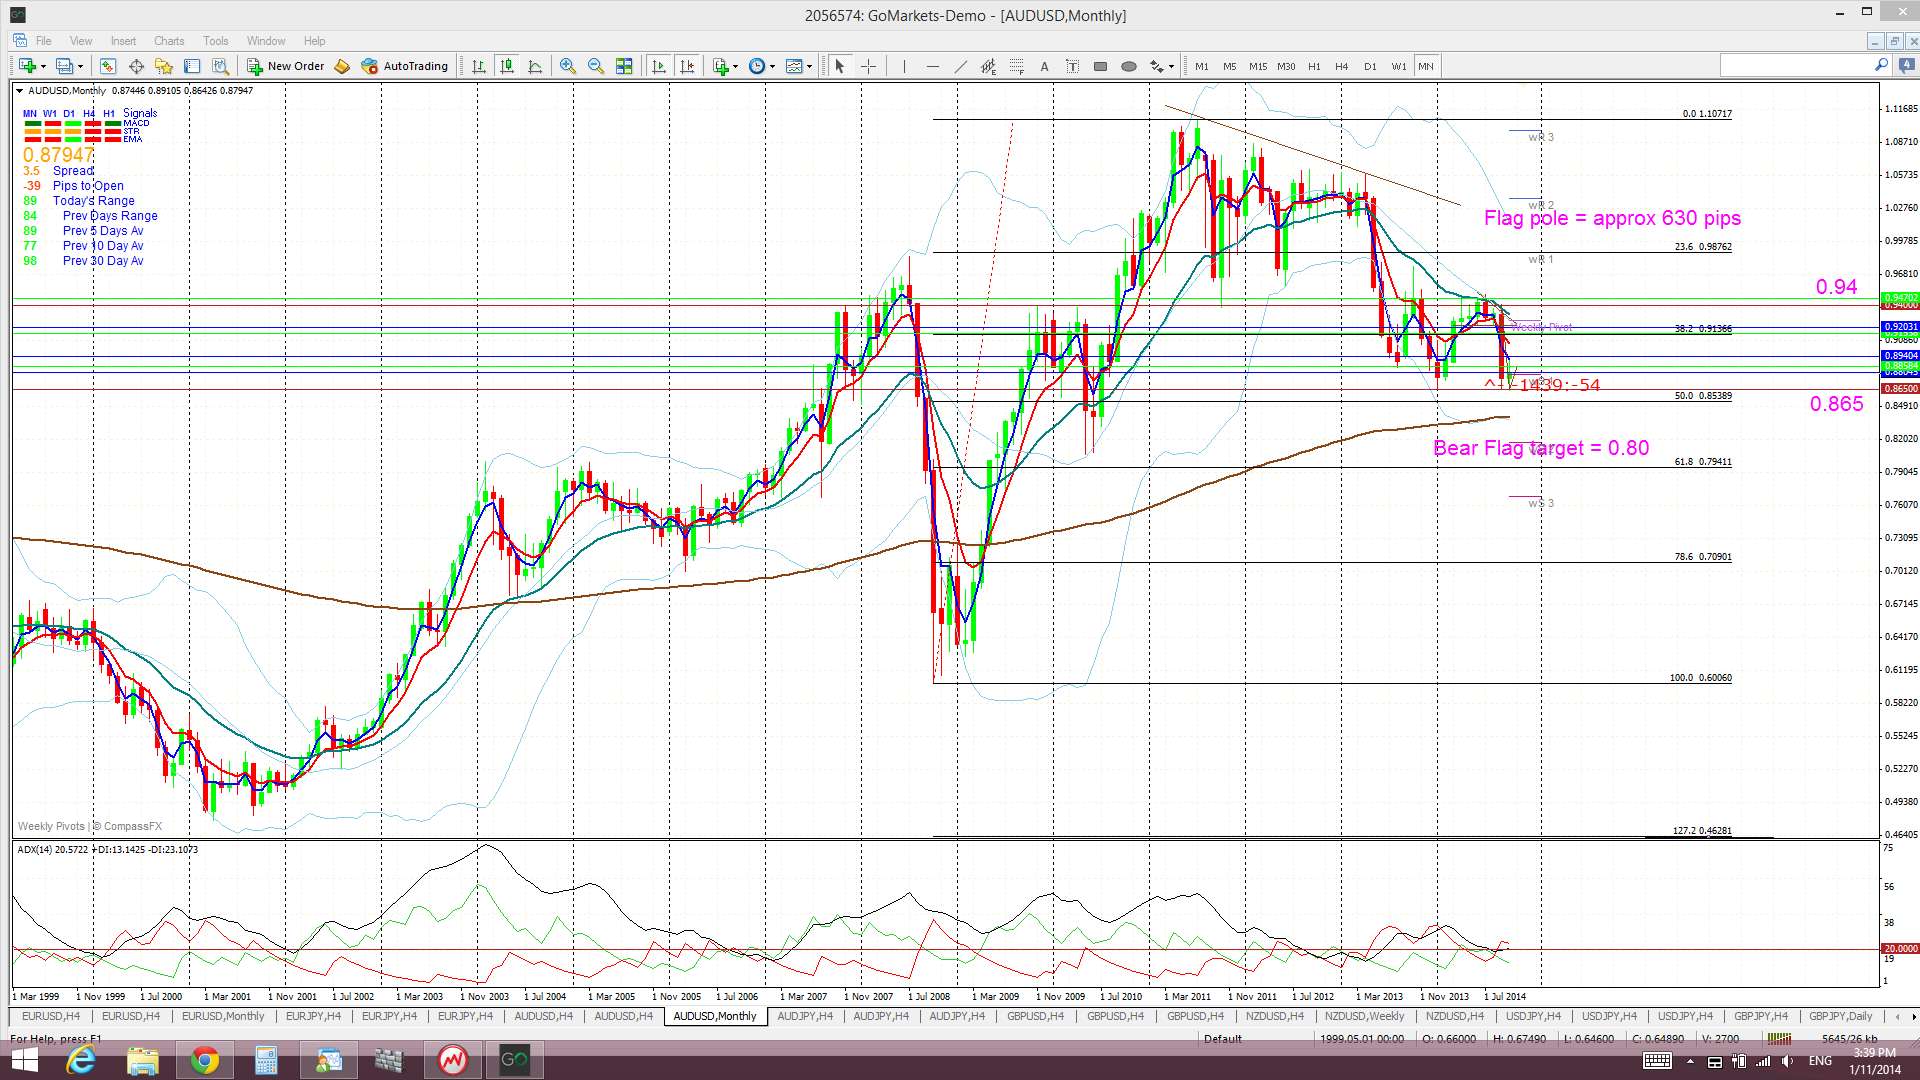
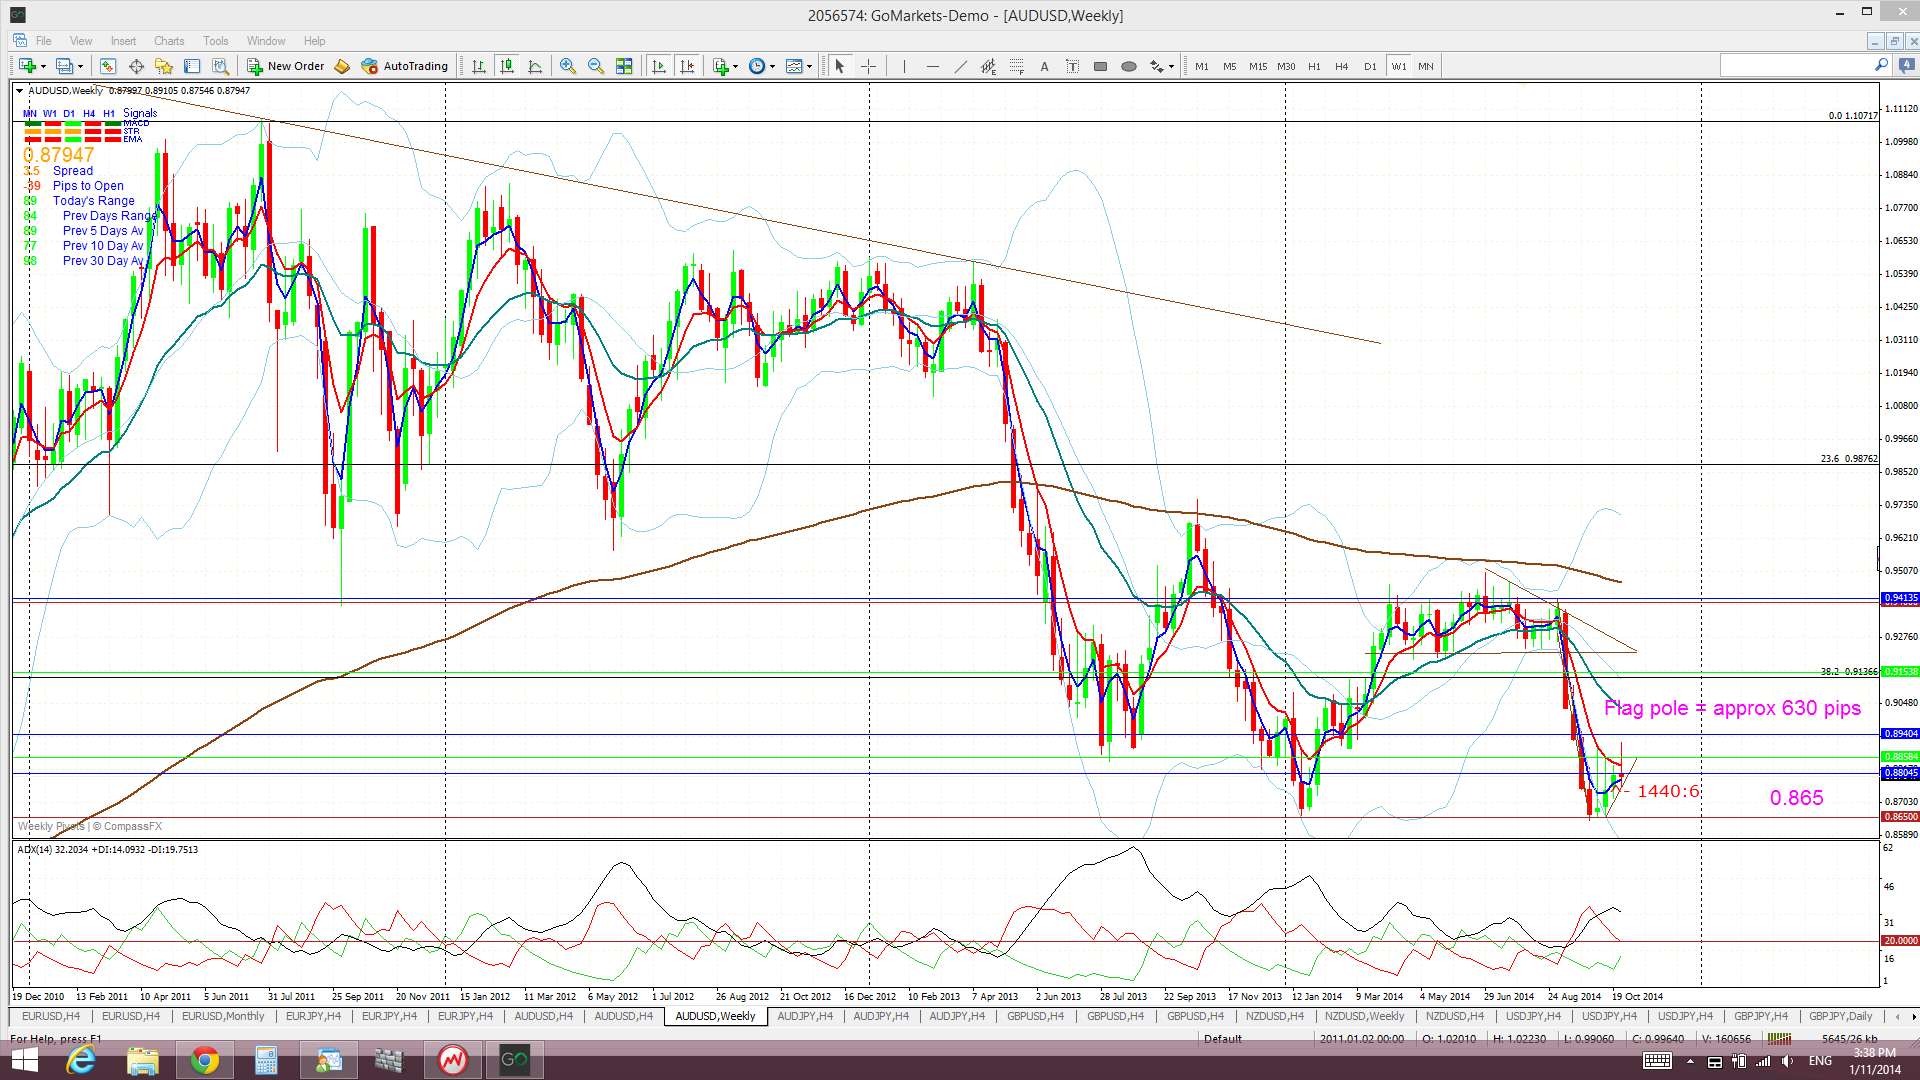
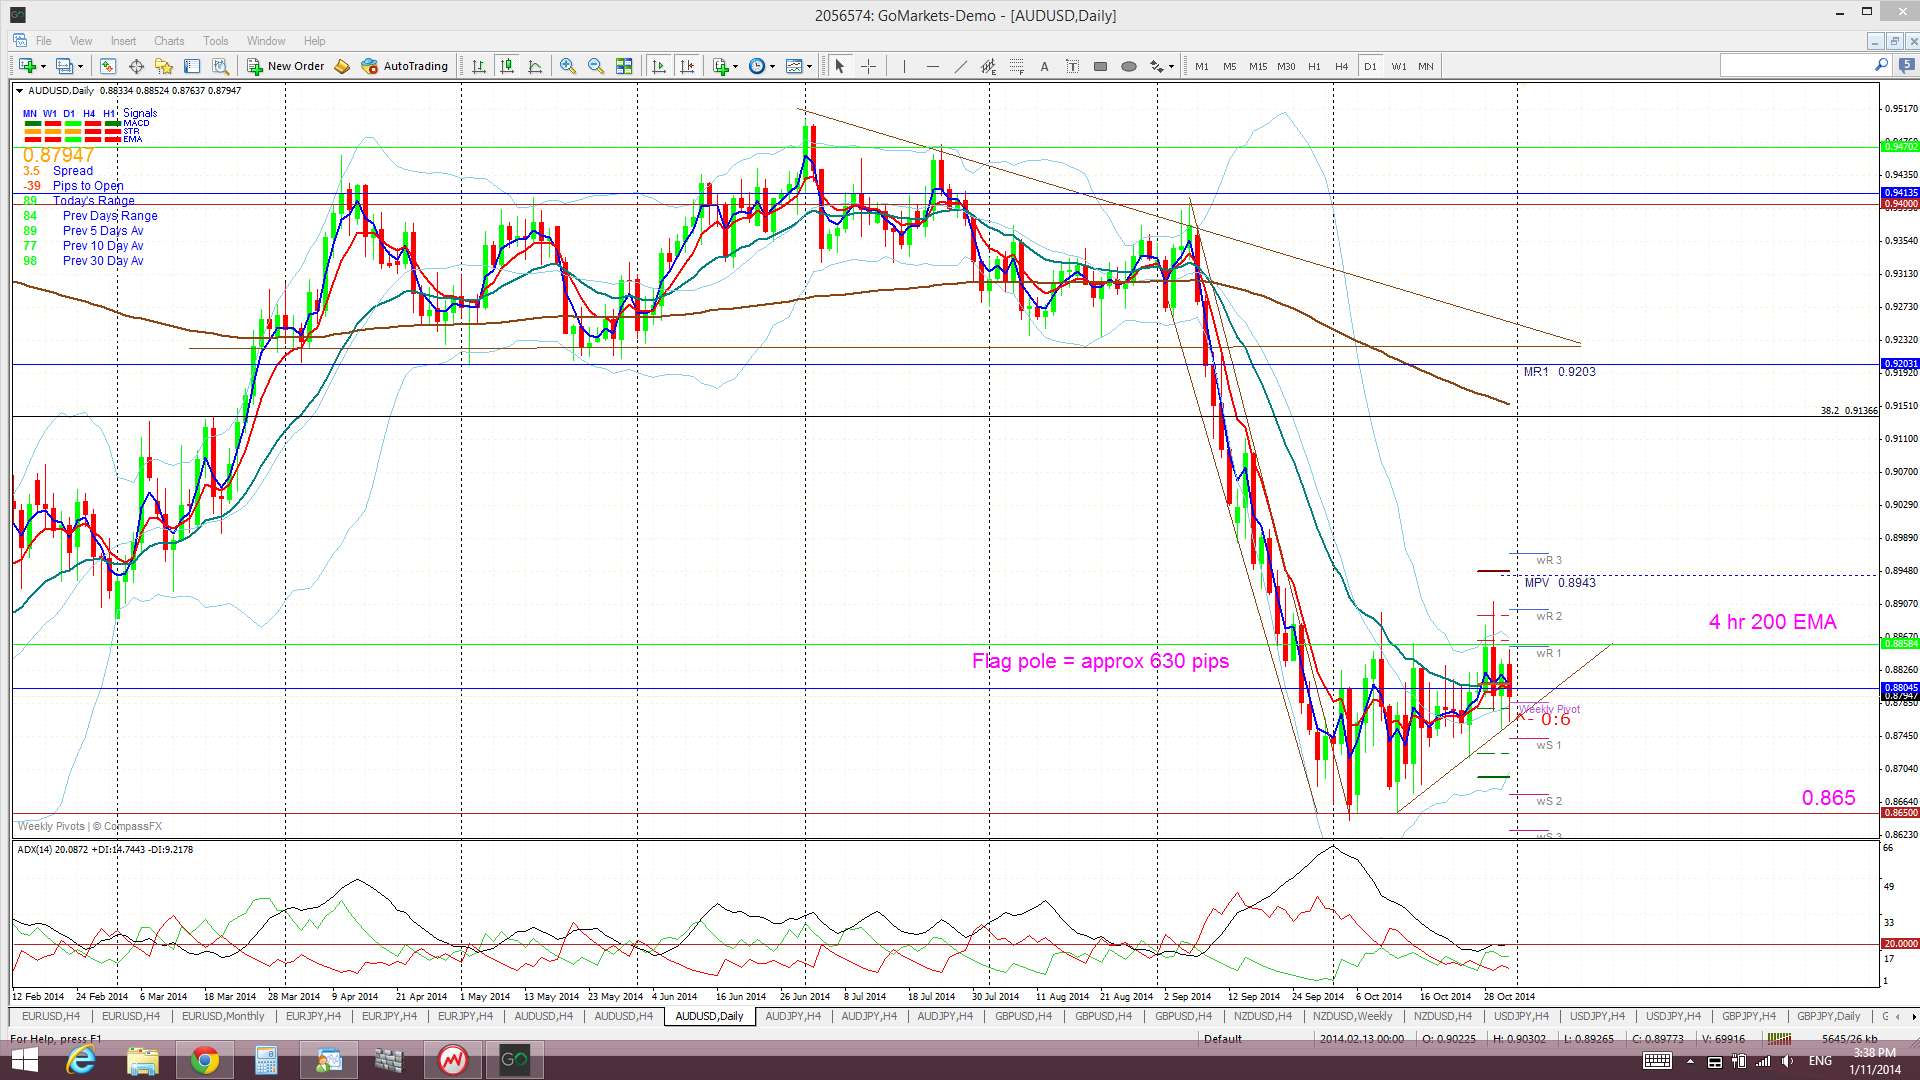
Bear Flag? The Bear Flag continues to build BUT I will wait to confirm a breakdown following any new close and hold below the 0.865 support level. The ‘Flag Pole’ for the A/U Bear Flag has a height of about 630 pips. Thus, the expected move for any bearish breakdown is expected to be of about 630 pips as well. This projects a bearish target down near the 0.80 level. This is significant as this is also the 61.8% pull back for the 2008-2011 bull run. I would expect that any break and close below the 0.865 might target this 0.80 level. There are the 50% fib and monthly 200 EMA levels above this 0.80 target that may offer some interim support.
Price is still trading above the Cloud on the 4hr chart (only just), below the Cloud on the daily and weekly charts and near the bottom of the Cloud on the monthly chart. There has been a recent bullish Tenkan/Kijun cross, of sorts, on the daily chart although this formed below the Cloud and is therefore deemed as a ‘weak’ signal.
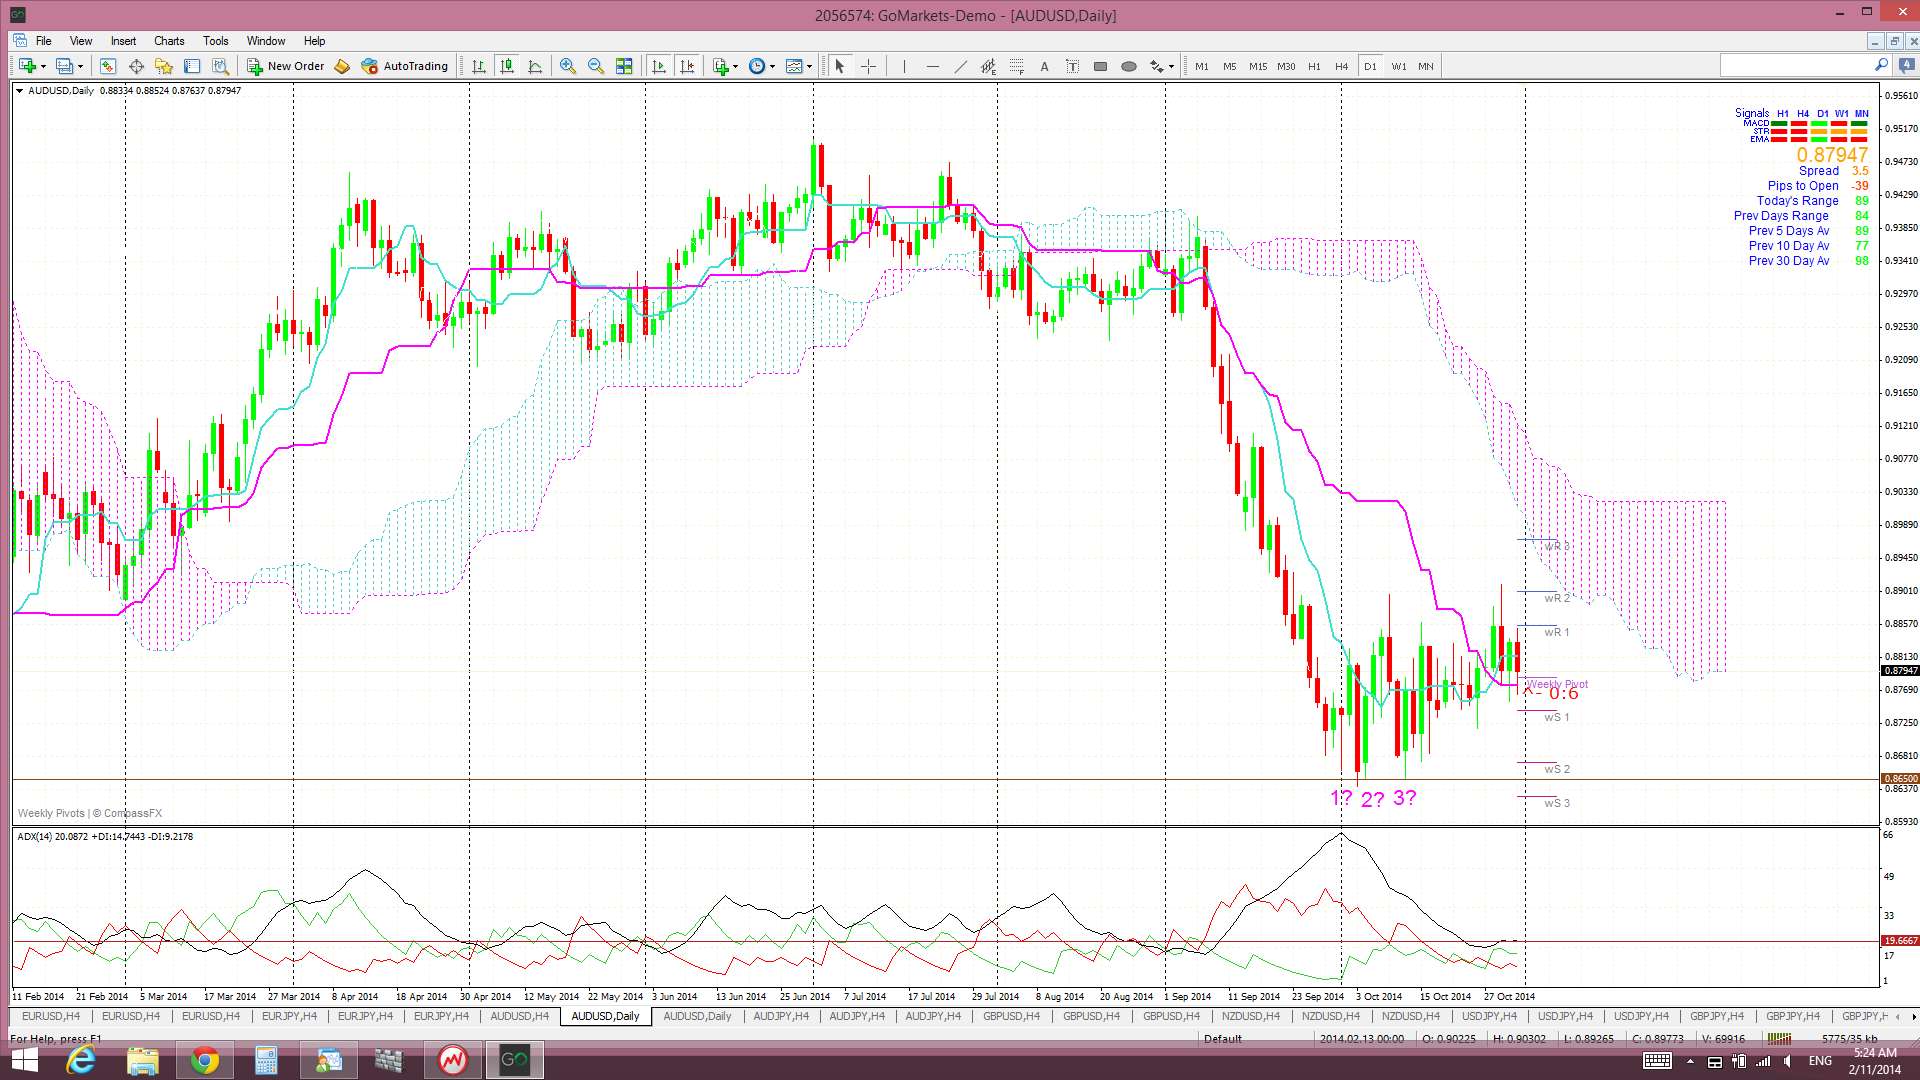
The weekly candle closed as a bearish coloured ‘Doji’ candle which reflects the indecision here. The monthly candle closed as a bearish coloured ‘Spinning Top’, also reflecting indecision.
There is a lot of AUD sensitive data this week and the first of these was released over the w/e with Chinese manufacturing PMI. Next up is AUD Building approvals and CNY HSBC Final Manufacturing PMI on Monday. Then AUD Retail Sales, Trade Balance, Cash Rate, RBA statement and USD Trade Balance on Tuesday. USD ADP NFP & ISM Non-Manufacturing PMI on Wednesday. AUD Employment data and USD Unemployment claims on Thursday. AUD RBA Monetary Policy Statement and USD NFP on Friday and, then, finishing up with CNY Trade Balance data on Saturday. Traders need to watch the developing A/U Bear Flag around these data items.
- I’m watching for any new TC signal on this pair, the flag trend lines and the 0.865 level.
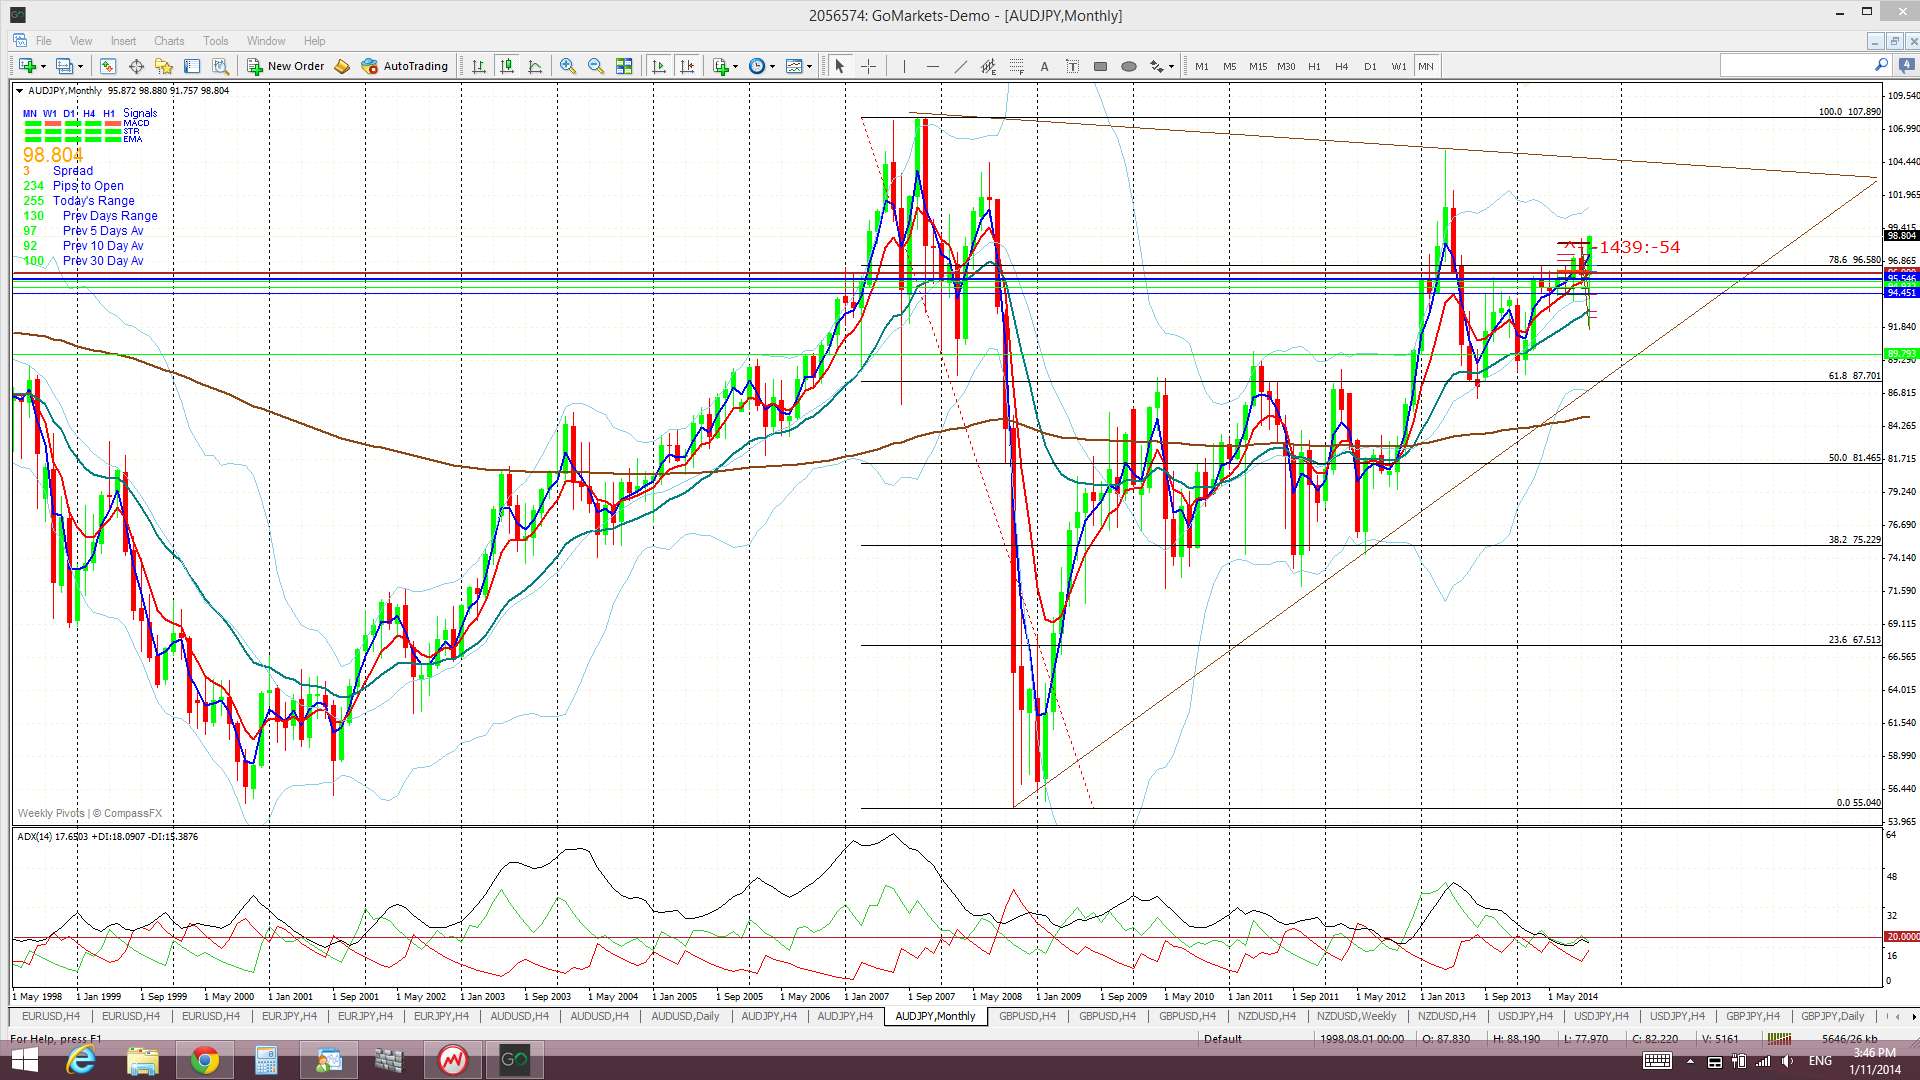
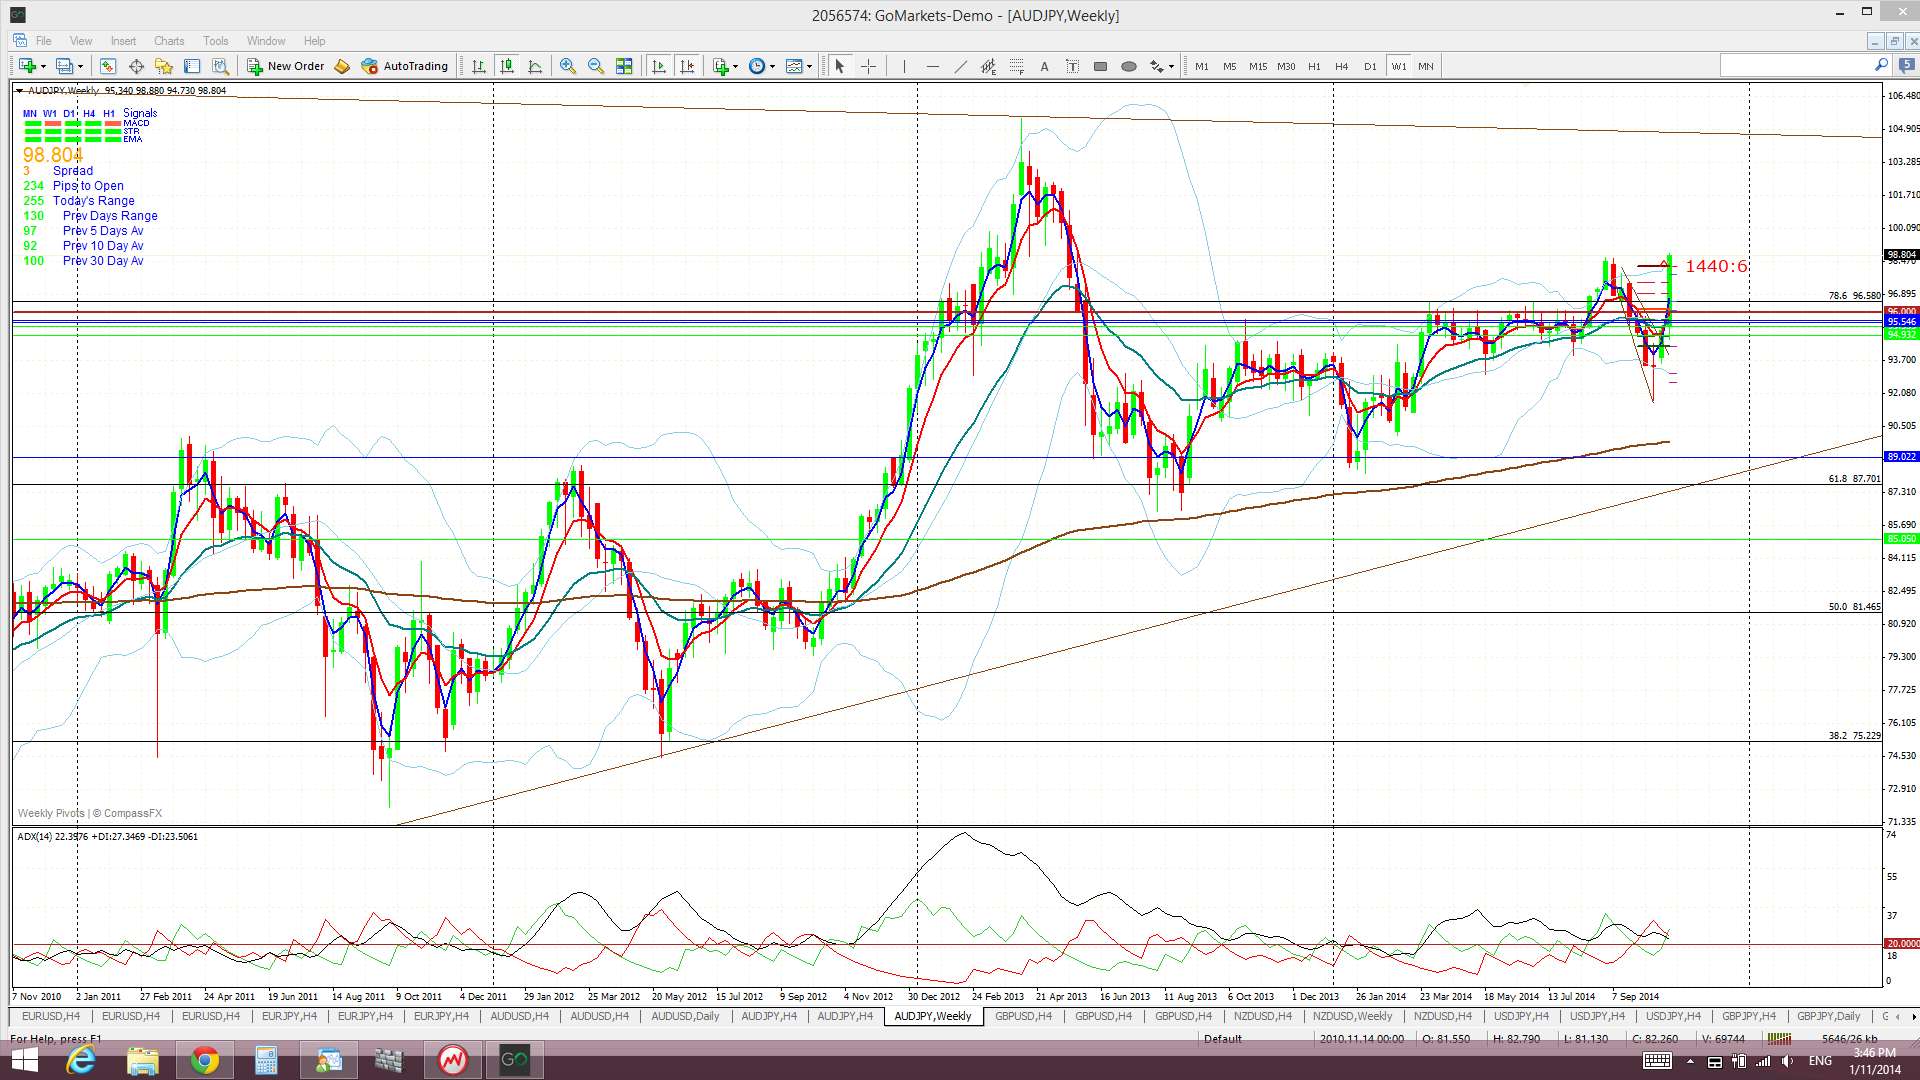
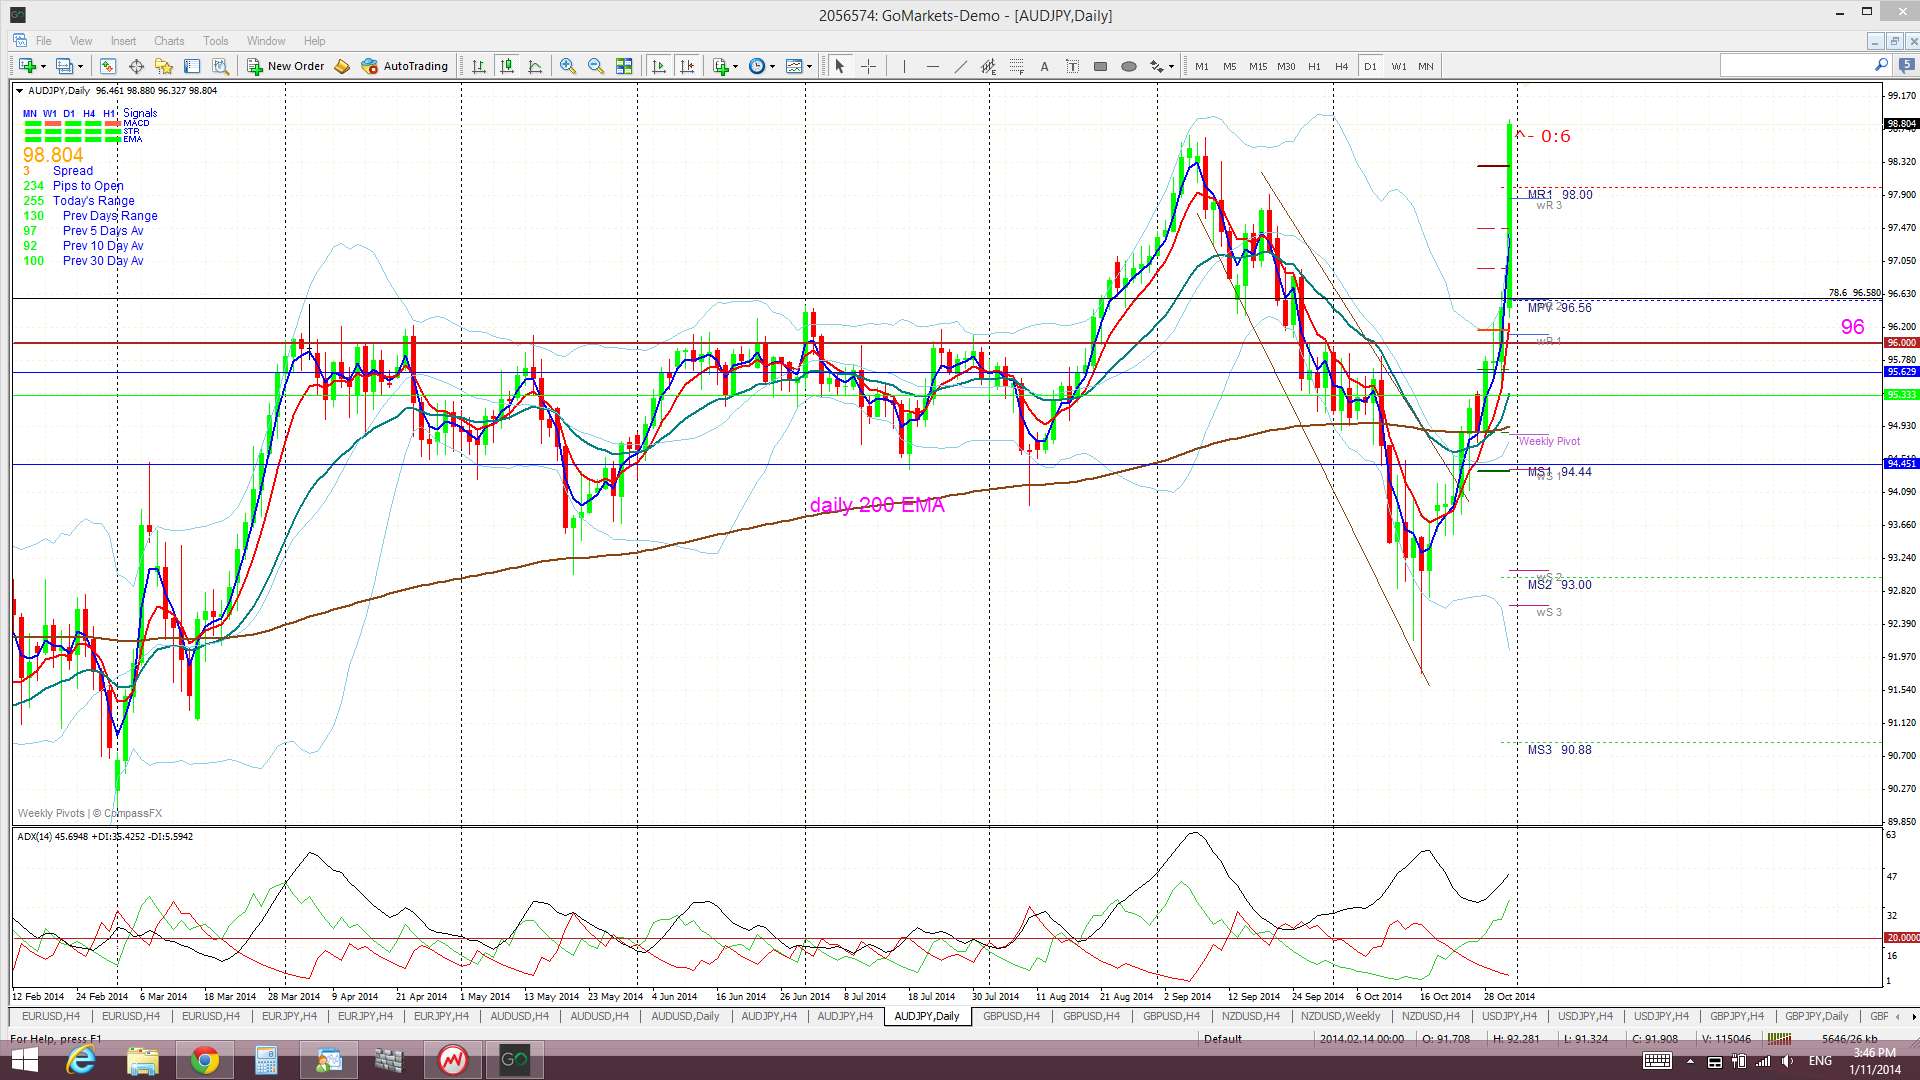
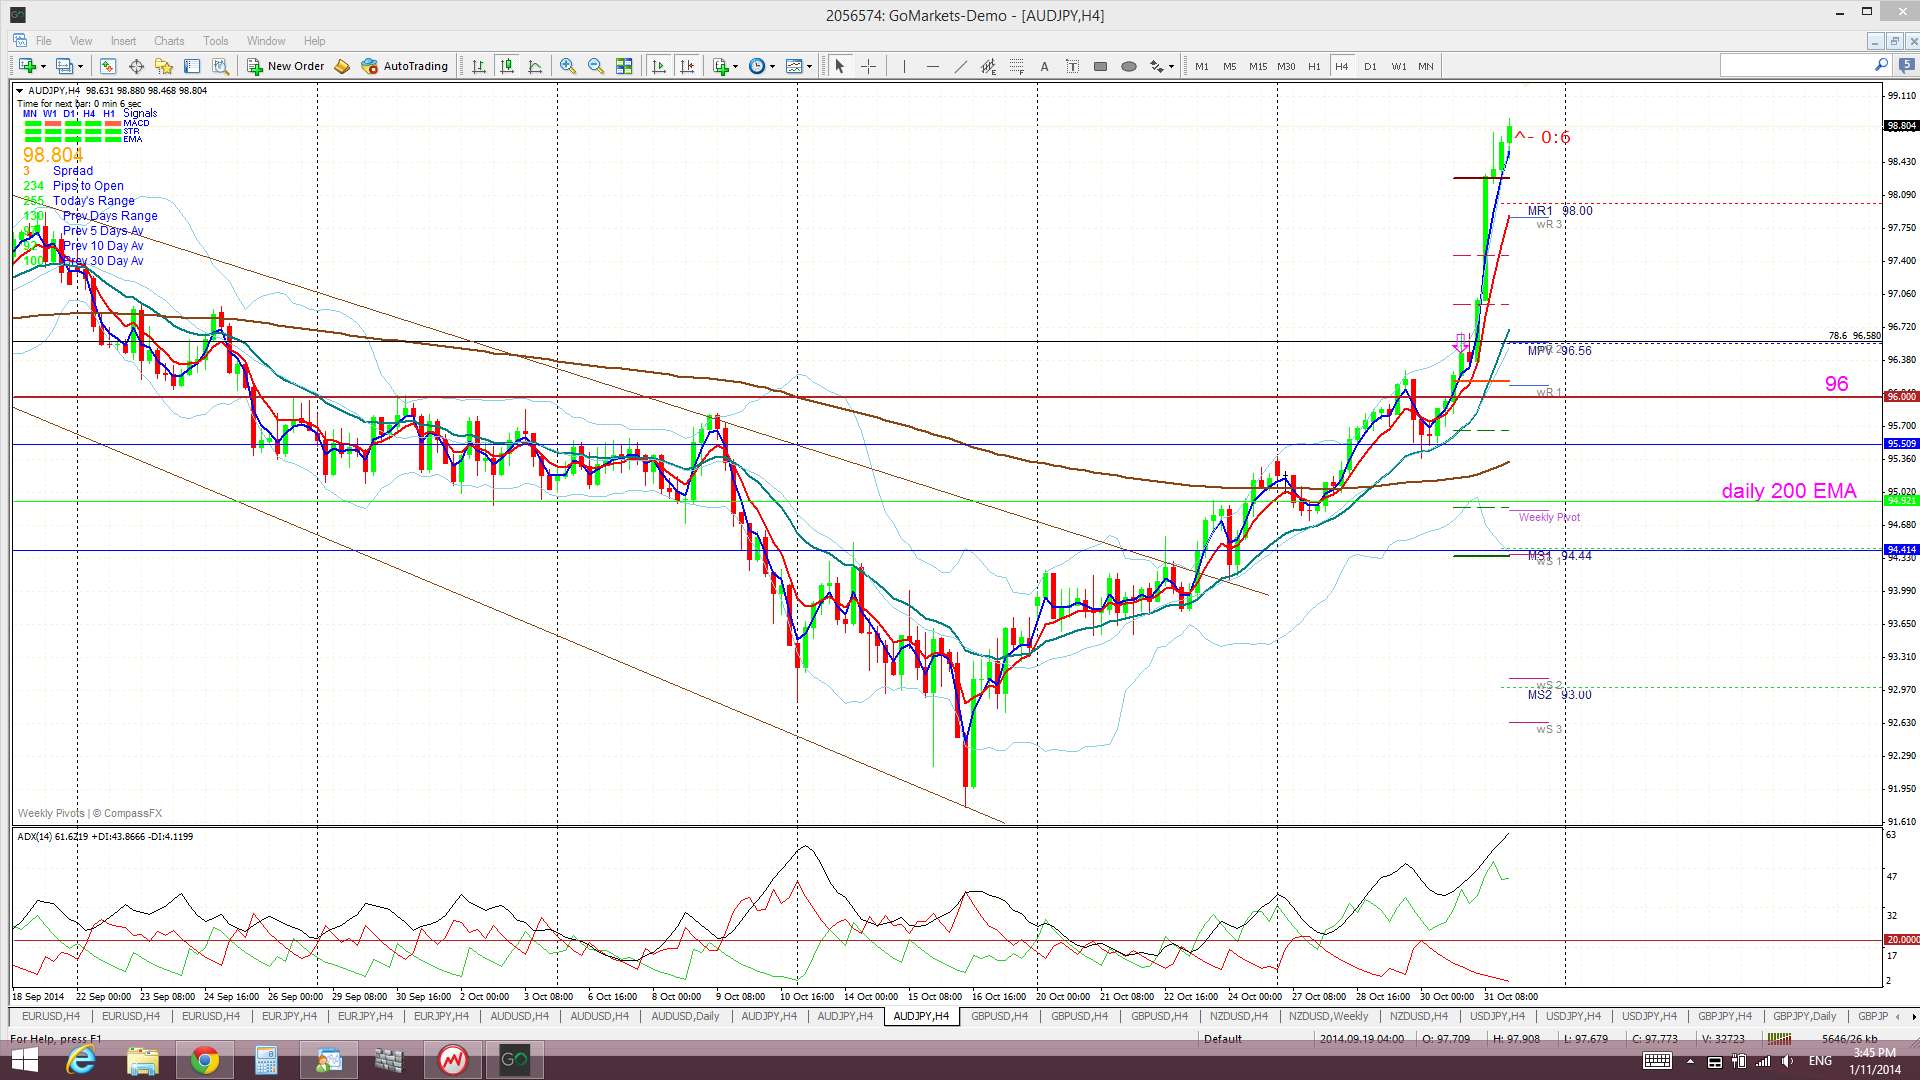
A/J: The A/J continued higher last week following on from the bullish descending trading channel breakout of the week before. It rallied to trade back above the key 96 S/R level and a new TC signal was triggered here on Friday morning. BoJ easing later on Friday resulted in even further bullish action and bringing about the highest monthly close since May 2013.
The A/J is now only about 600 pips below a monthly chart triangle trend line. Price may well continue on to test this resistance zone but working out a safe trade entry level might be hard here. I consider that the E/J and GBP/JPY may have more obvious entry levels to capture any continuing Yen momentum.
Price is now trading above the Cloud on the 4hr, daily weekly and monthly charts which is a significant bullish shift.
The weekly candle closed as a large bullish candle. The monthly candle closed as a bullish engulfing candle.
As for the A/U, traders need to watch out for the AUD sensitive data if trading this pair.
- There is an open TC signal on this pair.
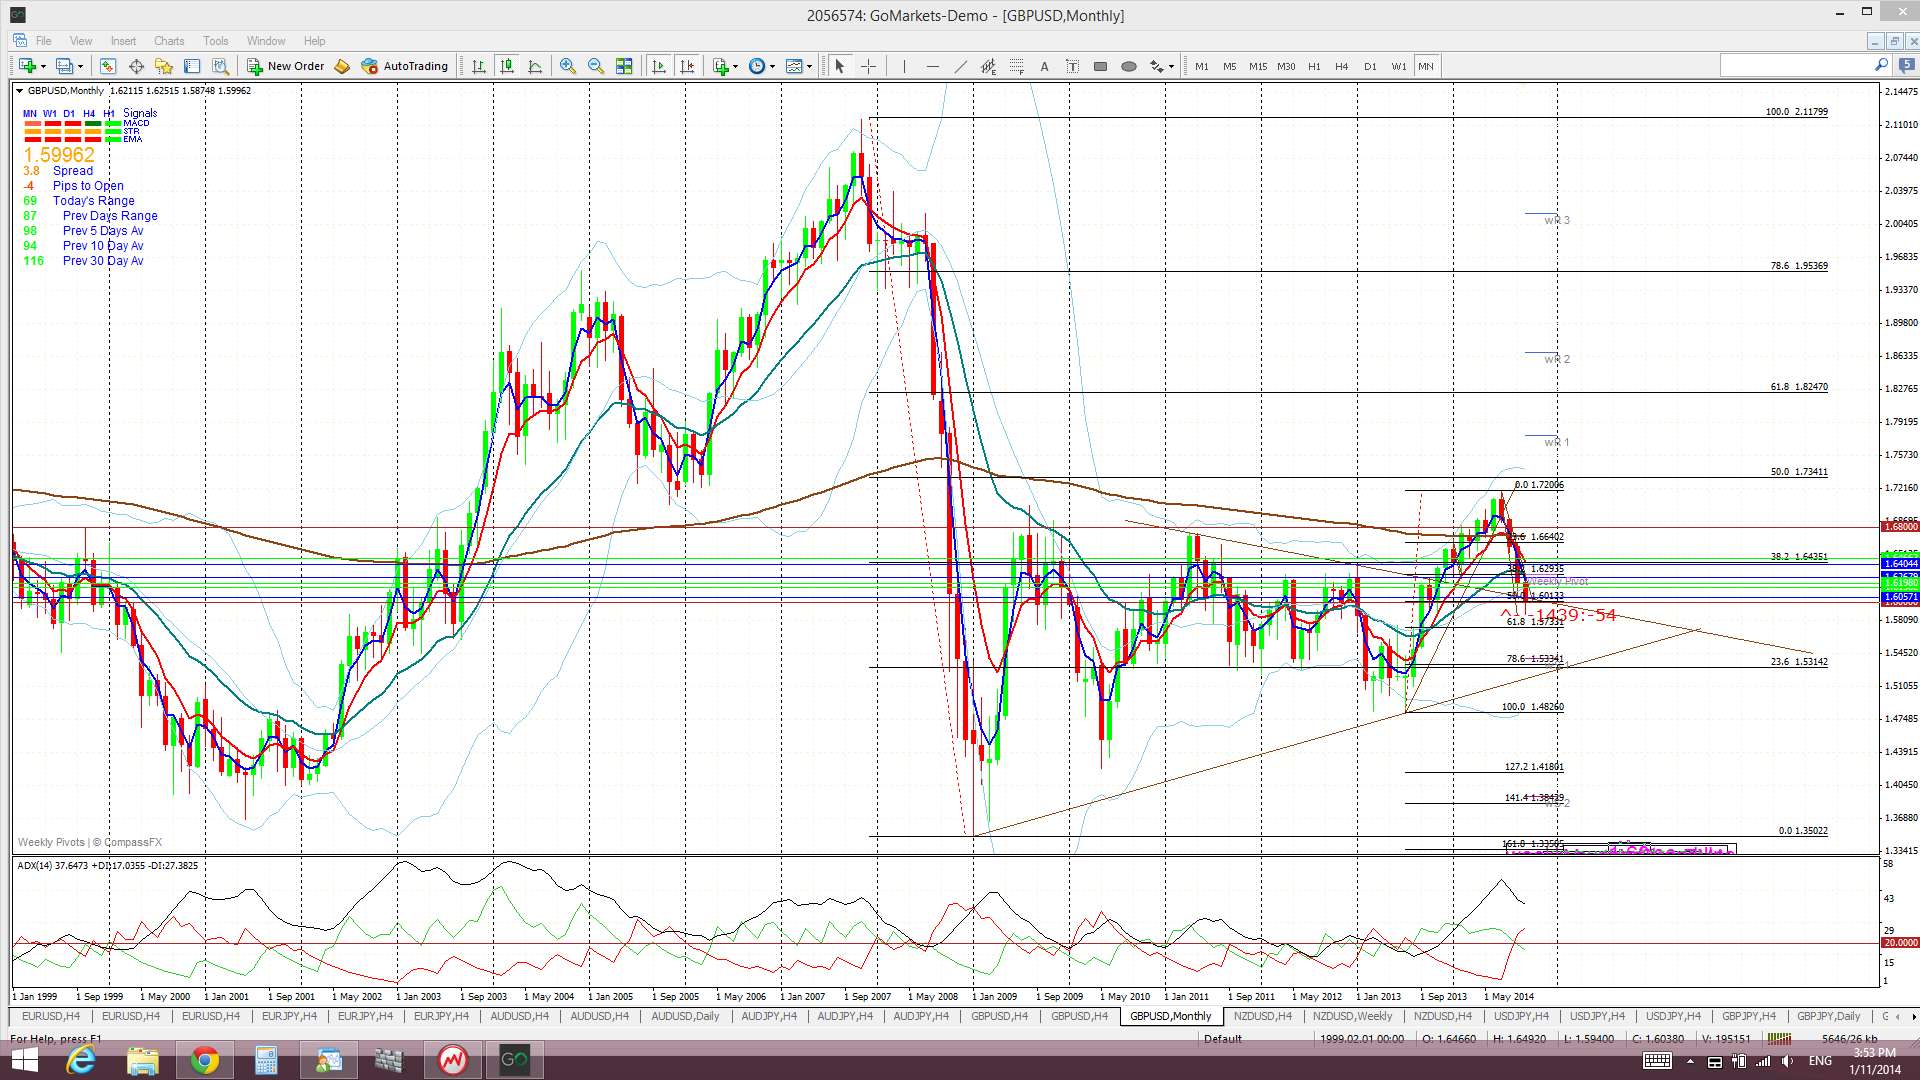
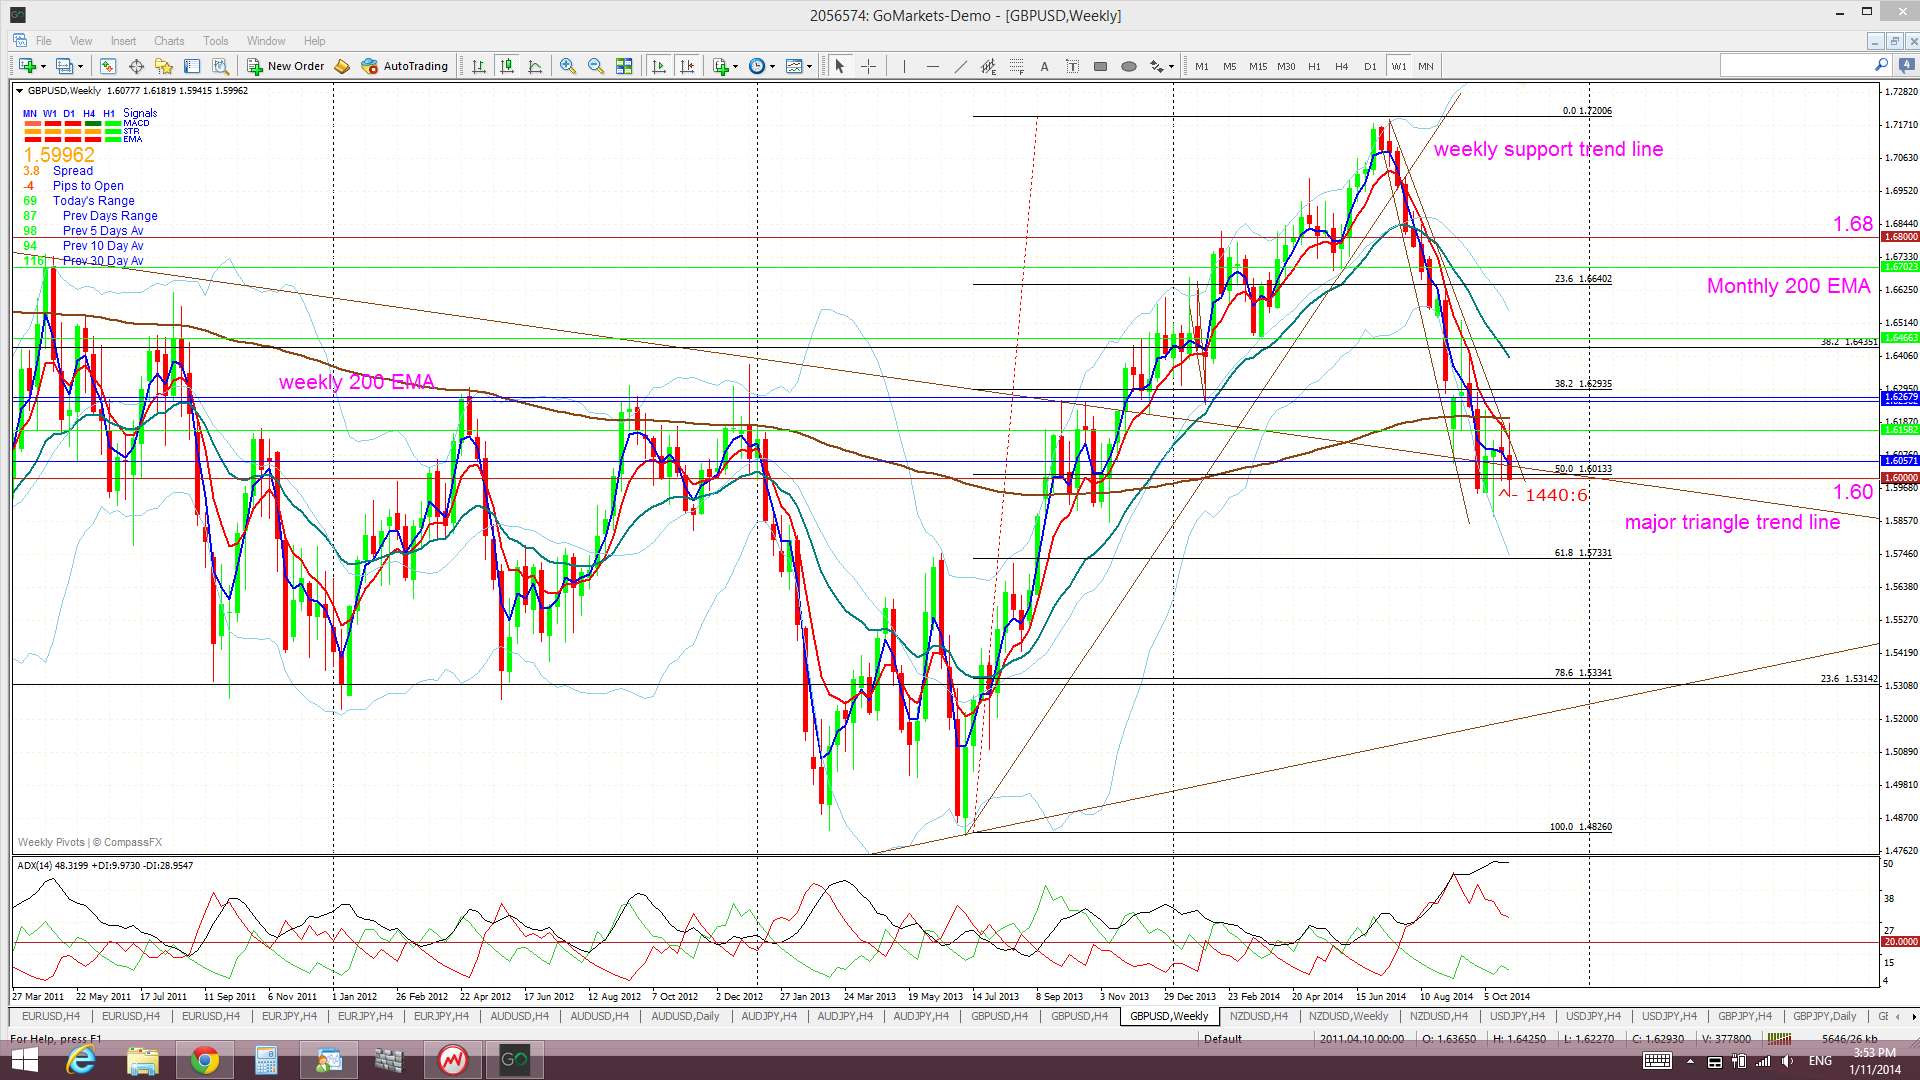
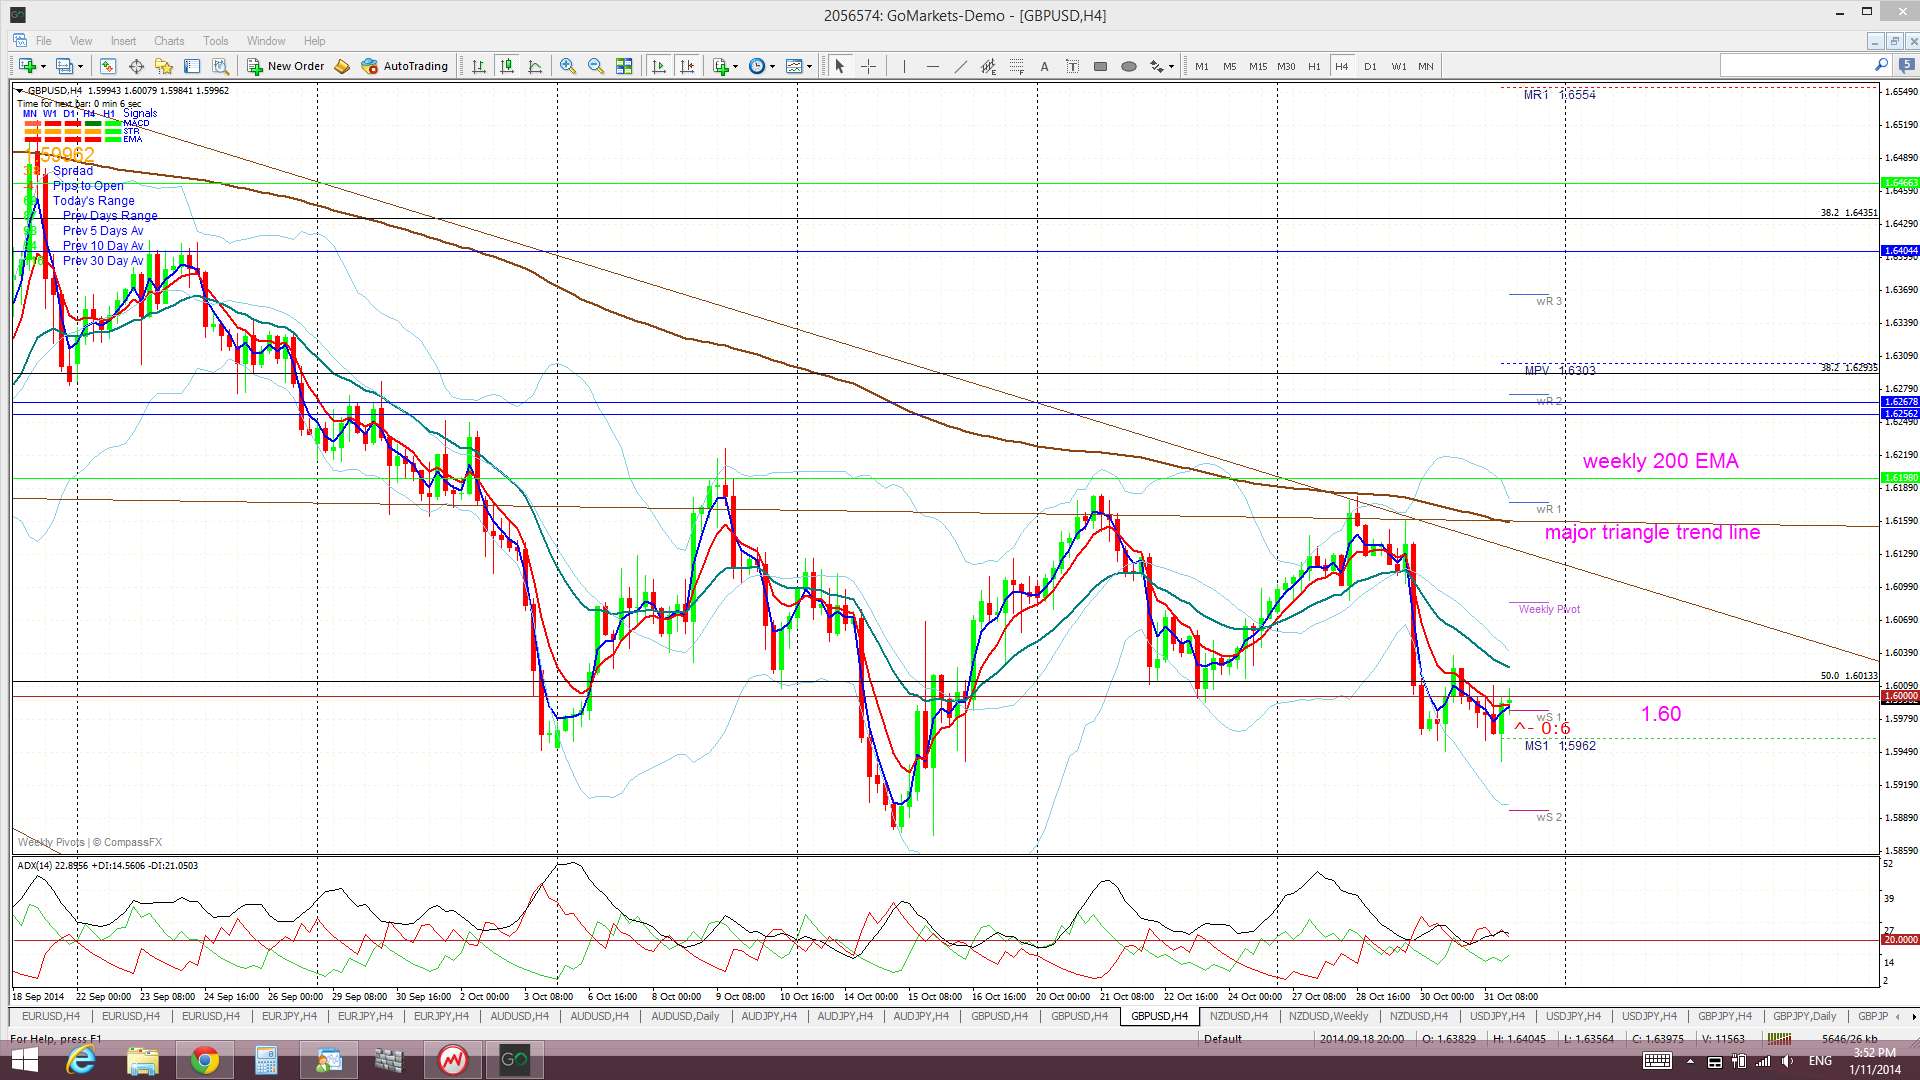
G/U: The GBP/USD drifted higher last week and tested the daily charts upper wedge trend line ahead of FOMC. USD strength following this news saw the GBP/USD pull back to 1.60 support. Price continued to chop around near the 1.60 level but eventually closed the week out just below this support.
The close below 1.60 will be noted by many as a very bearish signal but I consider the relative hold up for this pair, especially given the continued USD strength on Friday, is quite noteworthy. This probably falls into the ‘glass half full or half empty’ category though and all a matter of perspective.
Price is trading below the Cloud on the 4hr and daily charts and in the bottom of the Cloud on the weekly and monthly charts.
The weekly and monthly candles both closed as a bearish candles.
There is a lot of GBP/USD sensitive data released this week and this might determine how this pair pivots off the key 1.60 level. First up on Monday is GBP Manufacturing PMI and USD ISM Manufacturing PMI. Then GBP Construction PMI and USD Trade Balance on Tuesday. GBP Services PMI and USD ADP NFP & ISM Non-Manufacturing PMI on Wednesday. GBP Manufacturing production & Interest Rate news and USD Unemployment claims on Thursday and then USD NFP on Friday. Thursday’s GBP Interest Rate has the potential to trigger a big move here but all data items need to be monitored if trading this pair.
- I’m watching for any new TC signal on this pair, the wedge trend lines and the 1.60 level.

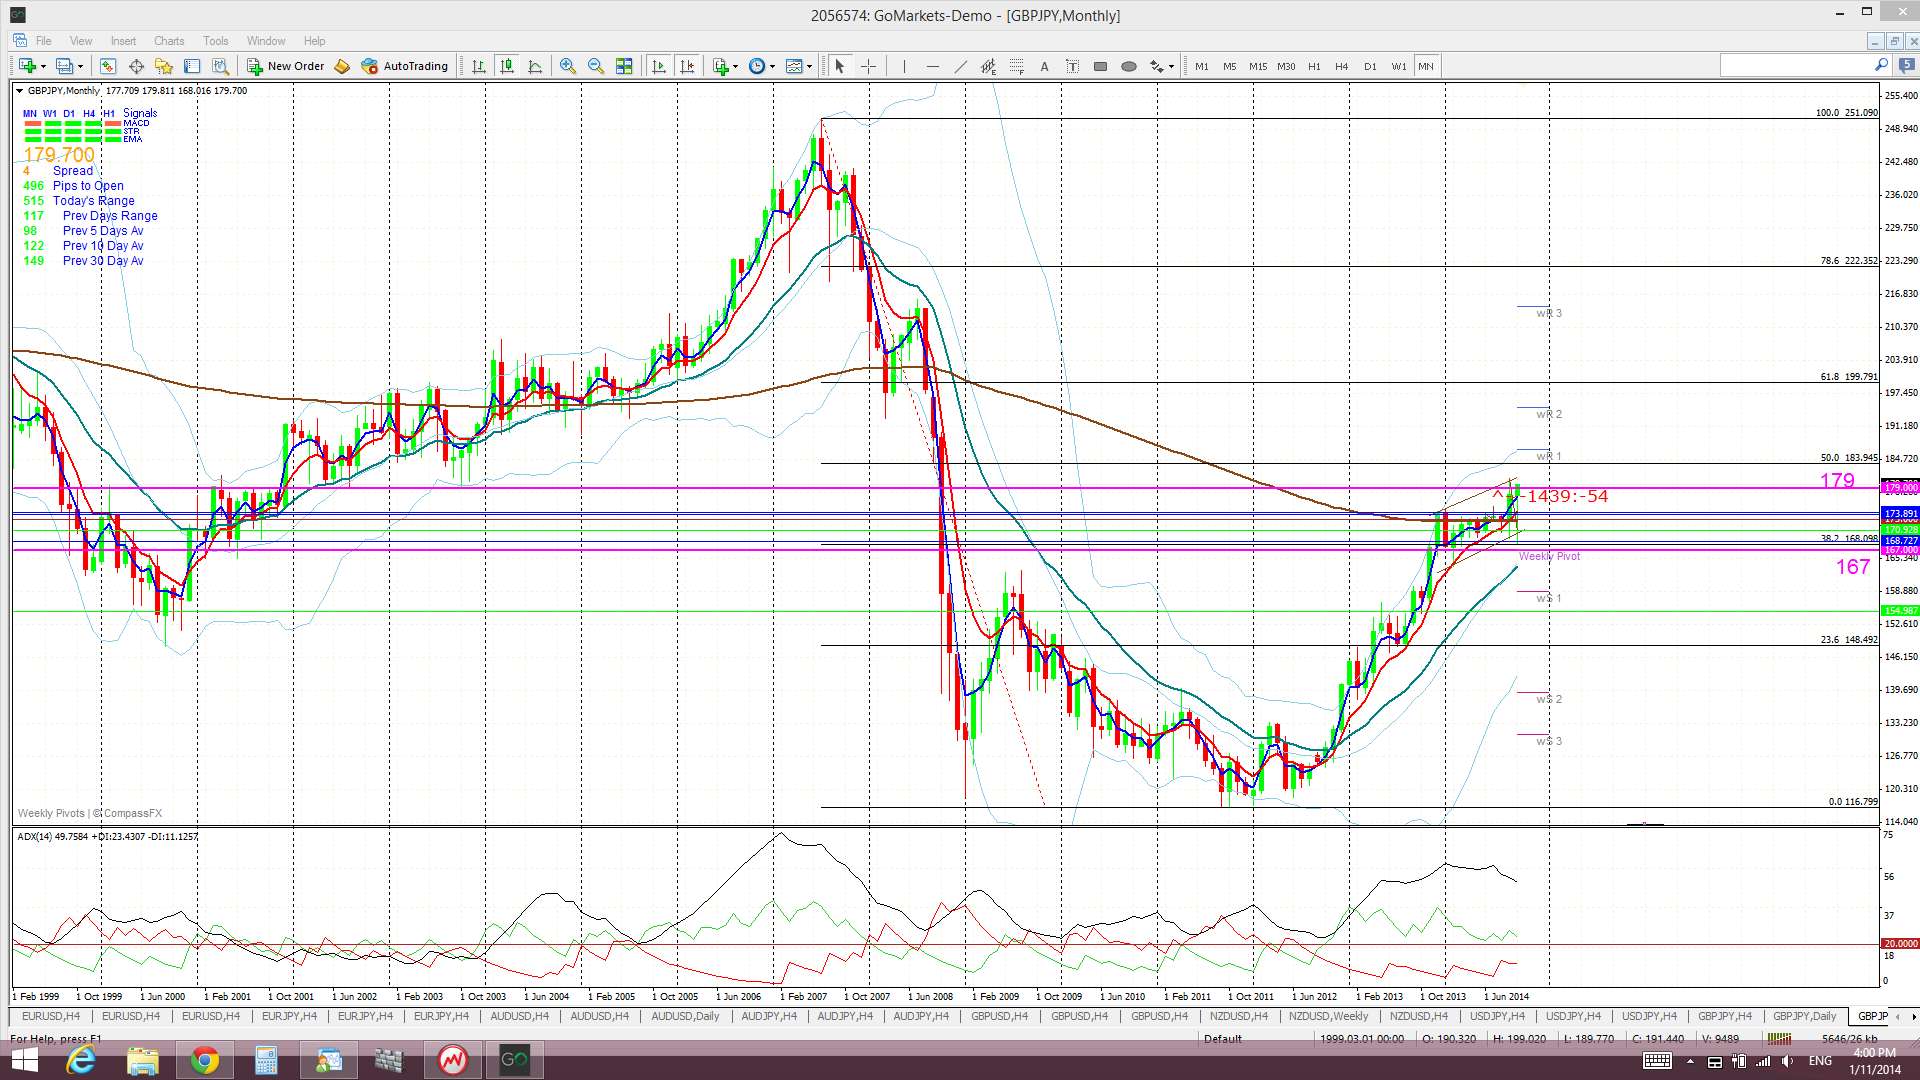
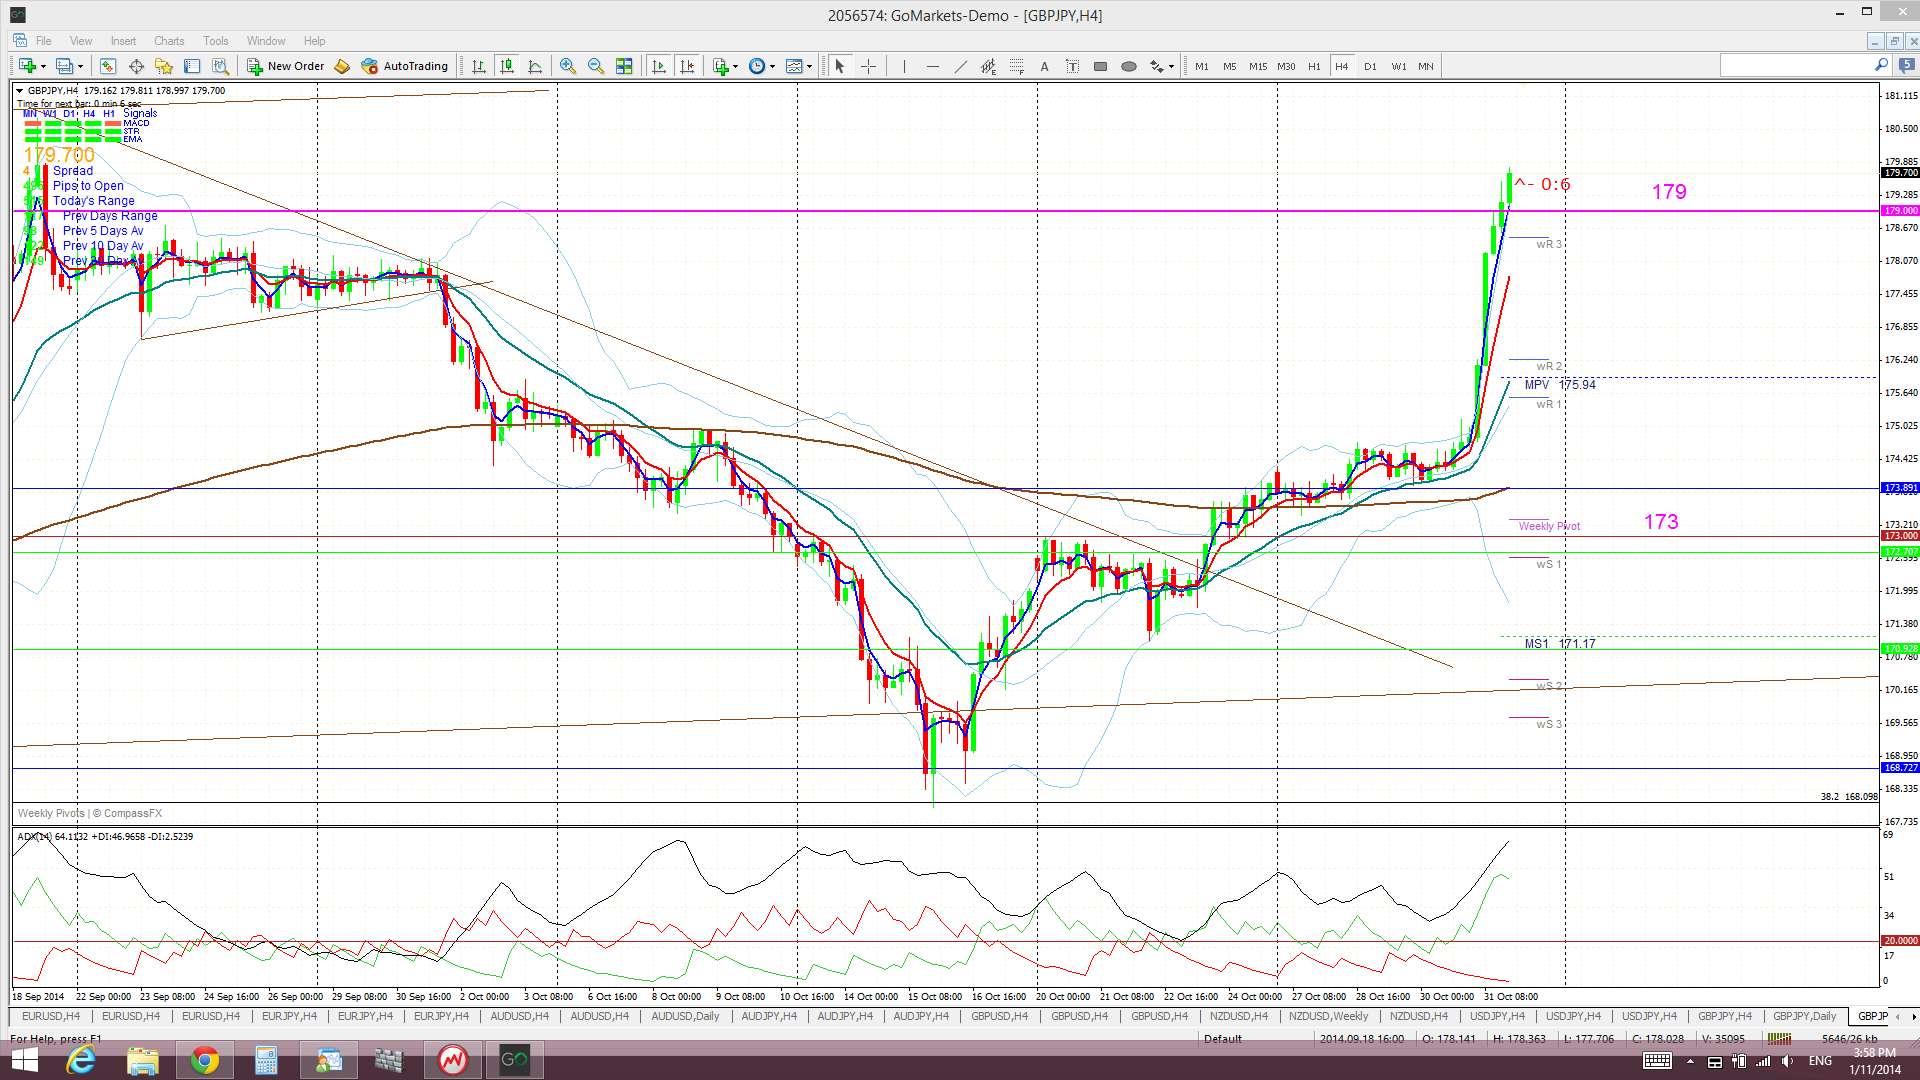
GBP/JPY: The GBP/JPY continued to drift slightly higher following the bullish trend line breakout from the previous week. That was, until Friday when all the action started! BoJ easing resulted in a sharp rally for this pair and it headed to the key 179 level, broke through this and eventually closed just above this key S/R level; the target level I had suggested last week!
The 179 is a key S/R level and I have noted this fact over recent weeks, as per the paragraph below. A continued hold above this 179 level or, alternatively, any pull back from here, may offer a new trade entry for this pair. The 179 is the key level to watch here.
Two key S/R levels on the G/J chart: The monthly chart shows a band of choppy congested activity across the chart. This band is defined by rather strong S/R levels at 179 and 167. The 179 level seems to be a key demarcation level and any close and hold above this would suggest bullish continuation. The key 173 level lies midway between these two S/R levels. Targets for any bullish break and hold above the 179 level, apart from obvious whole number levels, include the 50% fib near 184, the 61.8% fib near 200 and the 78.6% fib near 222.
Price is now trading above the Ichimoku Cloud on the 4hr, daily, weekly and monthly charts which is a significant bullish development.
The weekly candle closed as a large bullish candle. The monthly candle was a small bullish candle with a long lower shadow.
As for the GBP/USD, traders need to watch out for the GBP sensitive data items if trading this pair.
- I’m watching for any new TC signal on this pair and the 179 level.


Kiwi: NZD/USD: The Kiwi also chopped higher to start the week but fell following FOMC and then suffered a bit more with further USD strength following the BoJ news.
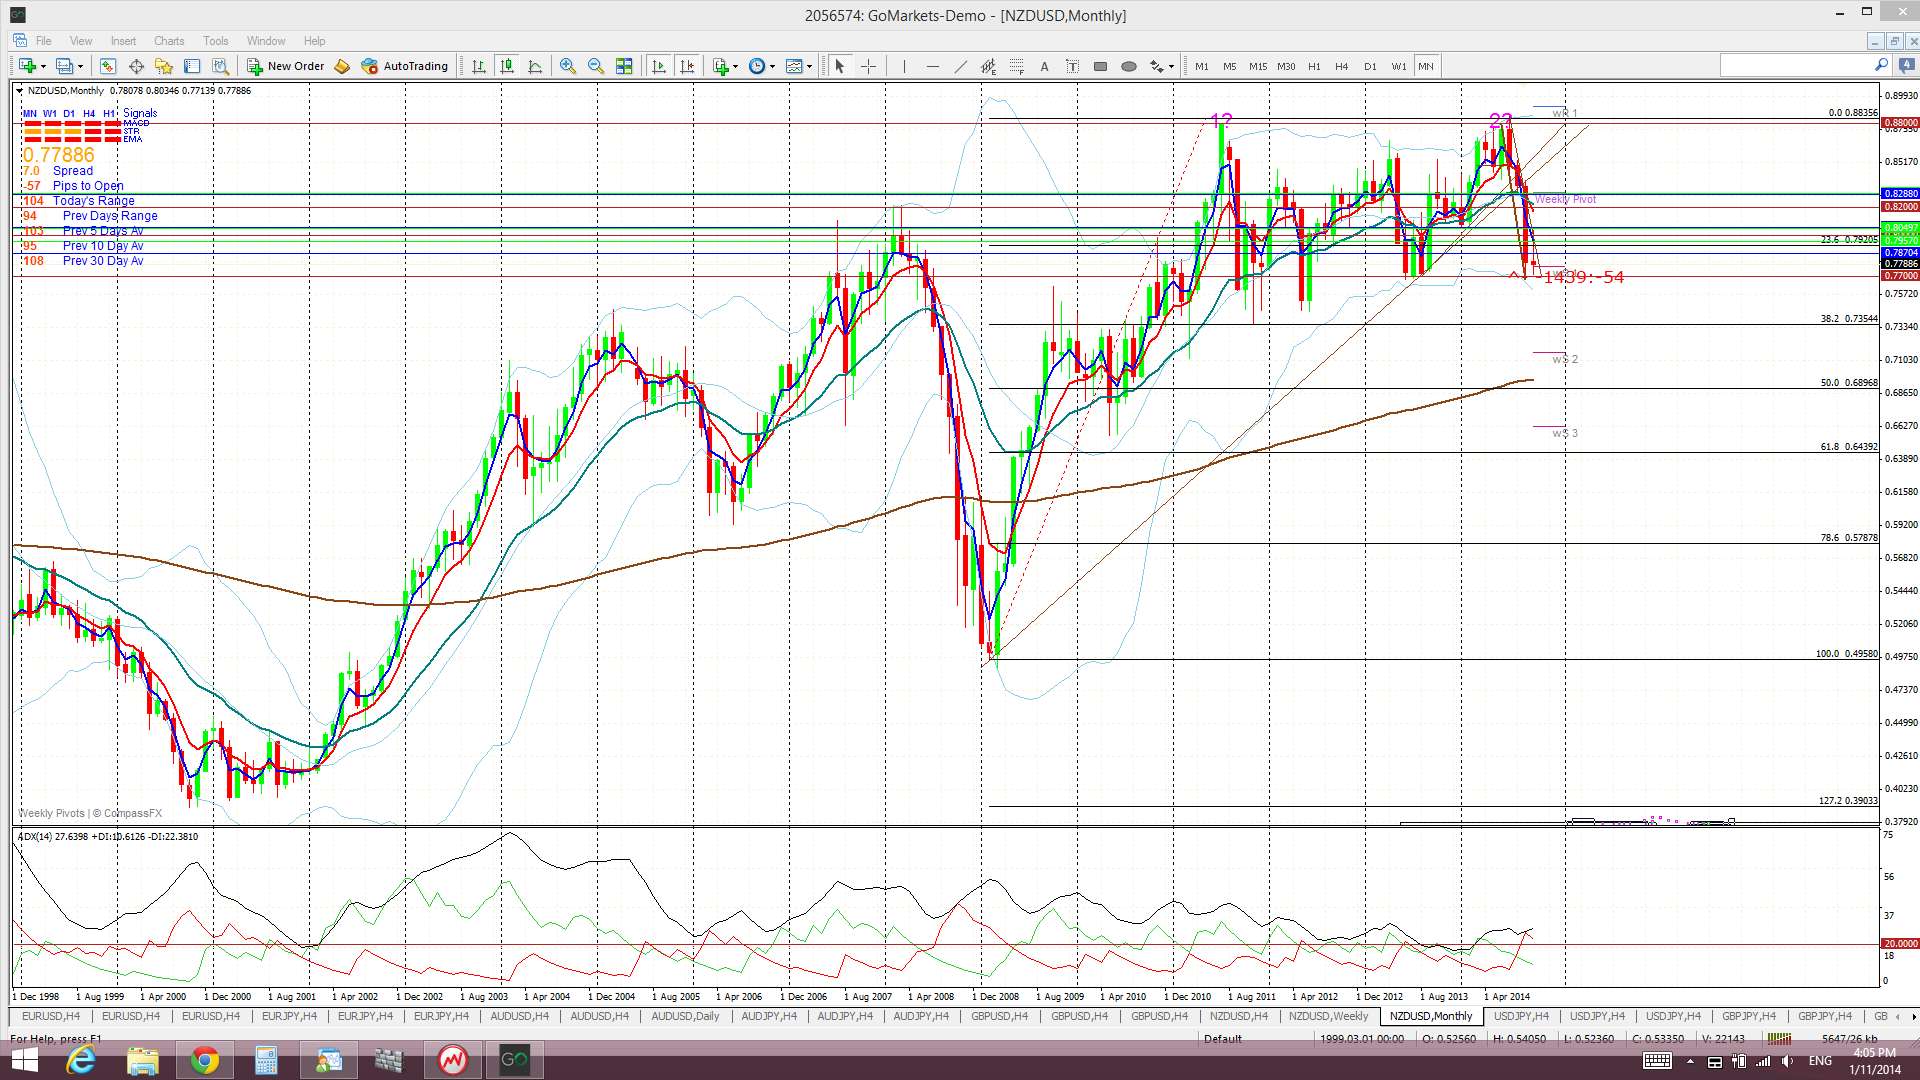
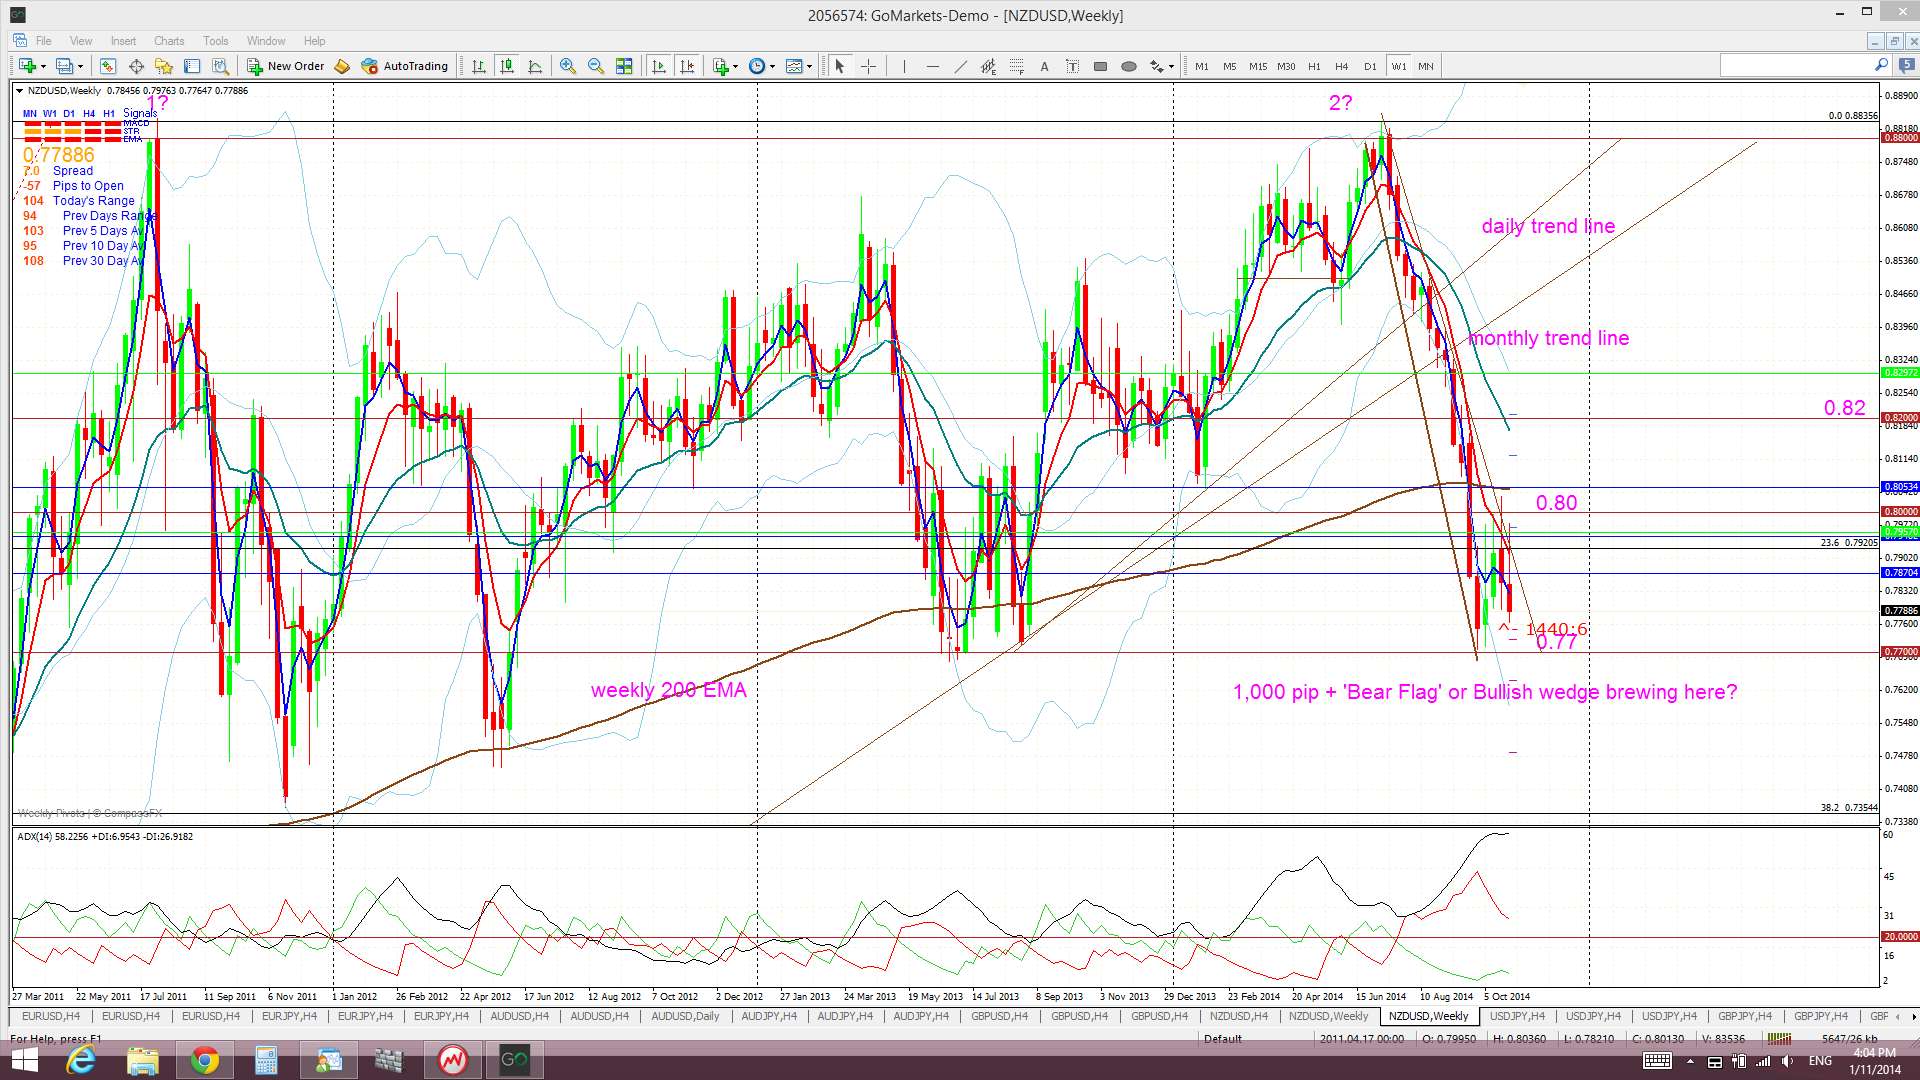
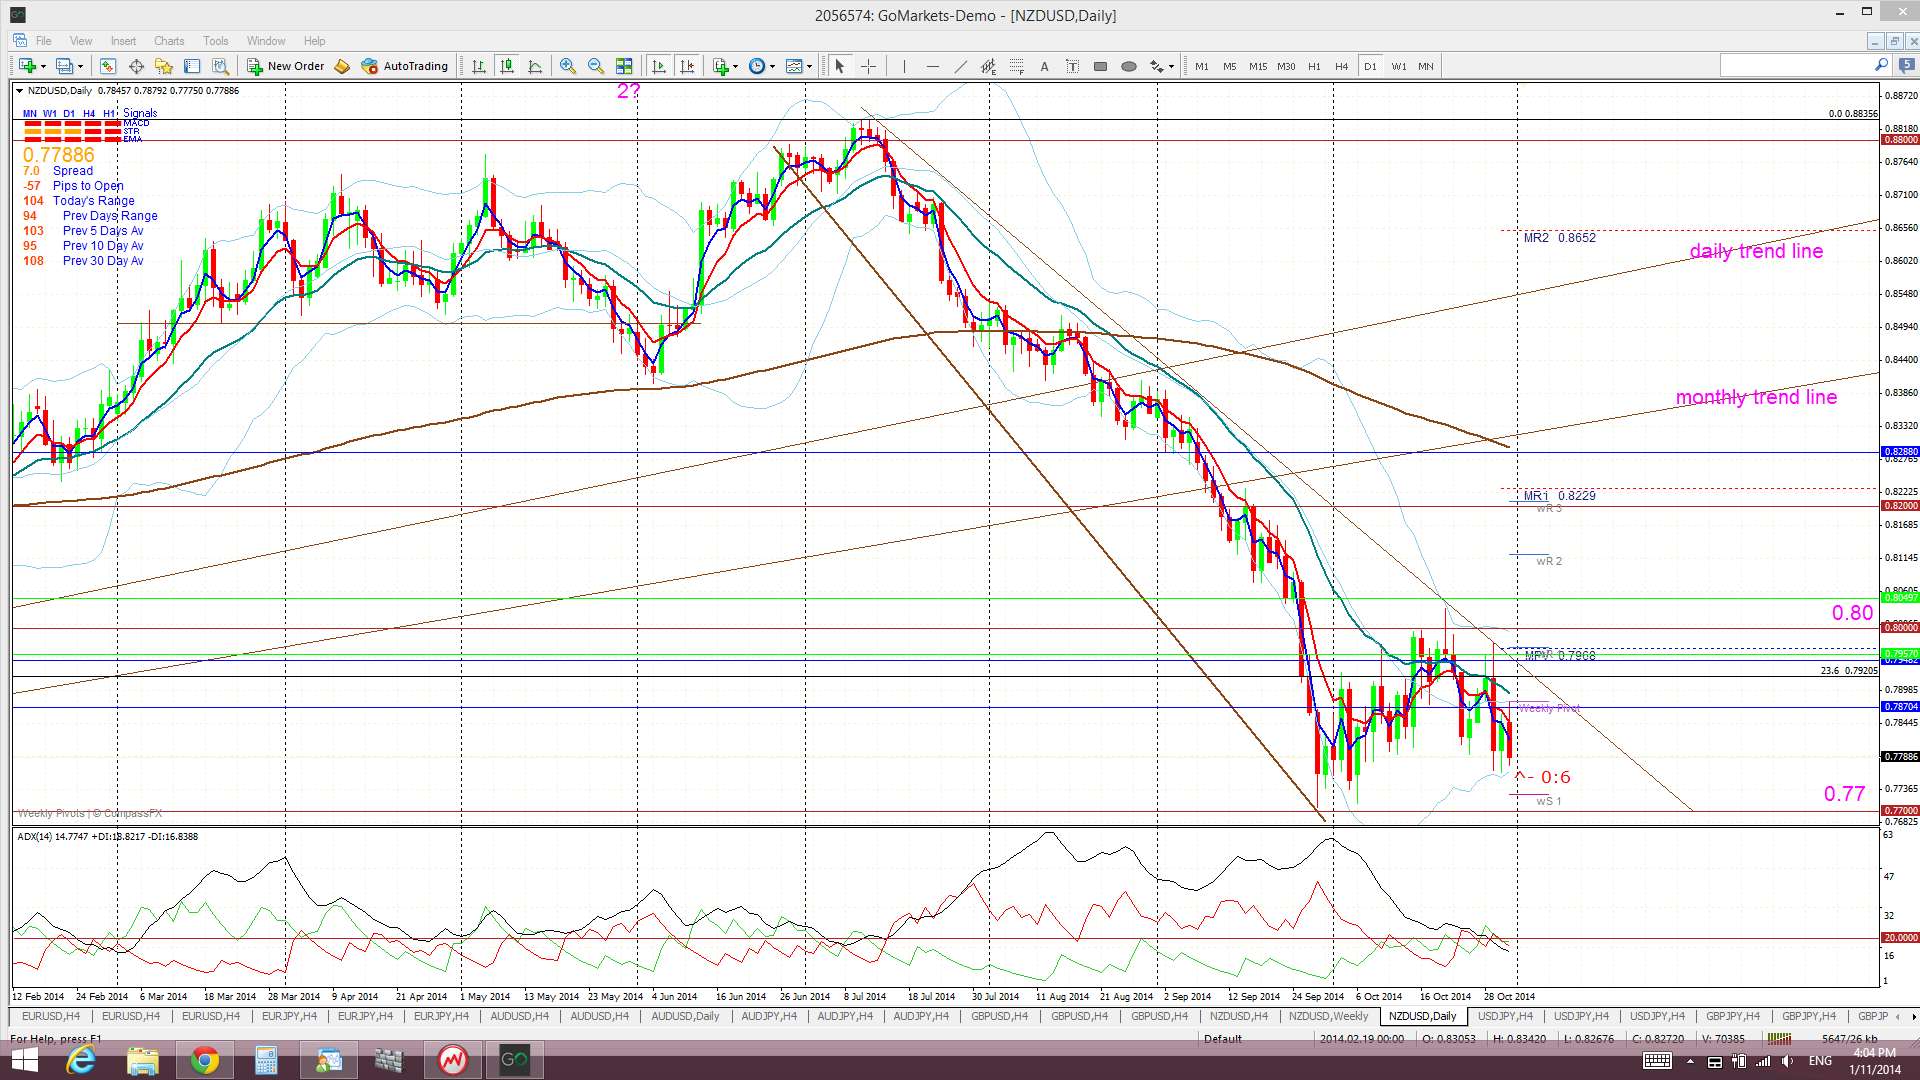
I wrote a separate article about the Kiwi during last week where I noted I was seeing as much of a bullish descending wedge as I was a possible ‘Bear Flag’! Trend line breaks and the 0.77 level remain as key levels to watch here to help guide with the next major directional move for this pair. A break and hold below the 0.77 level would trigger the start of a ‘Bear Flag’ move.
Bear Flag for Kiwi: The ‘Flag Pole’ for the Kiwi’s ‘Bear Flag’ is about 1,100 pips. Thus, any bearish breakdown and continuation below the ‘Flag’ trend line may be expected to extend by 1,100 pips as well. This would bring the Kiwi down to near 0.67 cents. This level is between the 61.8 and 78.6% fibs of the 2009-2014 bull run. Given that the 0.77 is strong support I would still prefer to wait to confirm any possible ‘Bear Flag’ move until there is a close and hold below this 0.77 level. The 0.77 remains a significant S/R level for the Kiwi. This level represents the previous swing low for the period during mid-2013 and, prior to then, from mid-2012.
Fib levels shows other possible targets for any bearish continuation below 0.77 as being the:
- 38.6% fib near 73.5.
- 50% fib near 70 and the weekly 200 EMA.
- 61.8% fib near 0.65.
Price is still trading below the Ichimoku Cloud on the 4hr, daily and weekly charts but in the top edge of the Cloud on the monthly chart.
The weekly candle closed as another bearish candle with long upper and lower shadows here reflecting the uncertainty with this pair. The monthly candle closed as a bearish coloured ‘Spinning Top’ also reflecting some indecision here.
The NZD/USD will be impacted by all of the USD sensitive data items this week but there is also NZD employment data scheduled for Wednesday that could trigger big moves for this pair. Kiwi traders need to monitor these data items.
- I’m watching for any new TC signal on this pair, the ‘Flag’ trend lines and the 0.77 level.

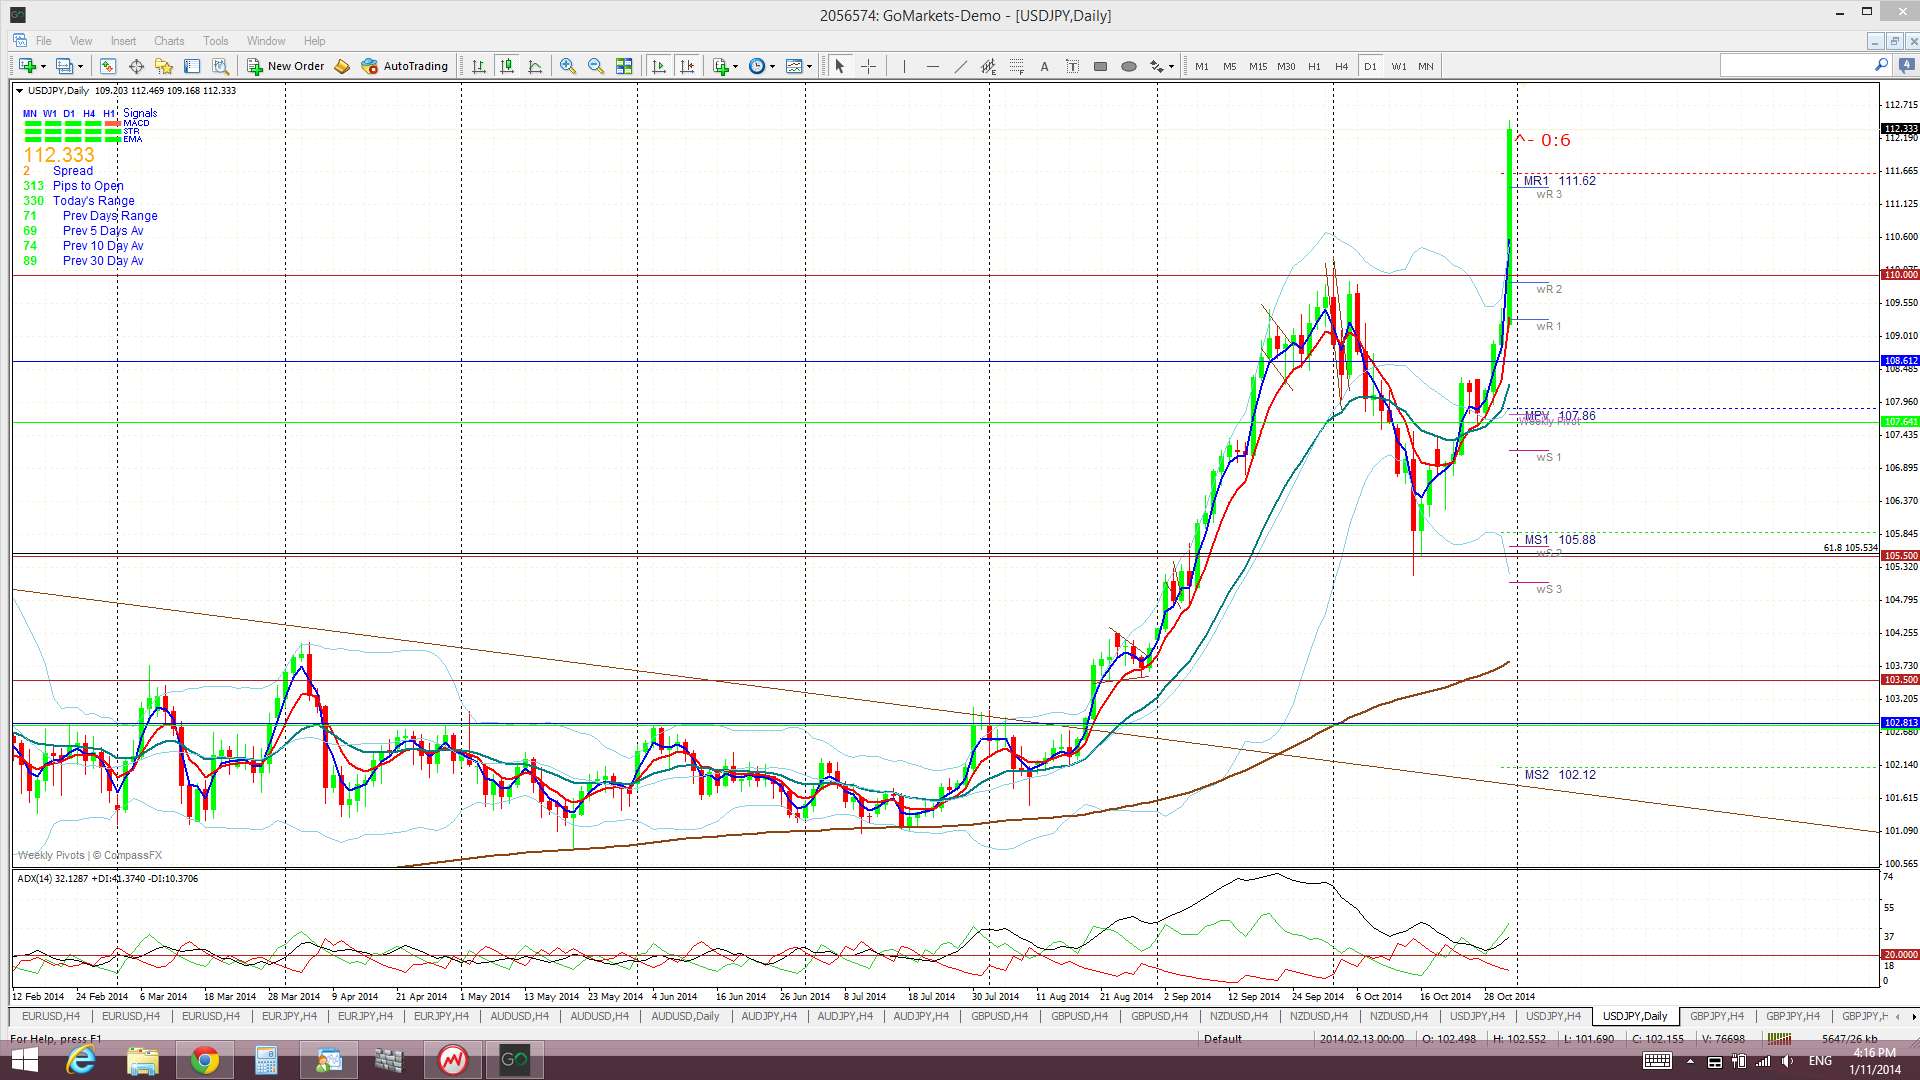
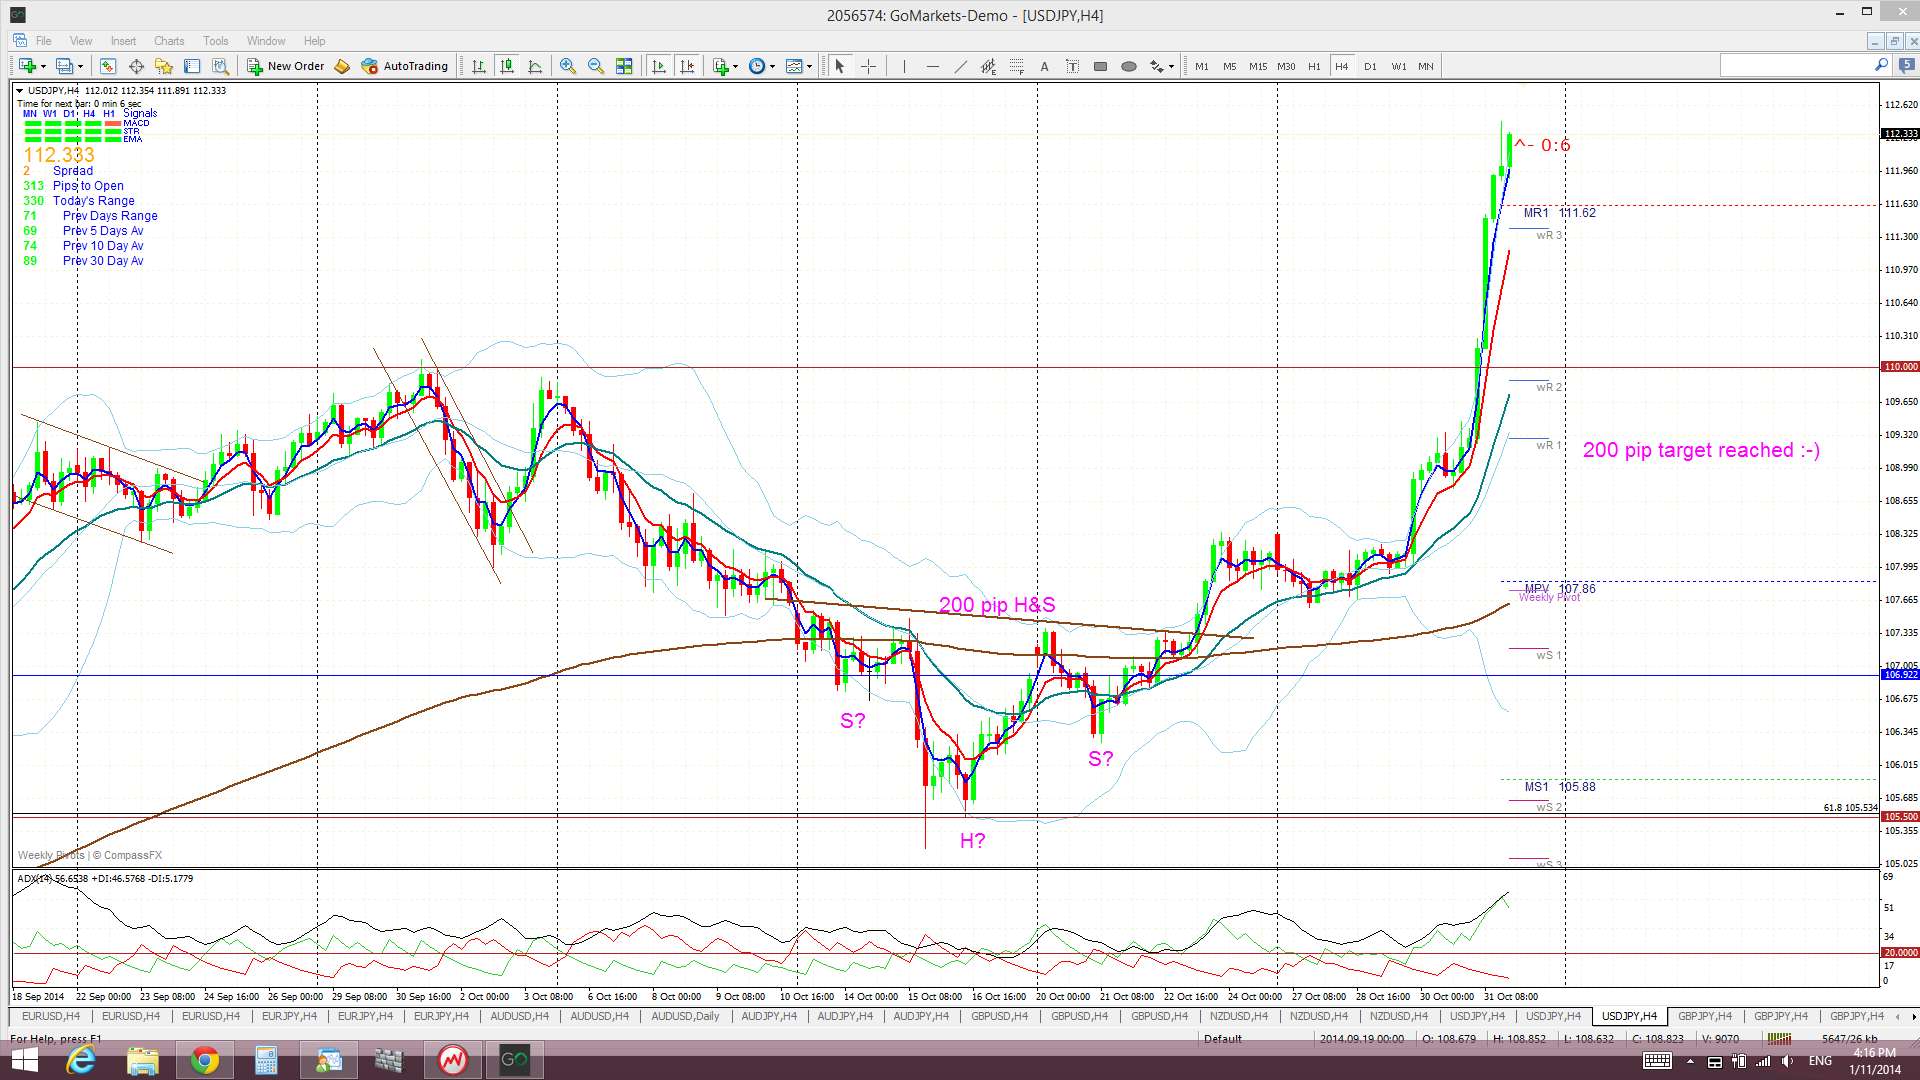
The Yen: U/J: The U/J continued on last week with its bullish bounce up from the 105.5 level. I had been harping on about this 105.5 level for weeks and how I wish I had just left my long order from there alone. It would be about 680 pips by now! Anyway…..move on!
I noted last week how the U/J had made a bullish breakout from an ‘inverse H&S’ pattern and the 200 pip target was eventually recorded on Thursday. BoJ easing late on Friday resulted in the U/J rallying even further though and it easily passed back up through the key 110 level and then went for another 200+ pips! Then next obvious target for the U/J seems to be the 78.6% fib up near the 114 level.
Price is still trading above the Cloud on the 4hr, daily, weekly and monthly charts which is a bullish. November 2013 was the first monthly candle close above the Ichimoku Cloud since mid-2007 and the bullish hold above the monthly Cloud continues to be noteworthy.
The weekly candle closed as a large bullish candle. The monthly candle was bullish as well.
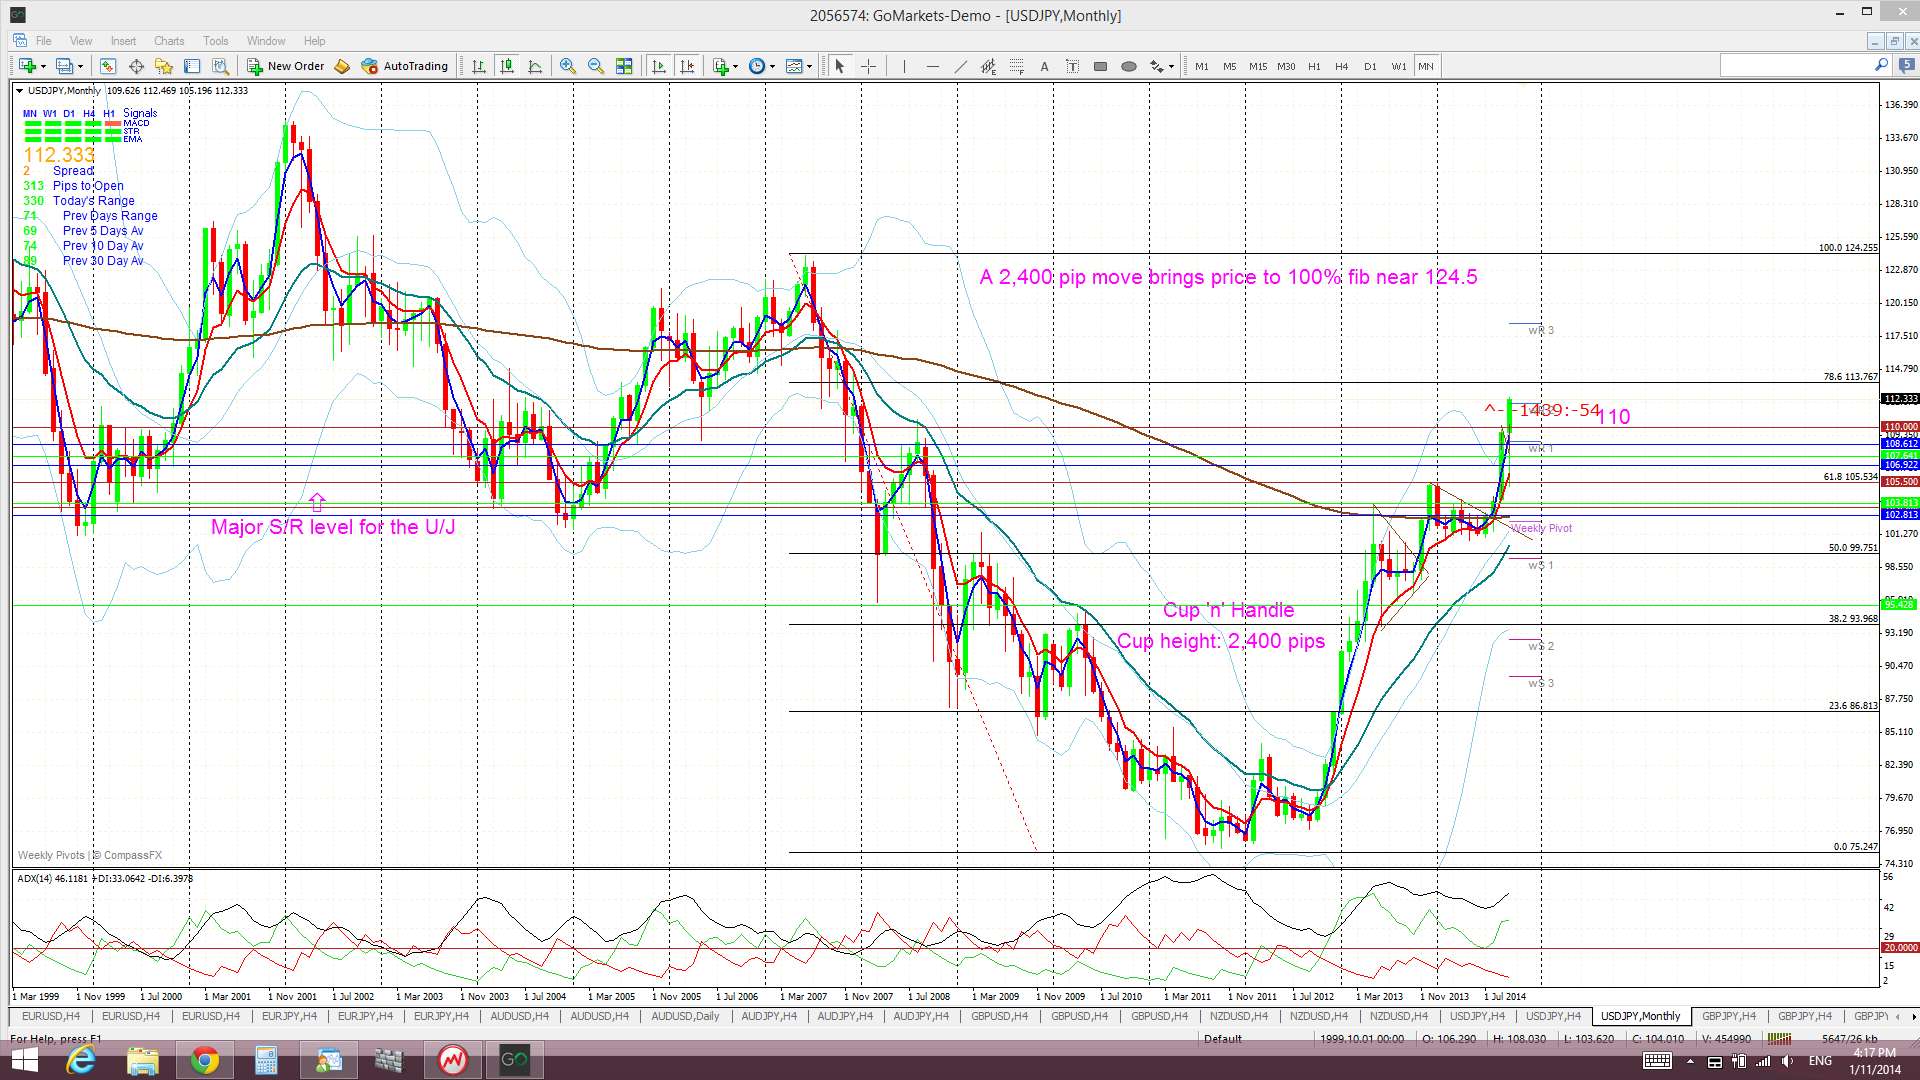
Weekly Chart Bullish Cup’ n’ Handle pattern: This pattern is still taking shape and Friday’s BoJ easing has given this move a re-boot. The theory behind these patterns is that the height of the ‘Cup’ pattern is equivalent to the expected bullish move from the ‘handle’ breakout. The height of the Cup for the U/J weekly chart is around 2,400 pips. The interesting point here is that a 2,400 pip bullish move up from the ‘Handle’ would put price up near the 124 level. This level is the last major swing high for the U/J from back in 2007 and represents the 100% fib pullback for the move down in 2007 to the lows of 2012. Possible targets along the way include the psychological whole number levels and the 78.6% fib that is up near the 114 region.
U/J traders need to watch out for the batch of USD sensitive data this week with Friday’s NFP being the most significant of these. Also, BoJ Gov Kuroda speaks on Wednesday and this should be monitored as well for any follow up commentary about BoJ easing.
- I’m watching for any new valid TC signal and the 78.6% fib near 113.5.

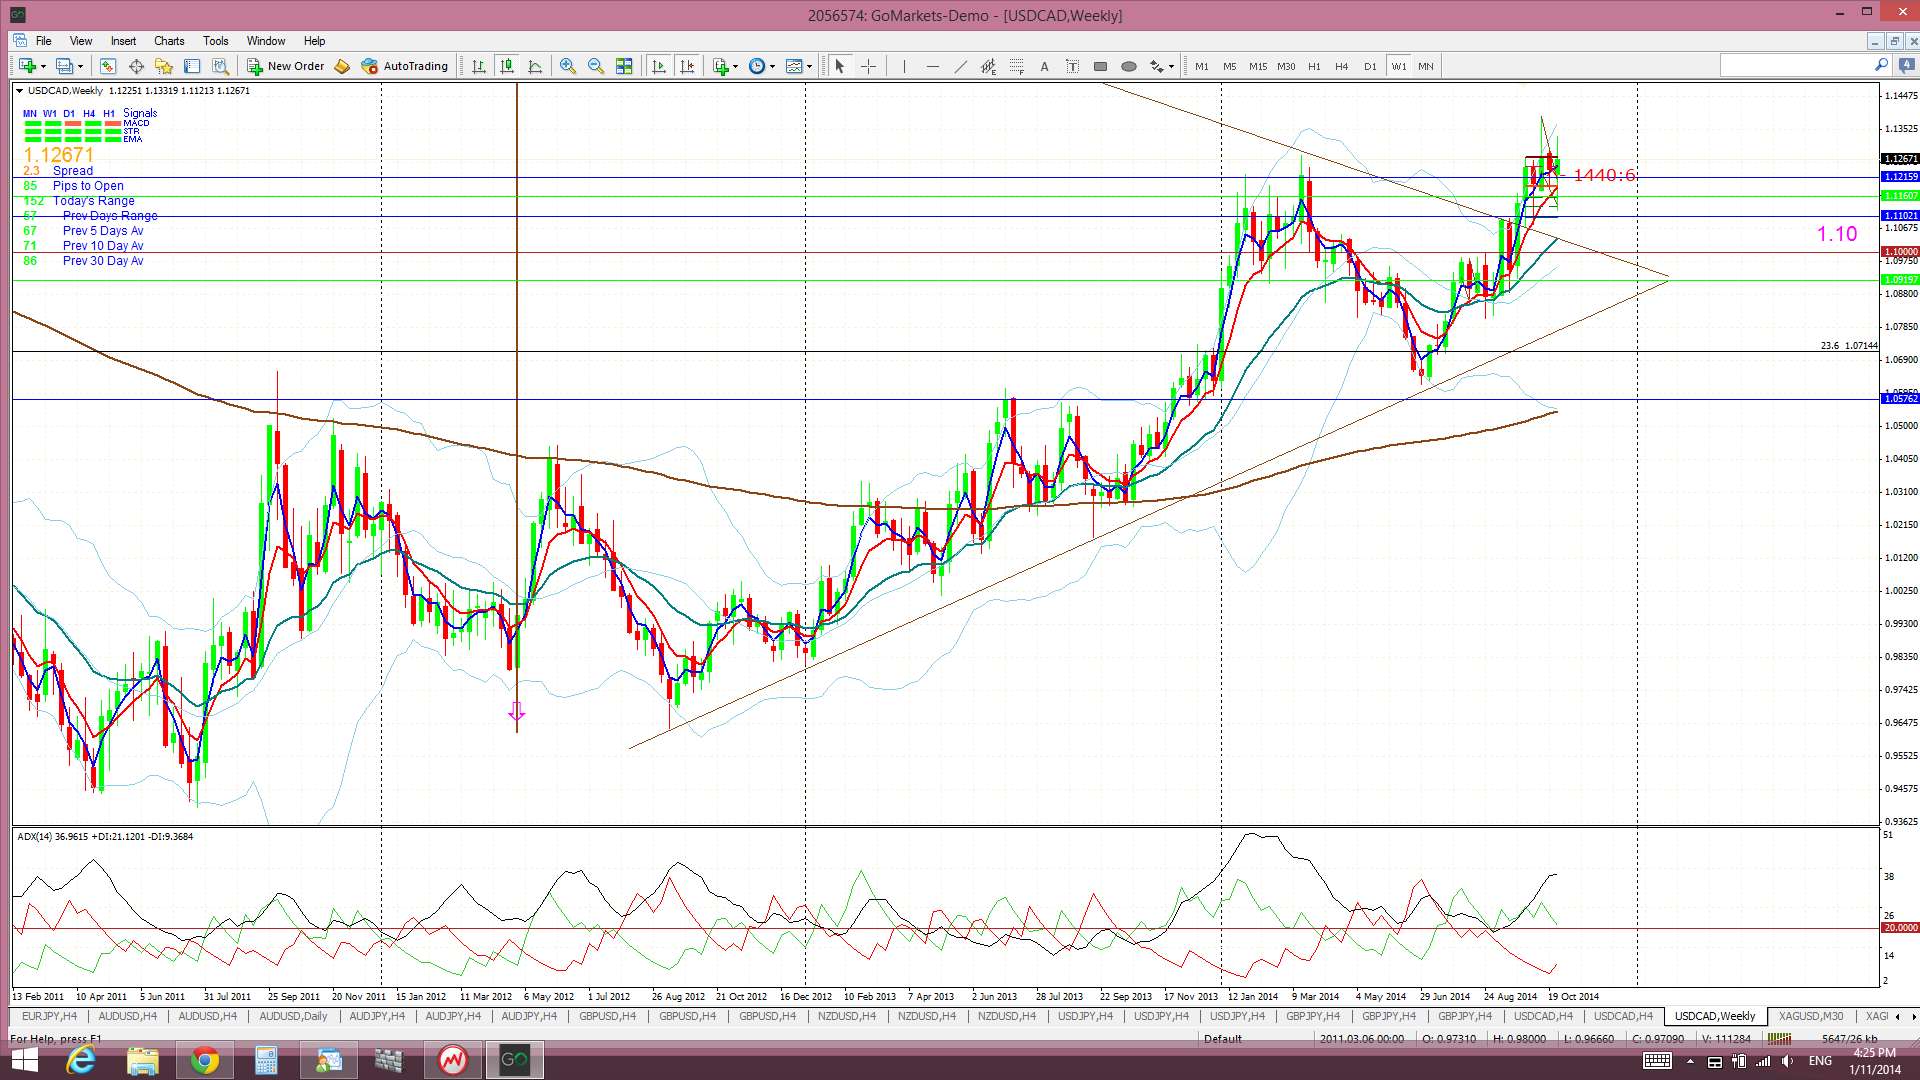
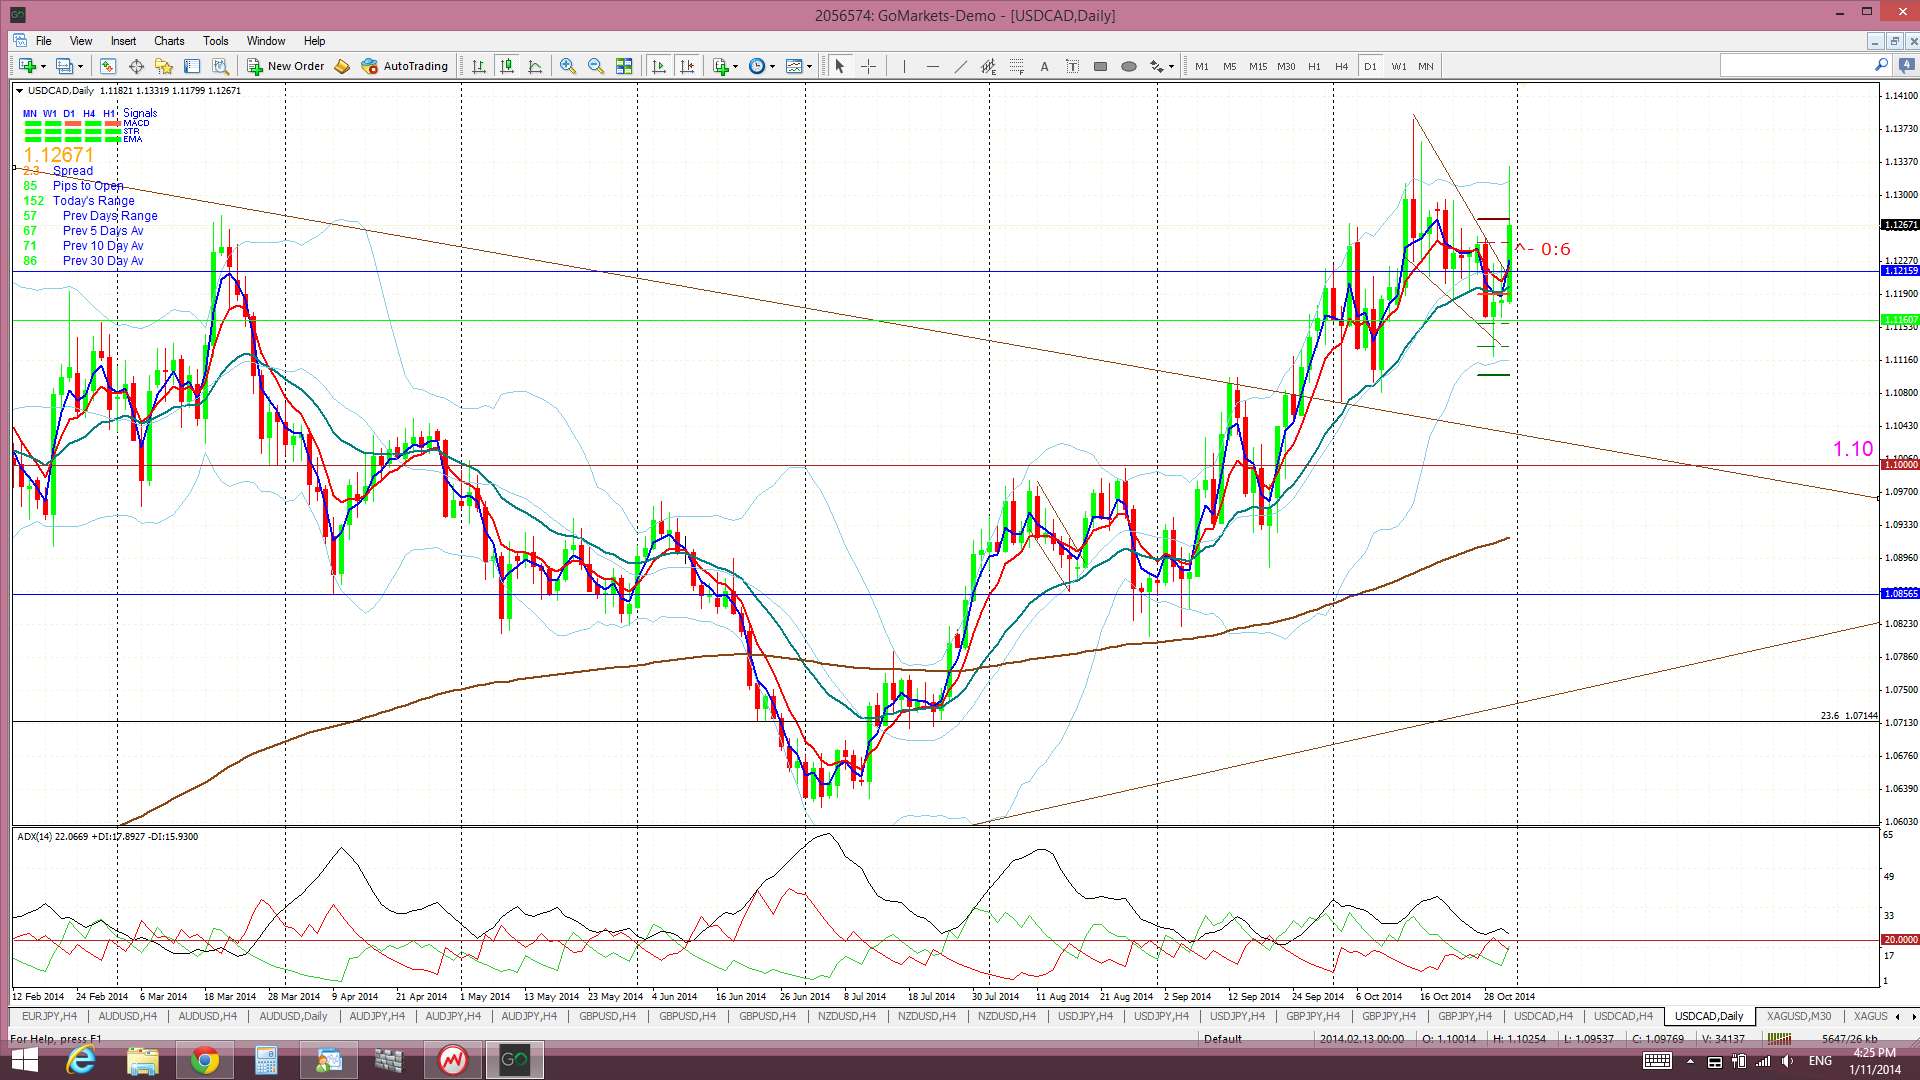
USD/CAD: The USD/CAD chopped lower last week and remained within the 4hr chart’s descending wedge pattern until Friday. The strong USD rally following FOMC did little here but the rally following the BoJ easing, combined with the continued slump with the Oil price, helped to fuel a wedge breakout for this pair. This bullish move also triggered a new TC signal BUT price is still in the 4hr Cloud and so the signal isn’t valid. Traders need to watch for any close above the 4hr Cloud though.
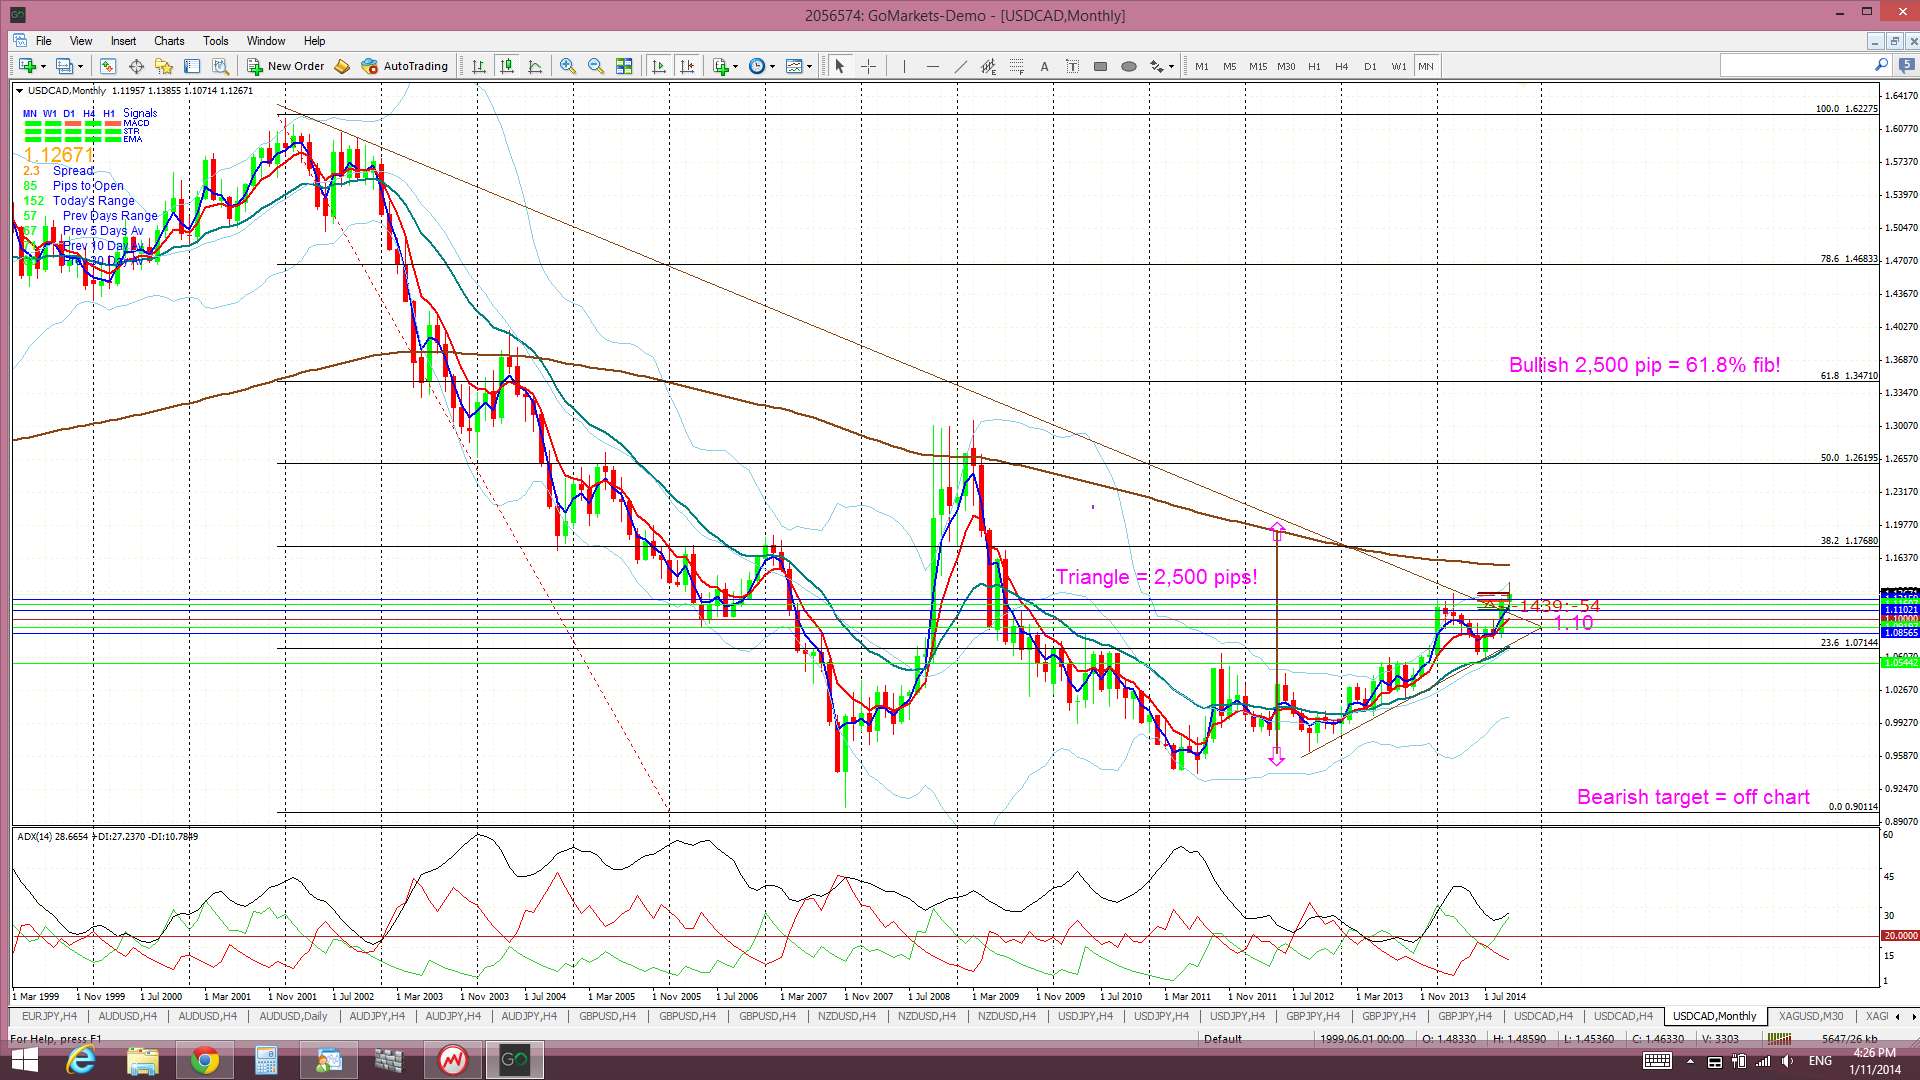
The Loonie has now printed a second monthly candle up and out from a major monthly chart triangle pattern. Technical theory suggests that this breakout move could deliver up to 2,500 pips.
Triangle breakout target: There is a 2,500 pip triangle breakout move evolving on the monthly chart. This 2,500 pip figure is evaluated from the height of the triangle. I have used the triangle height from the beginning of the bull trend line, as shown in the monthly chart below. The height of the triangle is around 2,500 pips and, thus, this would be the expected move from any breakout action. This is where it gets interesting! Extrapolating a bullish move from this triangle places price up at the 61.8% fib level. These fibs levels are popular targets in retracement moves and so this adds some confluence to this as a possible target.
Price is now trading in the top edge of the Cloud on the 4hr chart, above the Cloud on the daily and weekly charts and is has now emerged from the Cloud on the monthly chart which is a bullish development.
The weekly and monthly candles closed as bullish candles.
There is a bit of CAD sensitive data this week with Trade Balance and BoC Gov Poloz speaking twice on Tuesday, CAD Building permits on Thursday, CAD Ivey PMI on Friday as well as all of the USD data and especially Friday’s NFP. Traders need to monitor these data items if trading this pair.
- I’m watching for any new TC signal, the monthly triangle breakout and the 4hr Cloud.

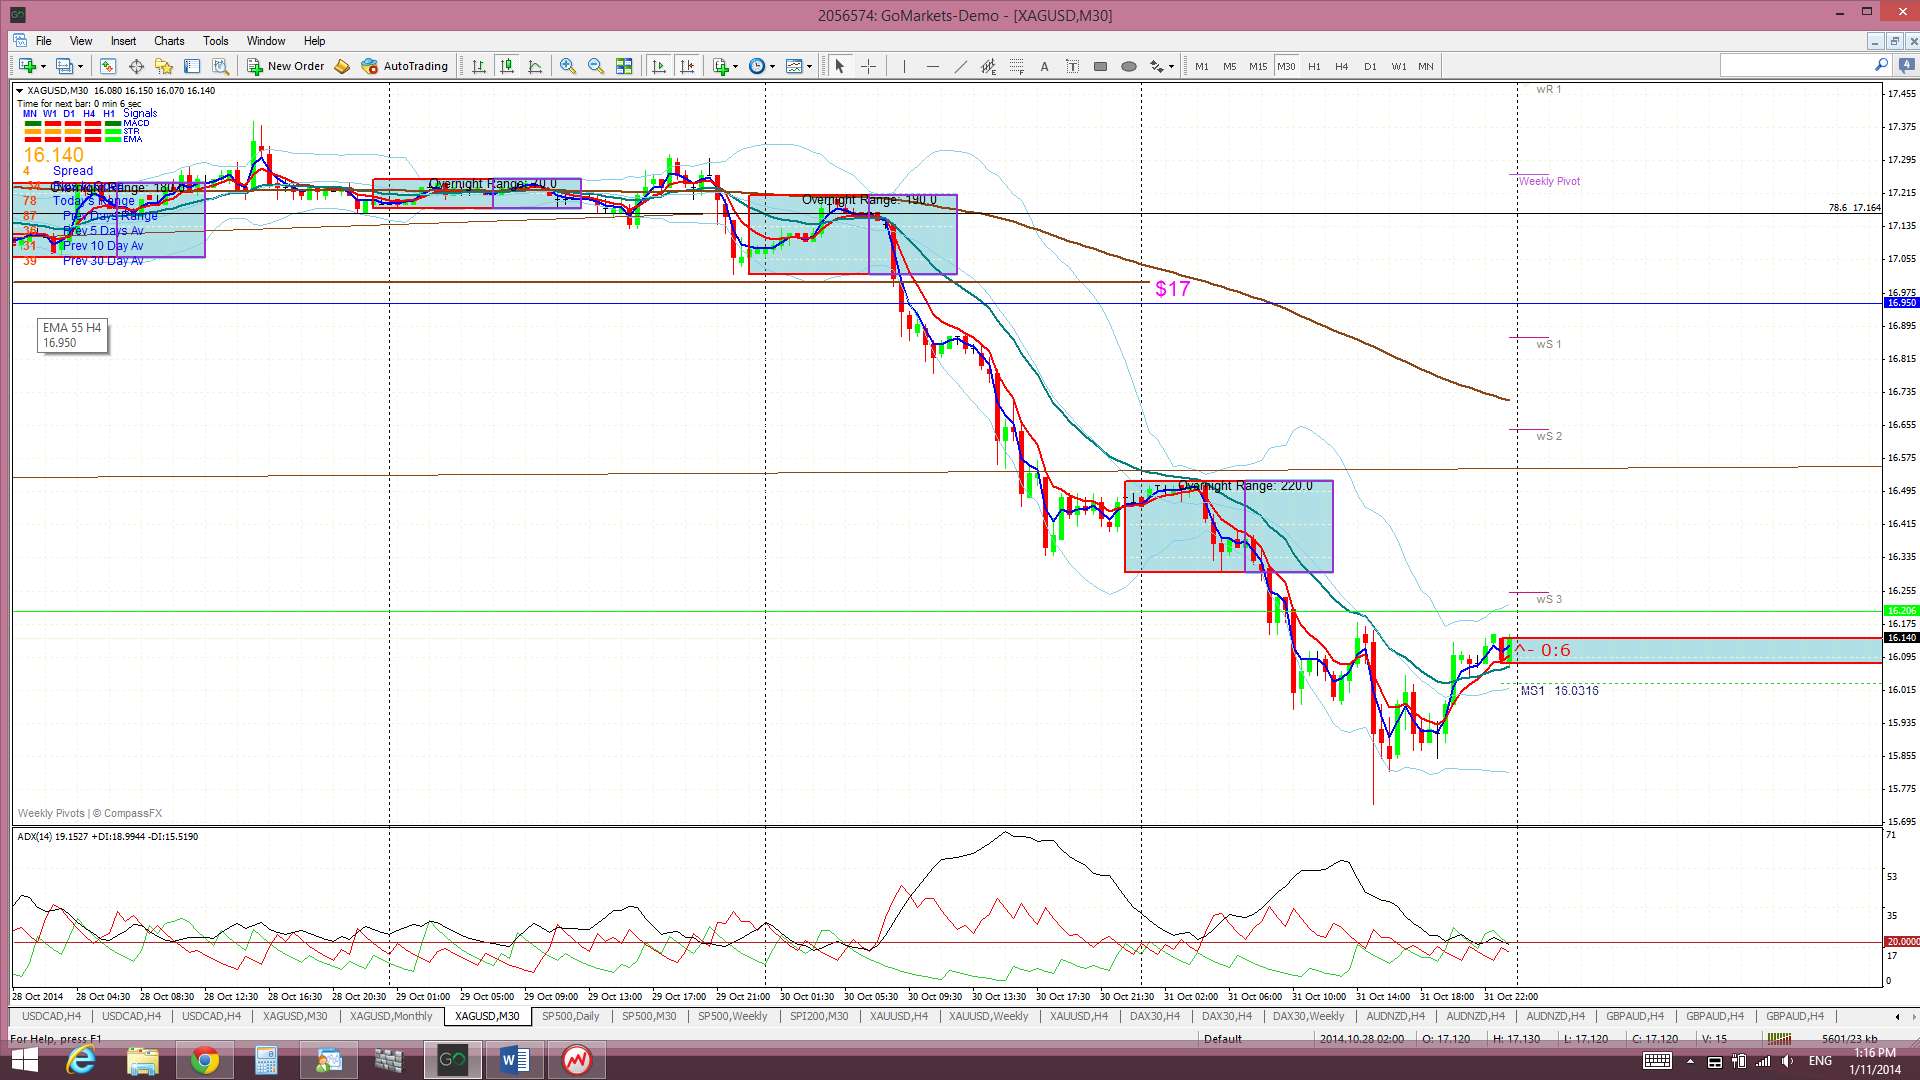
Silver and Gold: both metals have fallen below key support and their 30 min charts reveal the excellent trading opportunities that both offered up last week
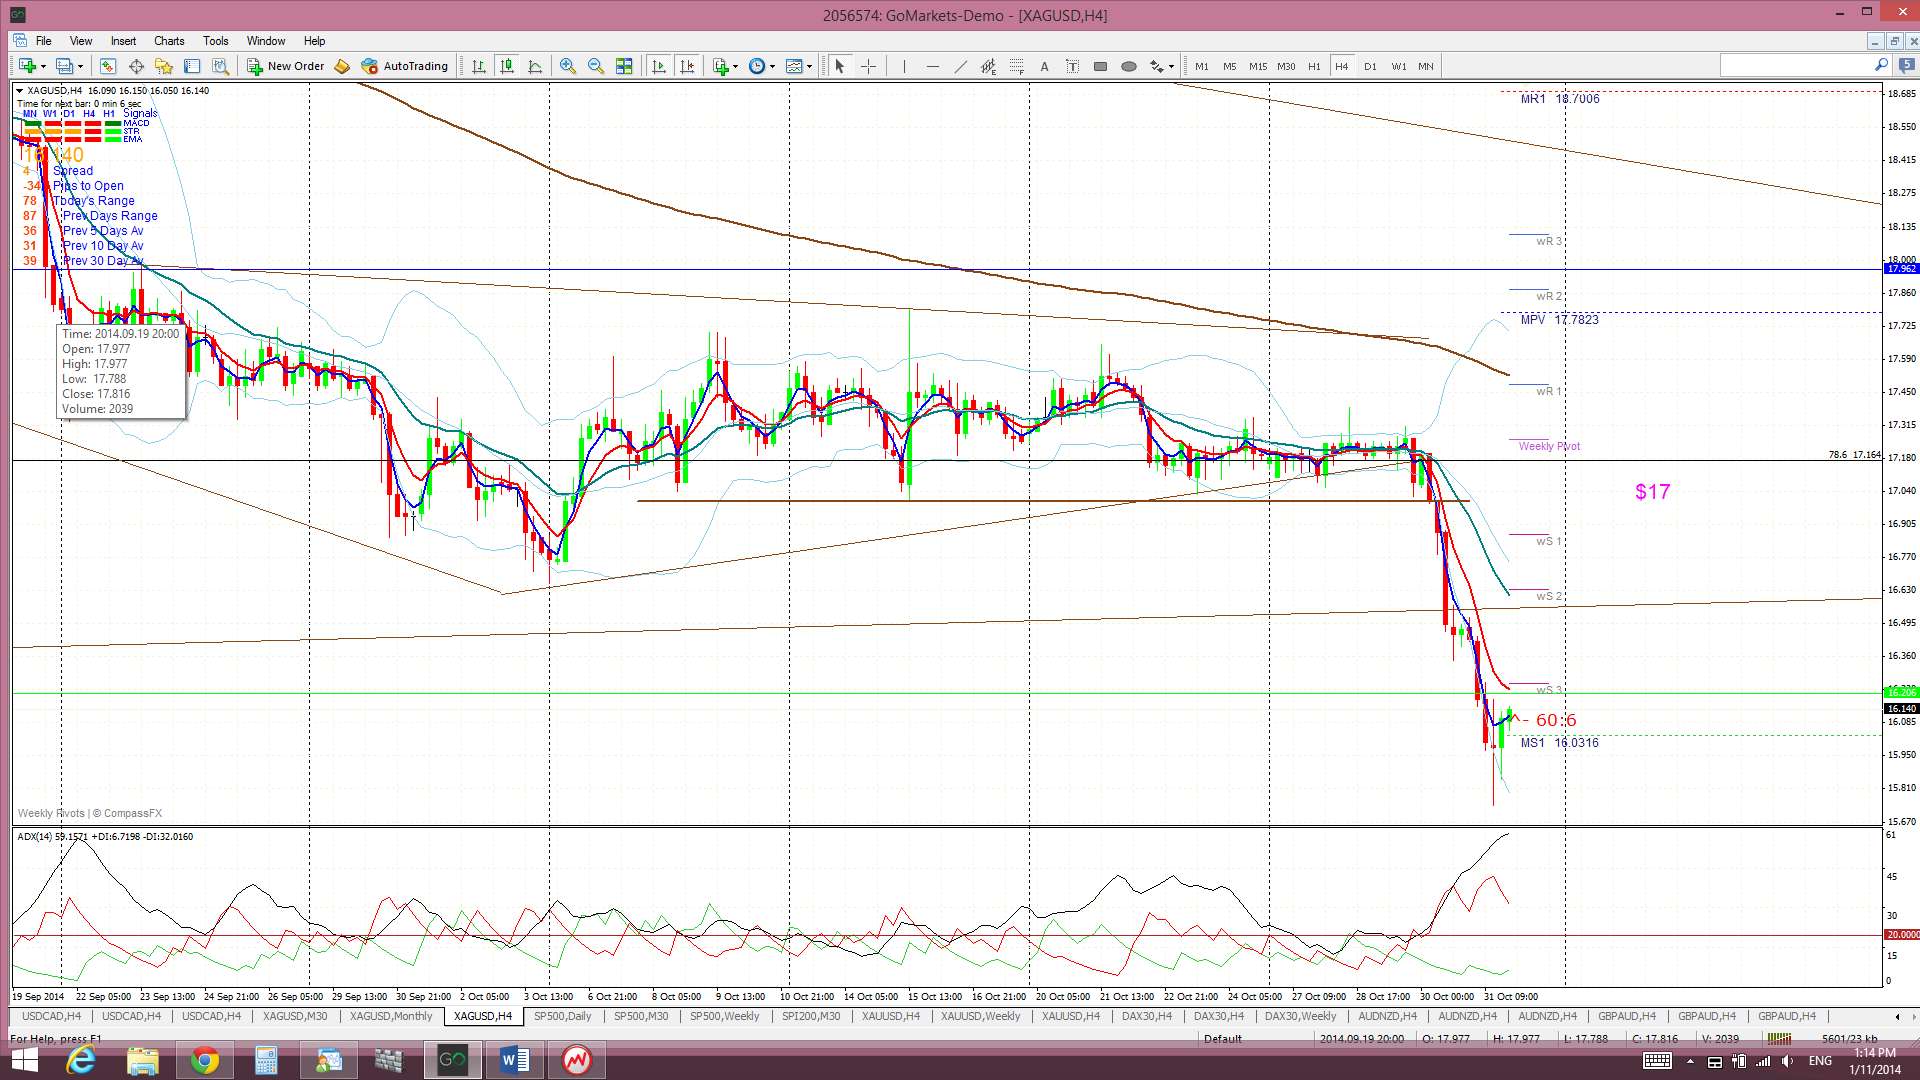
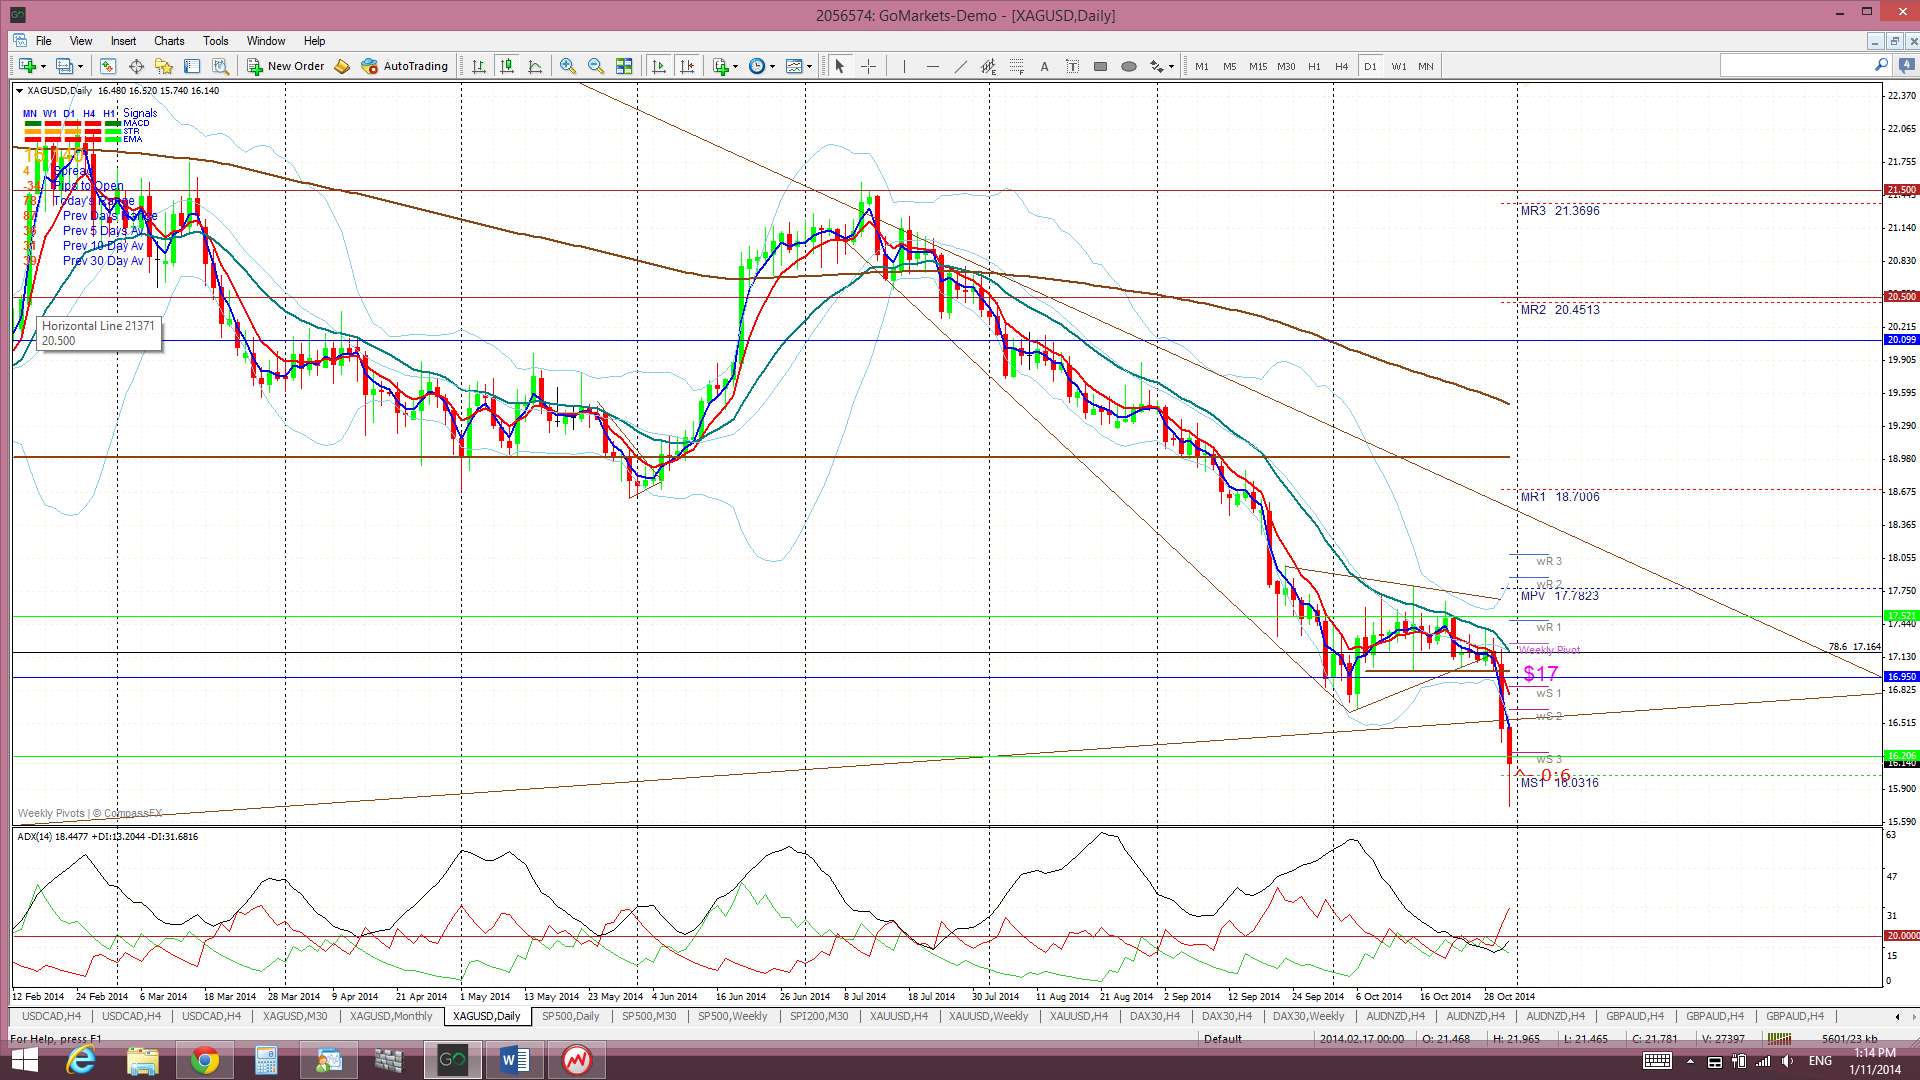
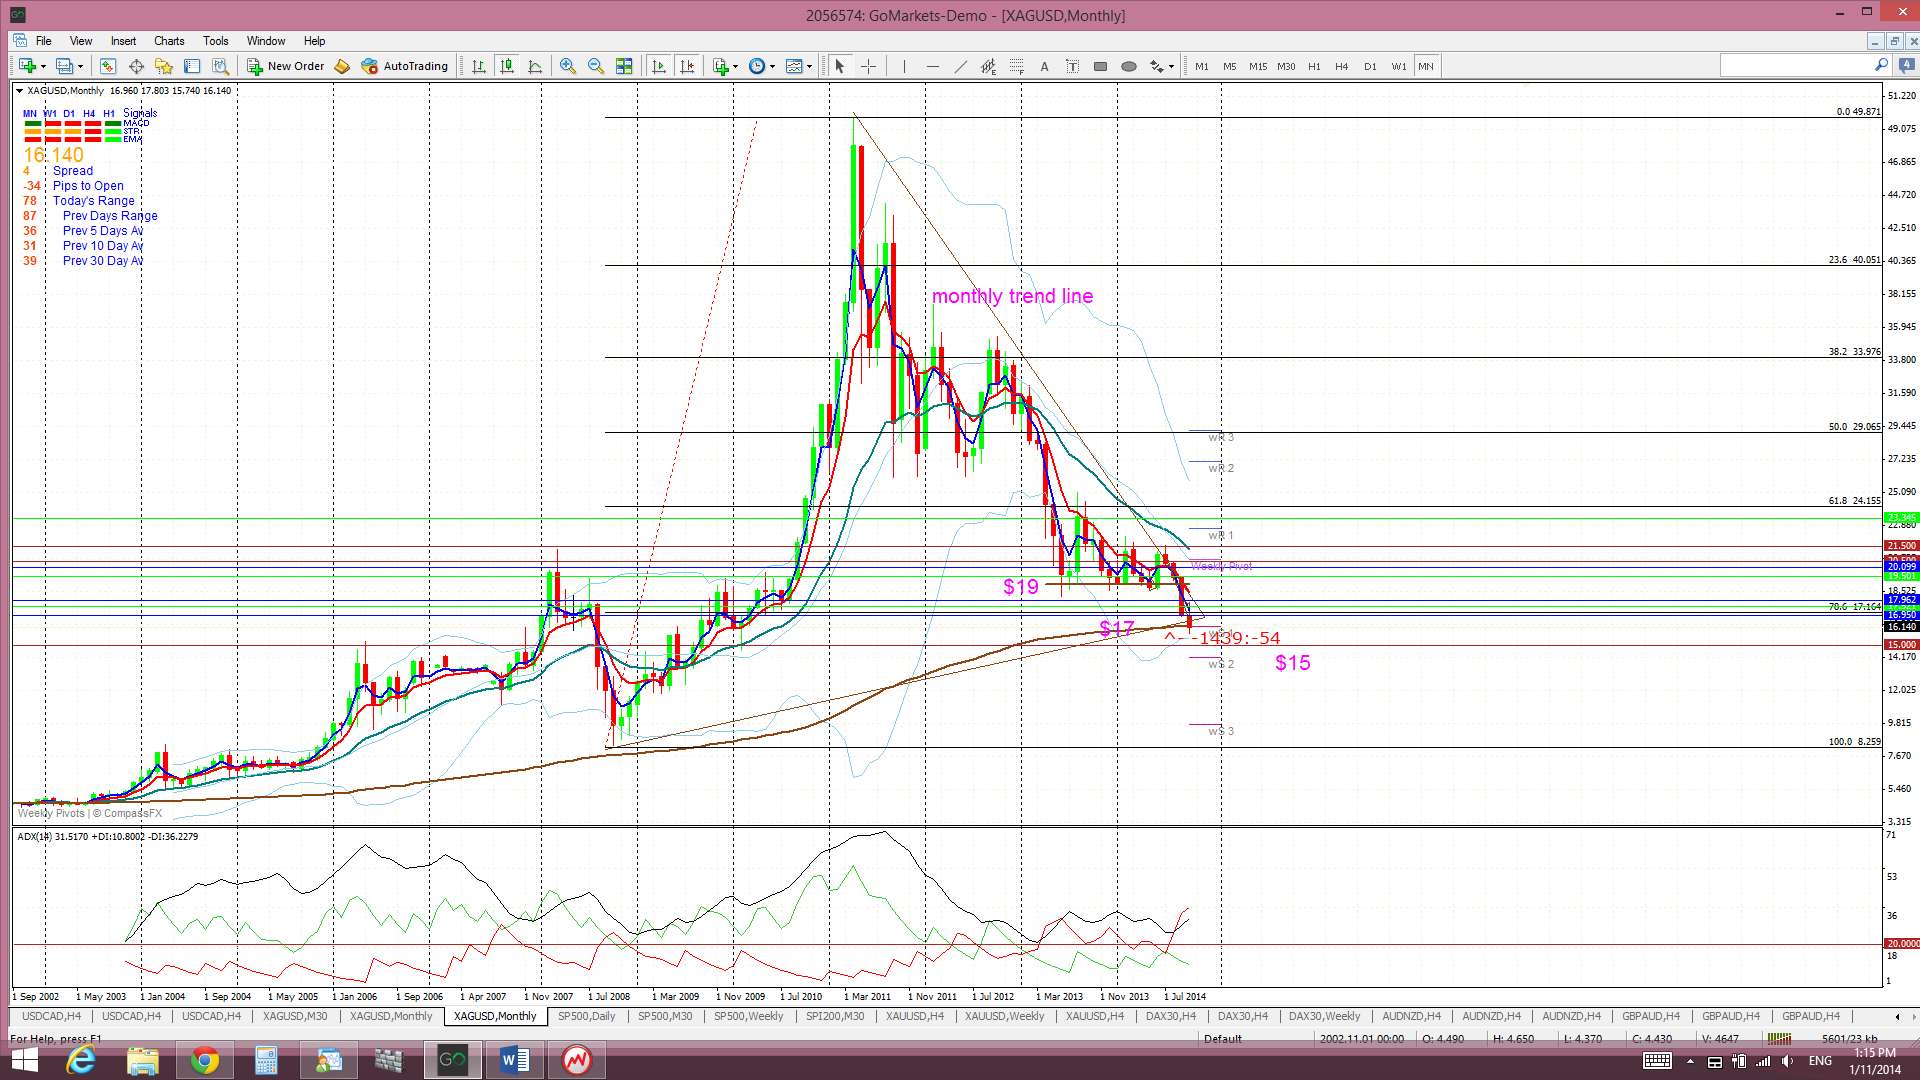
Silver: Silver chopped sideways again last week along the $17 level until mid week. USD strength following FOMC, and then again following the BoJ easing, resulted in Silver falling through $17 support and through the monthly chart’s triangle pattern. The Bear Flag look on the daily chart is starting to seem ominous here too. I wrote a separate article about Silver on Friday which can be found through this link. I had suggested that the $15 level might be the next target and price moved to within 75 cents of this later on that day.
Silver is still trading below the Ichimoku Cloud on the 4hr, daily, weekly and monthly charts which is bearish.
The weekly candle closed as a large bearish candle.
Traders need to keep an eye on the USD. Continued strength there will put more pressure on both metals.
- I’m watching for any new TC signal and the $15 level.

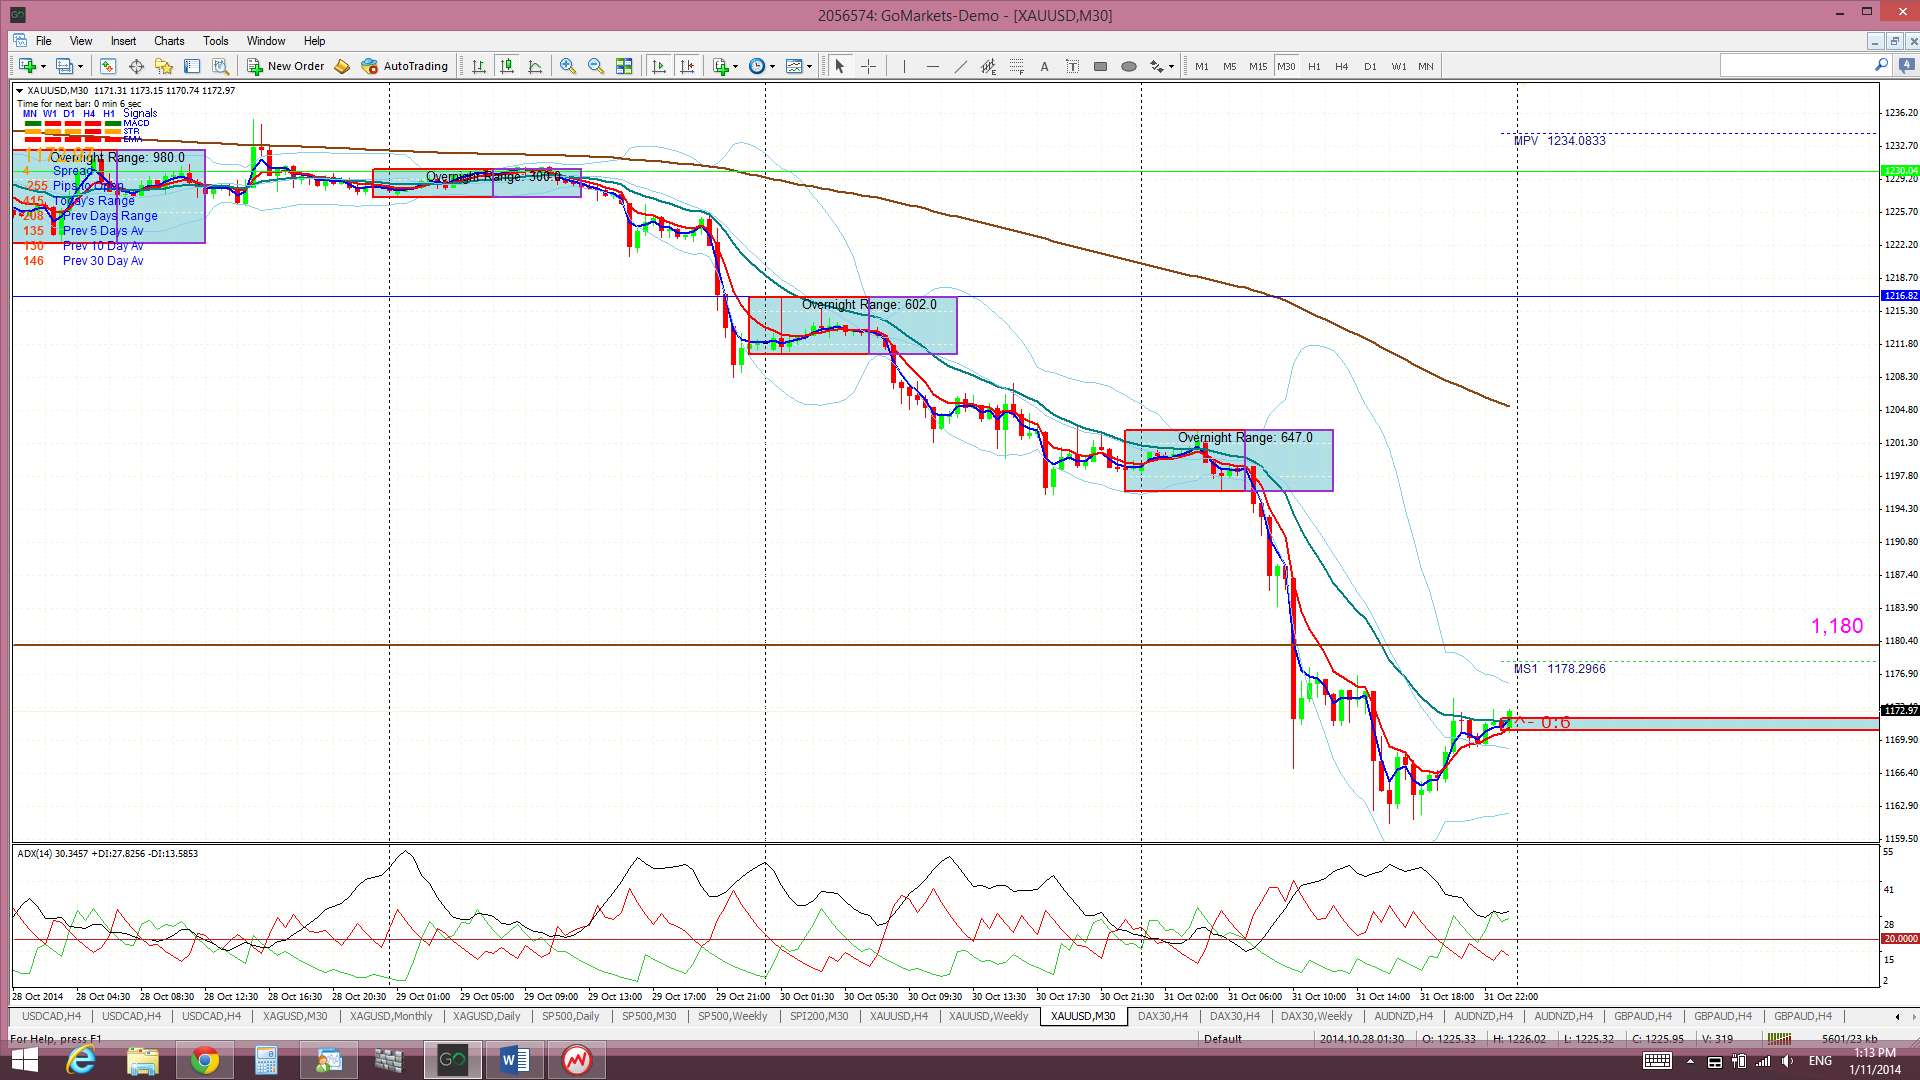
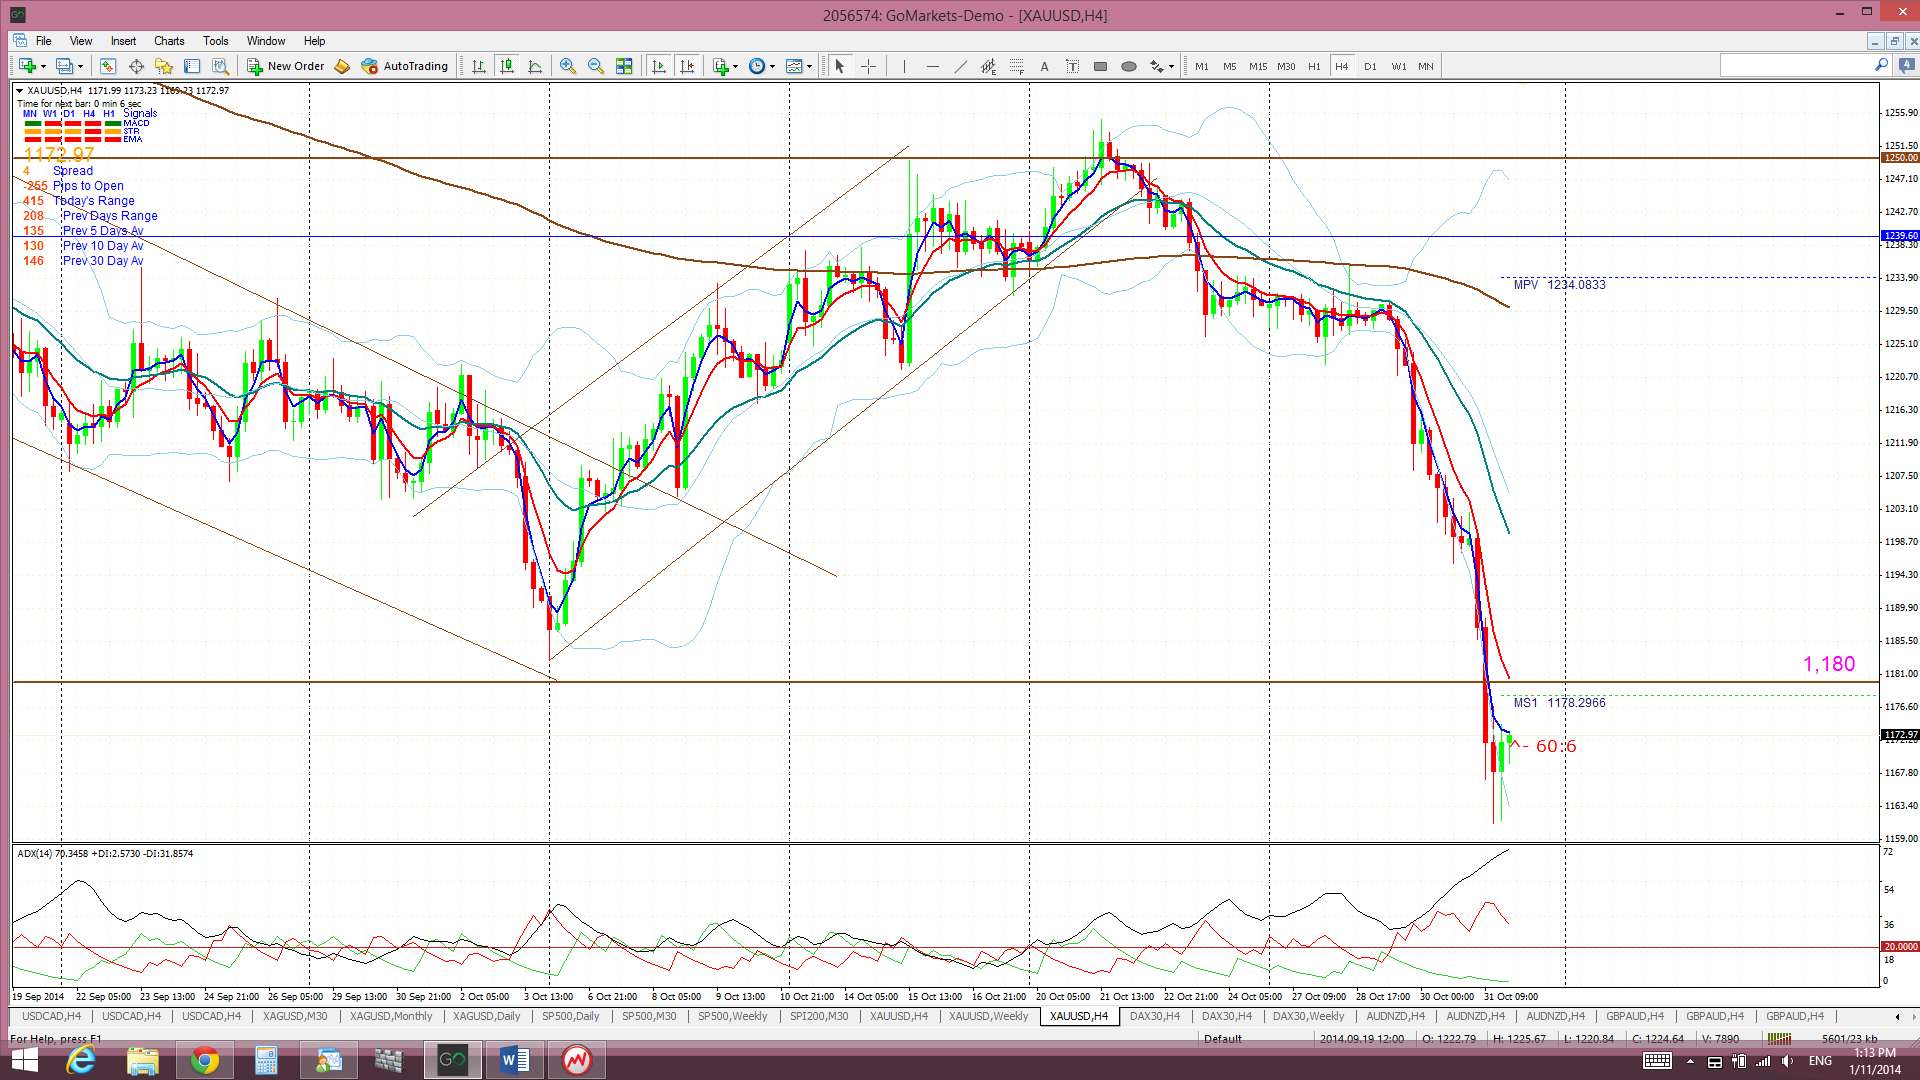
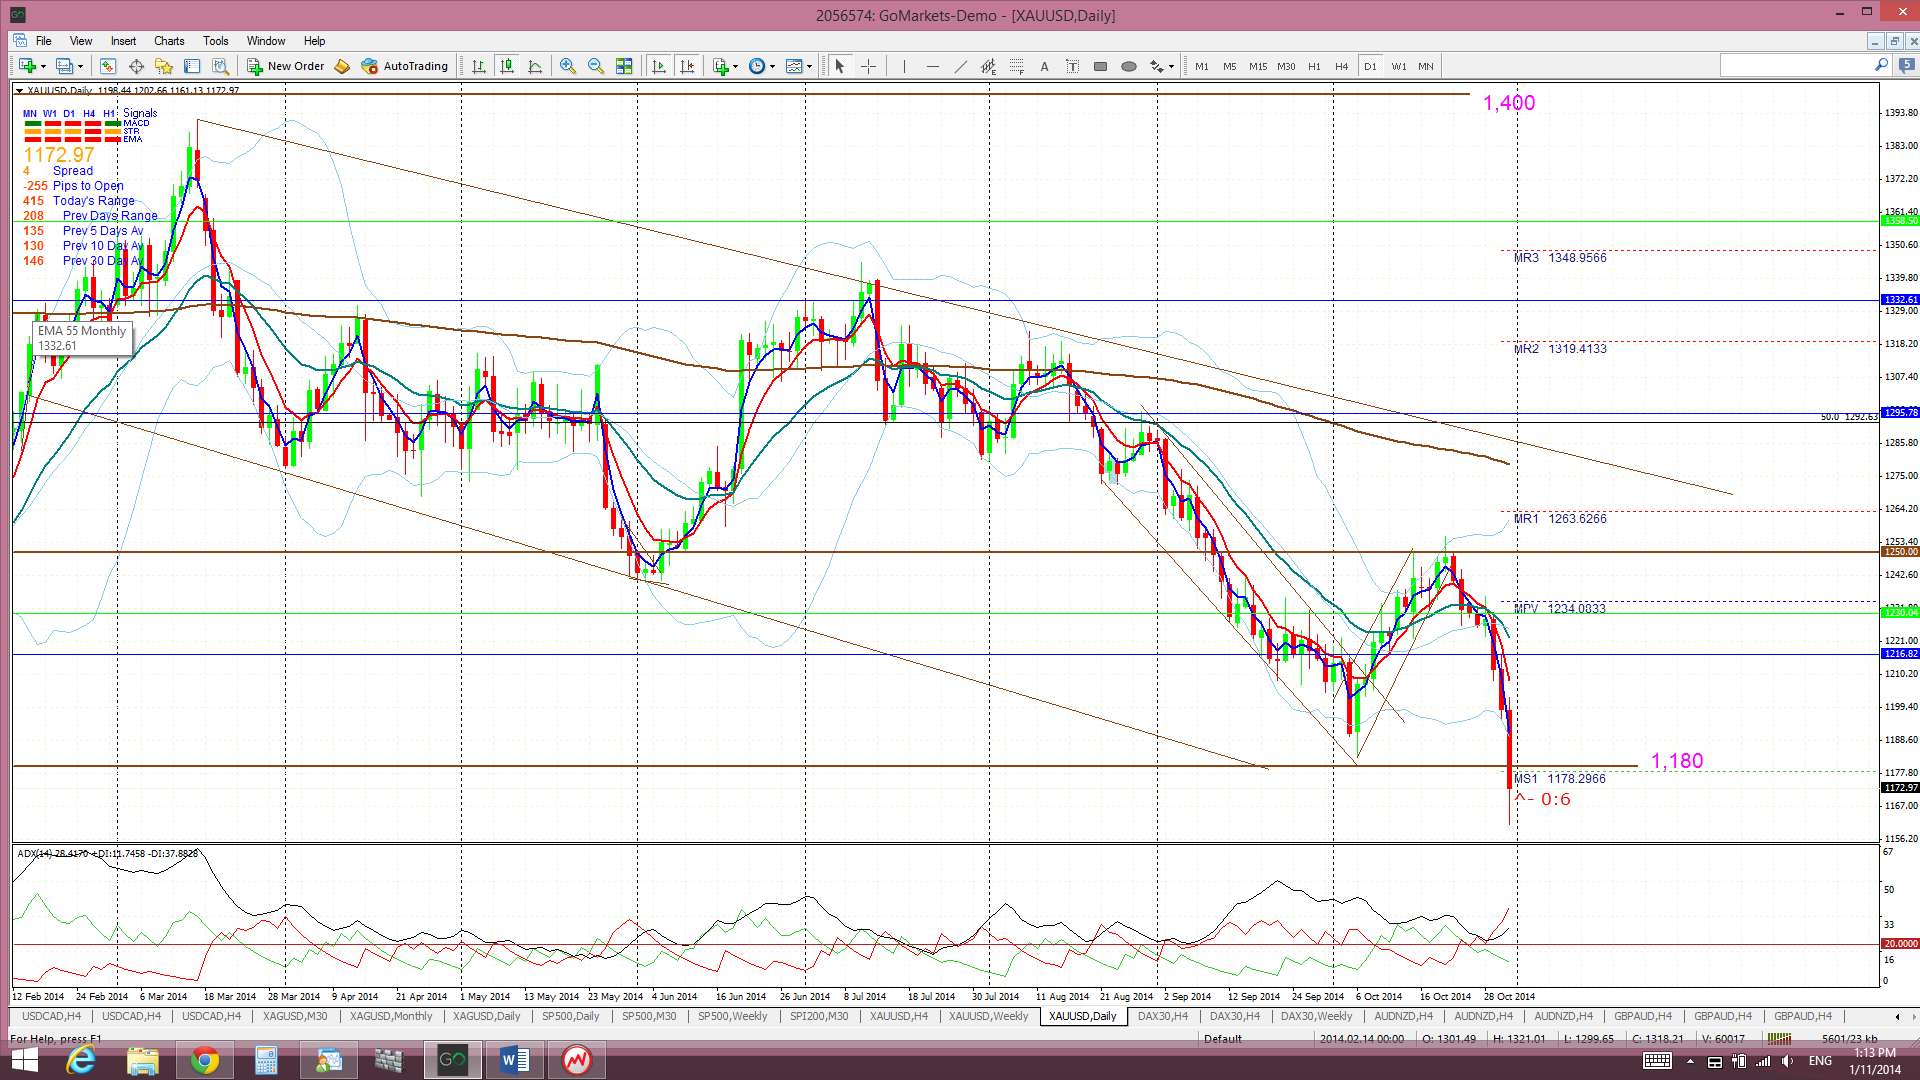
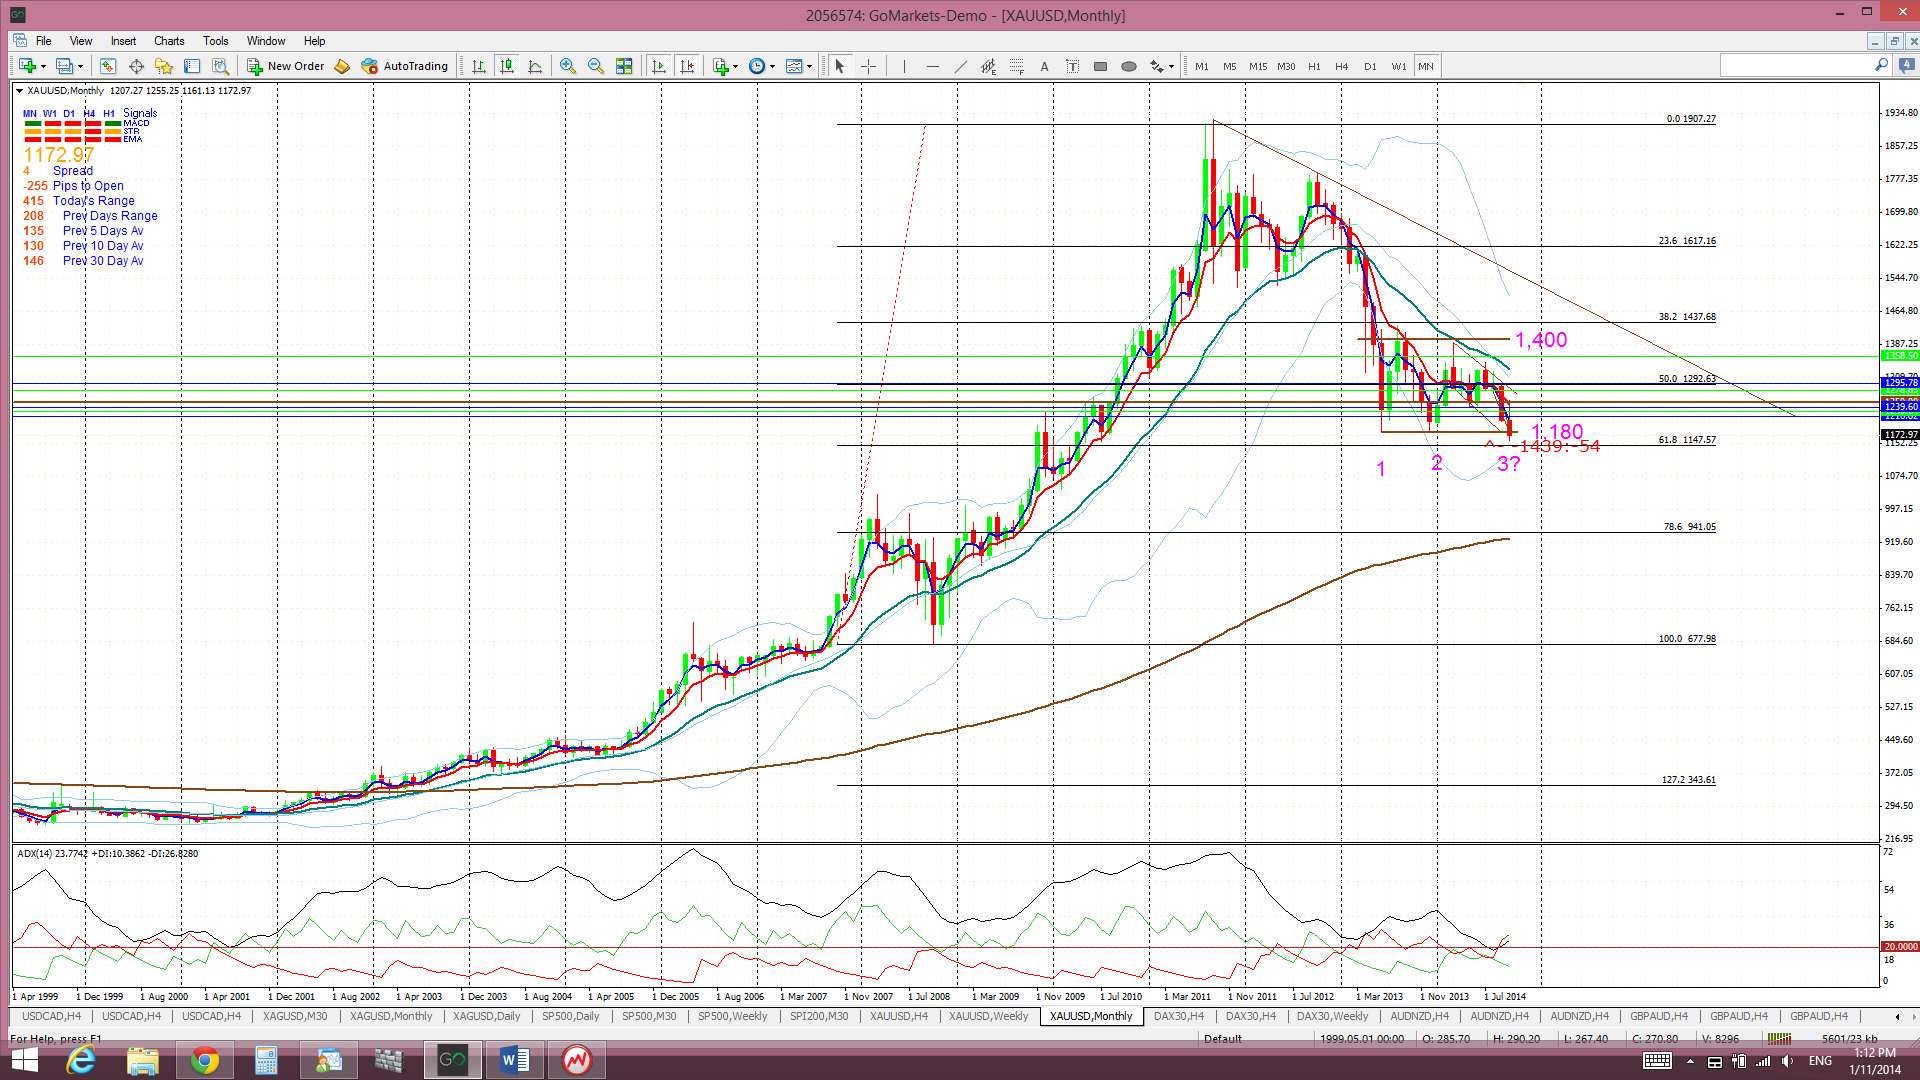
Gold: Gold continued the price slide started the week before but USD strength following FOMC, and then with BoJ easing, saw the metal plunge through key $1180 support level. The weekly, and now monthly candle close, below this strong support is very bearish.
I have drawn my Fibonacci levels from the last swing low back in 2008 to the highs of 2011. The next major fib level below current price is the 61.8% level near $1,145. This would be the obvious next major level to look for any support but after that it is whole numbers, with the obvious $1,000 being significant, and then the 78.6% fib near $950.
Gold is now trading below the Ichimoku Cloud on the 4hr, daily, weekly and monthly charts which is a significant bearish development.
The weekly candle closed as a large bearish candle.
- I’m watching for any new TC signal on this pair and the 61.8% fib near $1,145 level.

The post FX, stocks and Gold: had a big week but is more to come? Trade Week Analysis. appeared first on www.forextell.com.