Key Highlights
· GBP/USD rallied recently above the 1.2900 and 1.2950 resistance levels.
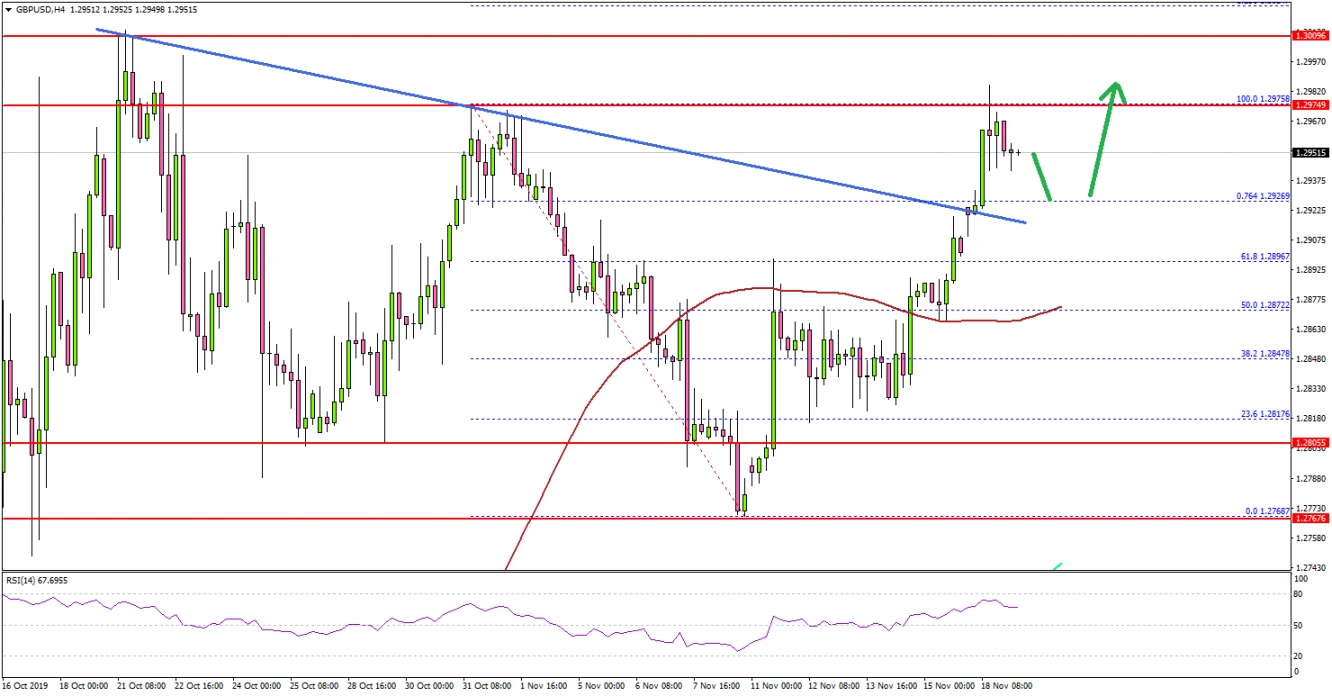
· There was a break above a major bearish trend line at 1.2920 on the 4-hours chart.
GBP/USD Technical Analysis
Looking at the 4-hours chart, the pair gained bullish momentum after it surpassed the 1.2900 resistance and the 100 simple moving average (red, 4-hours). As a result, there was a break above a major bearish trend line at 1.2920.
The pair even broke the 76.4% Fib retracement level of the downward move from the 1.2975 high to 1.2768 low. On the upside, there are many important resistances near the 1.3000 and 1.3020 levels.
Besides, the 1.236 Fib extension level of the downward move from the 1.2975 high to 1.2768 low might act as a resistance near 1.3024. If there is a successful break above 1.3000 and 1.3024, GBP/USD could rally further towards the 1.3050 and 1.3080 levels.
On the downside, the recent breakout resistance near the 1.2920-1.2930 area is likely to provide support if there is a short term correction. The main support on the downside is now near 1.2880 and the 100 simple moving average (red, 4-hours).

