Recent US$ weakness has enabled Gold to stabilise somewhat after three years+ of decline. Whilst still in an overall downtrend Gold is trying to carve out a base off the 61.8% fib retracement level of the 2008-2011 swing high move. Any further US$ weakness will help to keep Gold supported and may offer new trading opportunities. A look at possible support and resistance levels might help with locating possibly new trade entry positions.
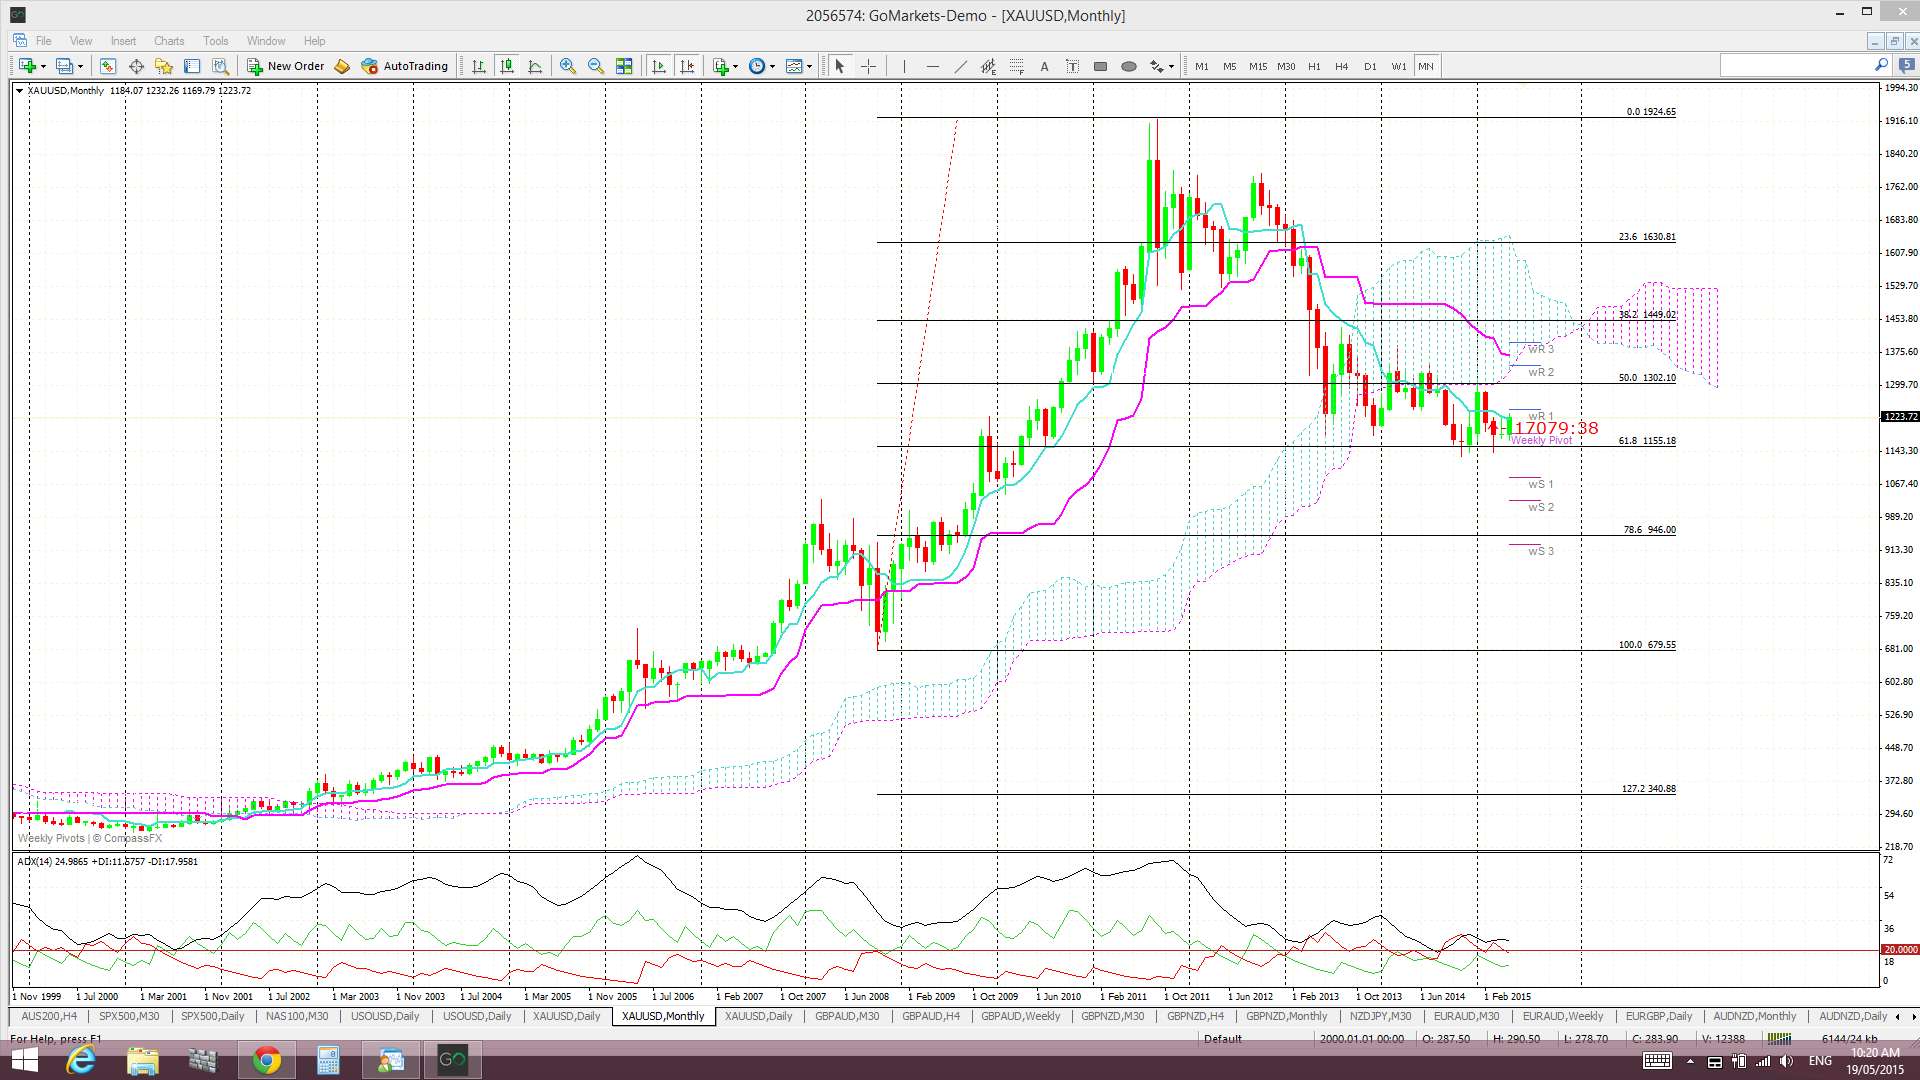
Gold monthly: the last major swing high move went from 2008 through to 2011. Price has been in decline since peaking near $1,920 in 2011 but has found support from the 61.8% fib of that swing high move. The failure to close and hold below $1,145 has resulted in basing-style activity and this has traders looking for any recovery bounce higher. This monthly chart shows how the $1,250 level is a decent S/R level that will have to be negotiated:

Gold monthly Cloud: Gold is below the monthly Cloud:
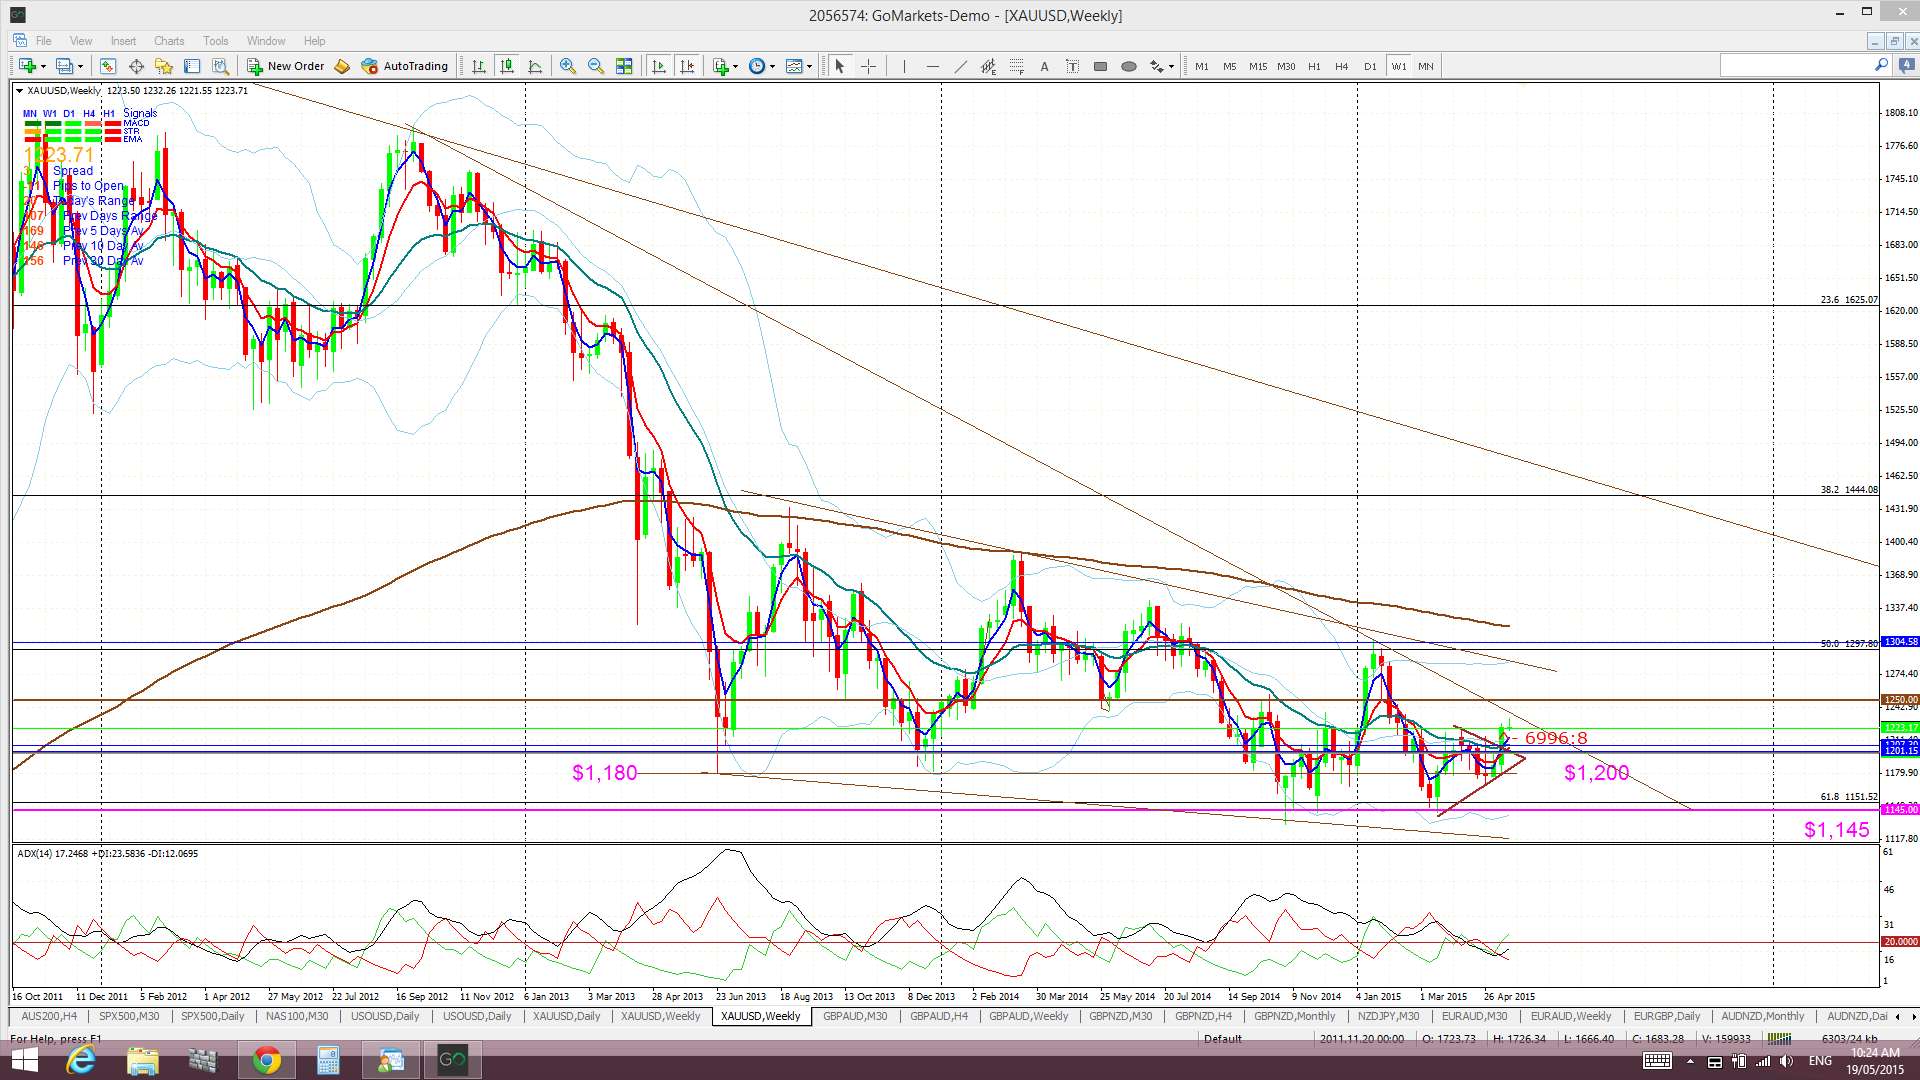
Gold weekly: the weekly chart shows a two-year+ bear trend line in force above current price that will have to be negotiated as well. The $1,250 level is above that and, then, further up is a more recent trading channel trend line. The monthly chart’s triangle trend line is beyond that still so there are multiple levels where price action may pause and react and allow for new trade entry IF bullish momentum continues.
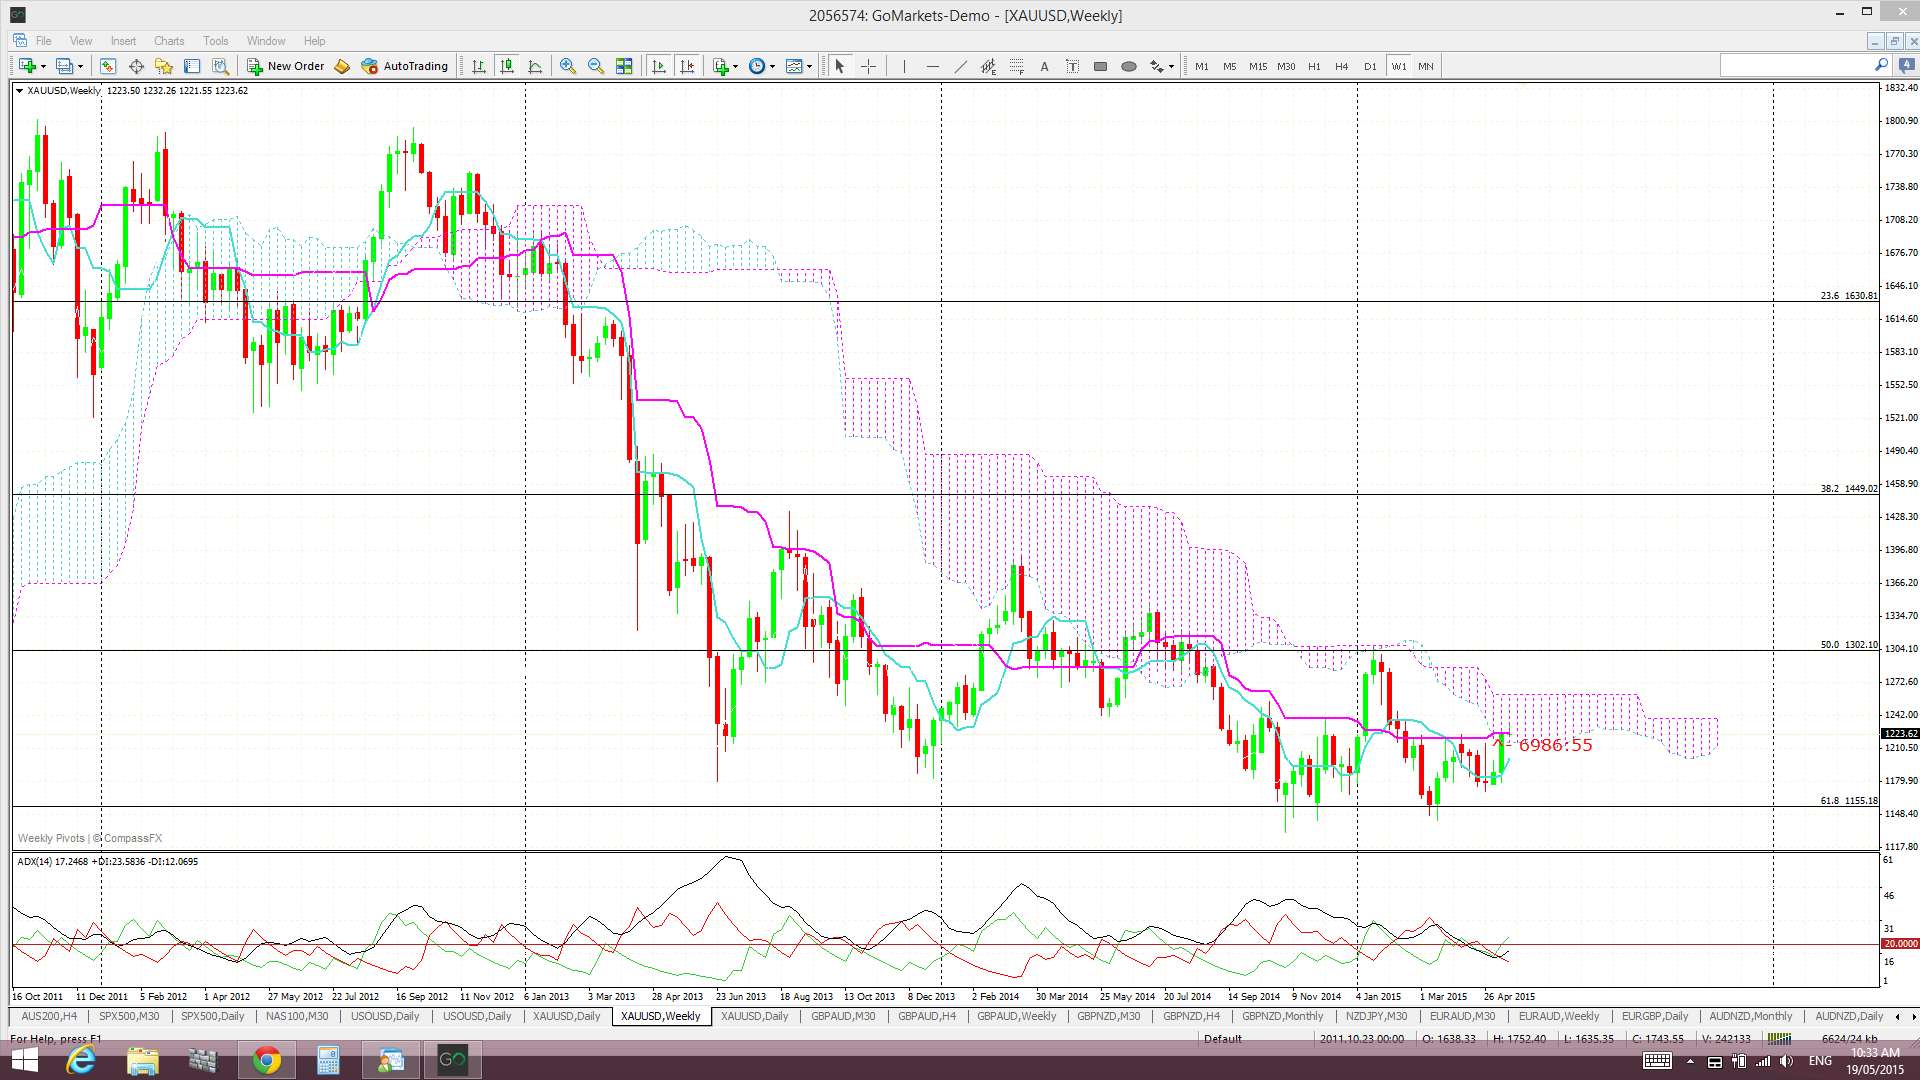
Gold weekly Cloud: Gold is trying to break up through the weekly Cloud and success here would be quite bullish:
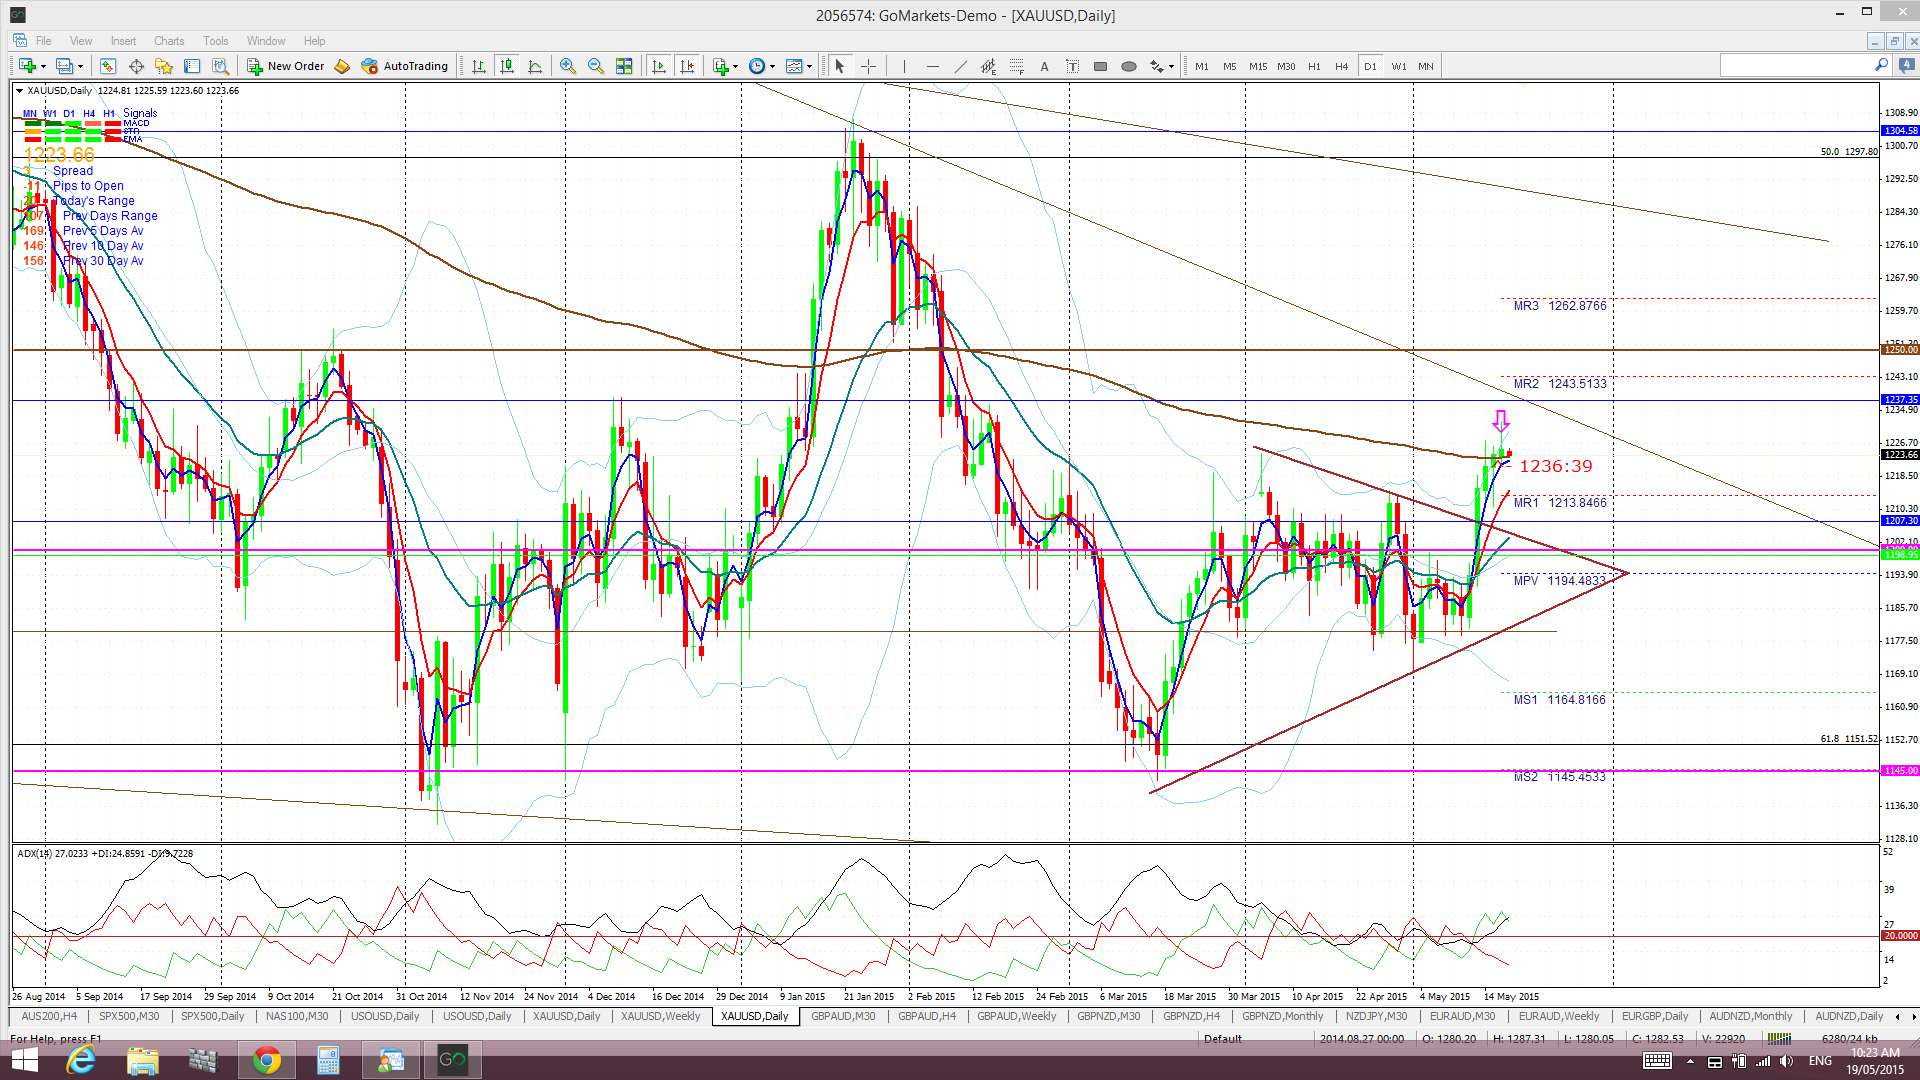
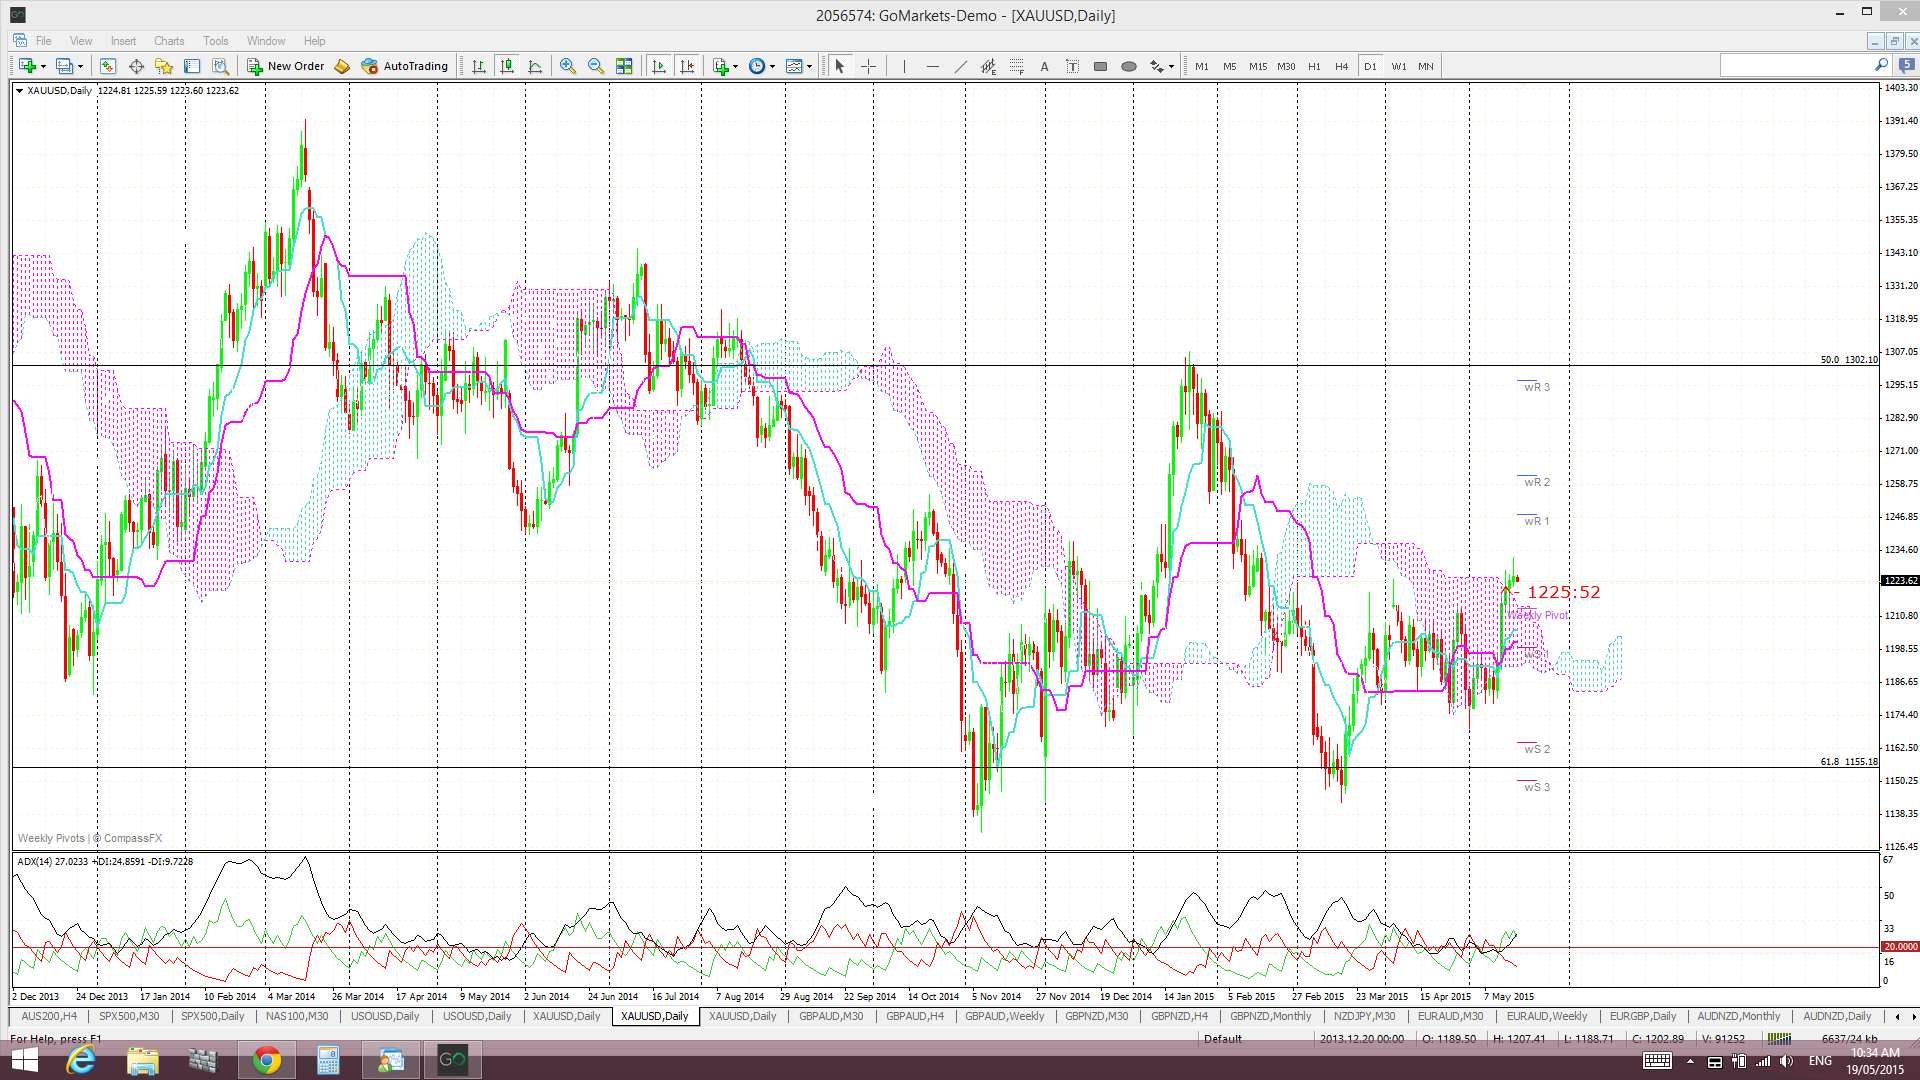
Gold daily: Gold has made a new daily close above the daily 200 EMA which is bullish. I have received a new TC LONG signal off my daily chart today BUT I would still prefer to wait and see if the US$ resumes its decline first. Thus, a break and hold of the two year trend line, just above current price, might be a safer entry opportunity for the more conservative trader. Alternatively, any pullback to test the $1,200 level, and a hold of this support, would be encouraging for LONG trades too:
Gold daily Cloud: Gold is now back above the daily Cloud which is bullish:
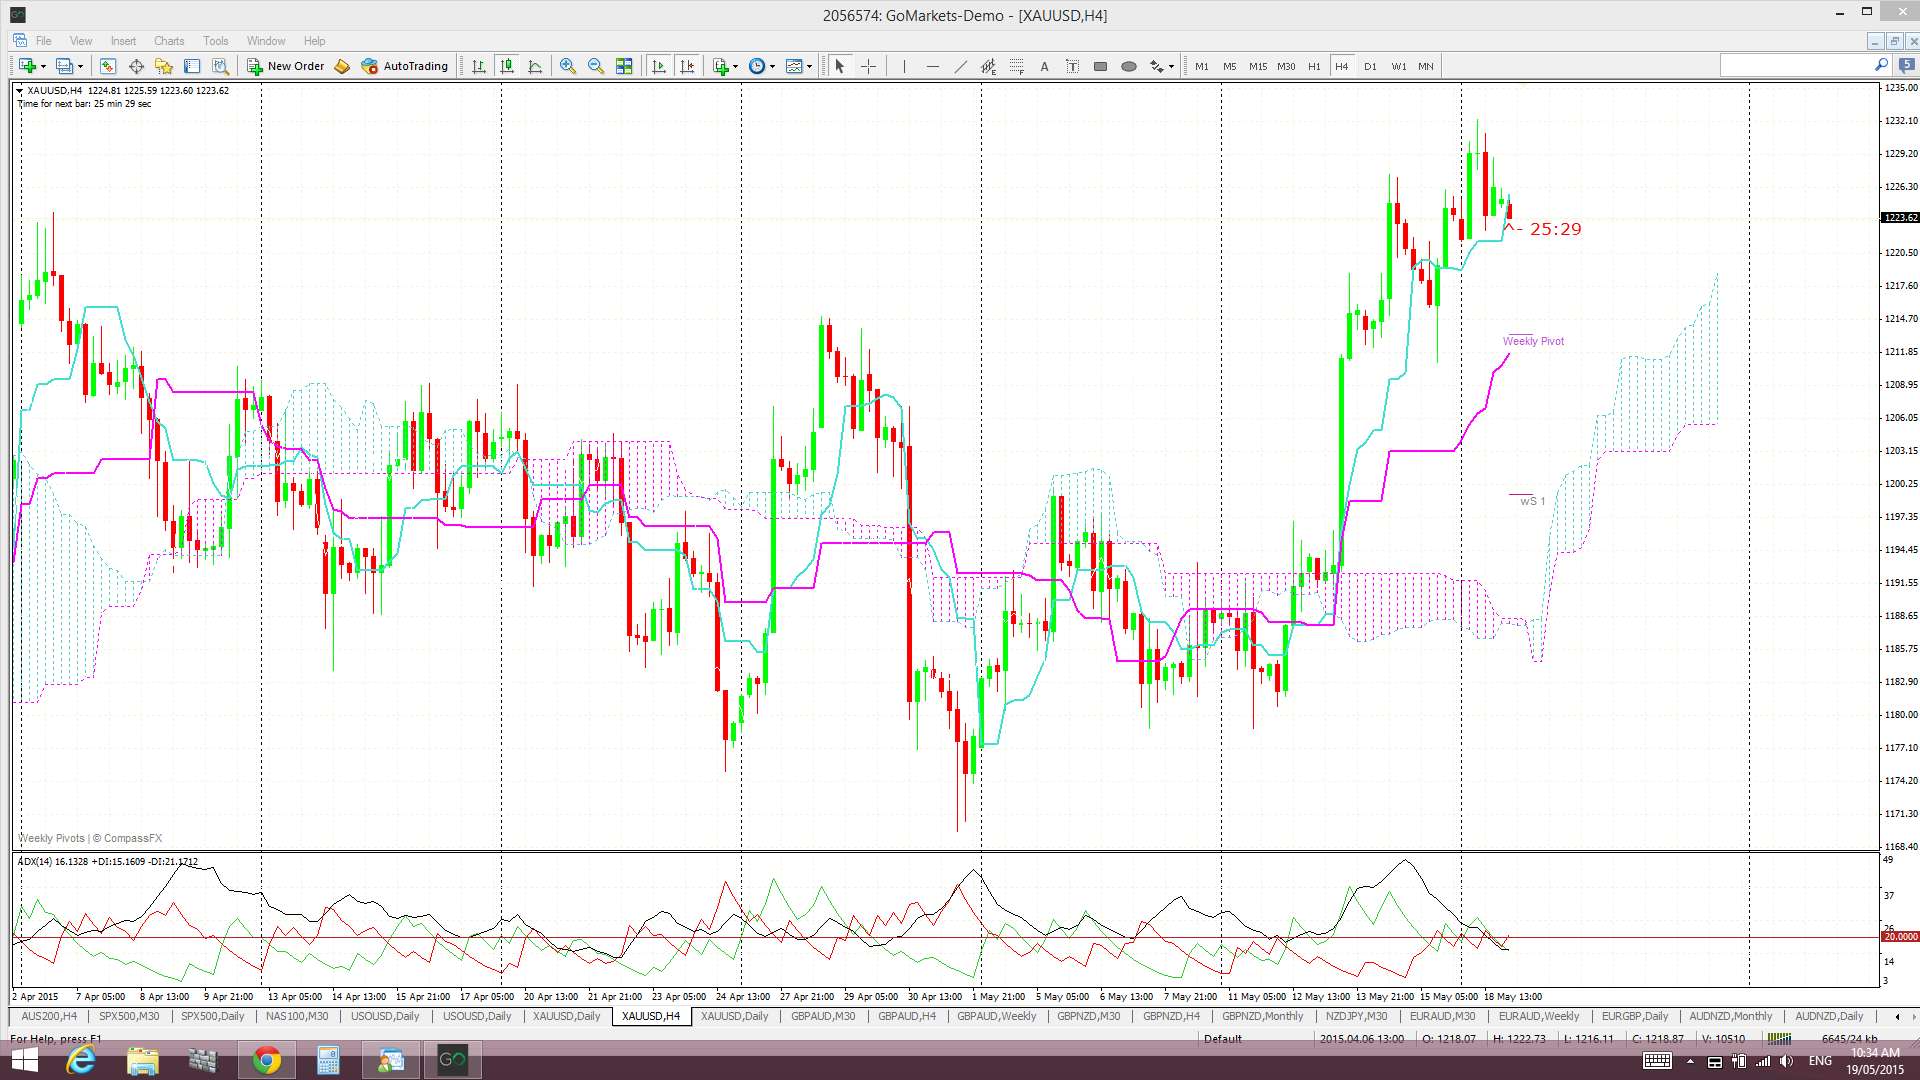
Gold 4hr: Gold continues after last week’s bullish triangle breakout:
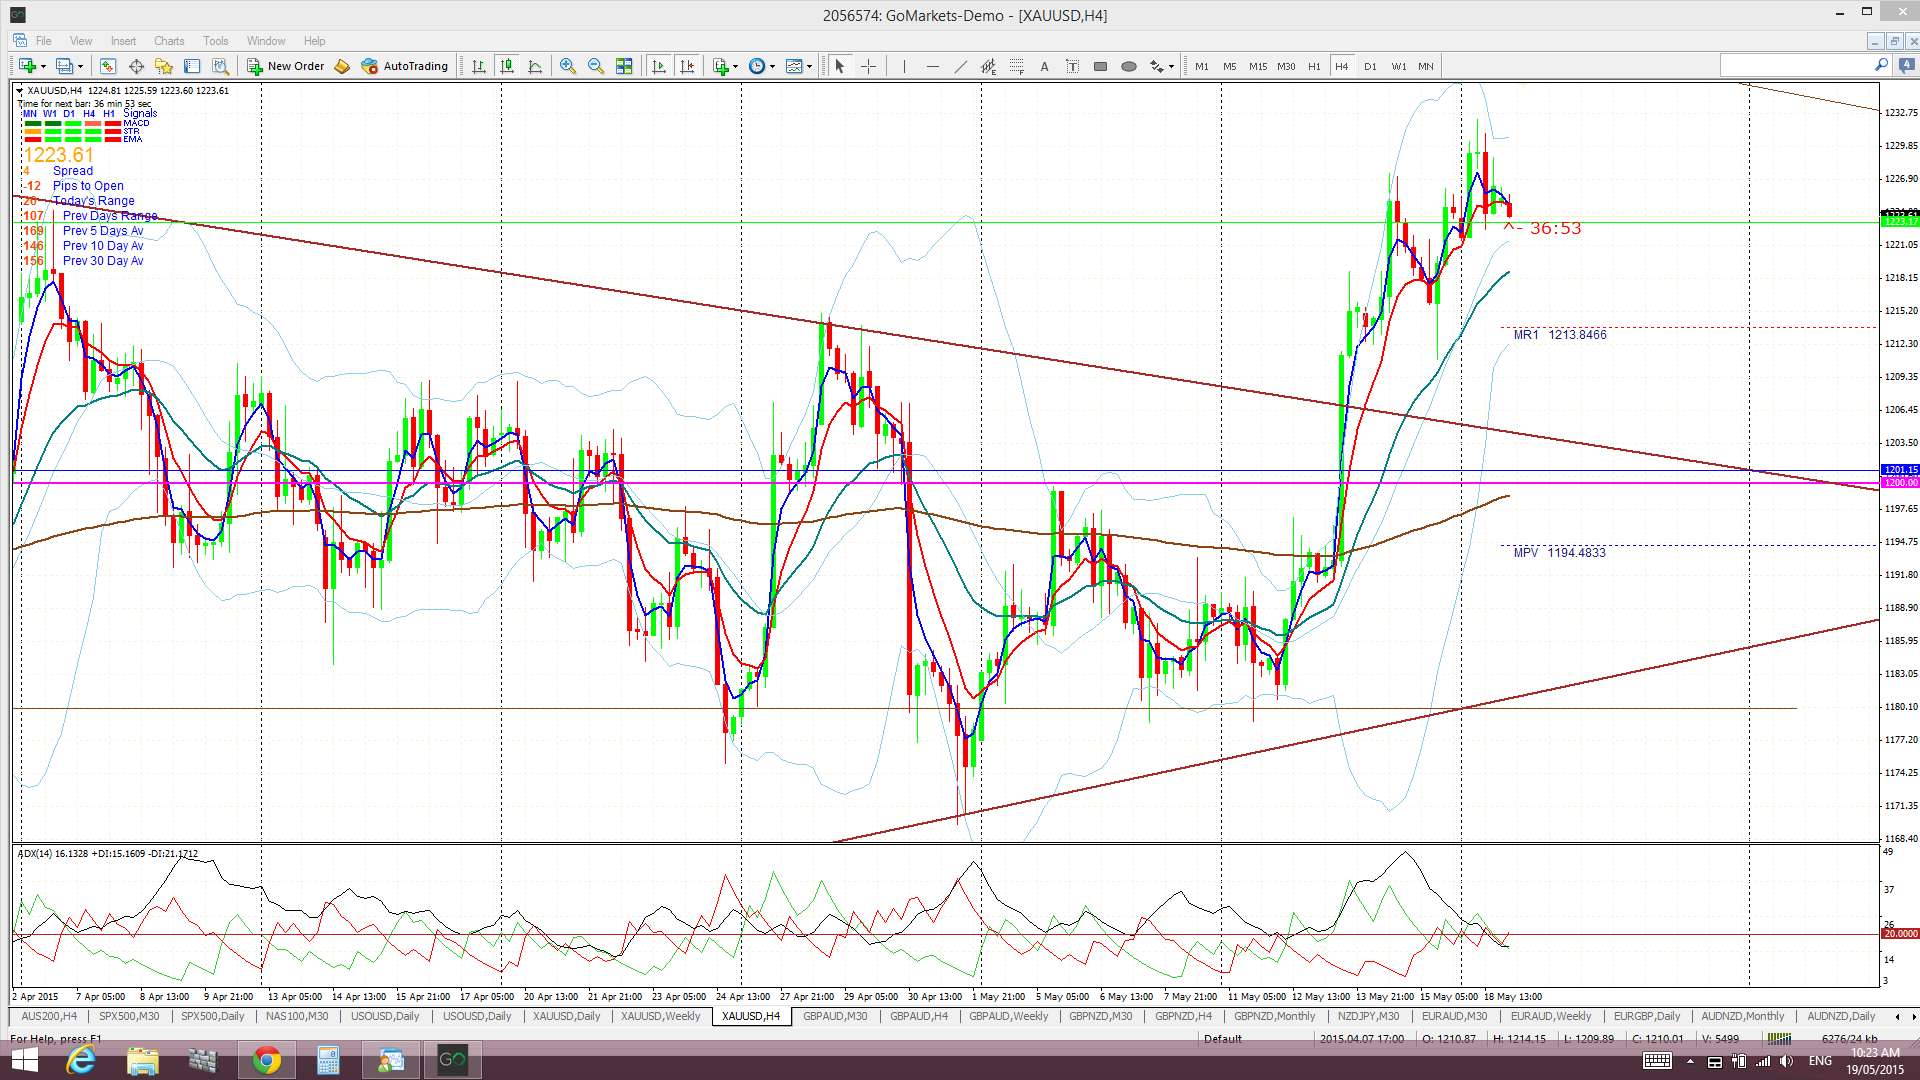
Gold 4hr Cloud: Gold is above the 4hr Cloud which is bullish:
Summary: Gold looks to be forming a base off 61.8% fib support from the 2008-2011 swing high move. Recent US$ weakness has helped to boost Gold and any continued US$ weakness could result in further gains for the precious metal. S/R levels above and below current price may allow for some hesitance price action to enable new trade entry. These levels, apart from the obvious psychological whole number levels, include:
- a test and hold of the $1,200 level (below current price).
- a weekly-chart 2 year+ bear trend line (above current price)
- the $1,250 level (above current price).
- a recent trading channel trend line (above current price).
- a monthly chart triangle trend line (above current price).
The post Gold: levels to watch appeared first on www.forextell.com.