Gold is holding above a broken 6-year bear trend line and has continued higher to break up through the $1,300 level. I wrote an article about this bear trend line breakout a few weeks ago. Silver has now broken above its 6-year bear trend line so watch for any follow-through with this metal. The monthly and weekly chart’s of both metal show plenty of room for some healthy mean reversion activity.
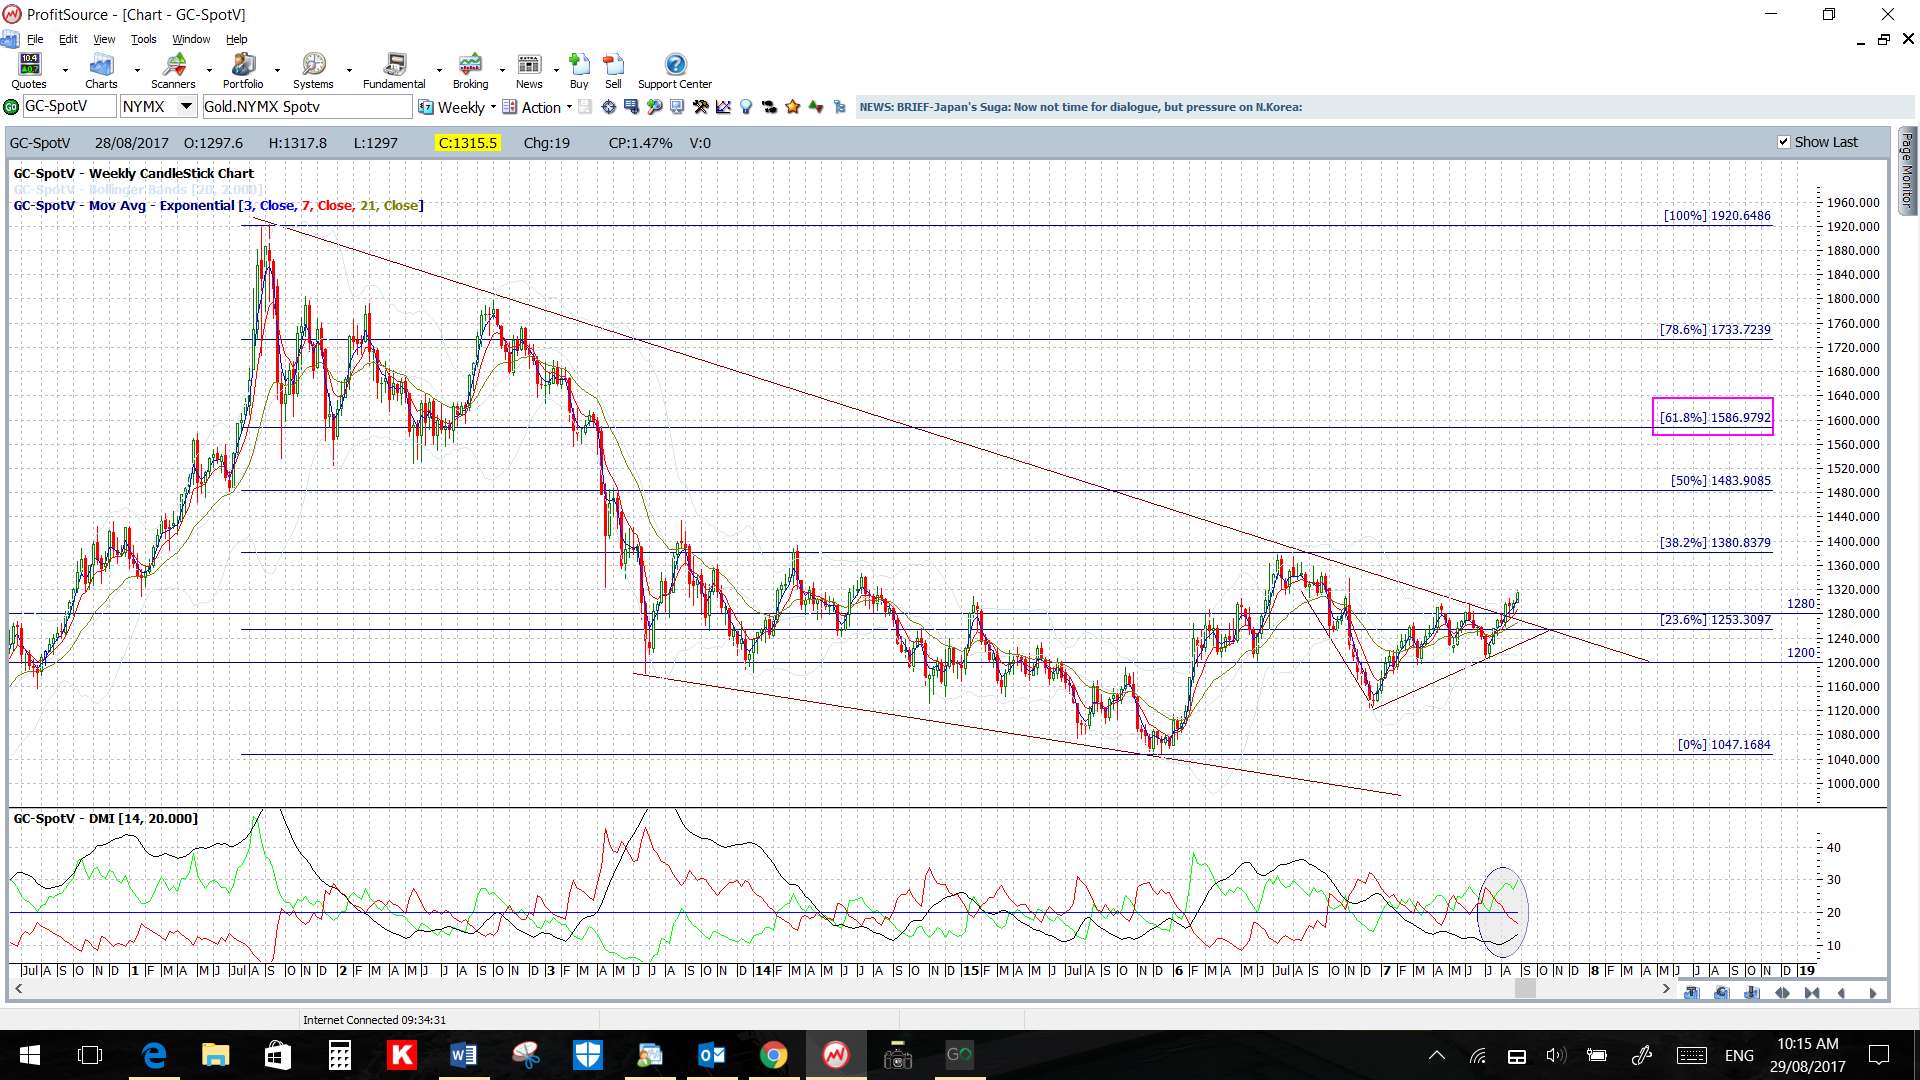
Gold: Gold broke over a 6-year bear trend line a few weeks ago and has now broken above $1,300 resistance. I’m looking for any continuation move to target the weekly chart’s 61.8% fib which is up near $1,600:
Gold weekly: there is room for some mean-reversion here:
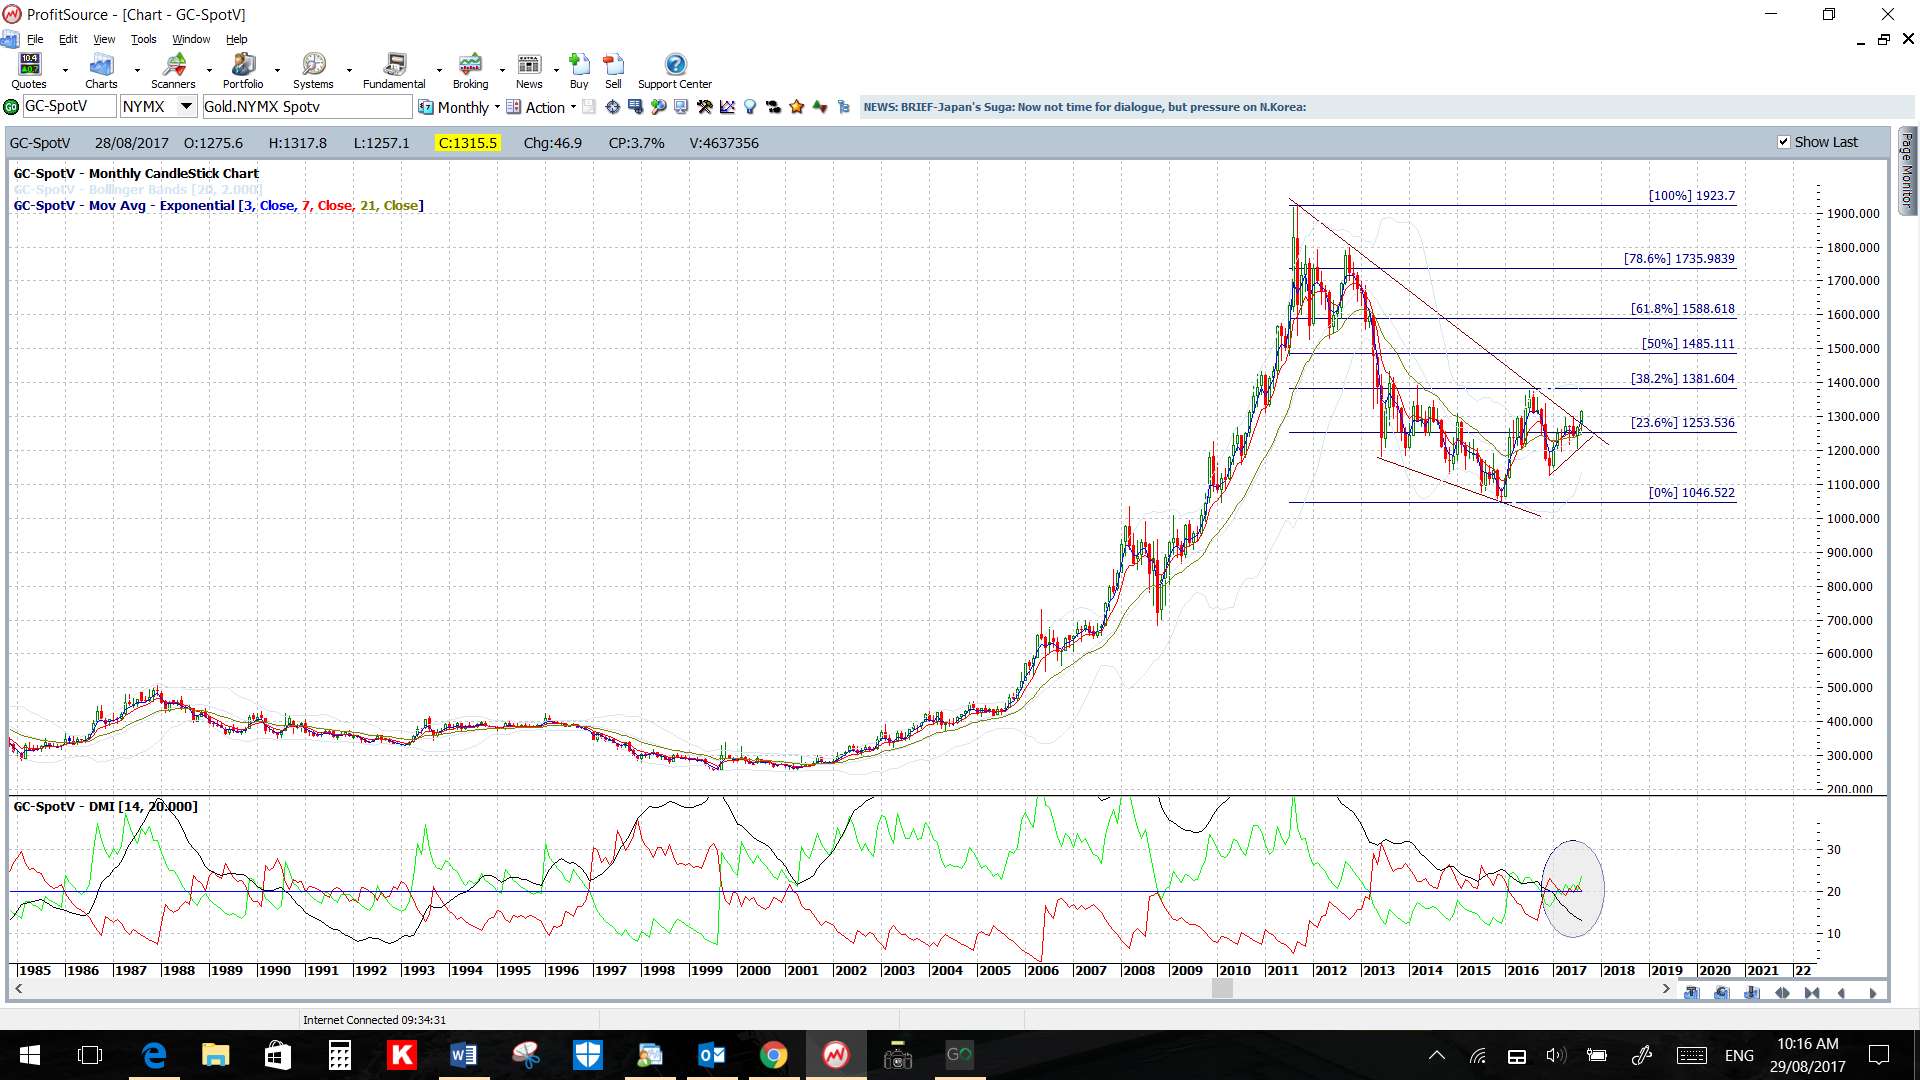
Gold monthly: this Bull Flag is really taking shape now!
GLD weekly: the Gold bullion ETF has mirrored the metal with its trend line breakout:

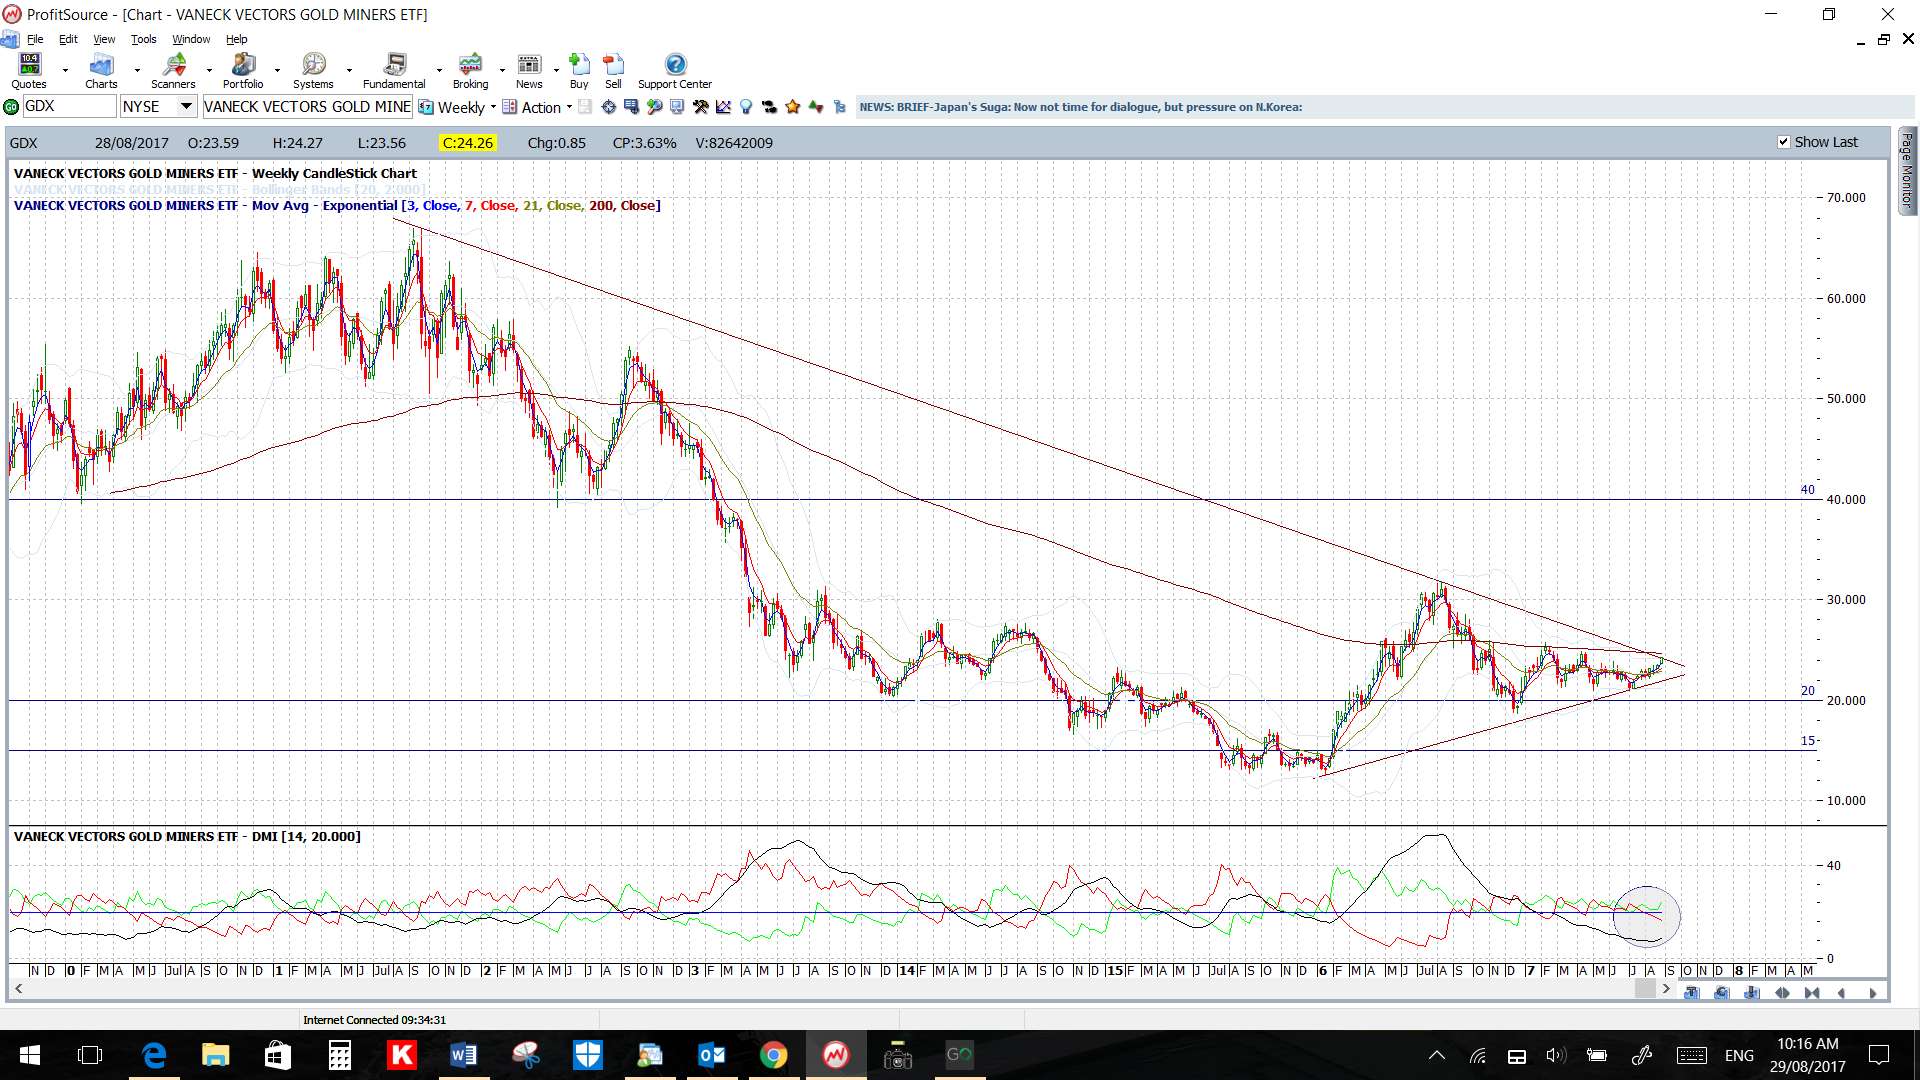
GDX weekly: watch for any breakout on the Gold Miners ETF:
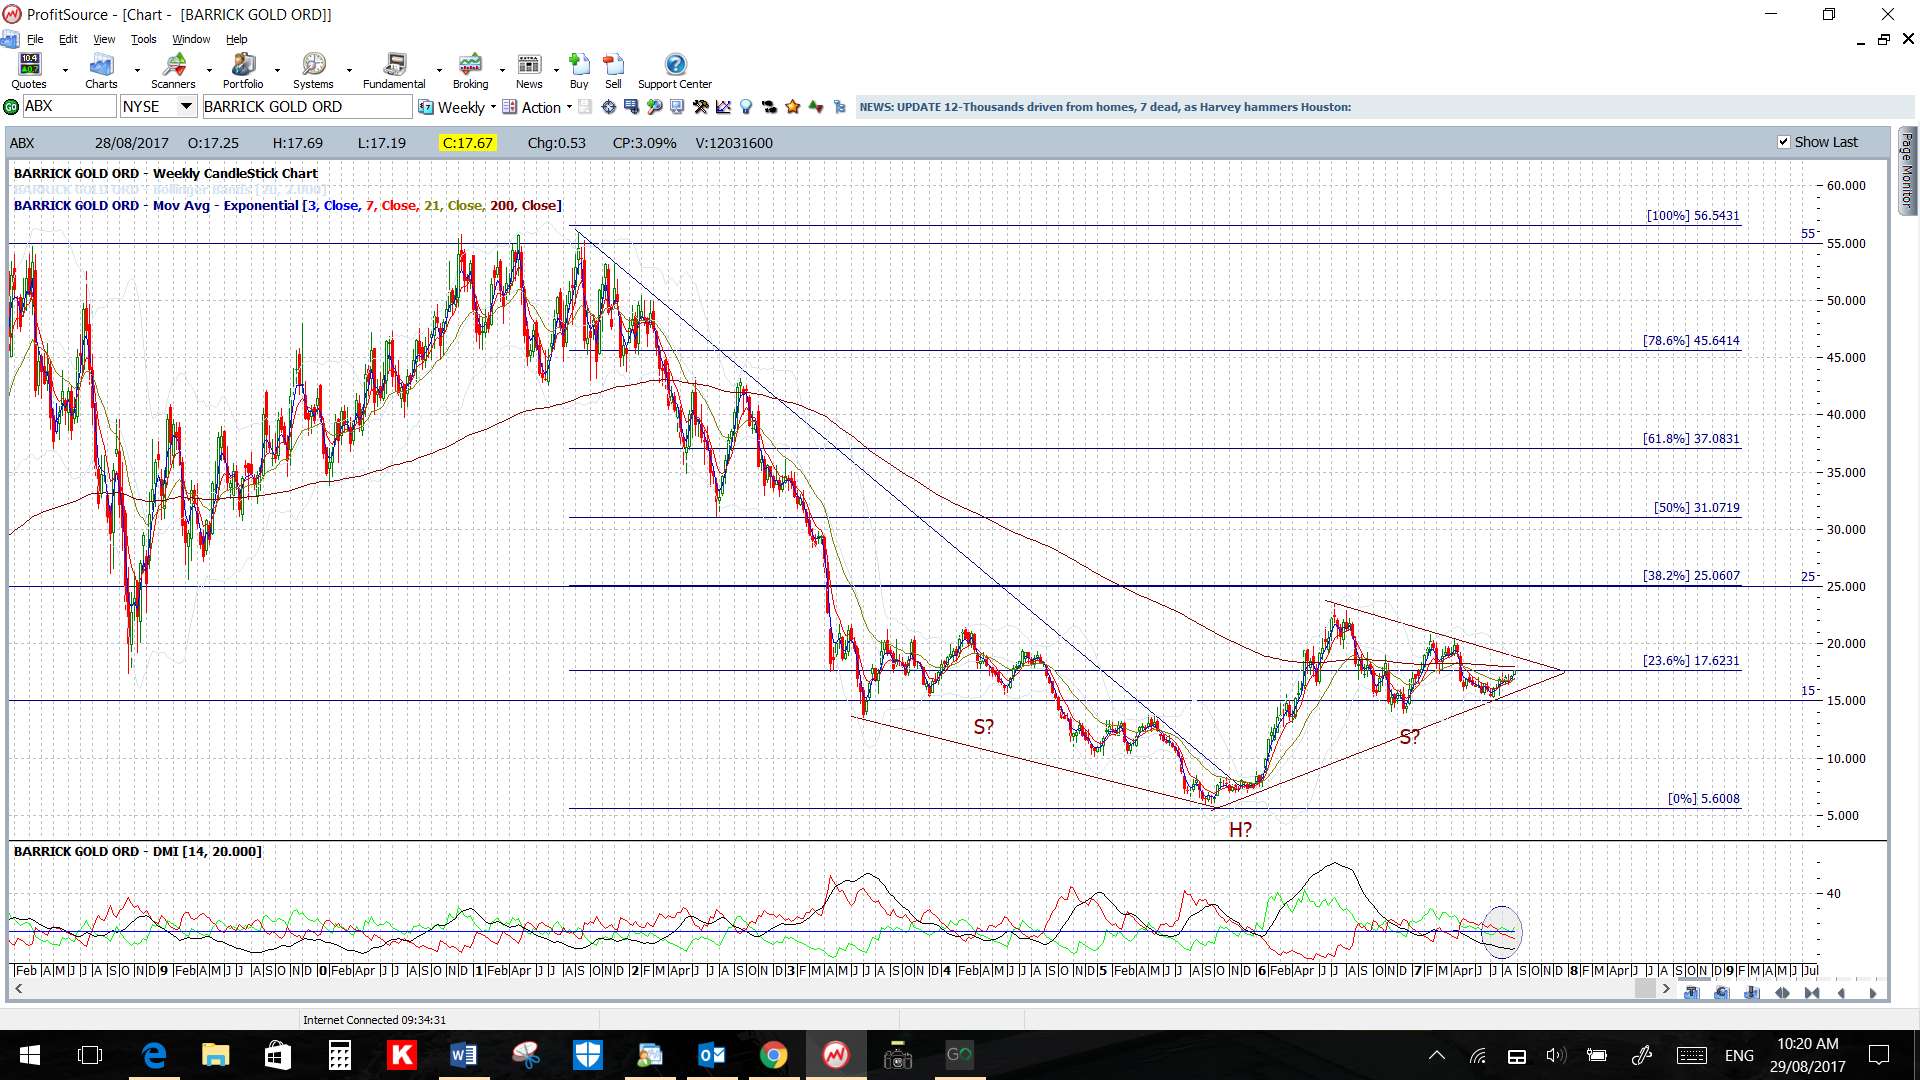
ABX weekly: watch for any trend line breakout on Barrick Gold too:

GG weekly: ditto here with Goldcorp:

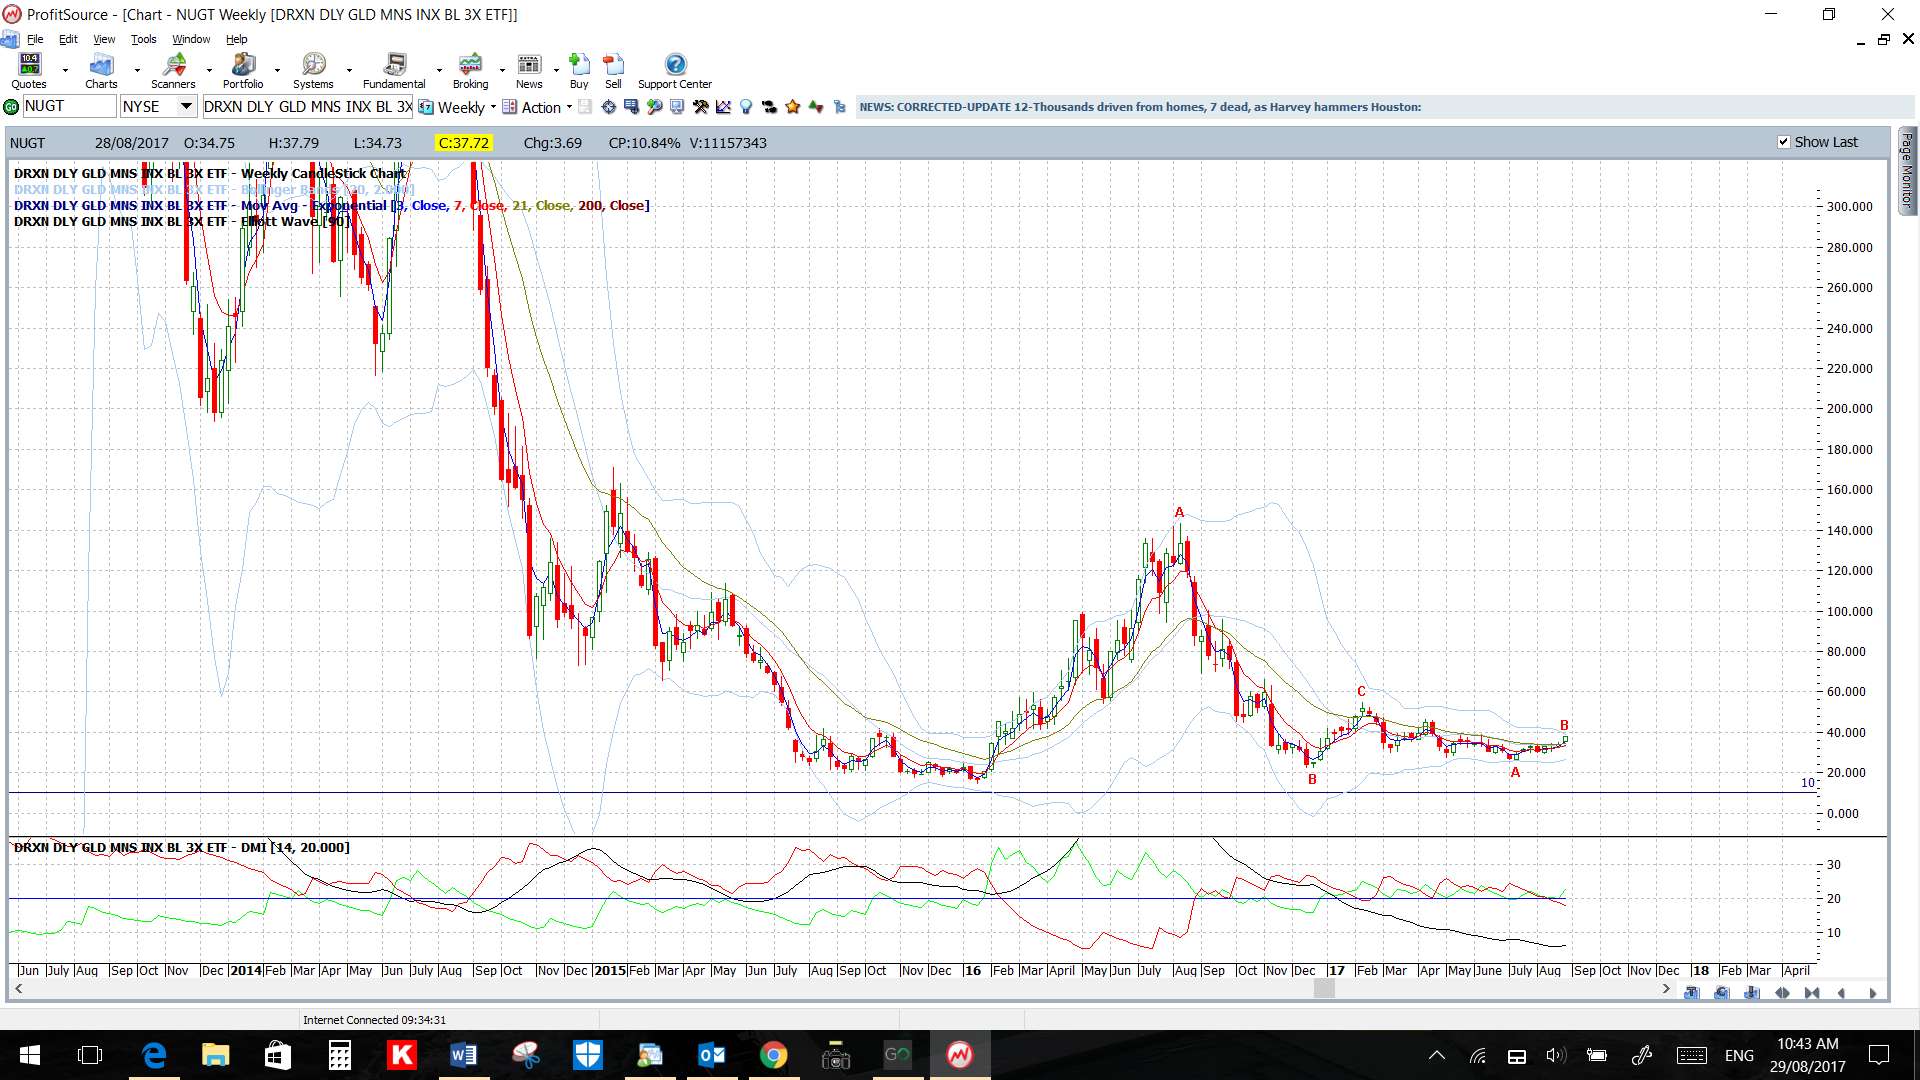
NUGT: the triple leveraged ETF looks like its trying to form up a base:
NUGT monthly: lots of room for mean reversion here!

NUGT weekly: trying to base here?
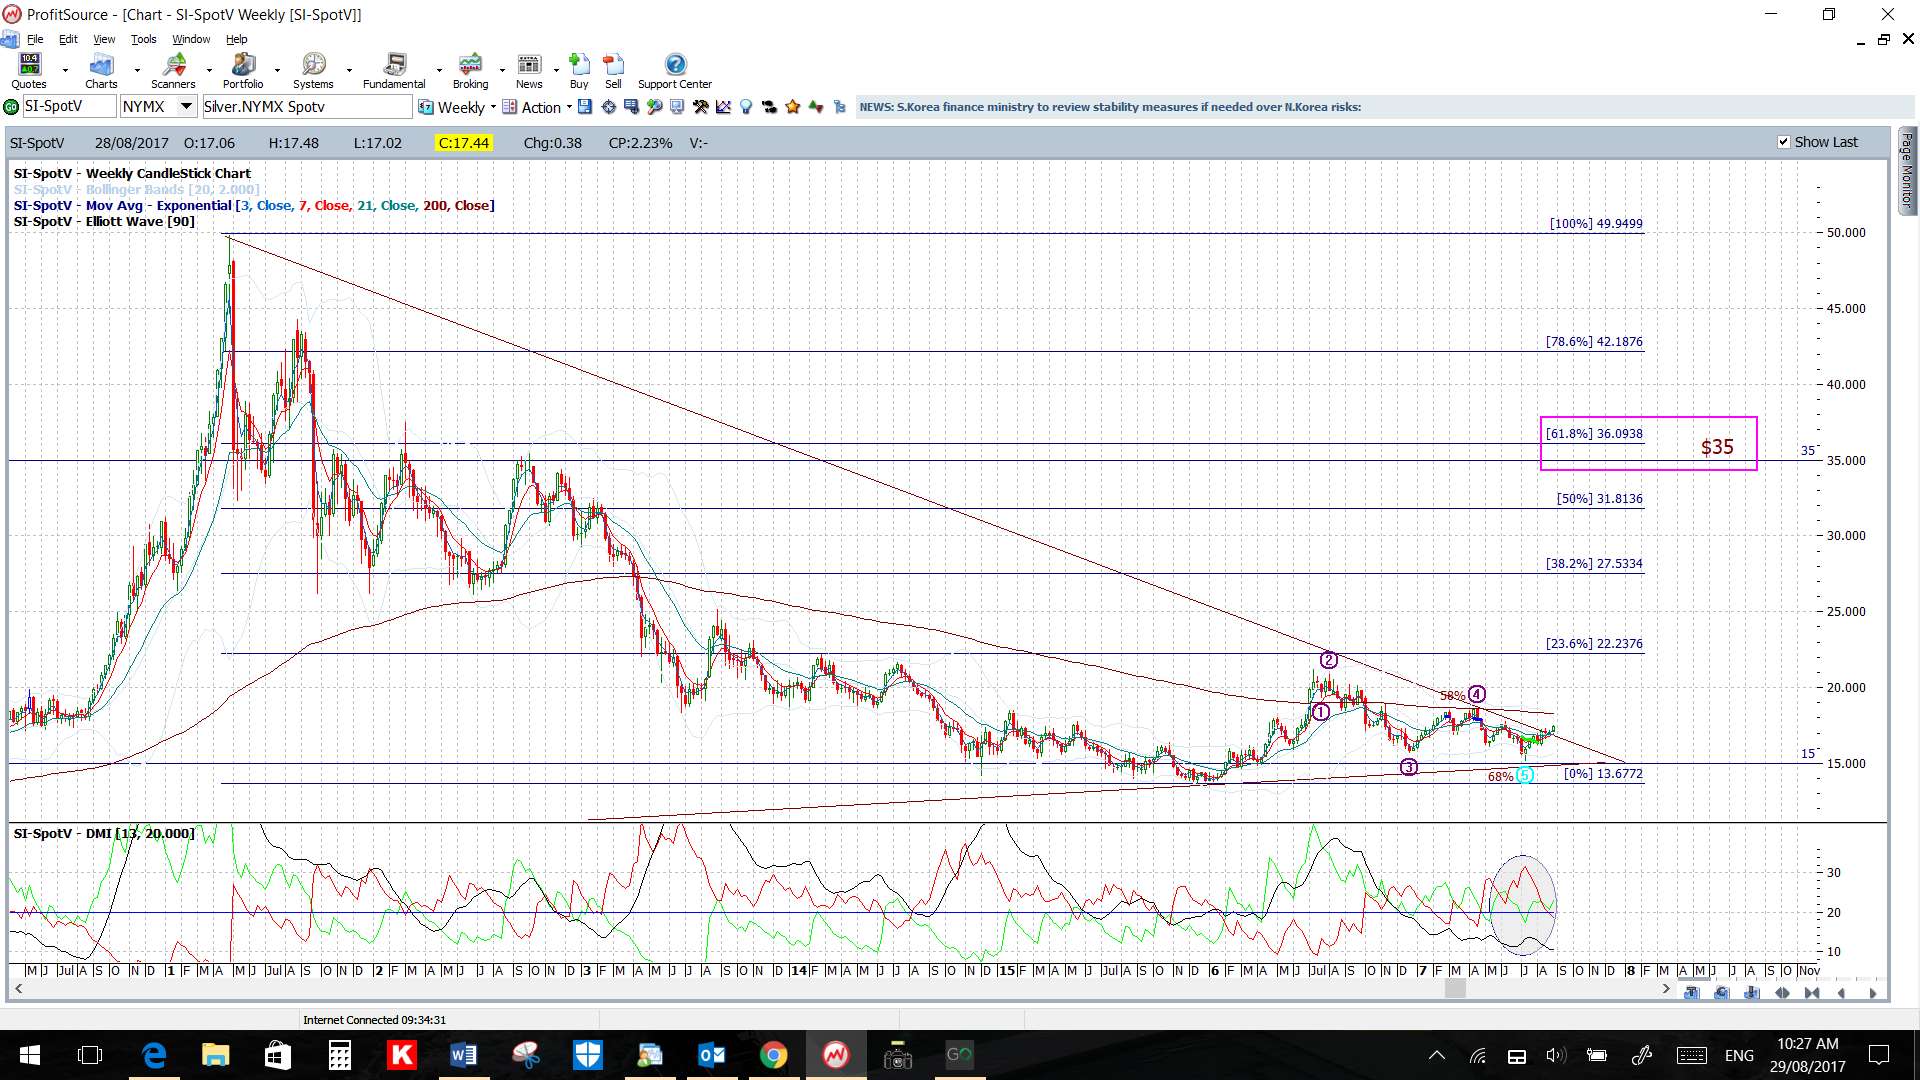
Silver: Silver broke over a 6-year bear trend line in the last trading session so watch for any follow-through. I’m looking for any continuation move to target the monthly / weekly chart’s 61.8% fib which is up near $35:
Silver weekly: room for mean-reversion here too:
Silver monthly:

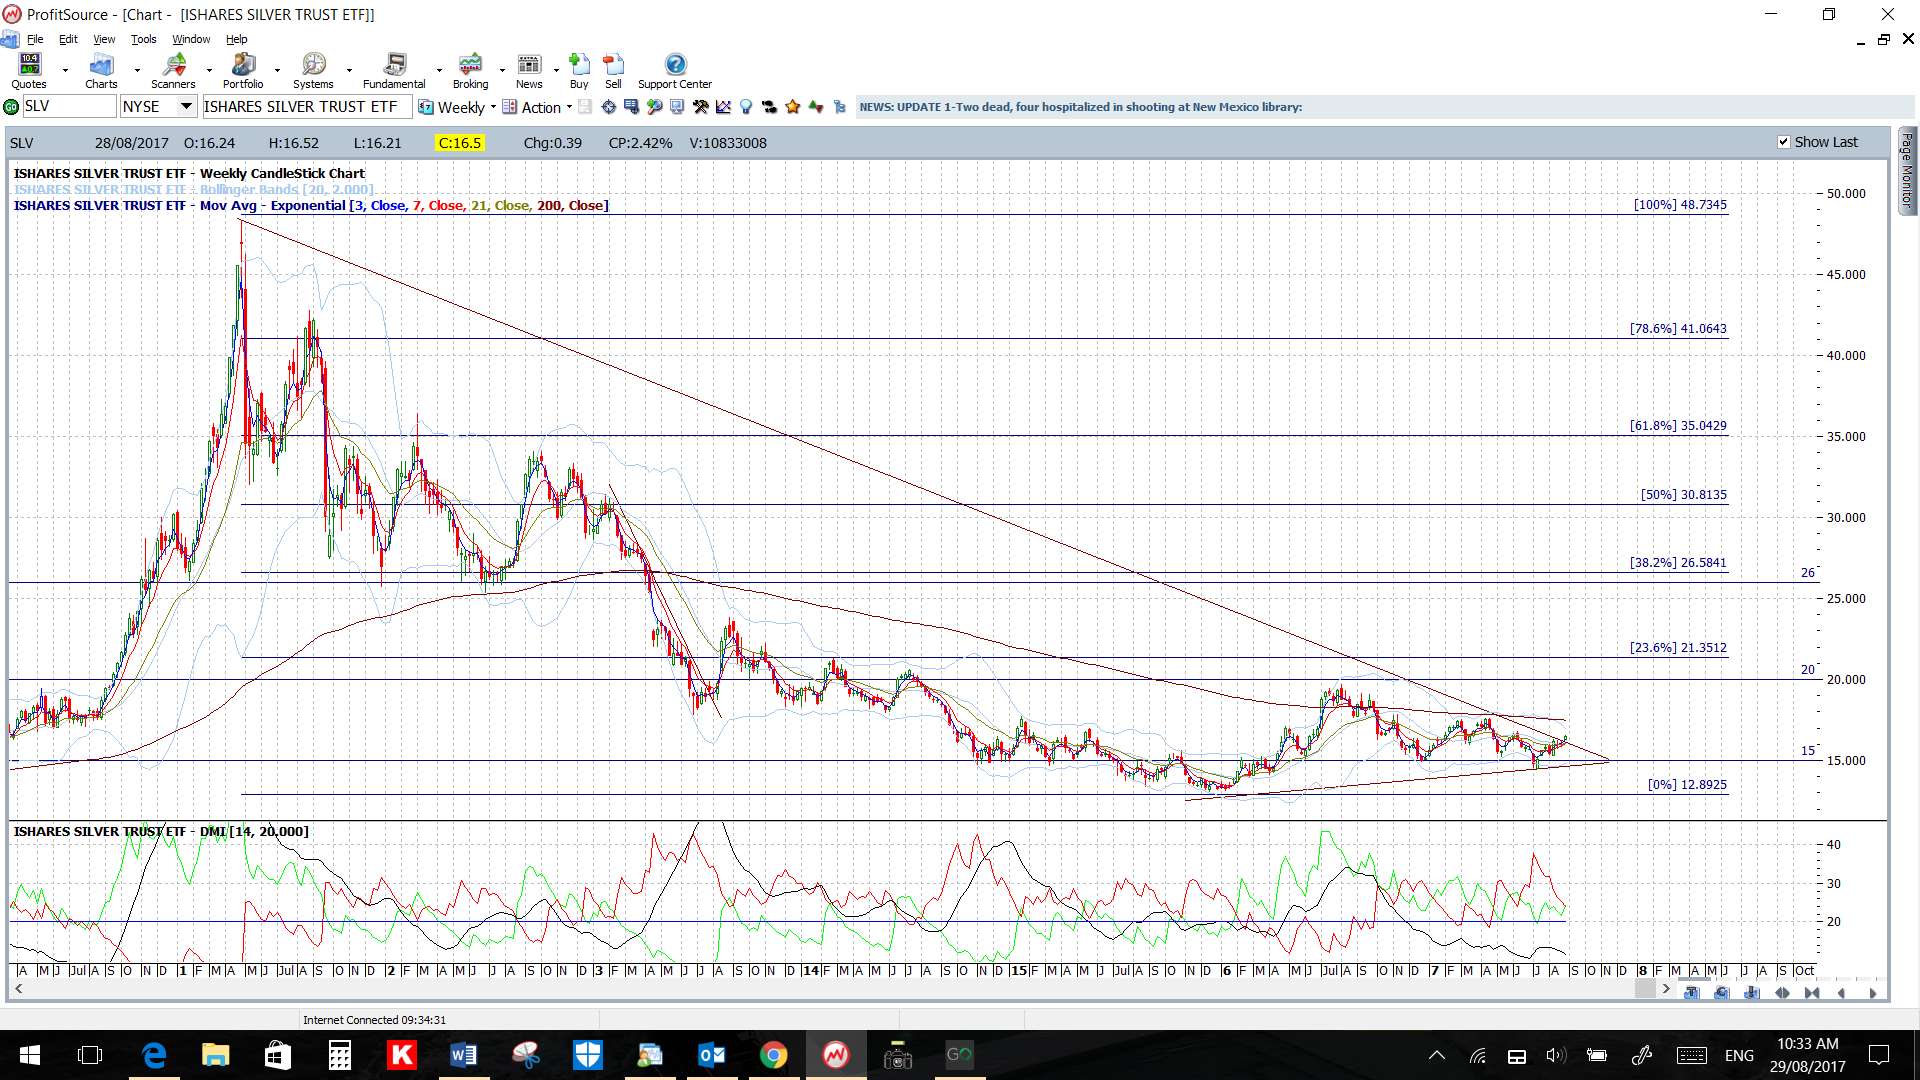
SLV weekly: a breakout starting on the Silver bullion ETF?
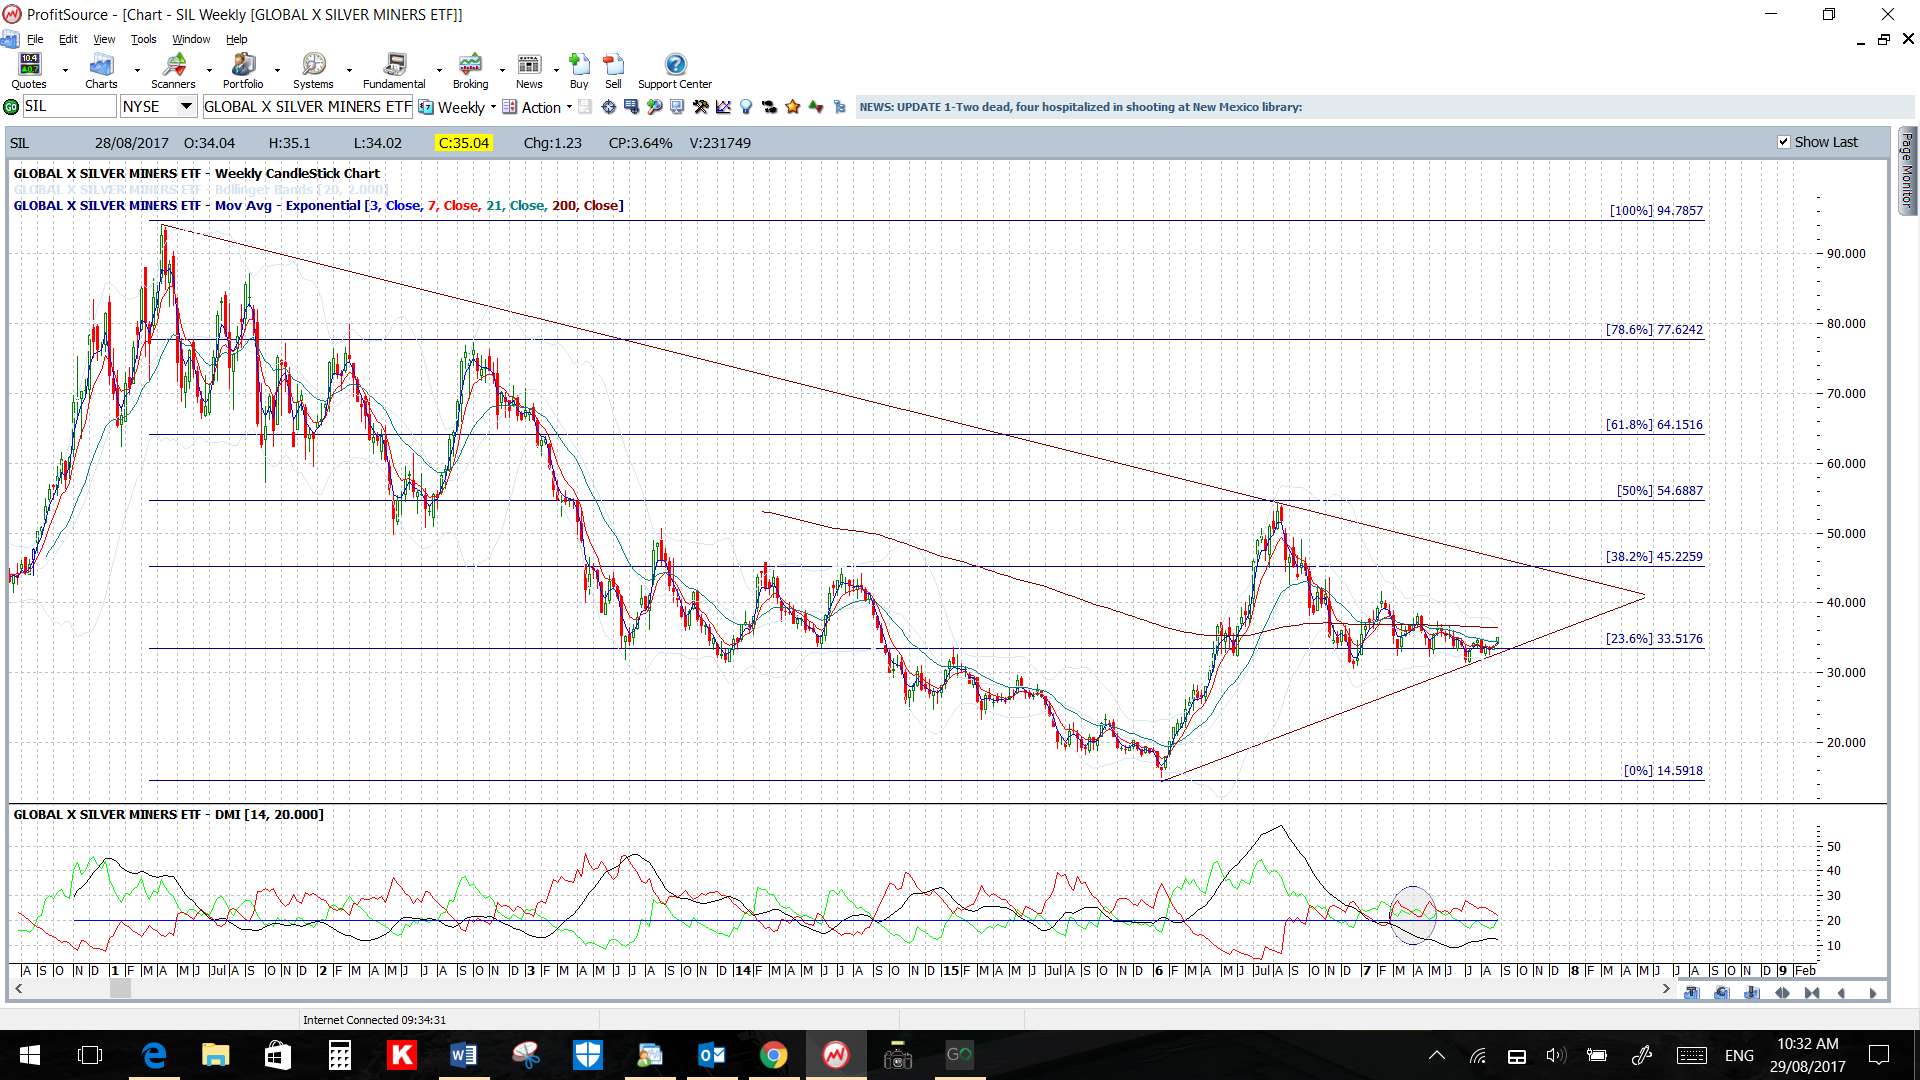
SIL weekly: a way to go for the Silver miners ETF though:
SLW weekly: Silver Wheaton is testing a triangle trend line as well:

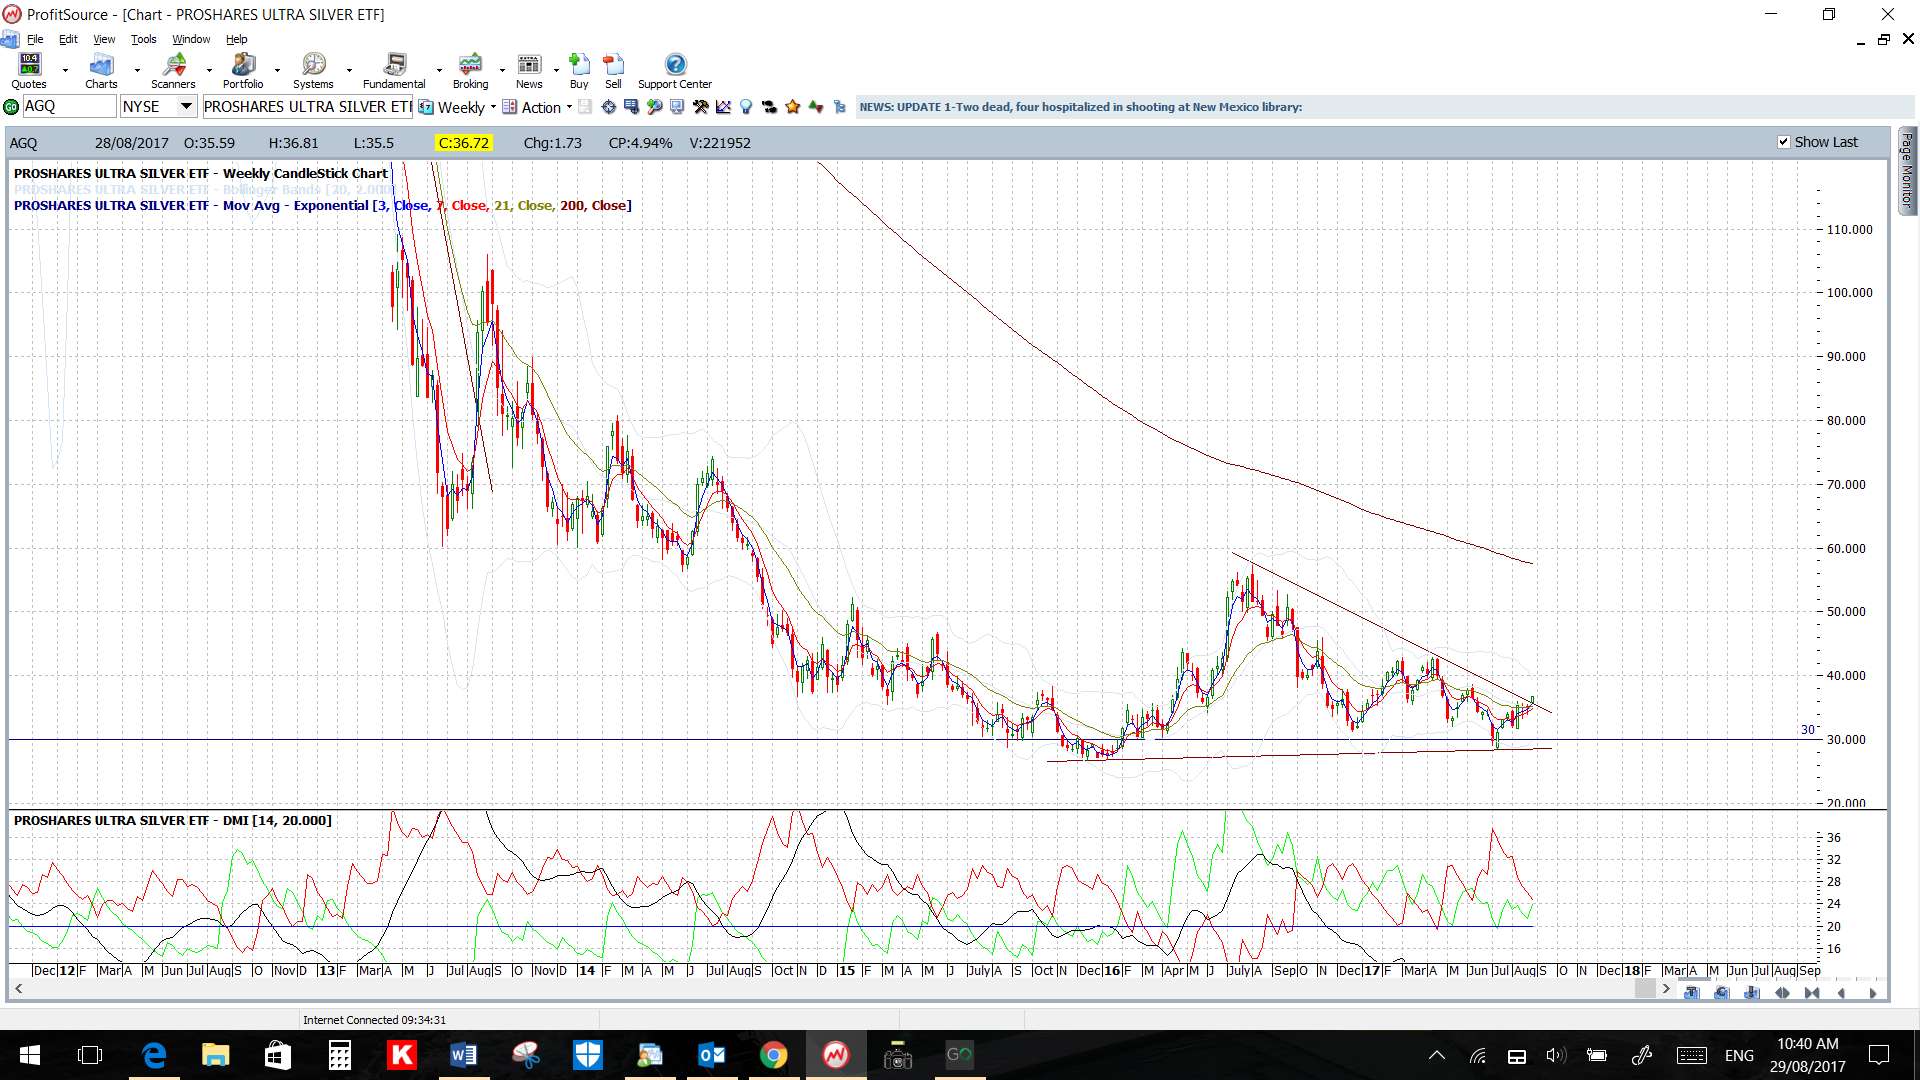
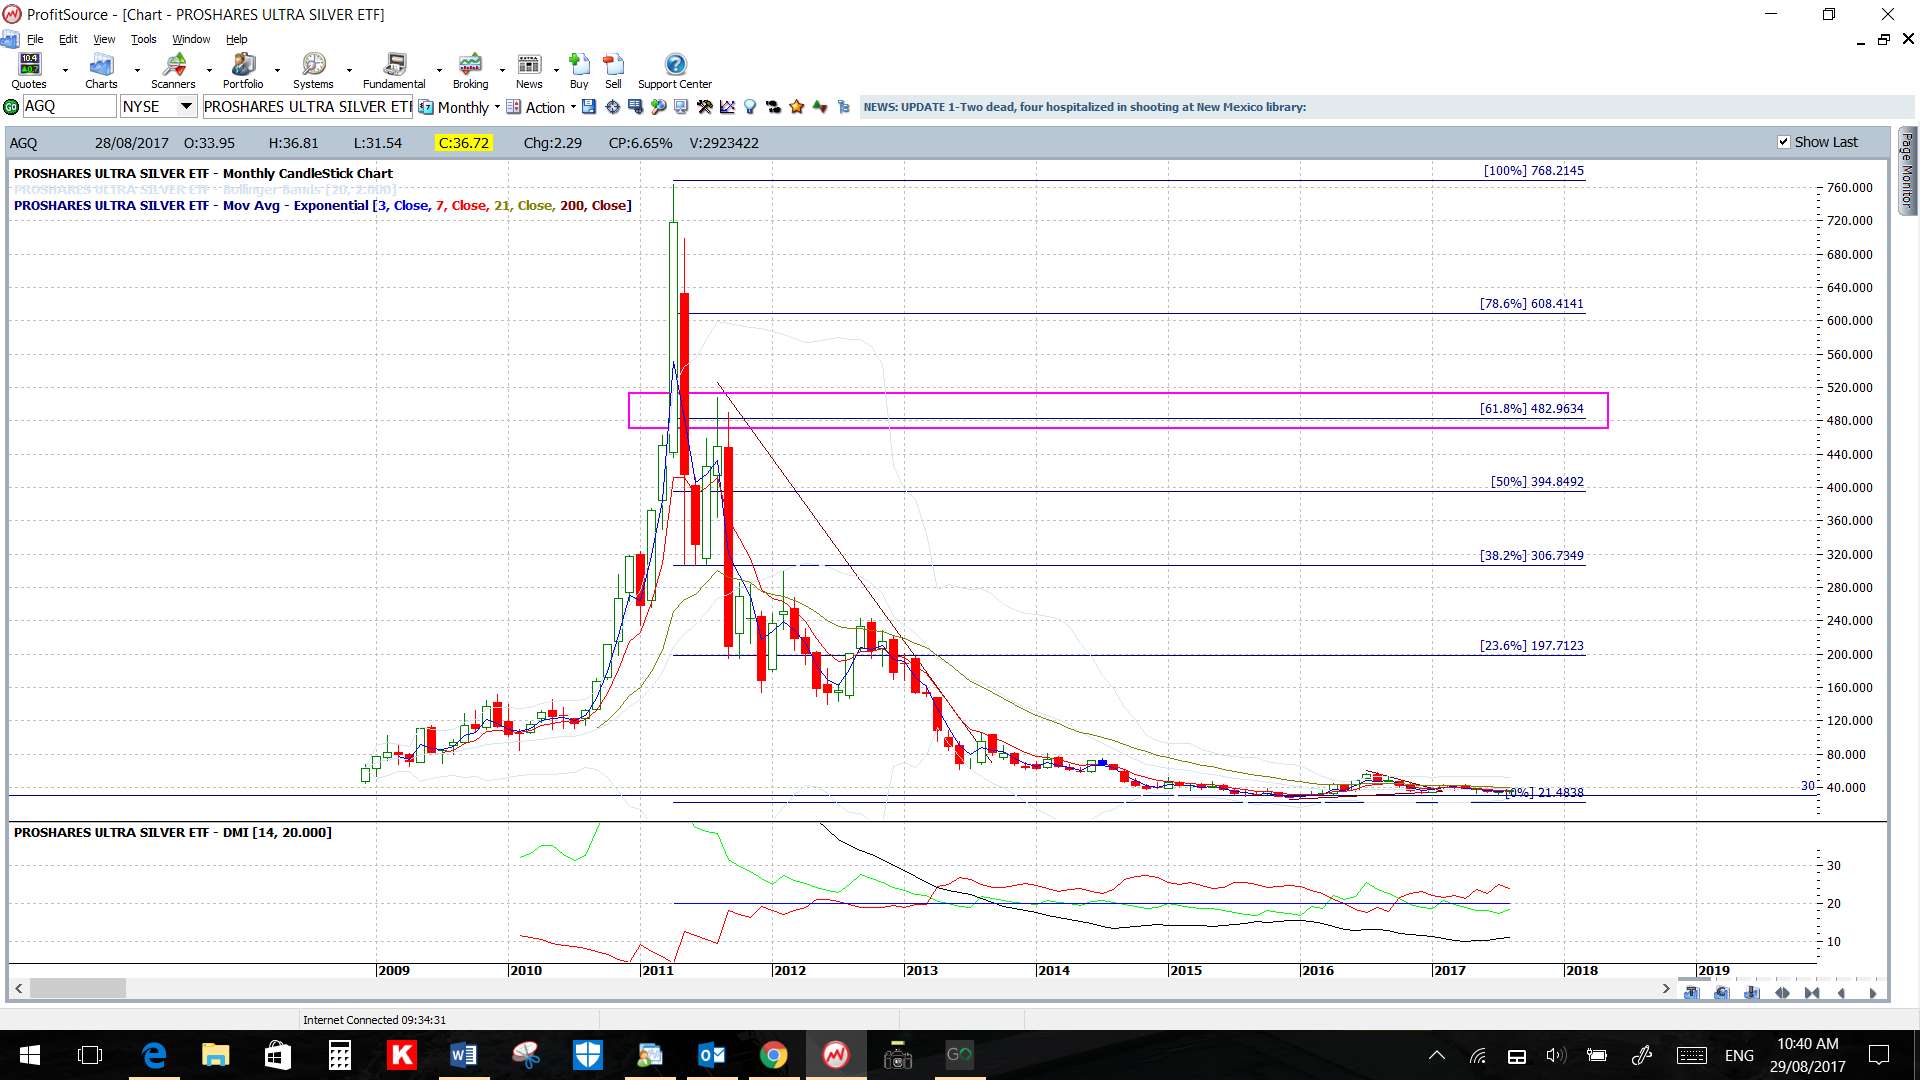
AGQ: this double leveraged ETF looks interesting:
AGQ monthly: lots of room for mean reversion!
AGQ weekly: a triangle breakout here?