February has now closed off so I thought it prudent to assess the monthly candle close for some of the stock index majors. All of the indices in this post closed with bullish monthly candles and some indices are setting up within new, potential ascending triangle patterns. I say ‘new‘ as some of these indices have already experienced successful bullish breakouts from such patterns; a post reviewing these earlier breakouts can be viewed through this link. The new ascending triangles are much larger and, therefore, have rather ambitious targets so I will be watching with interest to see if these trigger as the indices creep up to previous all time Highs. Trends do not travel in straight lines though and so I also map pullback targets in the event of any significant correction move.
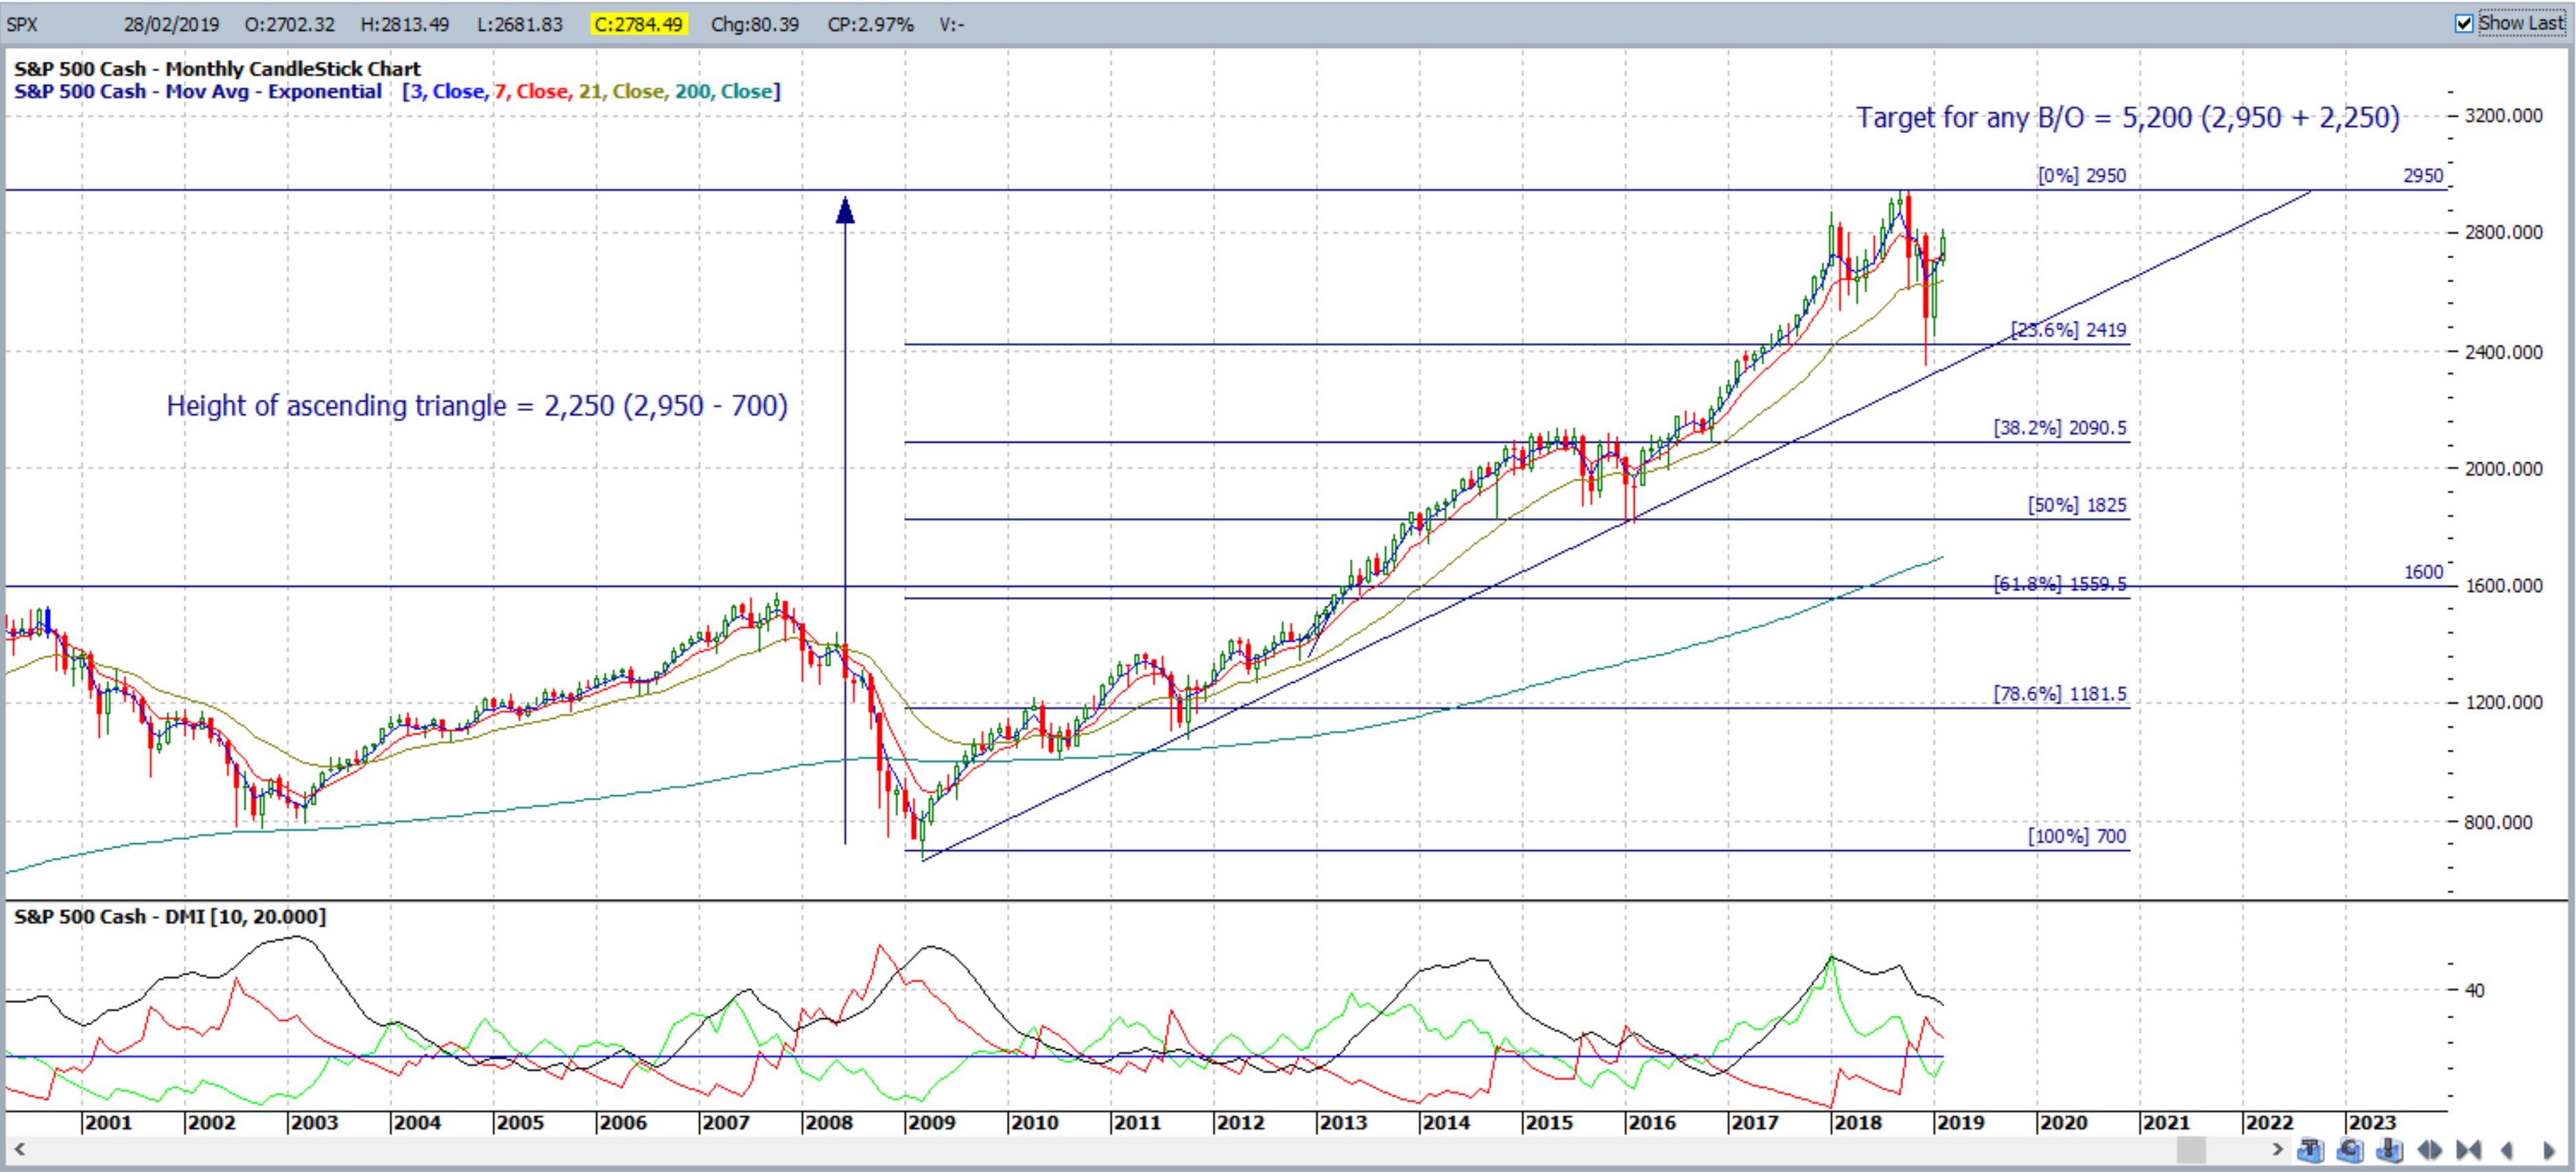
S&P500 monthly: The S&P500 closed with a small bullish monthly candle. Price action can be seen to be consolidating under a previous High, circa 2,950 on declining momentum. The previous multi-year ascending triangle breakout, from 2014, has completed but I am seeing a new ascending triangle forming and this is a large ascending triangle pattern with a height of 2,250. Thus, the target for any successful breakout above 2.950 would be 5,200 (2,950 + 2,250). This is, clearly, a long-term pattern as was the previous triangle.

Any breakdown of the ascending triangle support trend line would bring the monthly 61.8% Fibonacci level, near the previous ascending triangle breakout level of 1,600, into some greater focus.
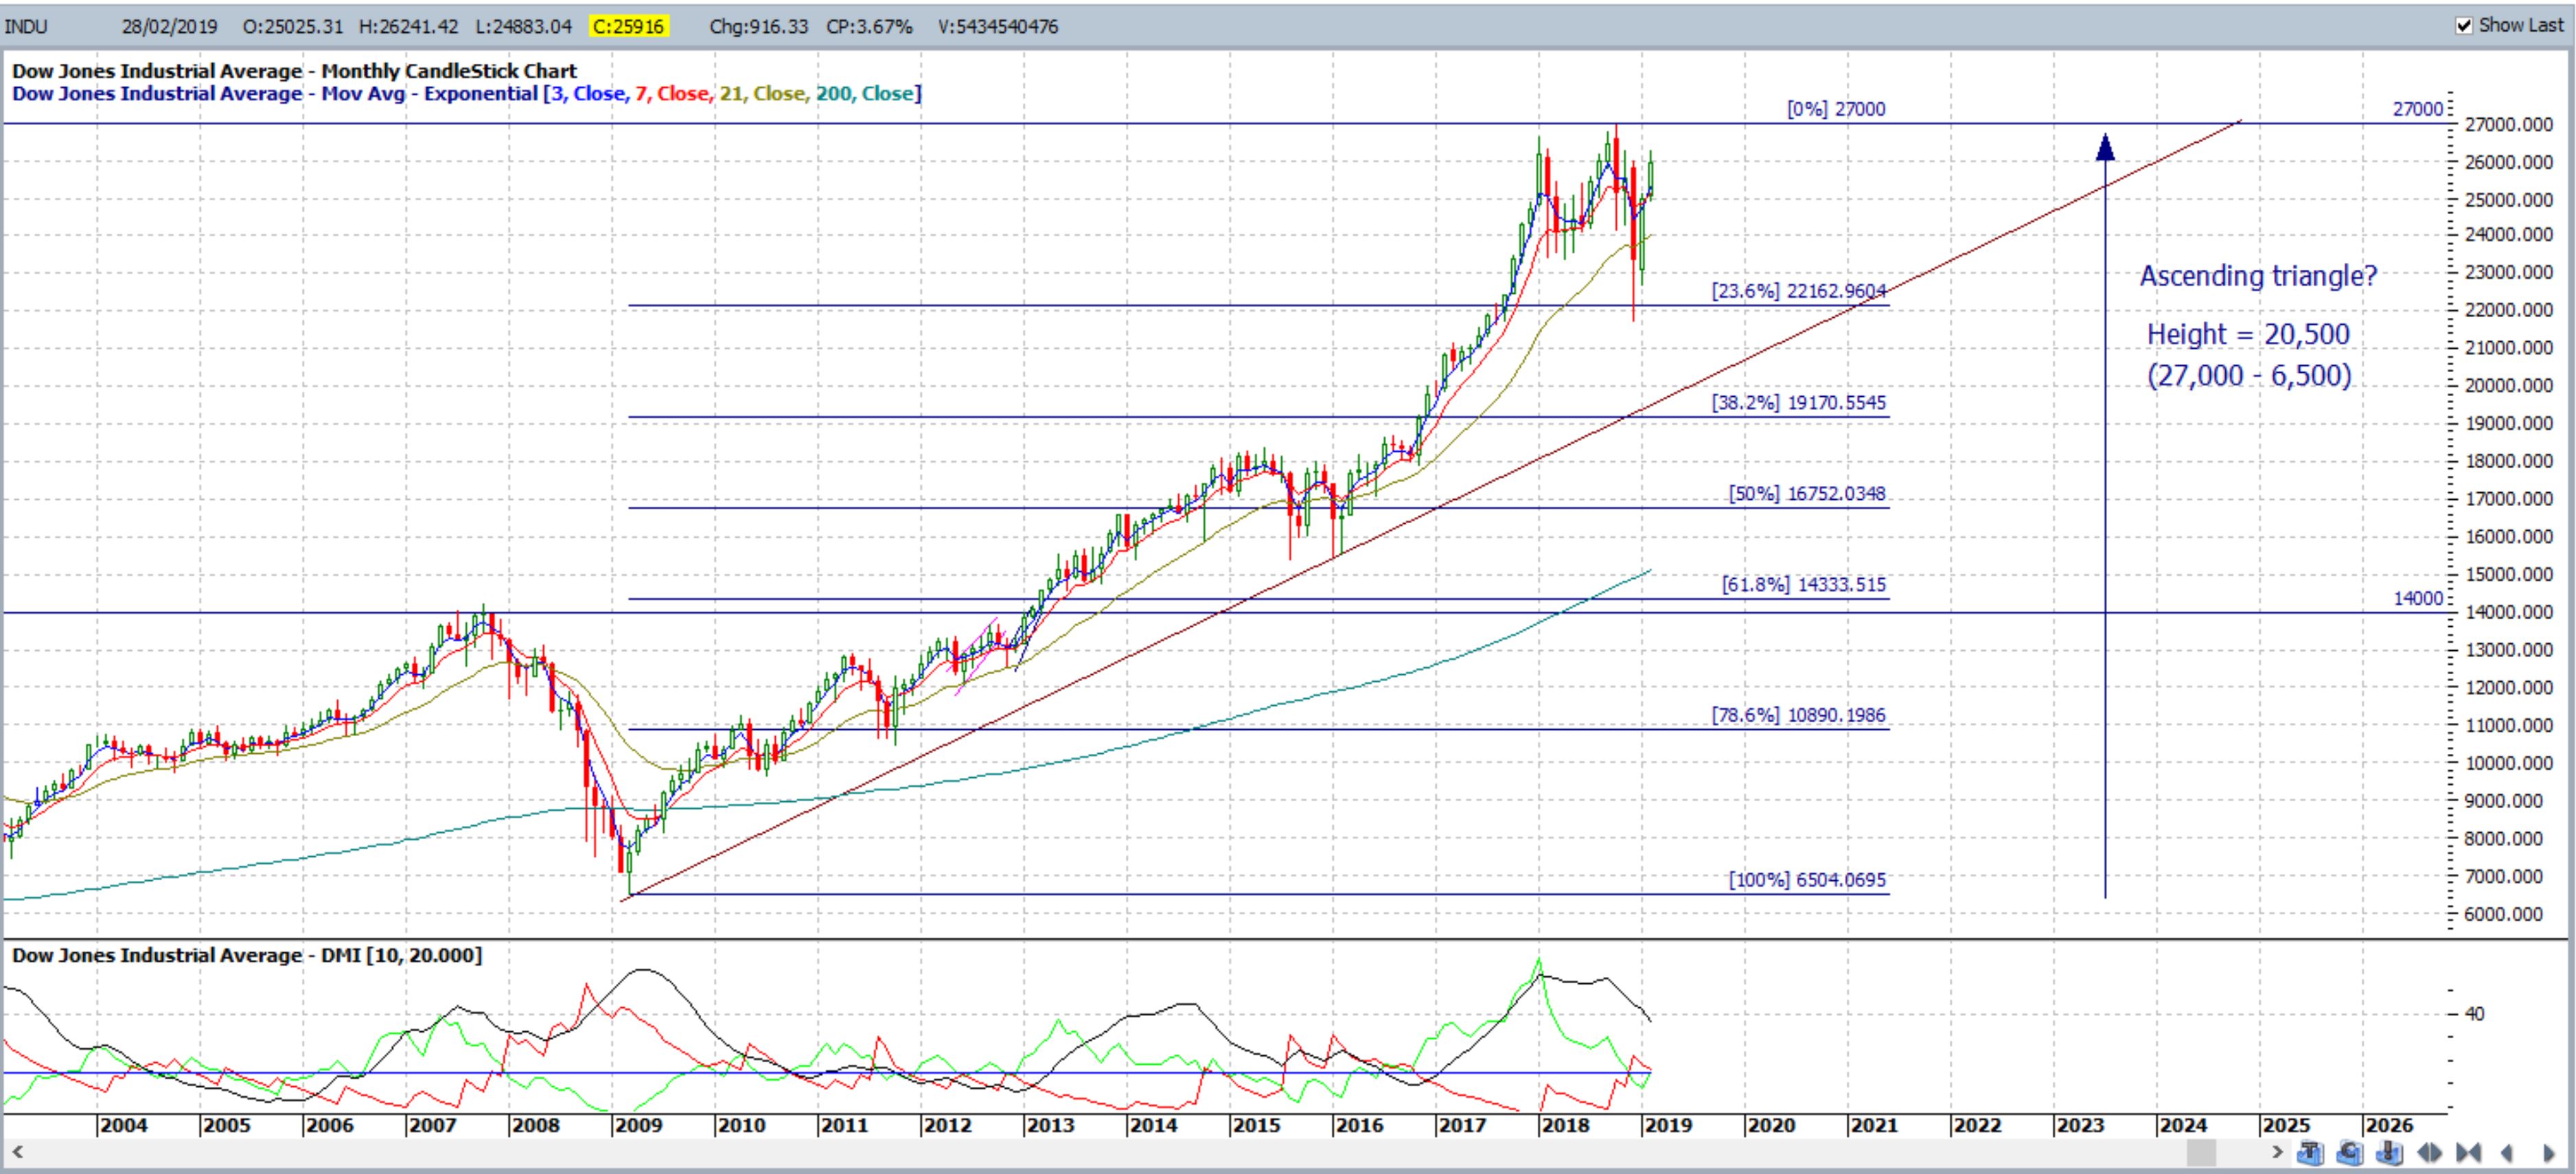
DJIA monthly: The DJIA also closed with a small bullish monthly candle. Price action can be seen to be consolidating under a previous High, circa 27,000 and also on declining momentum. The previous multi-year ascending triangle breakout, from 2014, has completed but I am seeing a new ascending triangle forming here too and this is a large ascending triangle pattern with a height of 20,500. Thus, the target for any successful breakout above 27,000 would be 47,500 (27,000 + 20,500). Clearly, another long-term pattern as was the previous triangle.
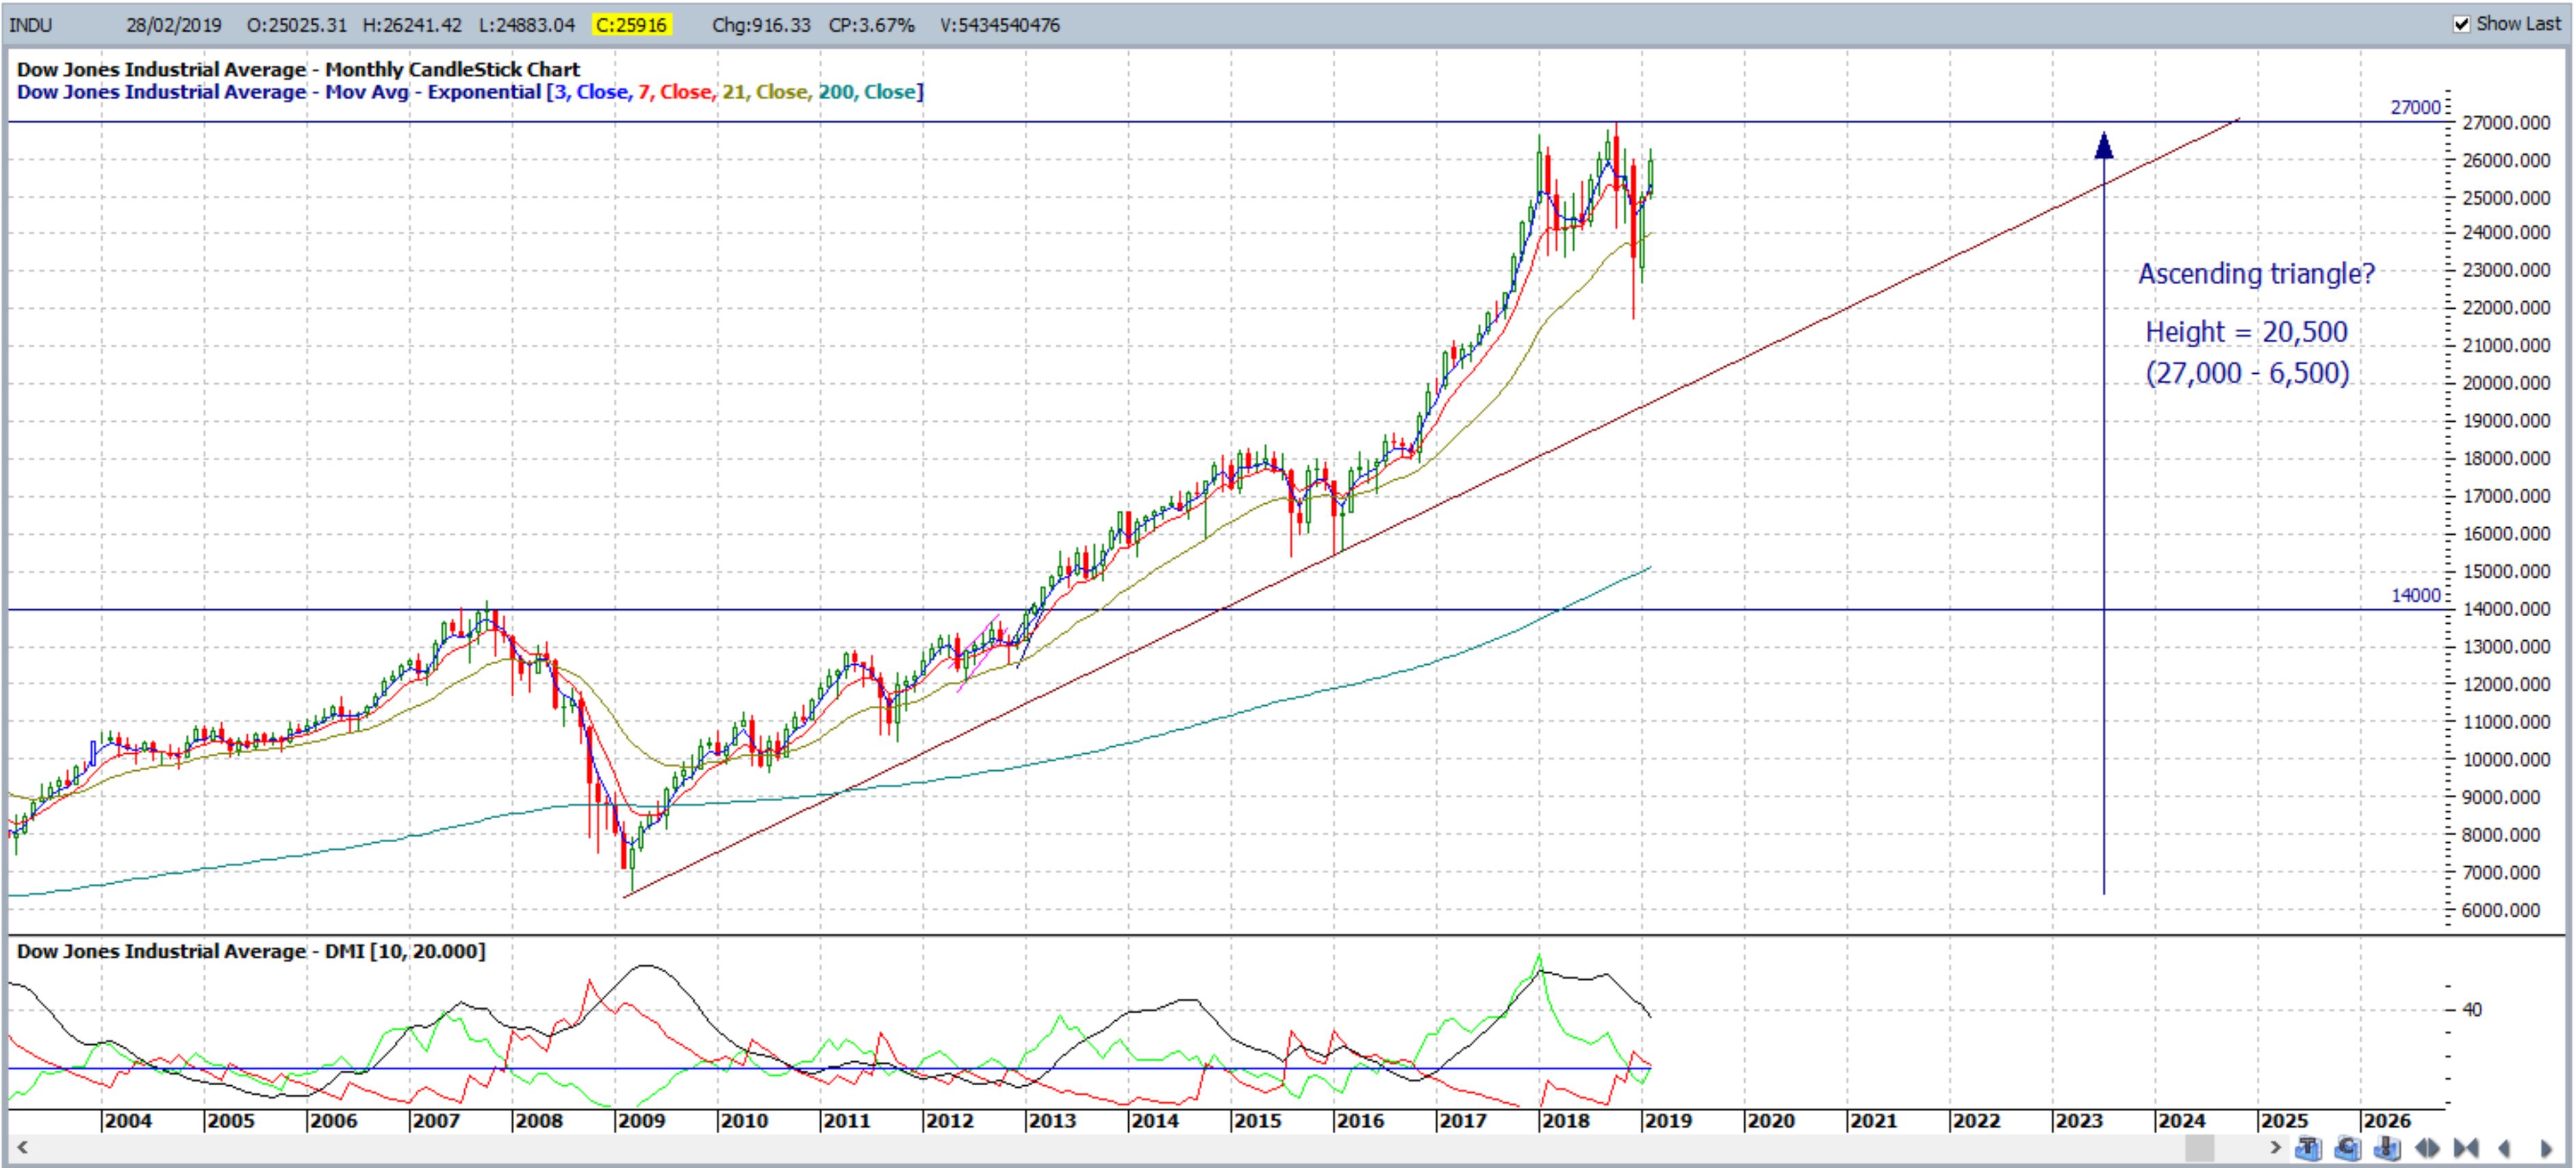
Any breakdown of the ascending triangle support trend line would bring the monthly 61.8% Fibonacci level, near the previous ascending triangle breakout level of 14,000, into some greater focus.
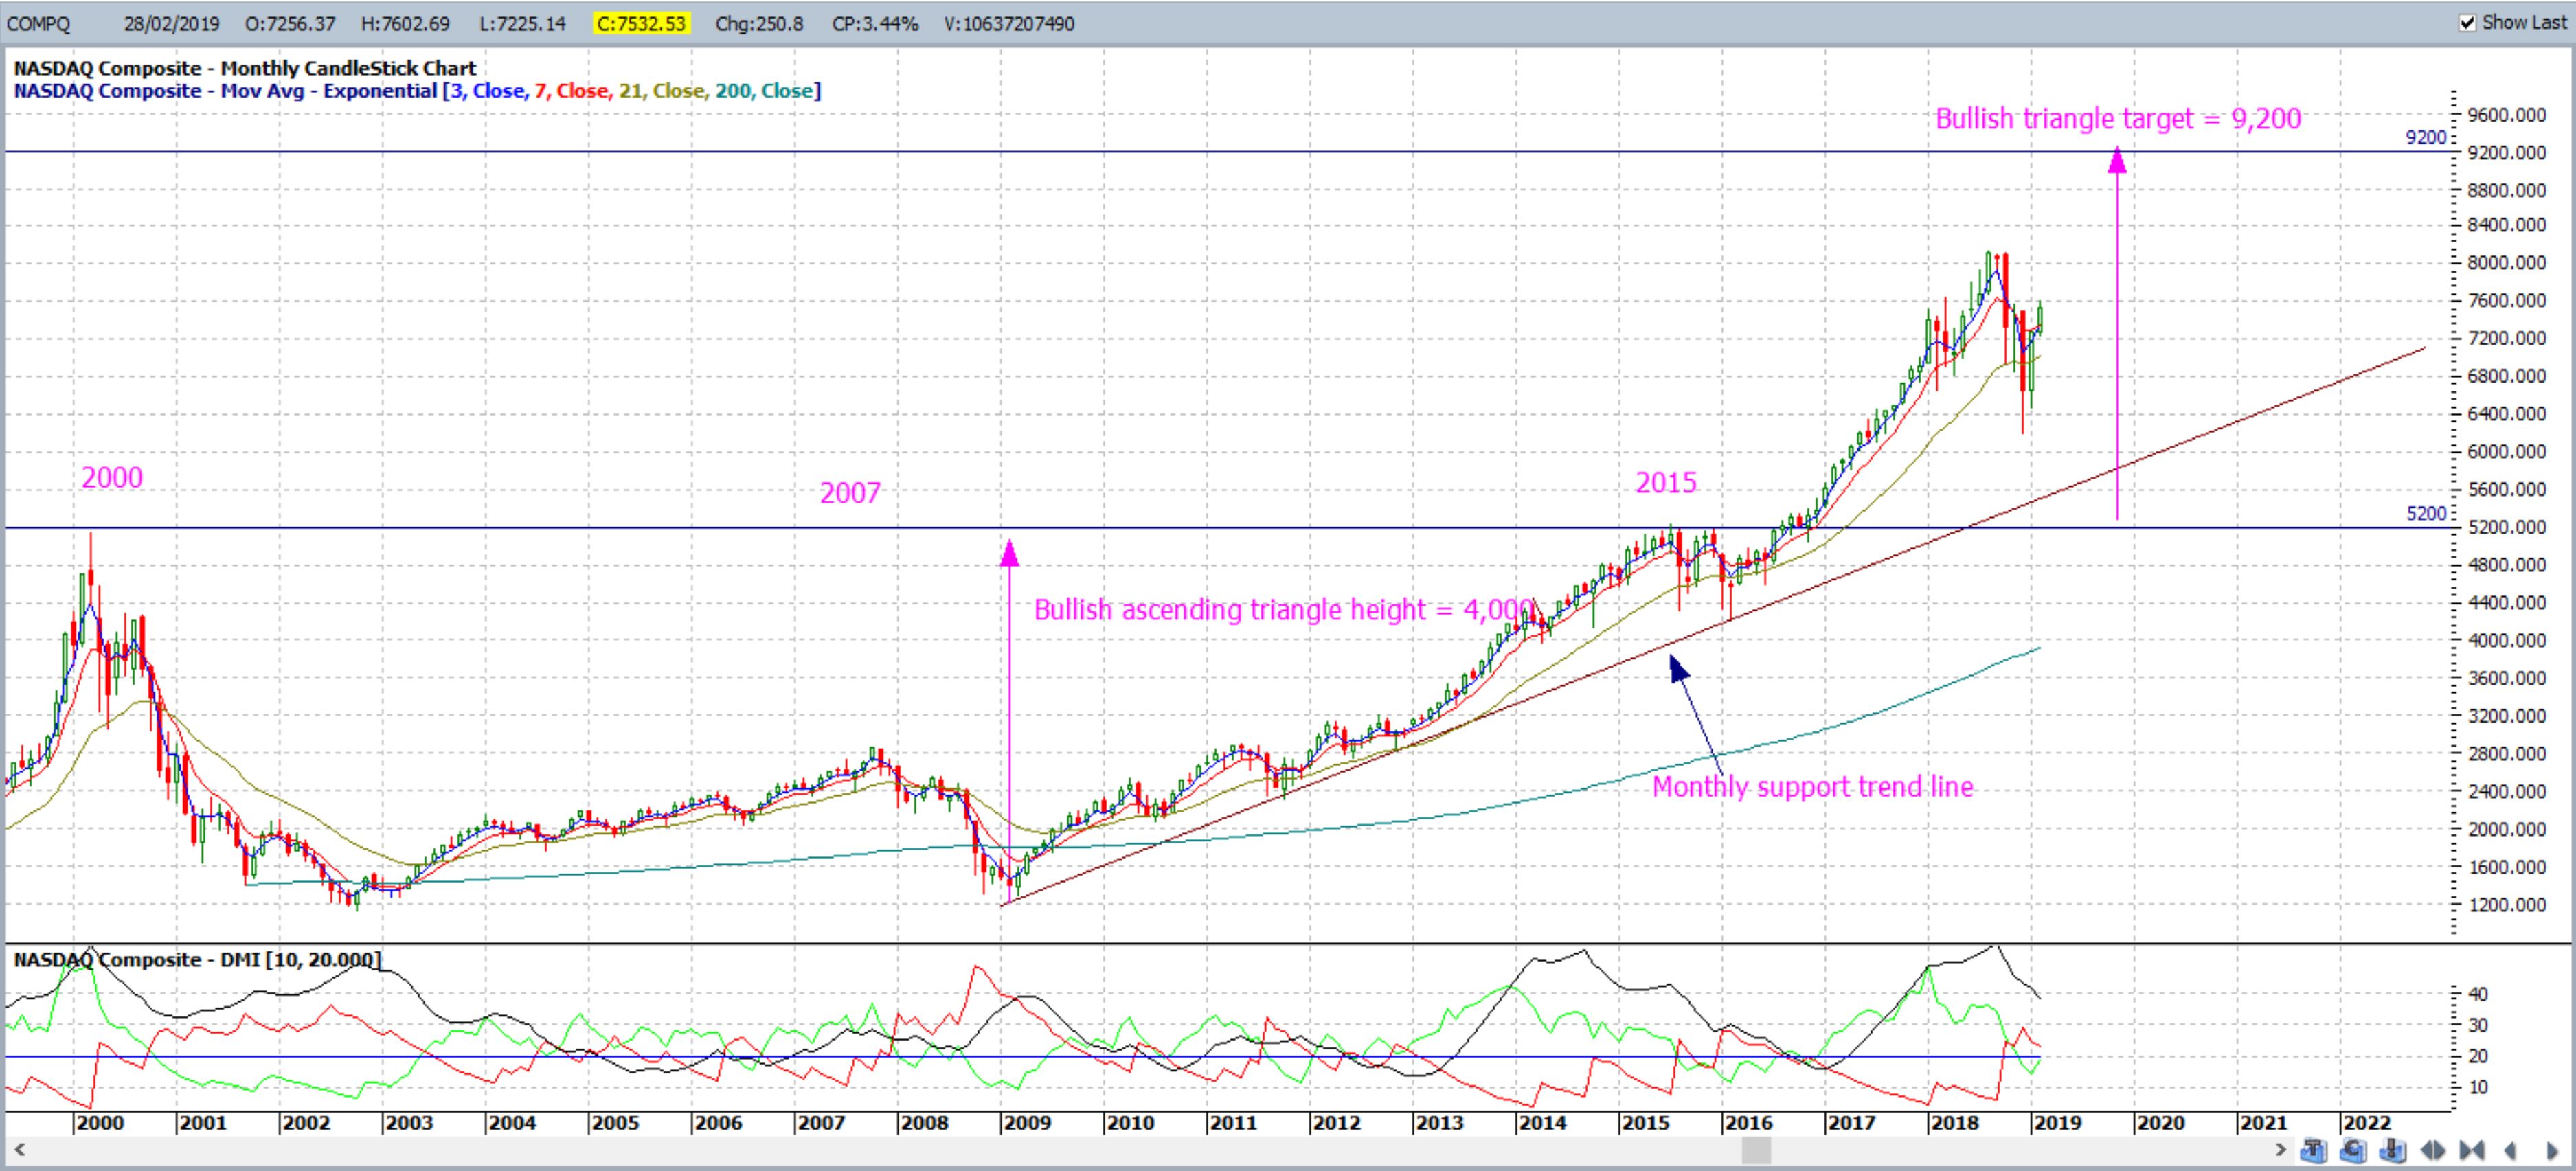
NASDAQ monthly: the US Tech index closed with a small bullish monthly candle and note how momentum continues to decline here too. The bullish ascending triangle breakout, triggered with the monthly break of 5,200 back in 2016, is still in progress with a target of 9,200. Recall that similar ascending triangle breakouts on the S&P500 and DJIA, fist described here, have already completed. Thus, watch for any push up to the recent High, circa 8,133.
Russell-2000 monthly: The Russell-2000 also closed with a bullish monthly candle and price action can be seen to be consolidating under a previous High, circa 1,750. The previous multi-year ascending triangle breakout, from 2014, has completed and I am seeing a new ascending triangle forming here as well and this is a large, ascending triangle pattern with a height of 1,410. Thus, the target for any successful breakout above 1,750 would be 3,610 (1,750 + 1,410). Another long-term pattern as was the previous triangle.
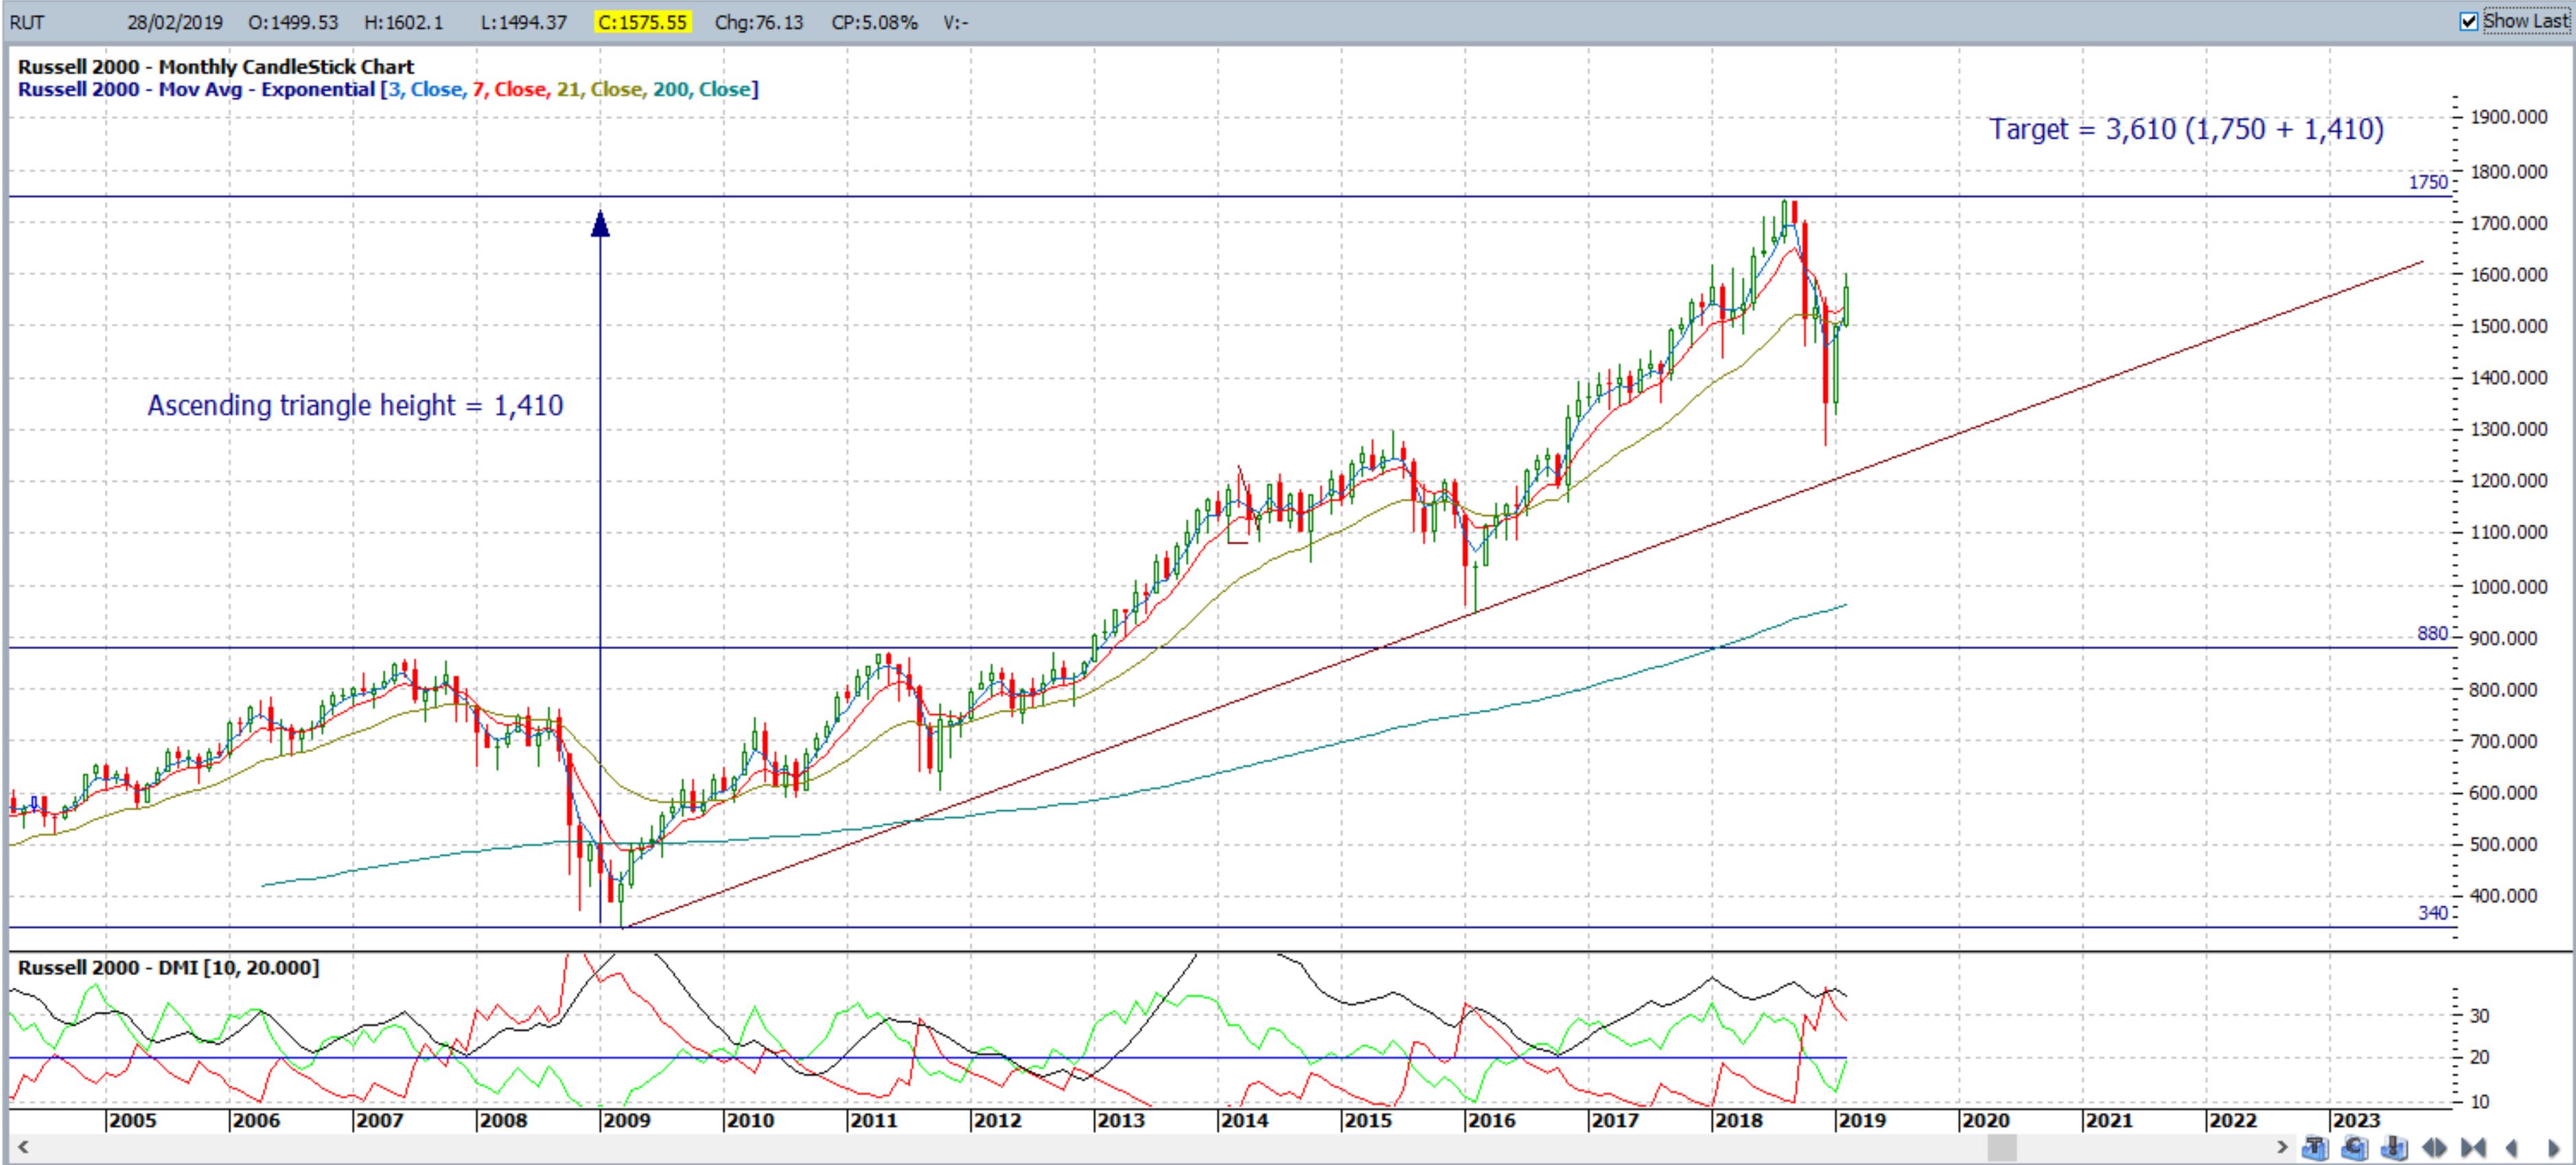
Any breakdown of the ascending triangle support trend line would bring the monthly 61.8% Fibonacci level, near the previous ascending triangle breakout level of 800, into some greater focus.

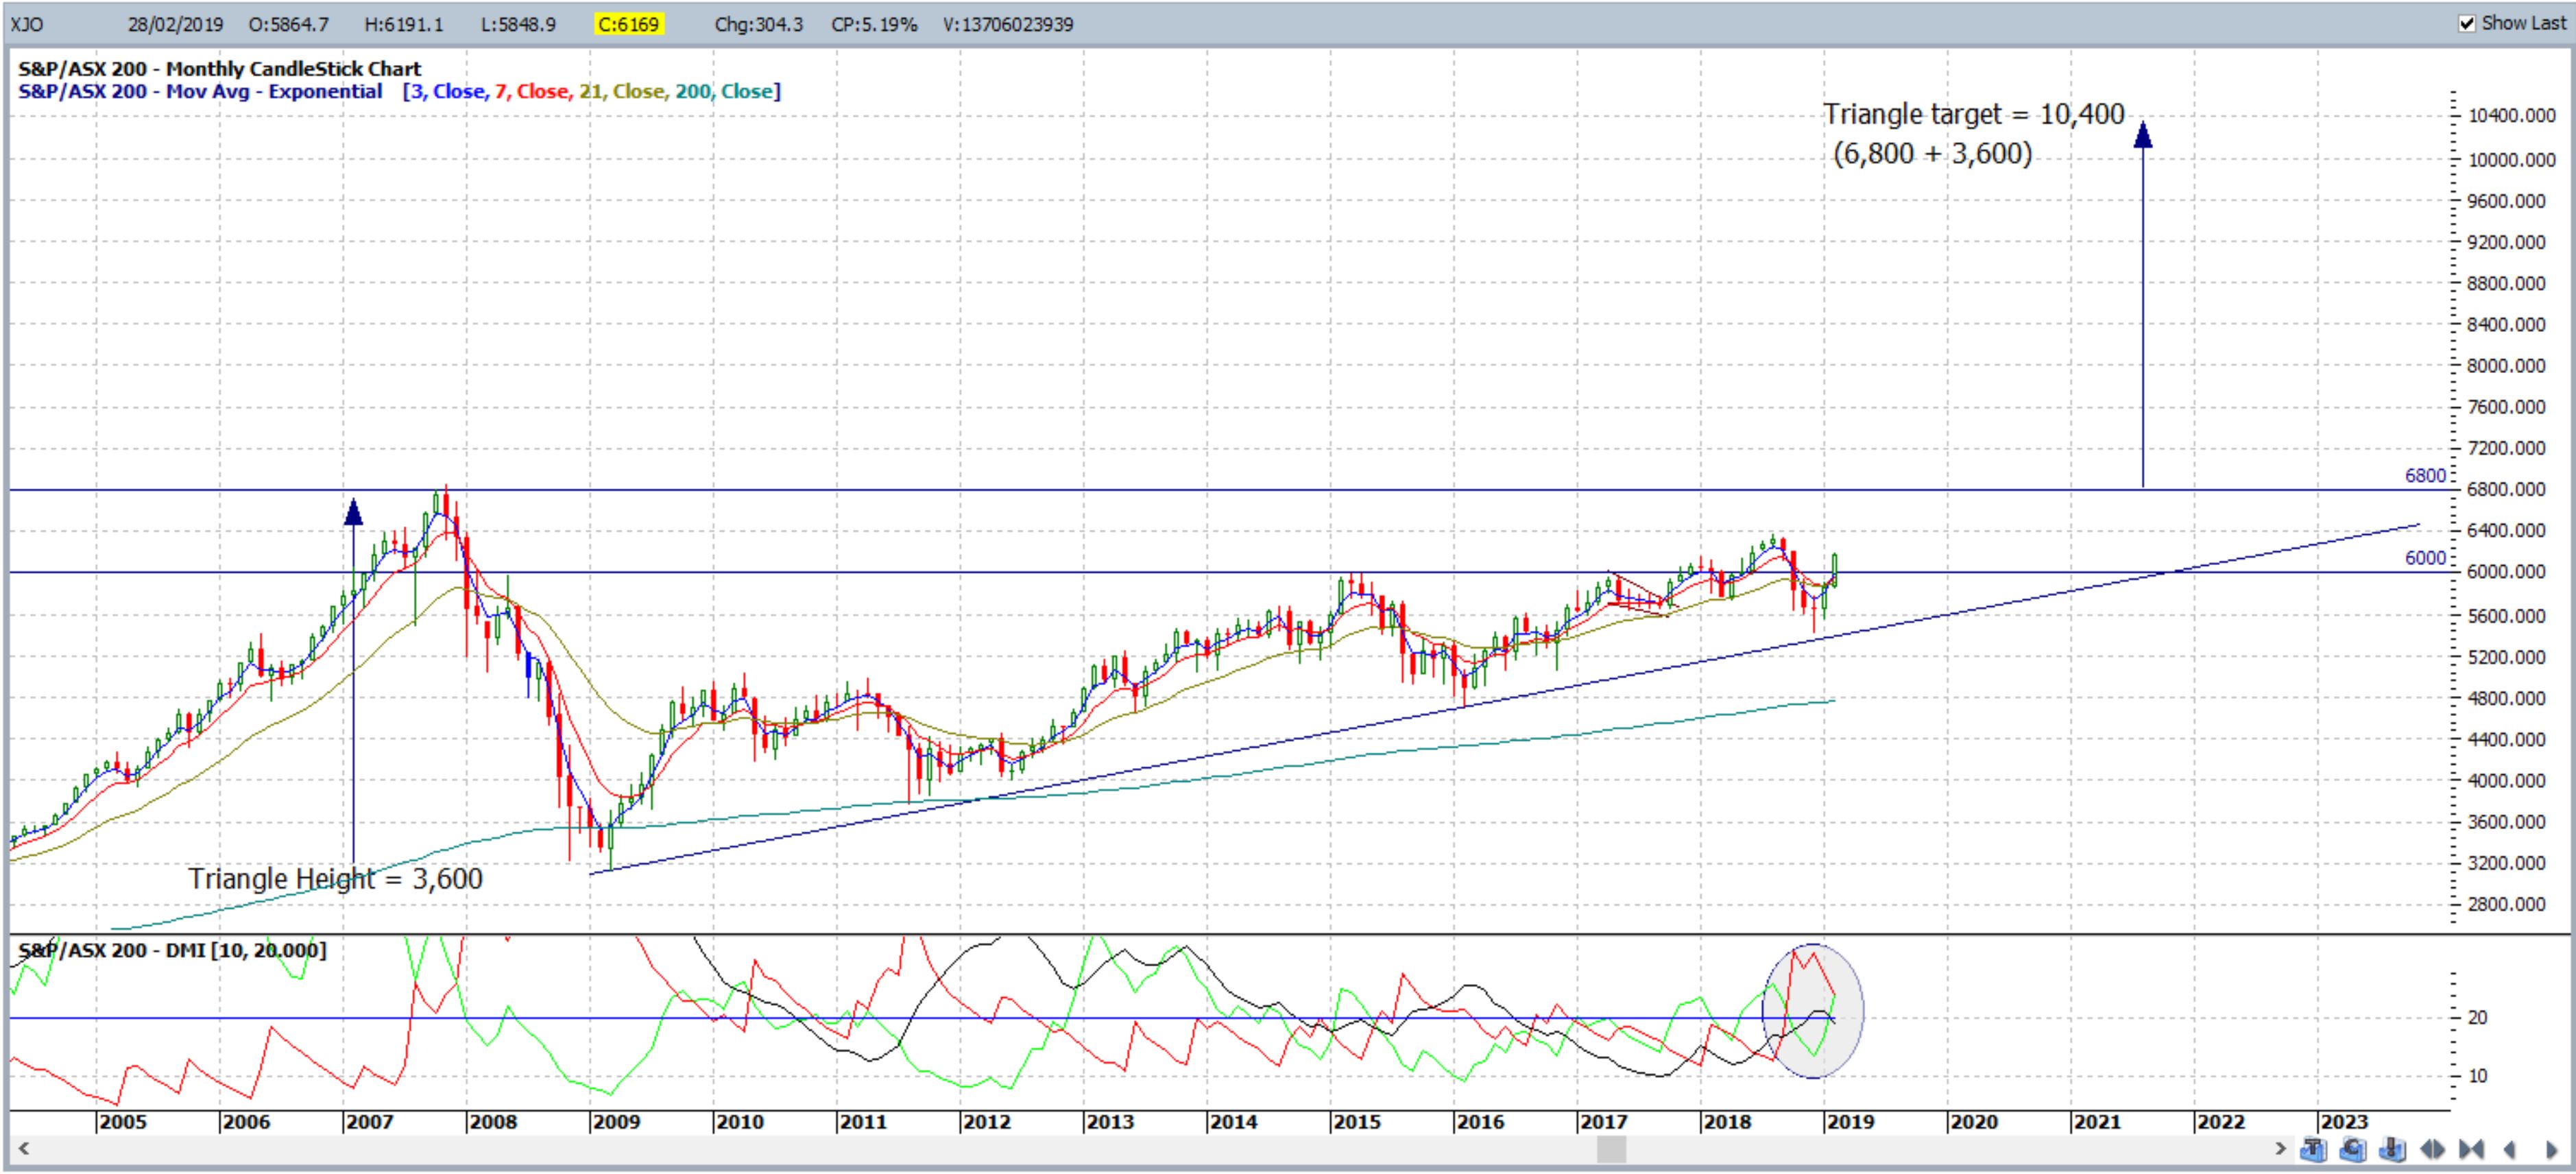
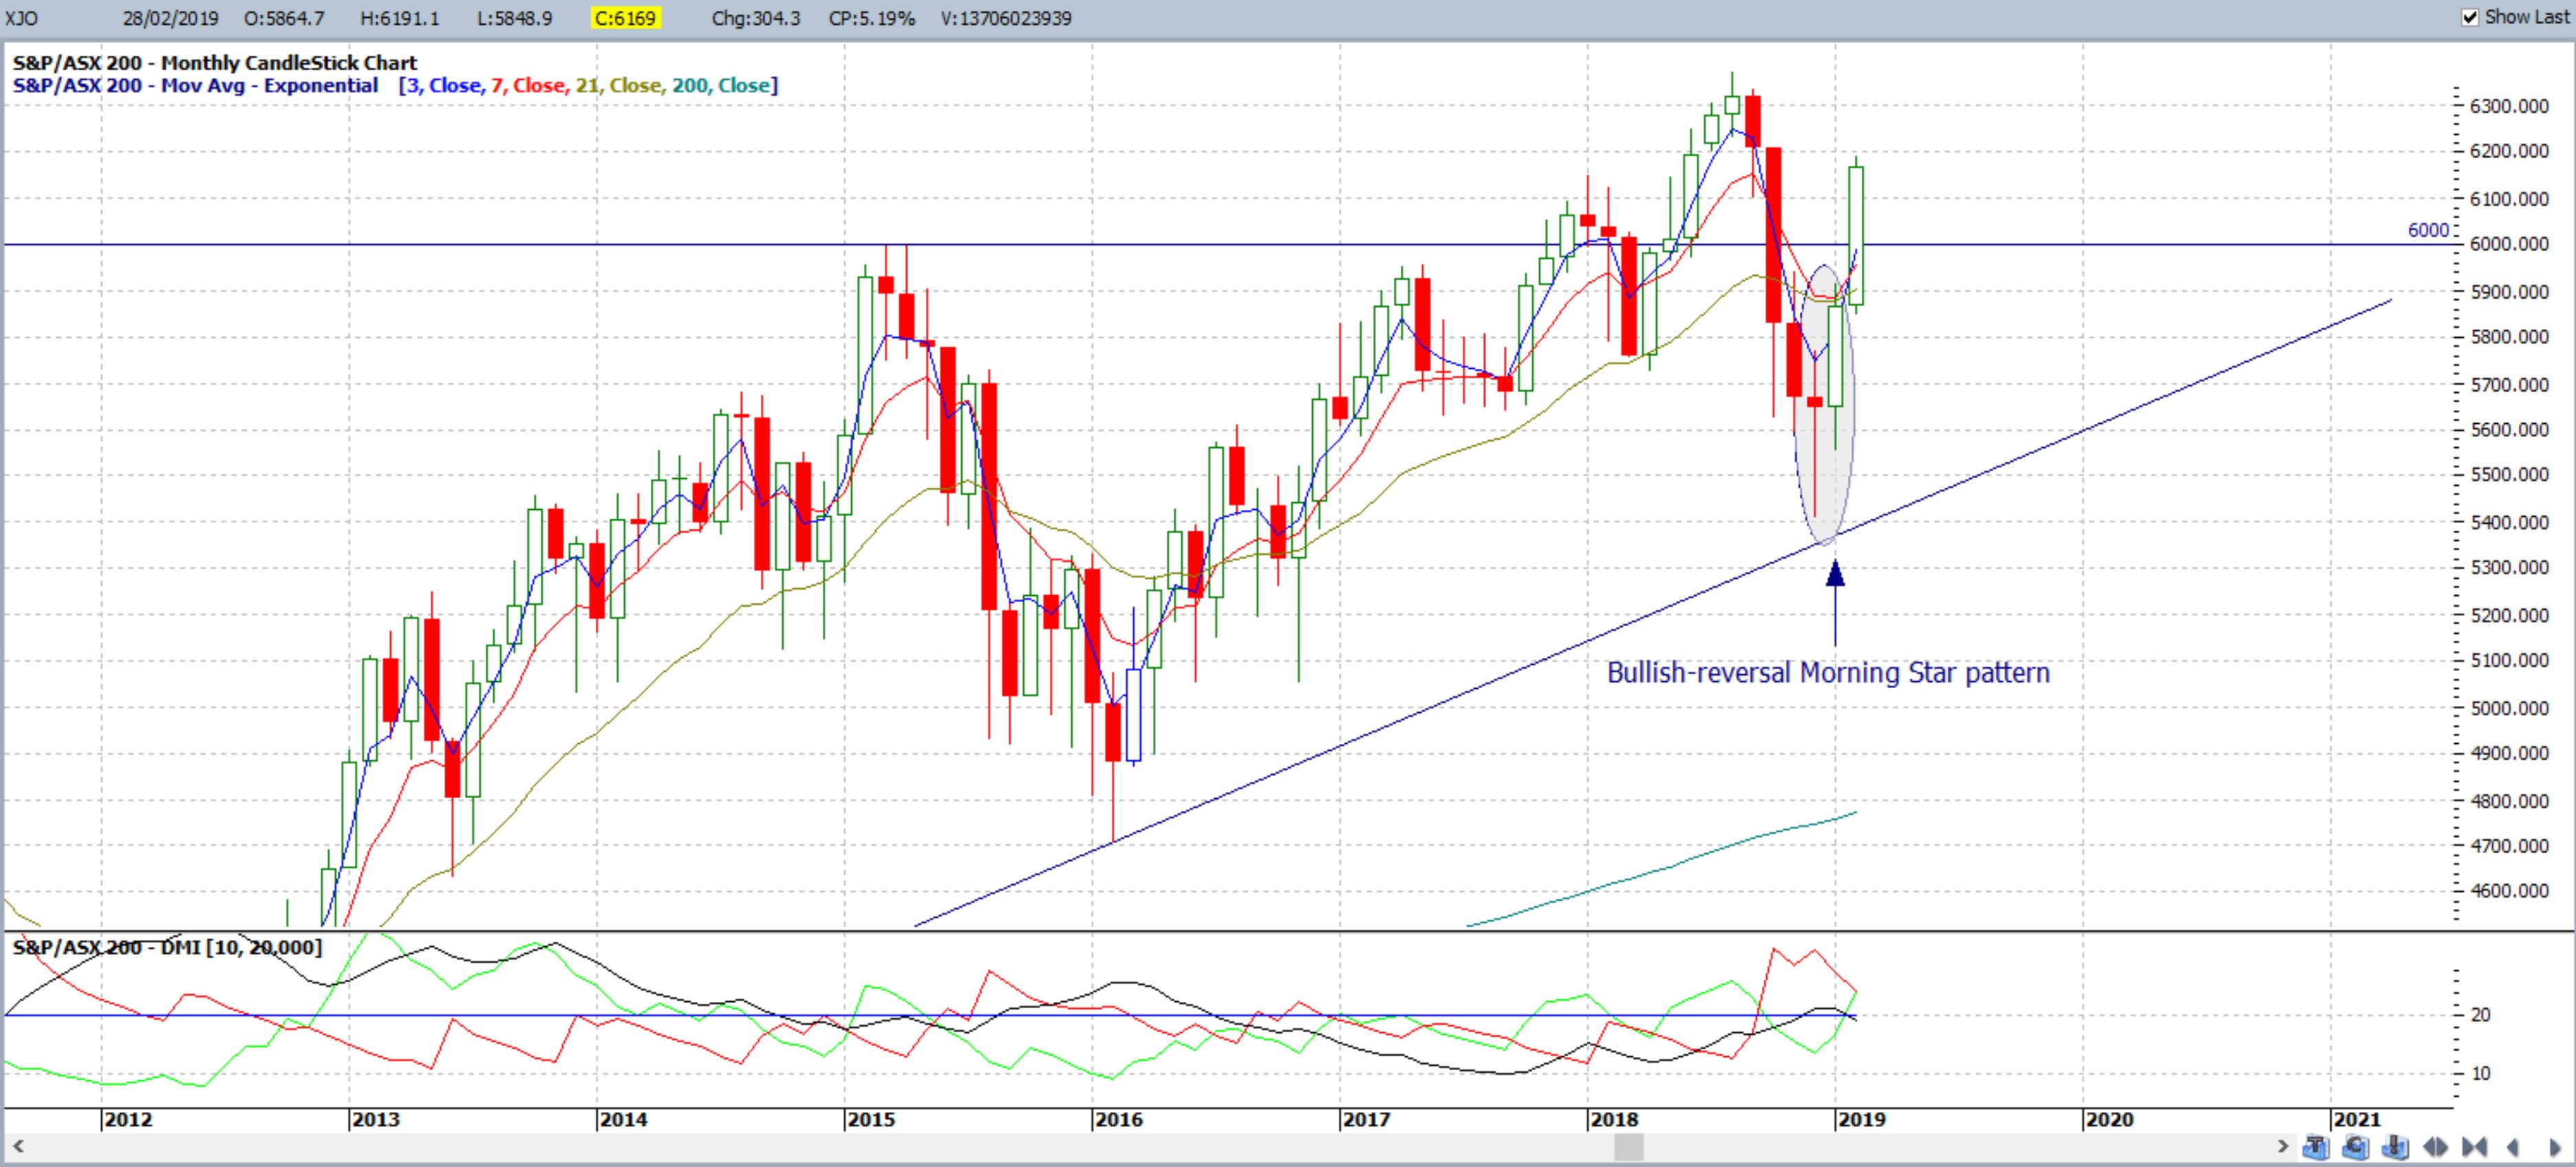
ASX-200 monthly: the Aussie XJO index closed with a bullish monthly candle following last month’s print of a bullish-reversal Morning Star pattern. The bullish ascending triangle breakout is still forming and the breakout level of 6,800 remains well above current price action. Watch for any push up to the recent High, circa 6,800 and for any triangle breakout to trigger.
There has been a large bullish gain for February following the bullish-reversal Morning Star that printed after the January candle close:
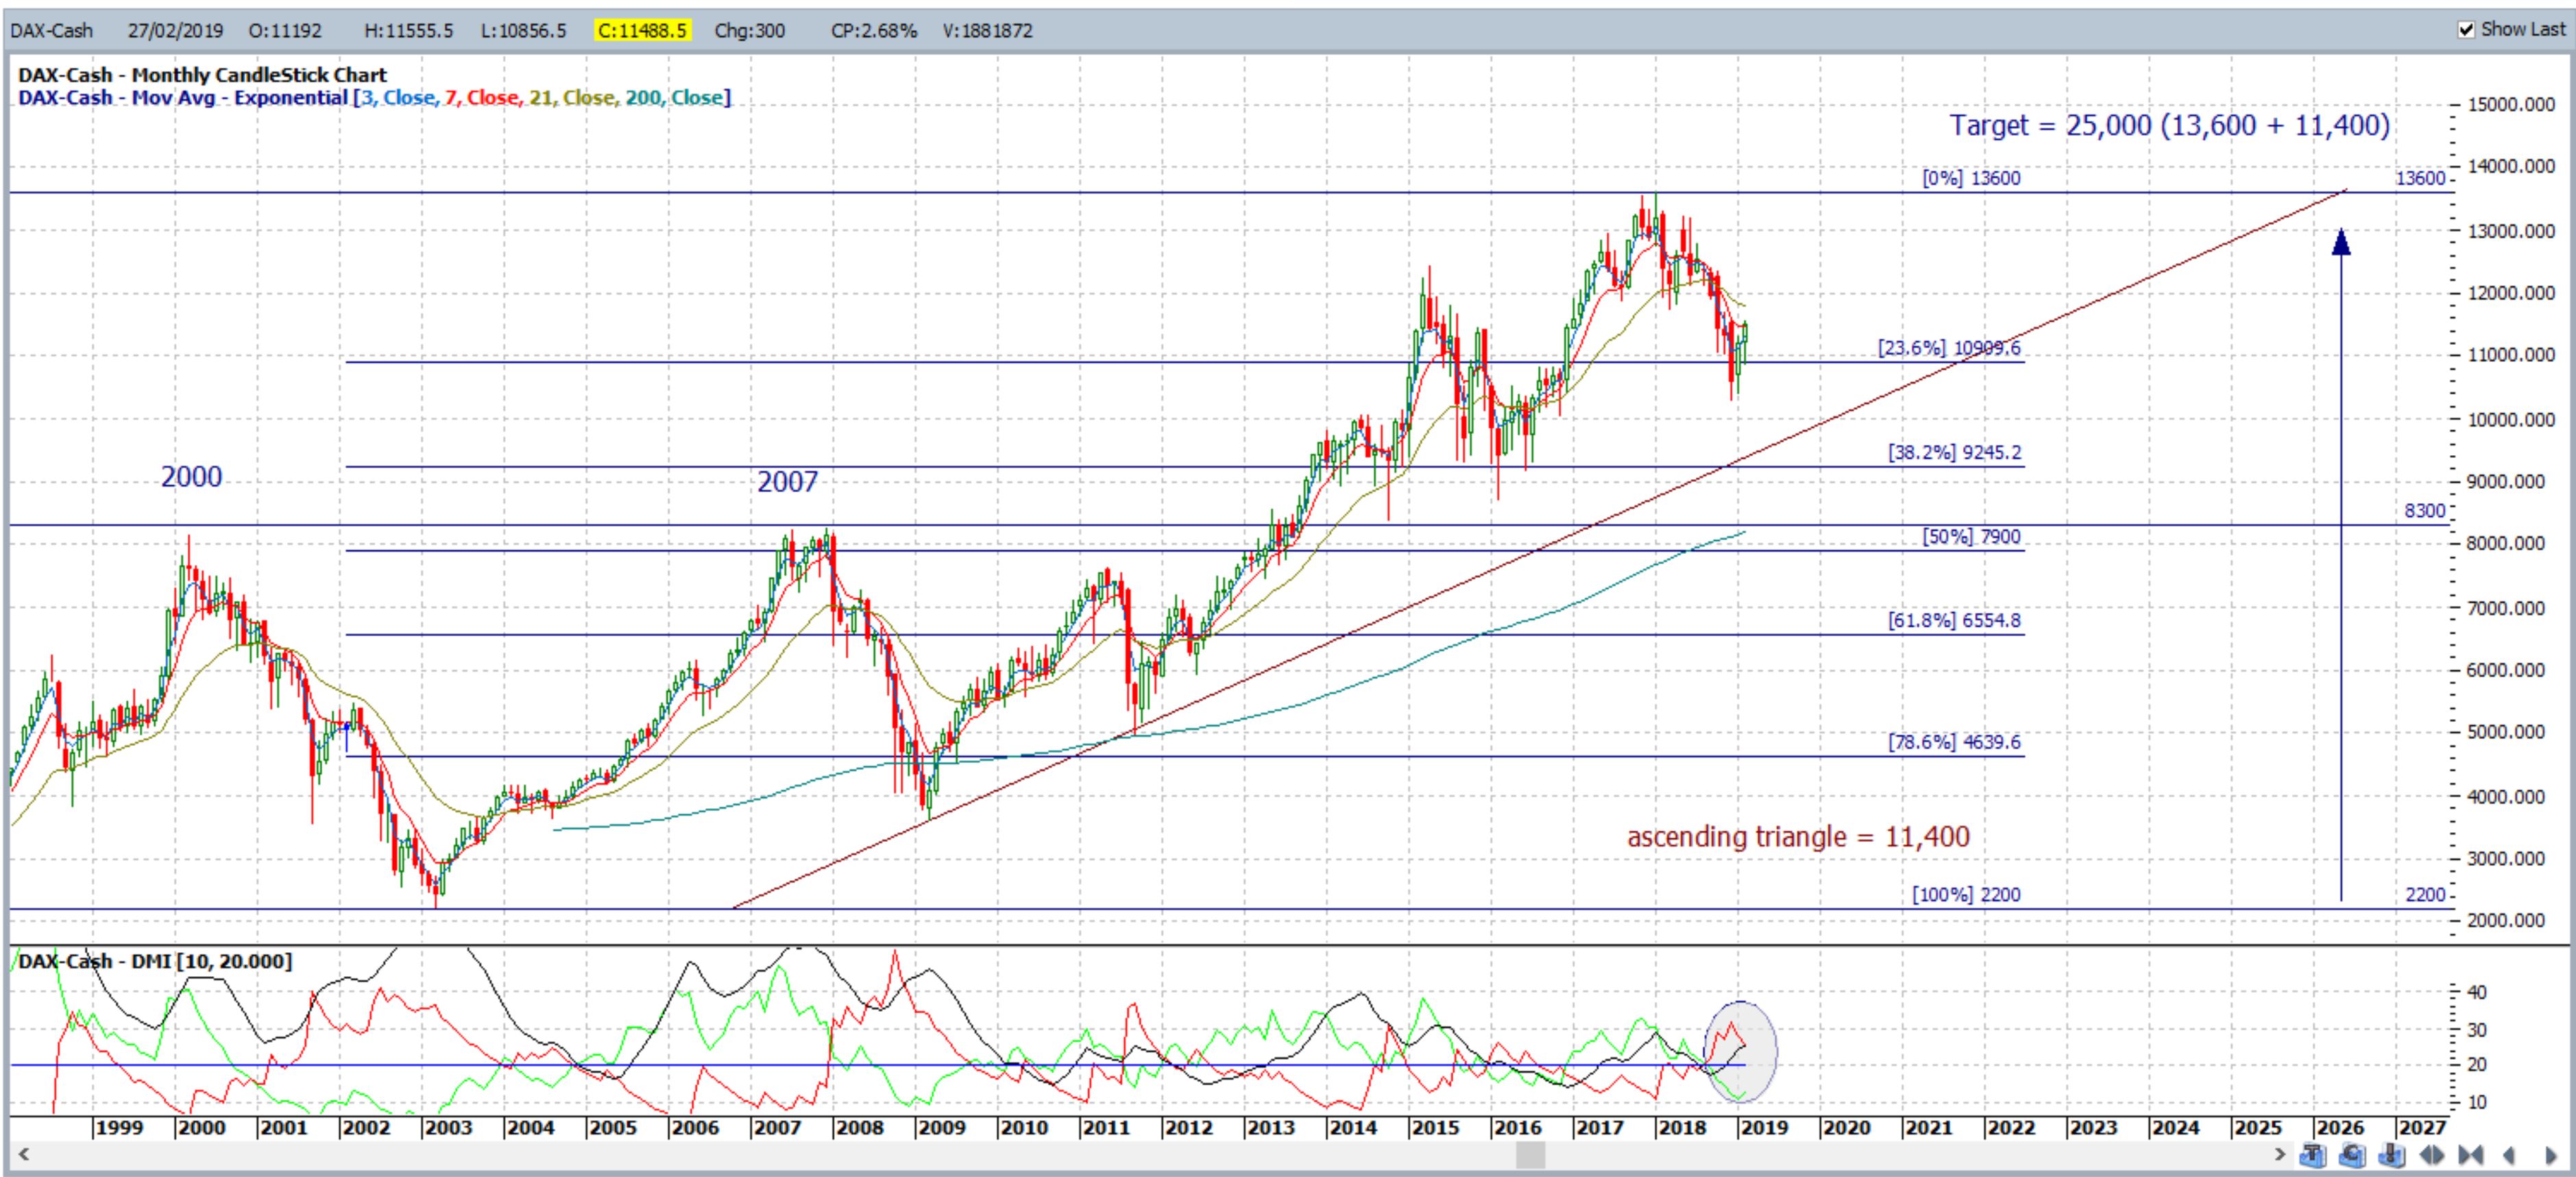
DAX monthly: The German Dax closed with a bullish monthly candle and price action can be seen to be consolidating under a previous High, circa 13,600. The previous multi-year ascending triangle breakout, from 2014, has completed but I am seeing a new ascending triangle forming here as well and this is a large ascending triangle pattern with a height of 11,400. Thus, the target for any successful breakout above 13,600 would be 25,000 (13,600 + 11,400). Another long-term pattern as was the previous triangle.

Any breakdown of the ascending triangle support trend line would bring the monthly 50% Fibonacci level, near the previous ascending triangle breakout level of 8,300, into some greater focus.
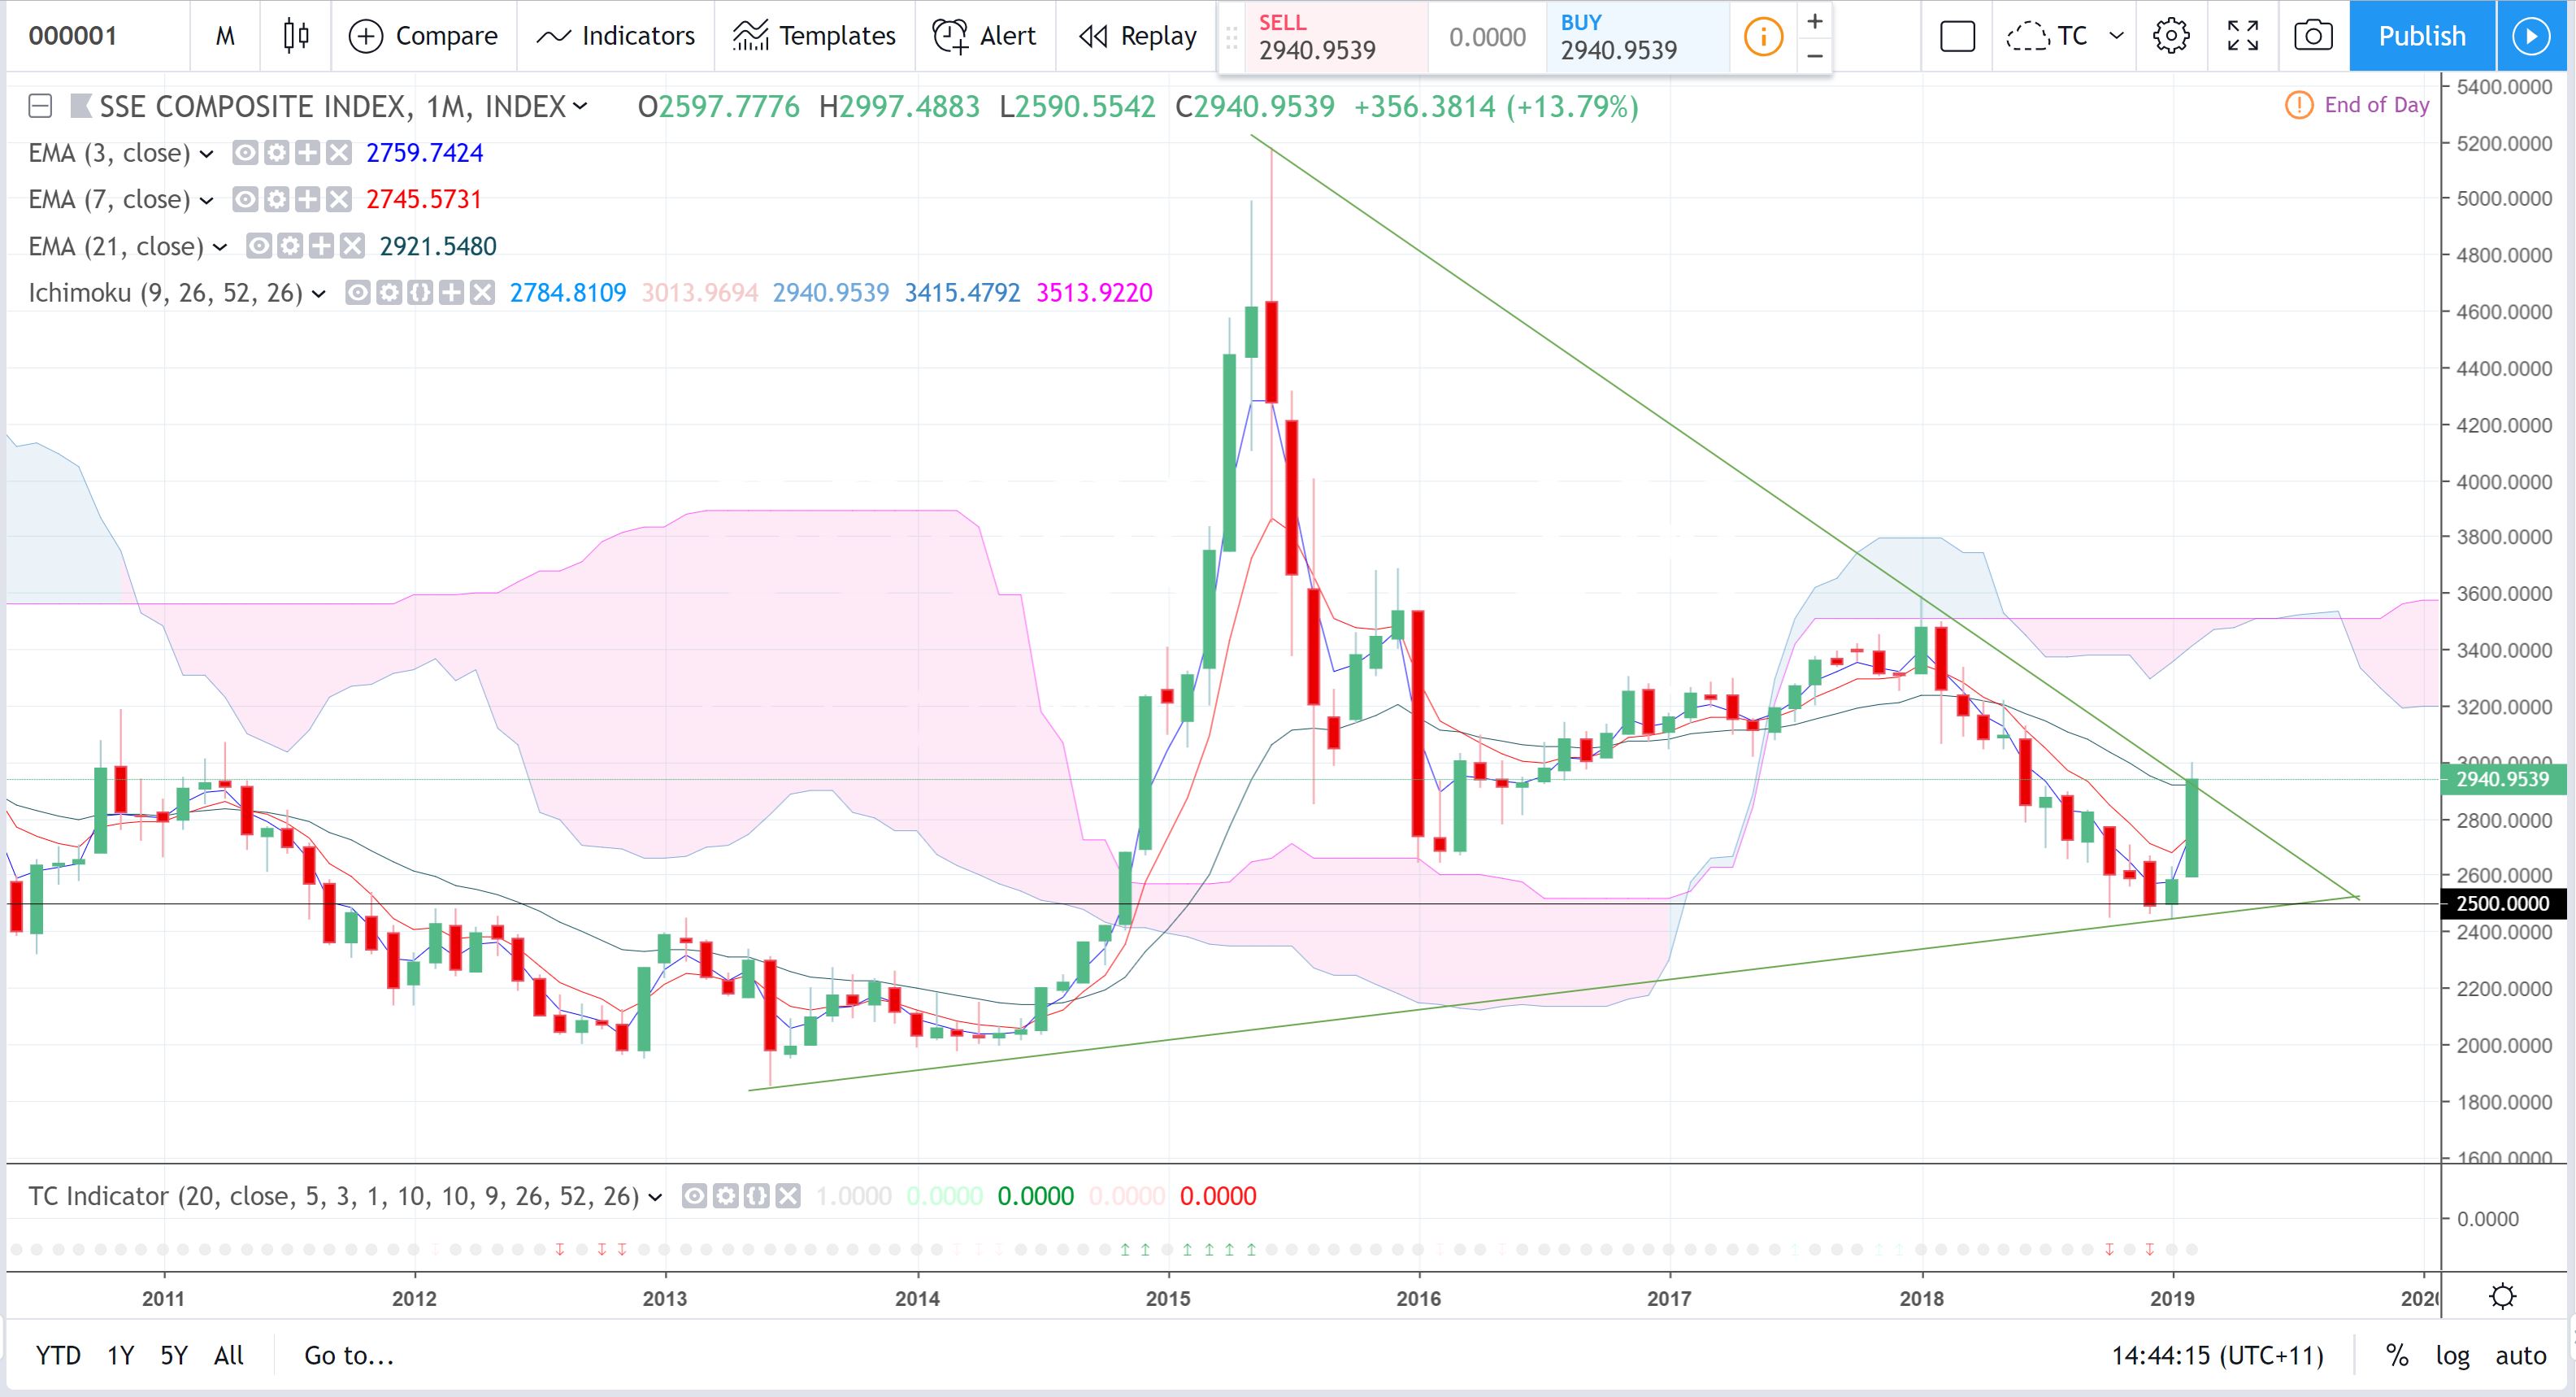
Shanghai Composite Index: I have to use Trading View to access charts of the Shanghai Composite Index. The February candle was a large bullish candle and note how this closed right up at the bear trend line marking the 2015-2019 swing Low move. Watch for any new make or break at this bear trend line.
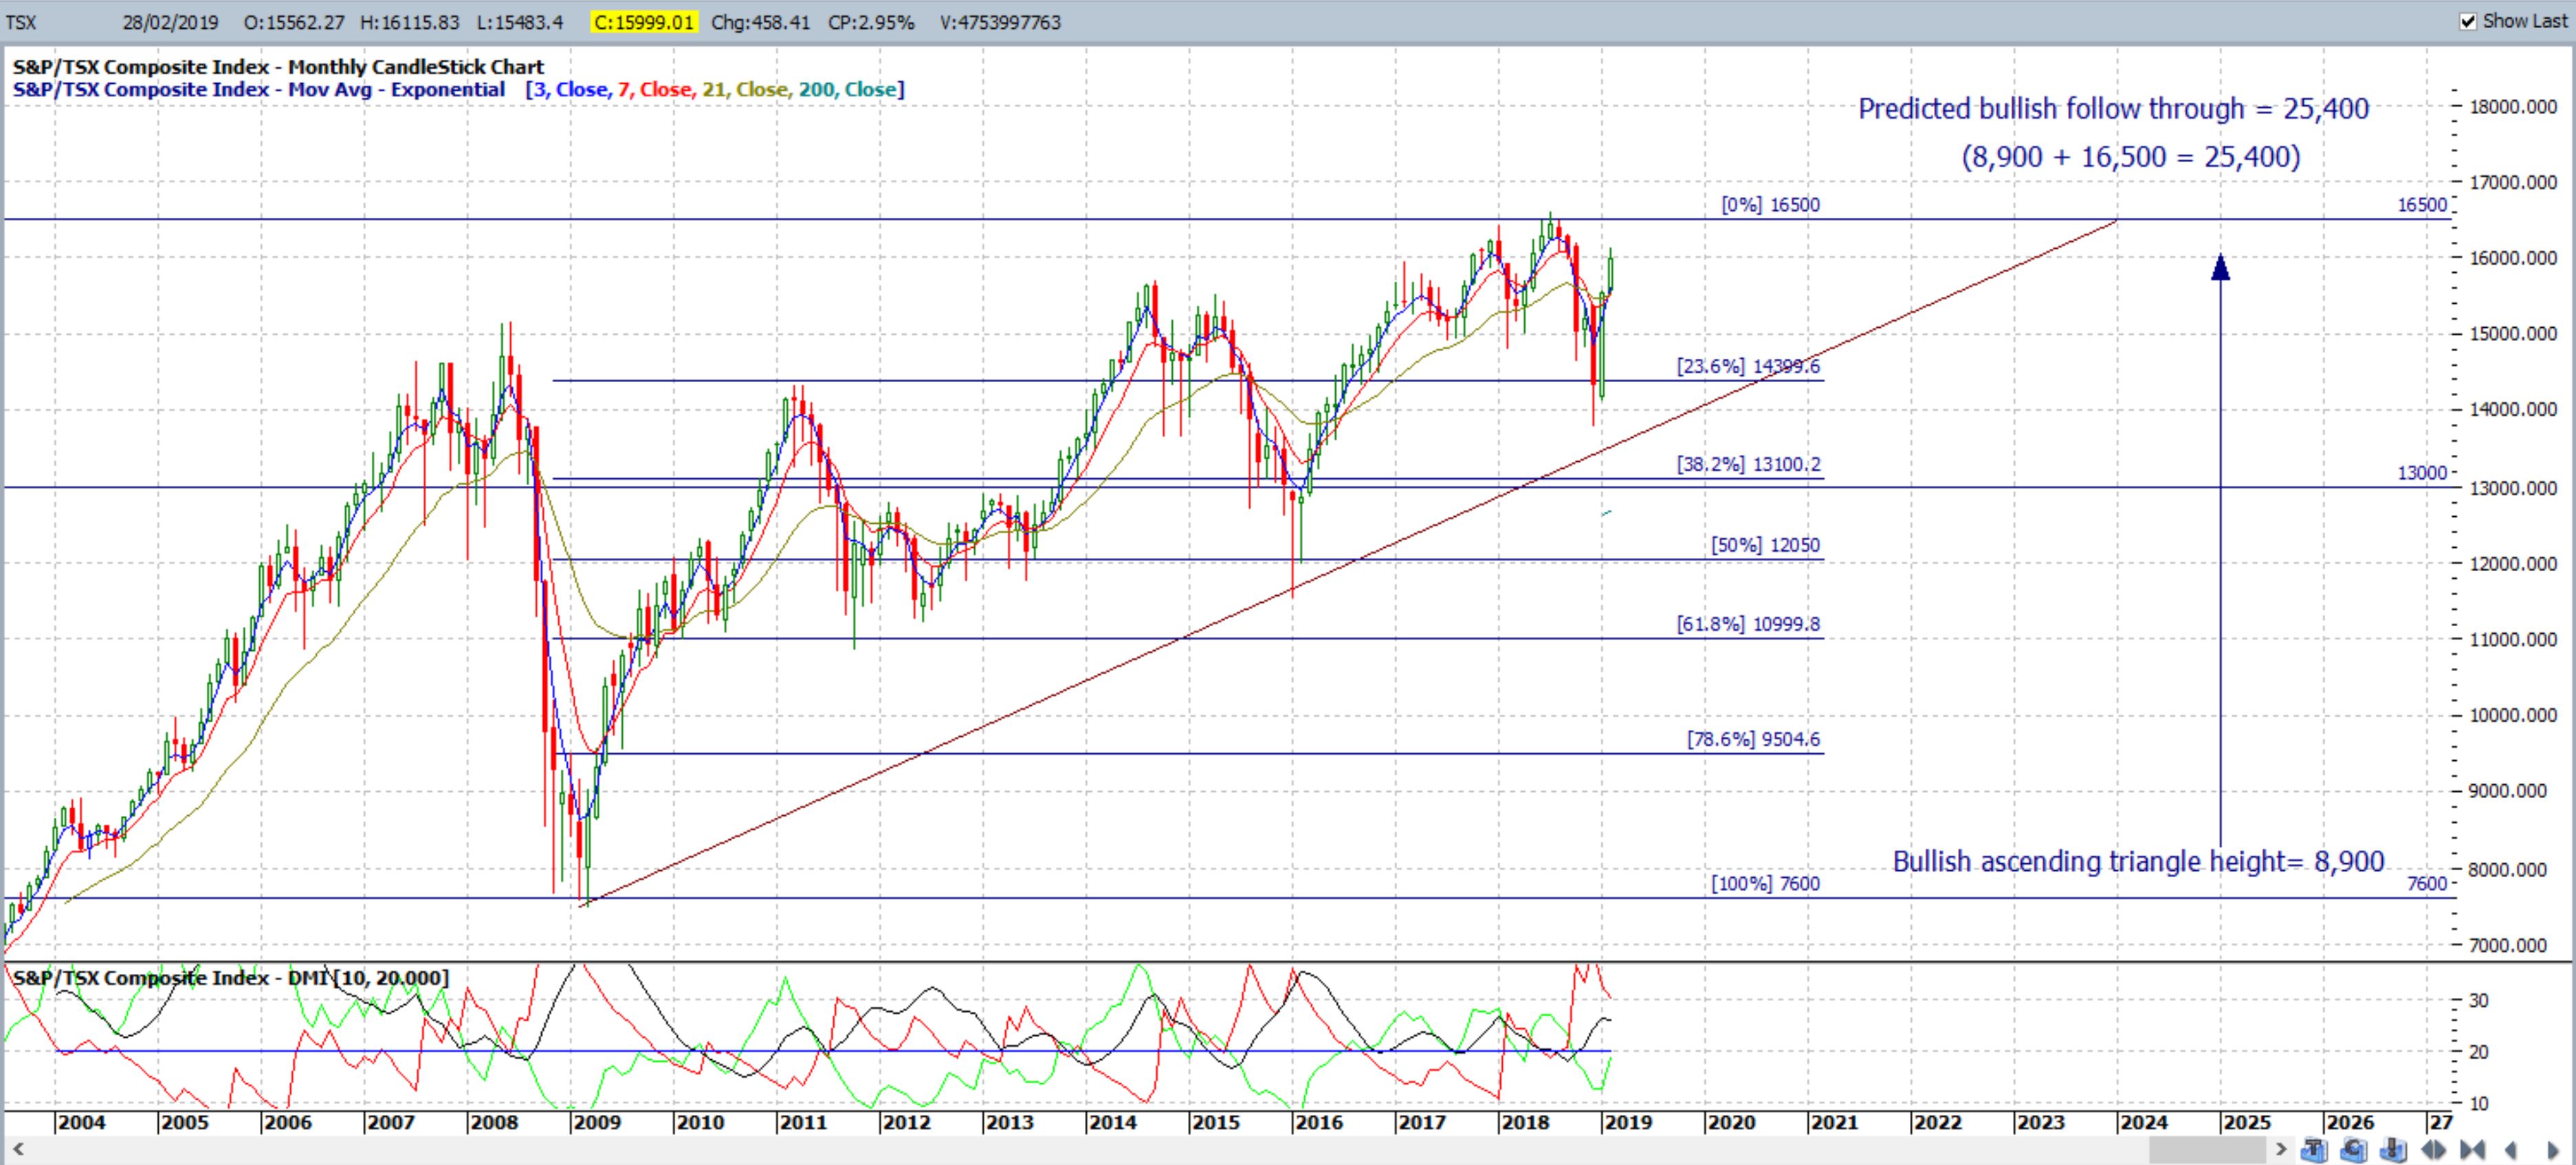
Canada’s TSX Index: Canada’s TSX index closed with a bullish monthly candle and price action can be seen to be consolidating under a previous High, circa 16.500. I am seeing a new ascending triangle form here with a height of 8,900. Thus, the target for any successful breakout above 16,500 would be 25,400 (16,500 + 8,900), which is also, clearly, a long-term pattern.
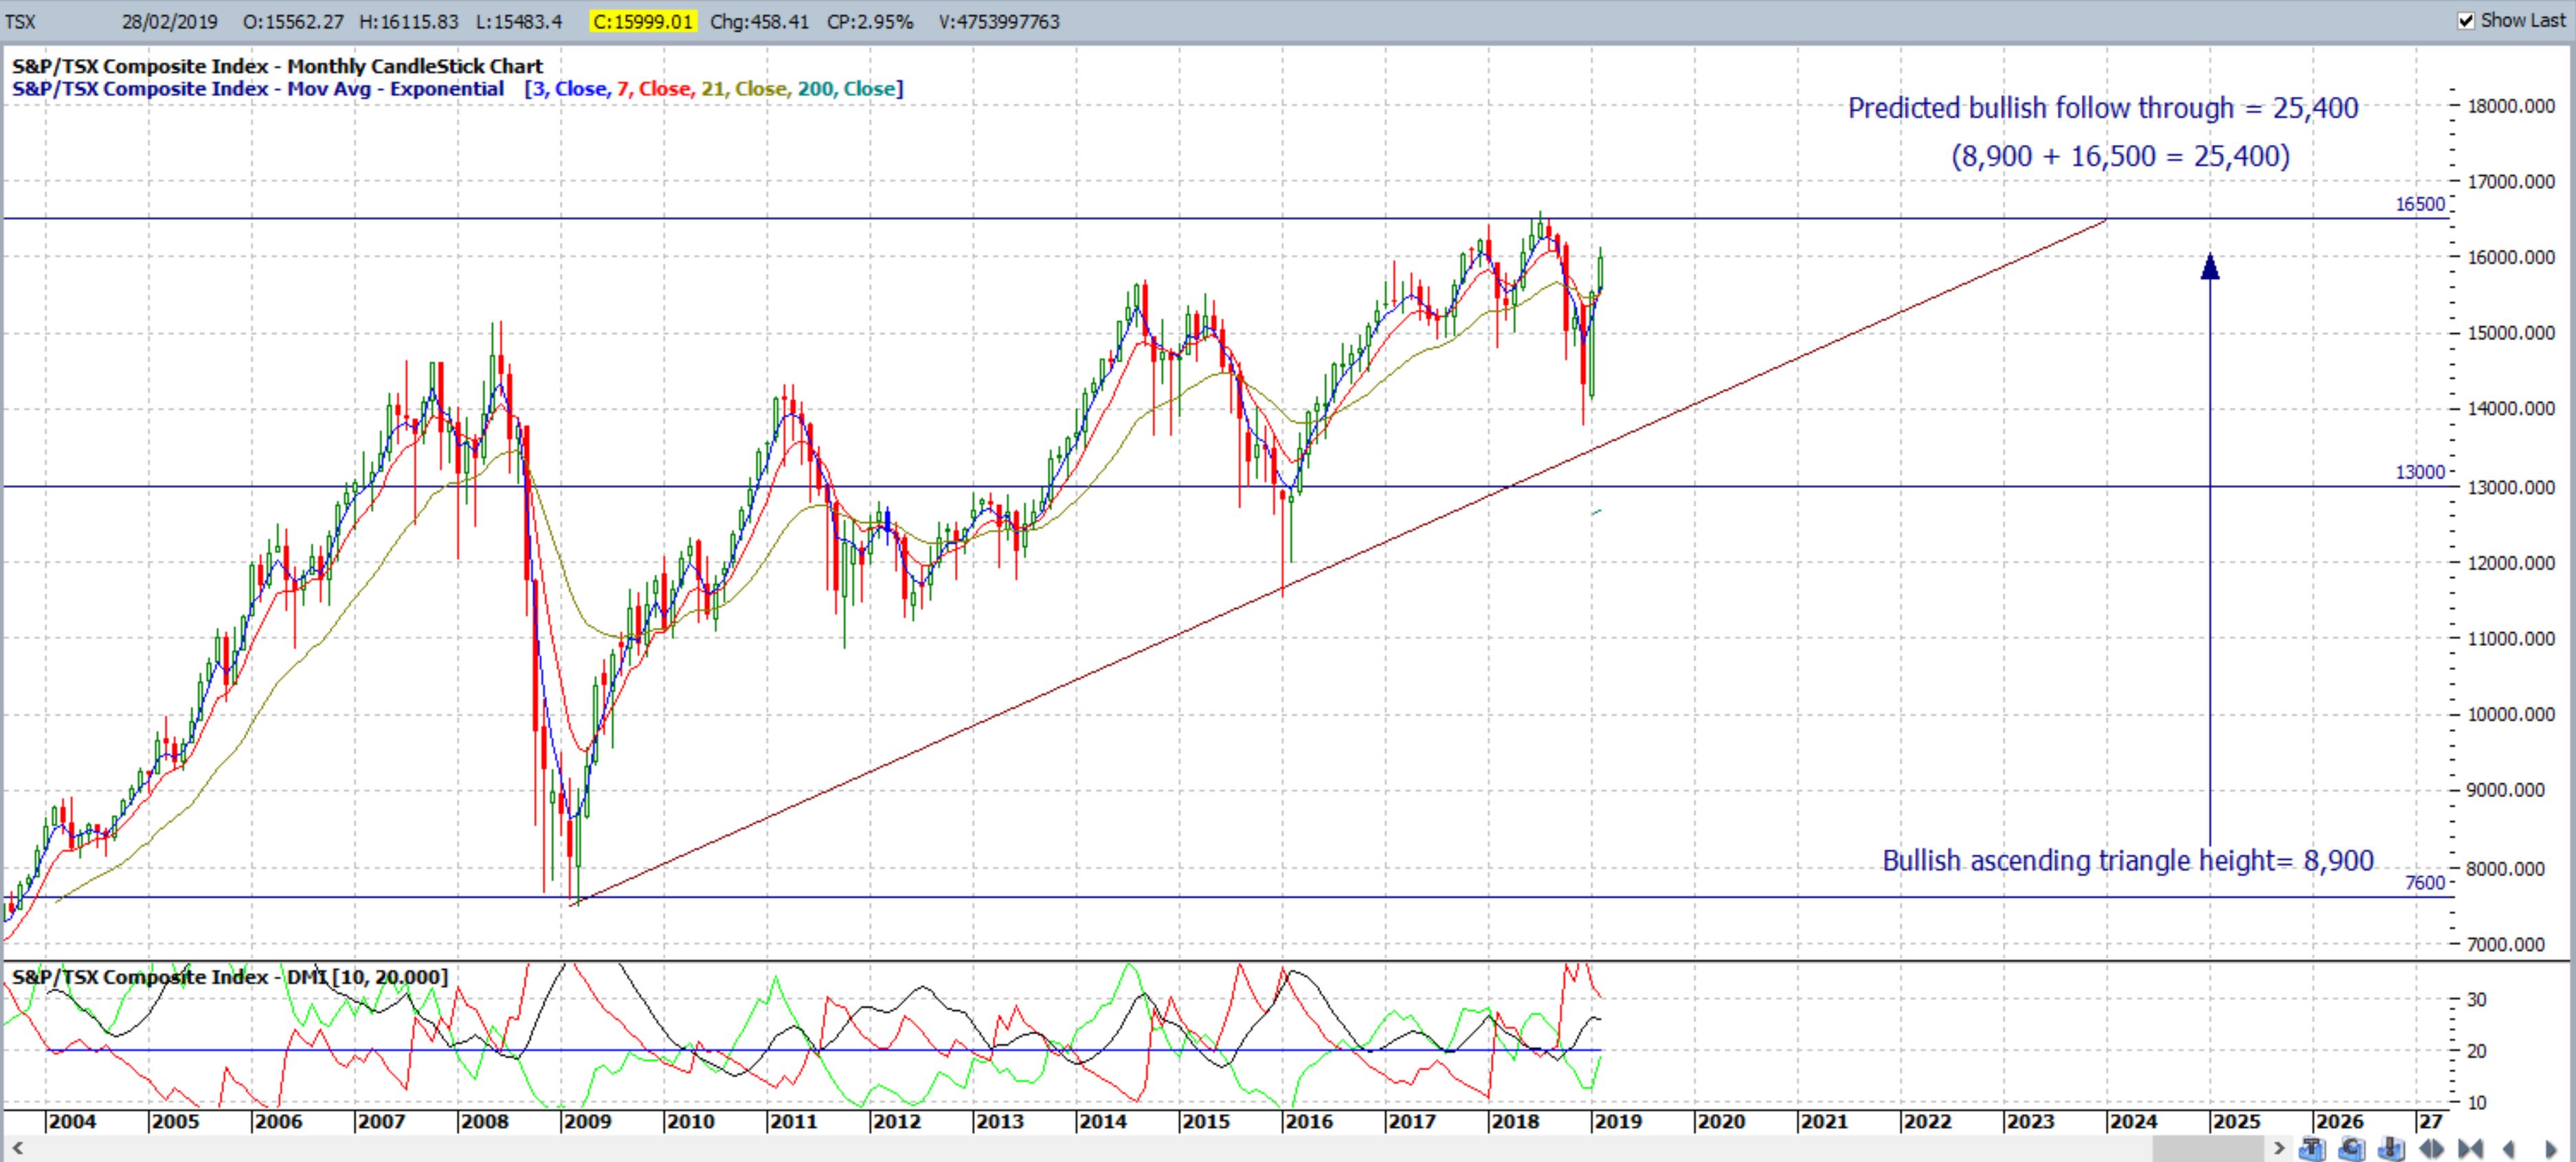
Any breakdown of the ascending triangle support trend line would bring the monthly 61.8% Fibonacci level, near previous S/R at 11,000, into some greater focus.
Summary: all of the indices highlighted in this post printed bullish candles for February. Several indices are setting up within potential bullish ascending triangle breakout patterns and these include the S&P500, DJIA, Russell-2000, ASX-200, Germany’s DAX and Canada’s TSX index. The NASDAQ is still progressing on its ascending triangle bullish breakout that triggered back in 2016 and has yet to complete. It is worth noting that whilst these new ascending triangles have ambitious targets, much the same was thought when I first posted similar patterns some years ago for the S&P500, DJIA and DAX; all of which subsequently completed. Traders need to keep an open mind and watch for momentum-based trend line breakouts; even on the monthly scale.
 by Mary McNamara
Source: tradecharting.com