I’d seen mention of a potential ‘June Swoon’ but I’m hoping overnight price action undermines such a phenomenon. There have been some great trend line breakout trades as the US$ weakened but, even still, the US$ index is hanging on to a recent support level. A break of this could trigger many new moves so keep an eye on how the US$ moves from here, the trend lines on your charts and, especially on Gold! PS: It’s Winter down here where I am.
Data today: watch for AUD Private Capital Expenditure data, CNY Caixin Manufacturing PMI, JPY Manufacturing PMI, lots of EUR PMIs, GBP Manufacturing PMI and USD ADP NFP.
USDX weekly: watch for any break of Cloud support.

Trend line breakout trades: there have been a lot of great breakout trade opportunities today and I know of at least one TC Trial participant who caught the Oil move. I cannot urge strongly enough, the most reliable signals come when TC triggers with, or near, a tend line breakout so stalk those instruments!
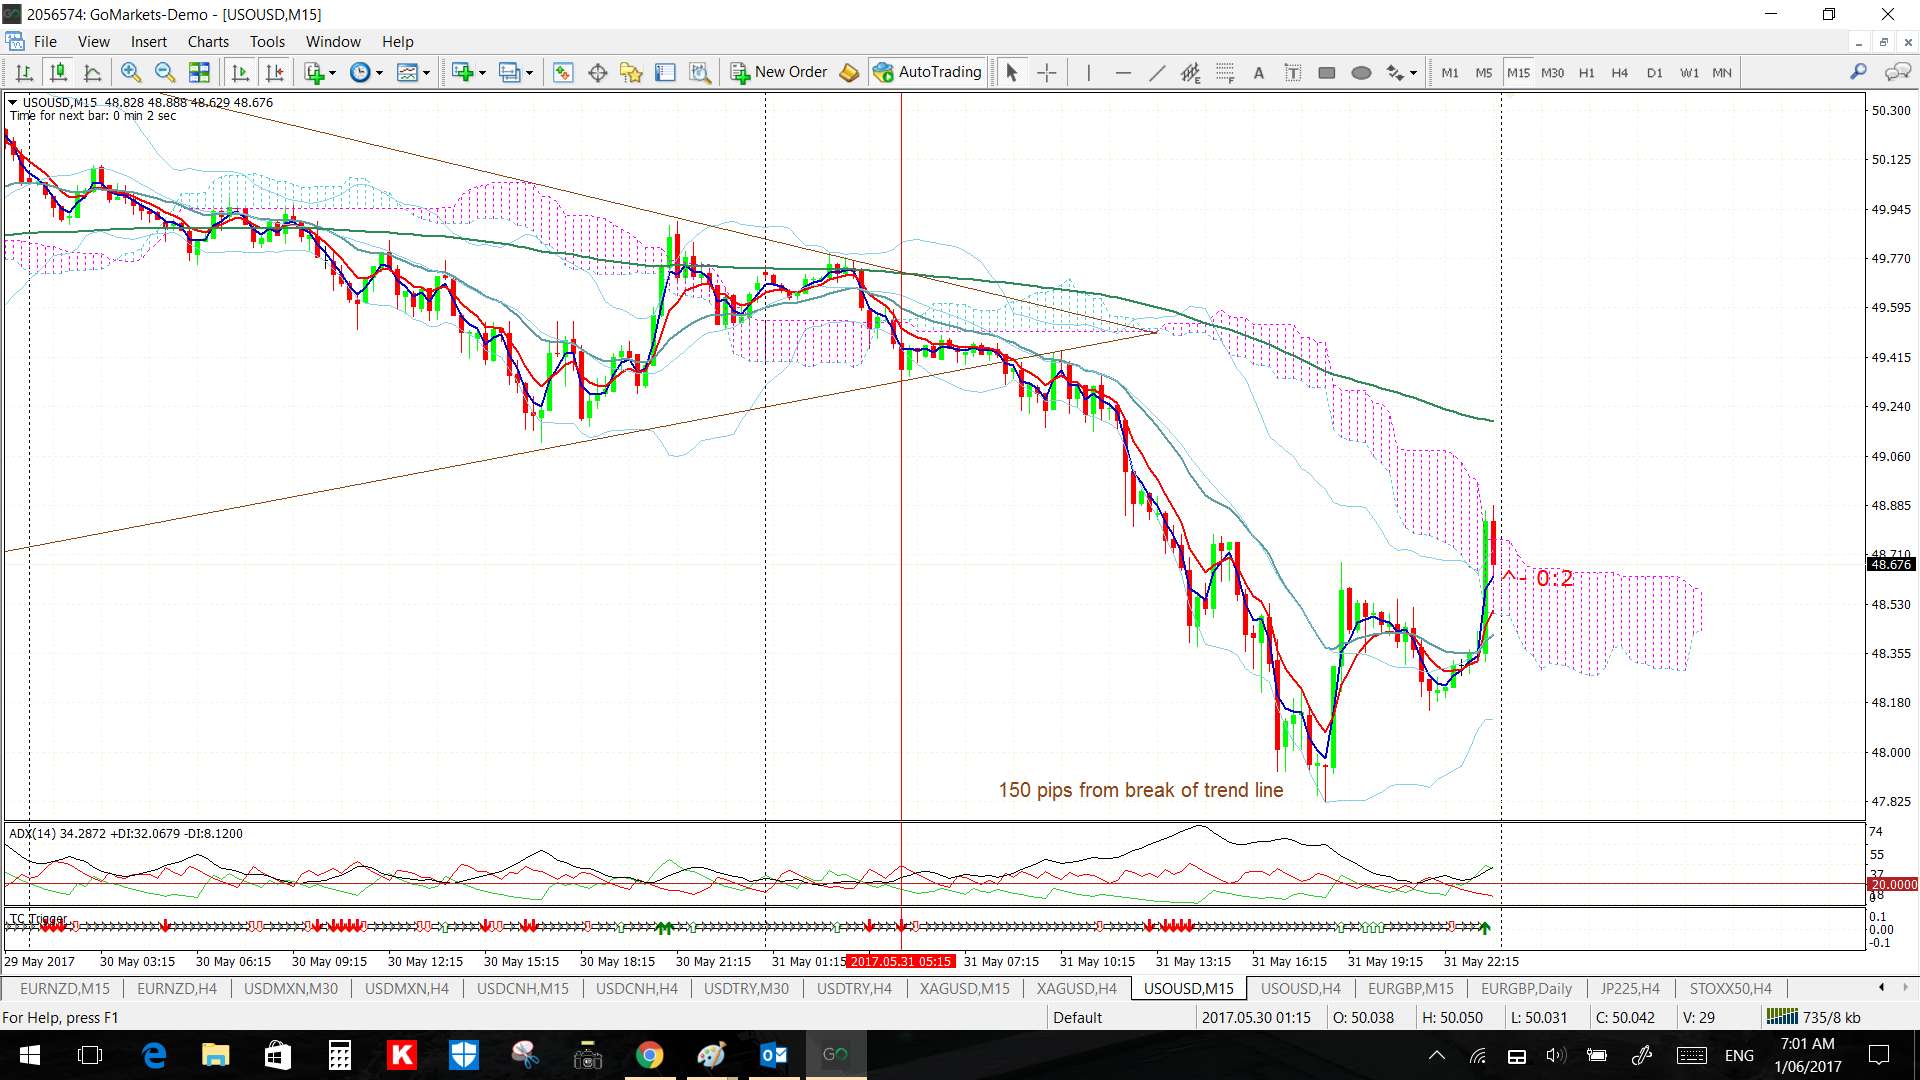
Oil: this breakout move gave up to 150 pips and was one of the better ones on the day. The 4hr chart from yesterday showed a great triangle as reproduced here:
Oil 4hr: from yesterday’s post:
This is the 4hr chart today showing a great breakout move:

Oil 15 min: a new TC SHORT triggered just before the trend line break and even waiting for a break of said TL still offered a move worth 150 pips.
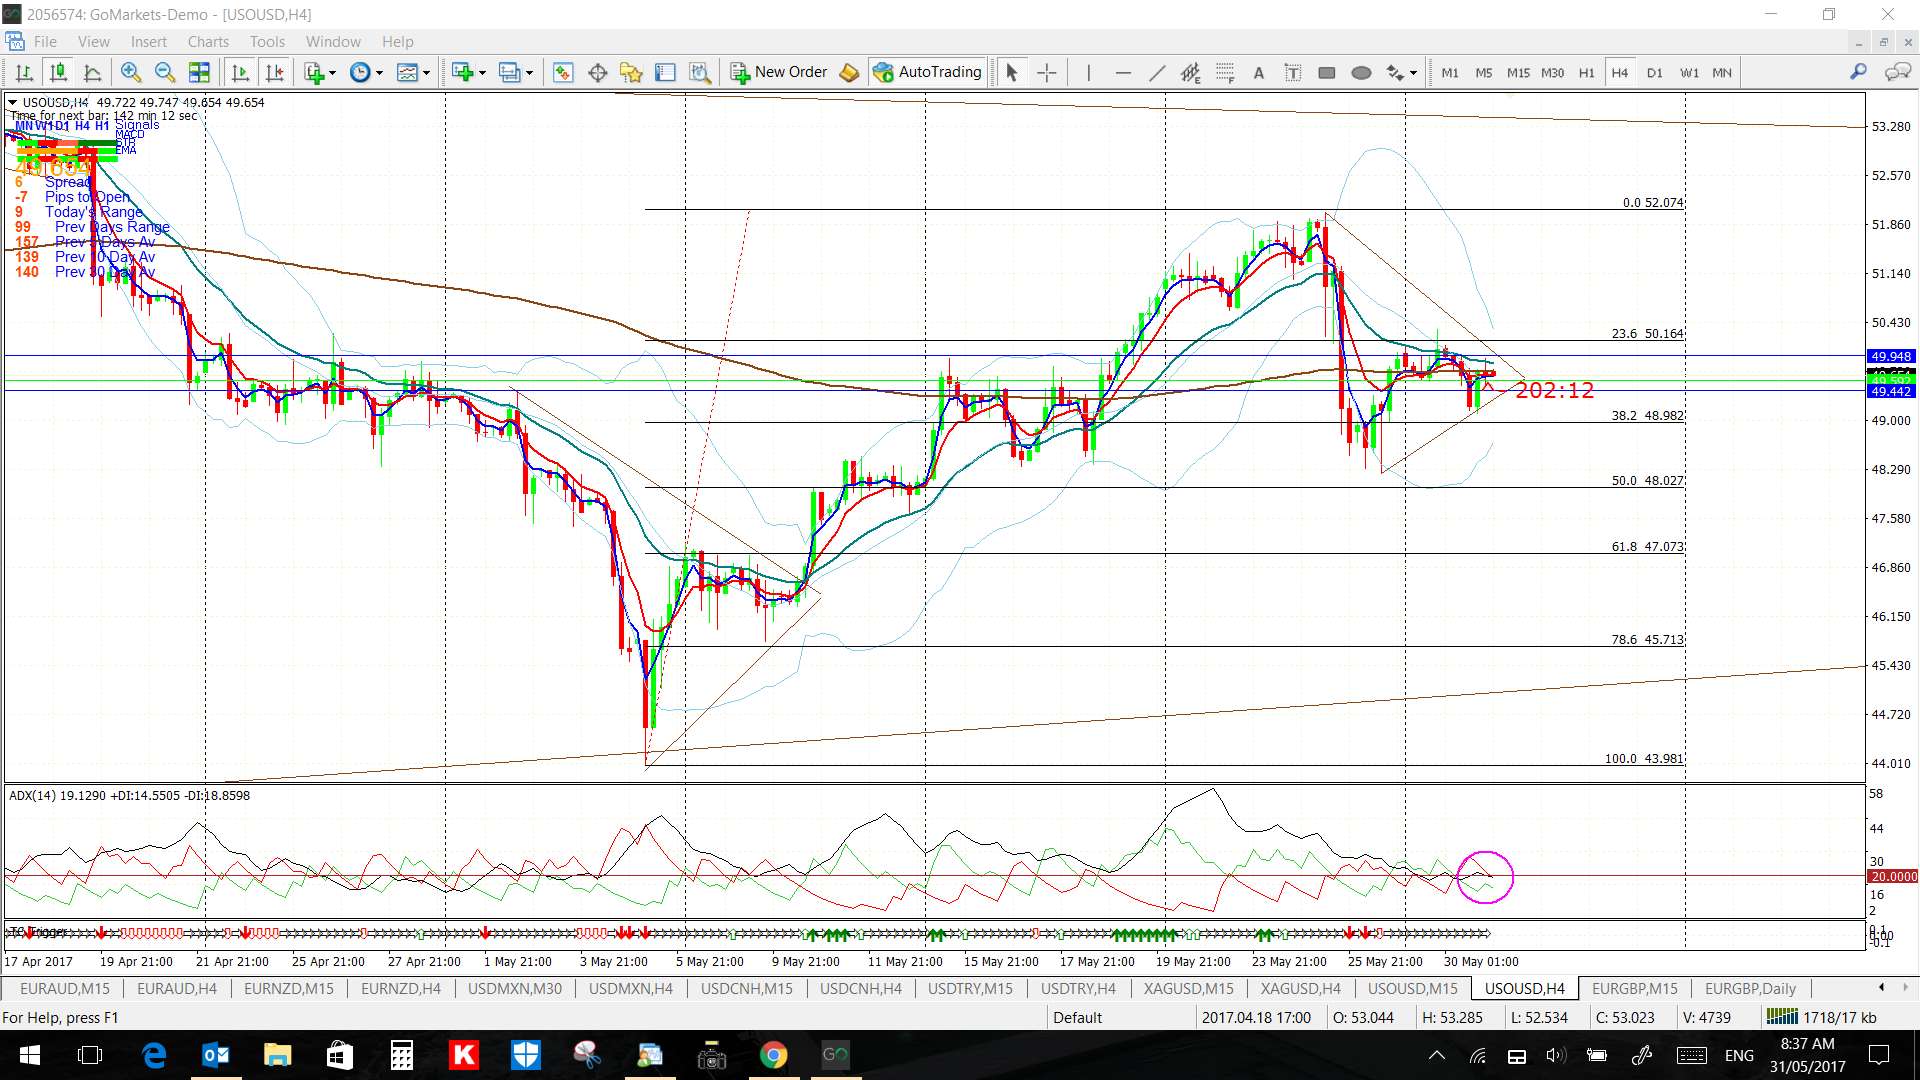
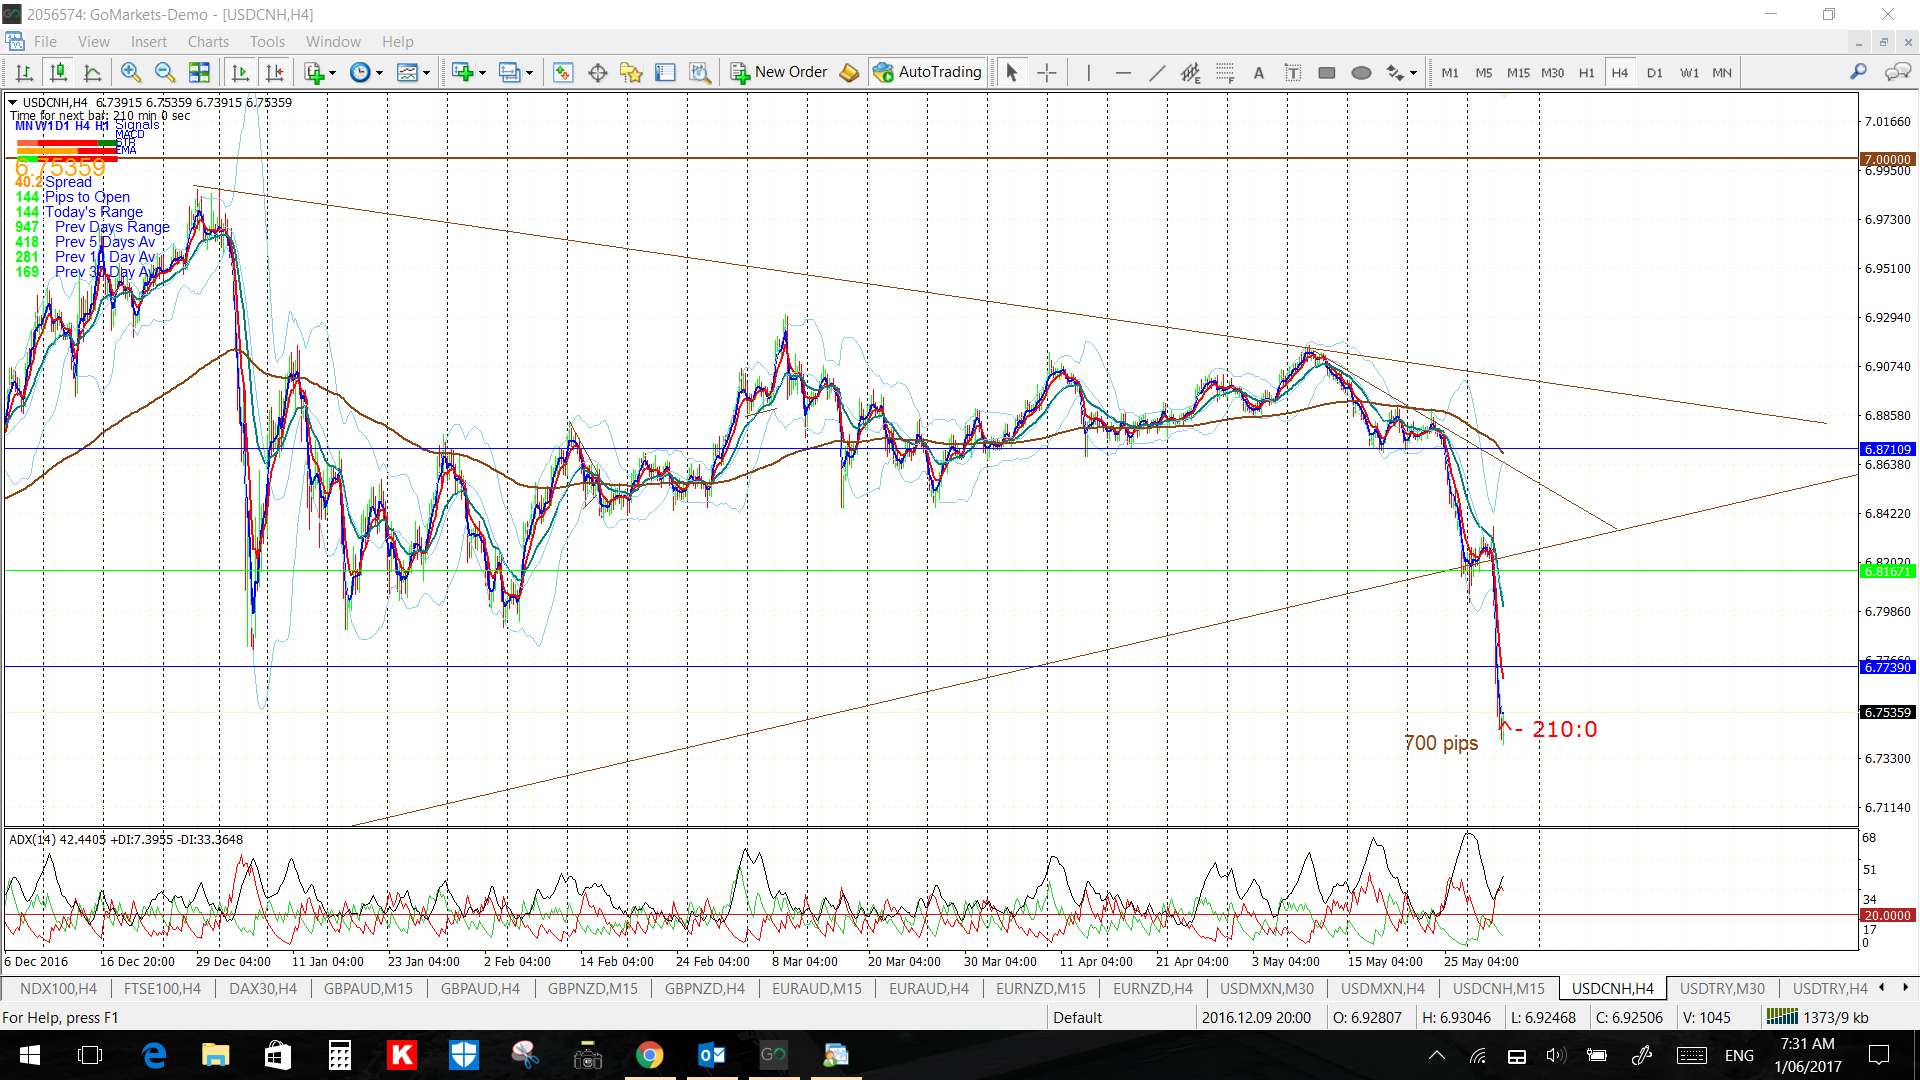
USD/CNH: what a breakout! This was the 4hr chart from yesterday:
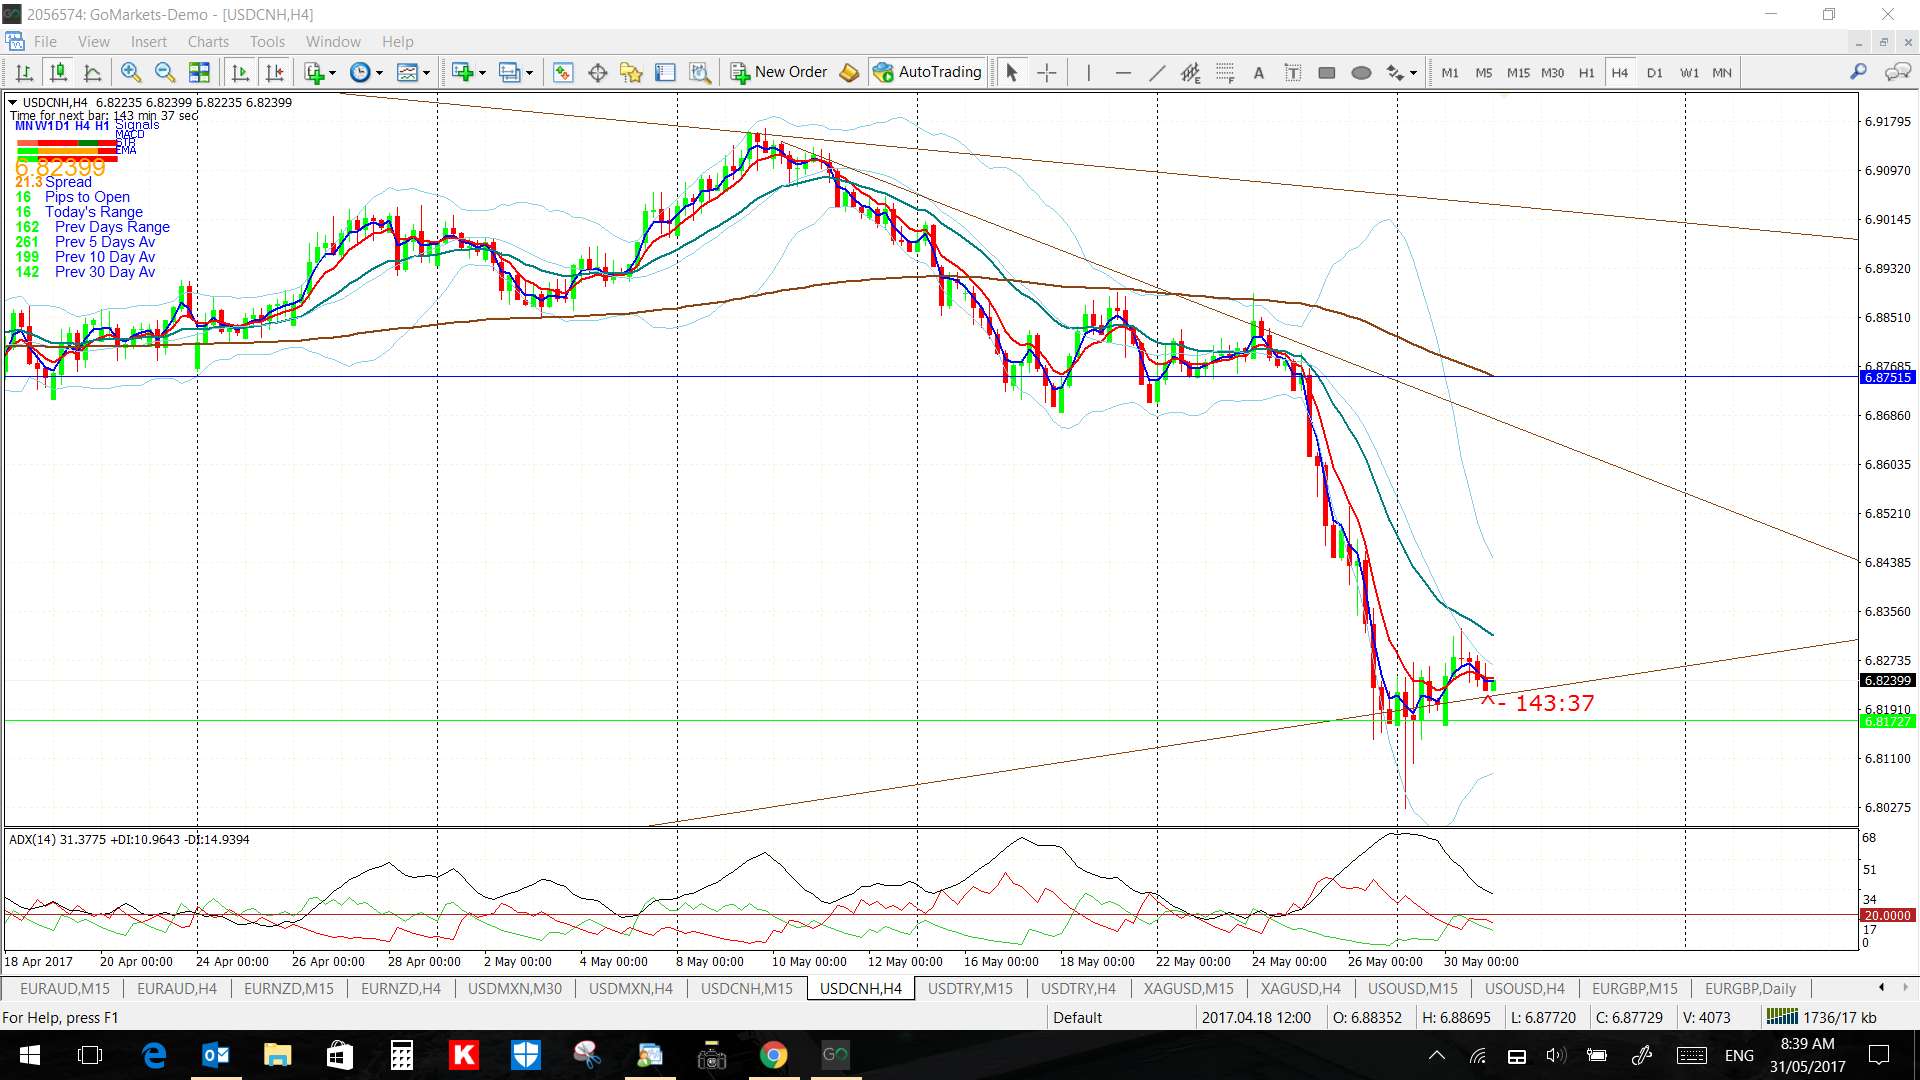
This is the 4hr chart today after a massive 700 pip breakout move:
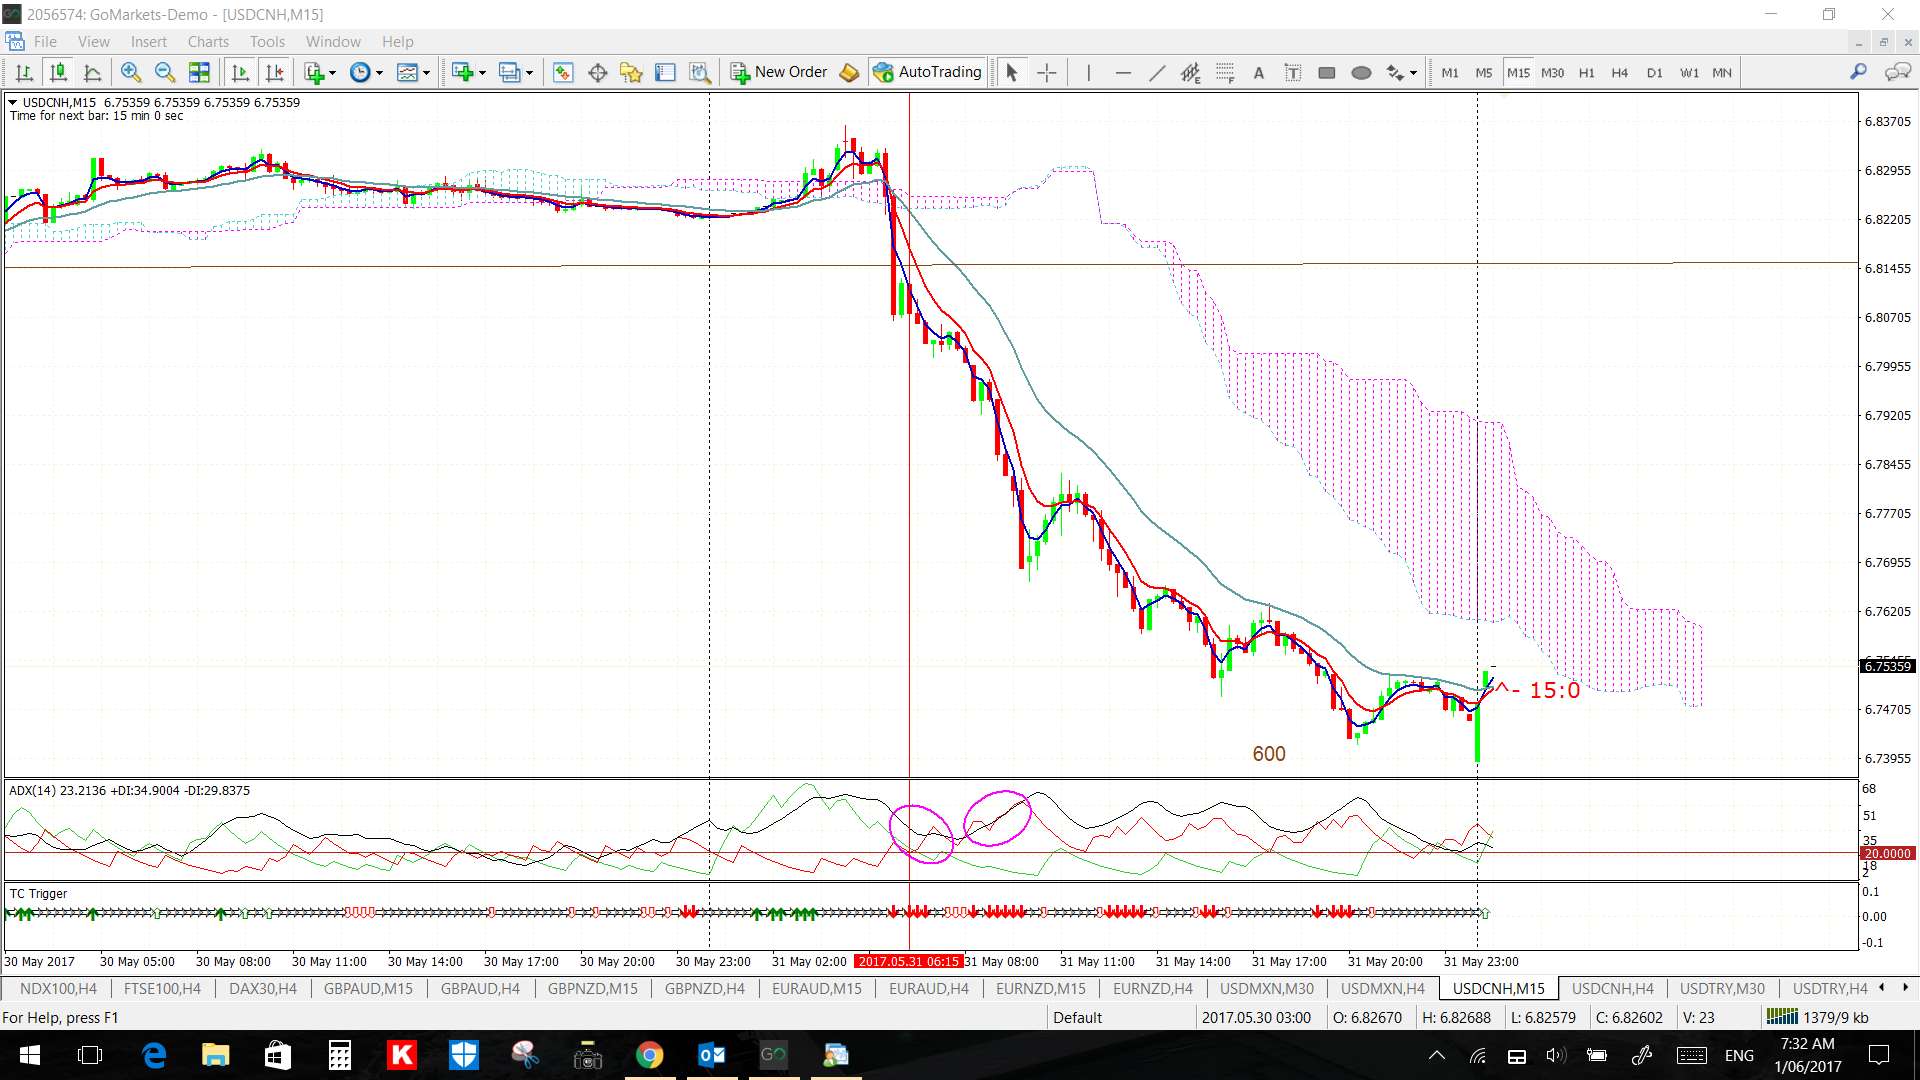
USD/CNH 15 min: the TC signal was not valid at first but, maybe, a subsequent shift to an up-trending ADX should be considered as sufficient?? Thoughts?
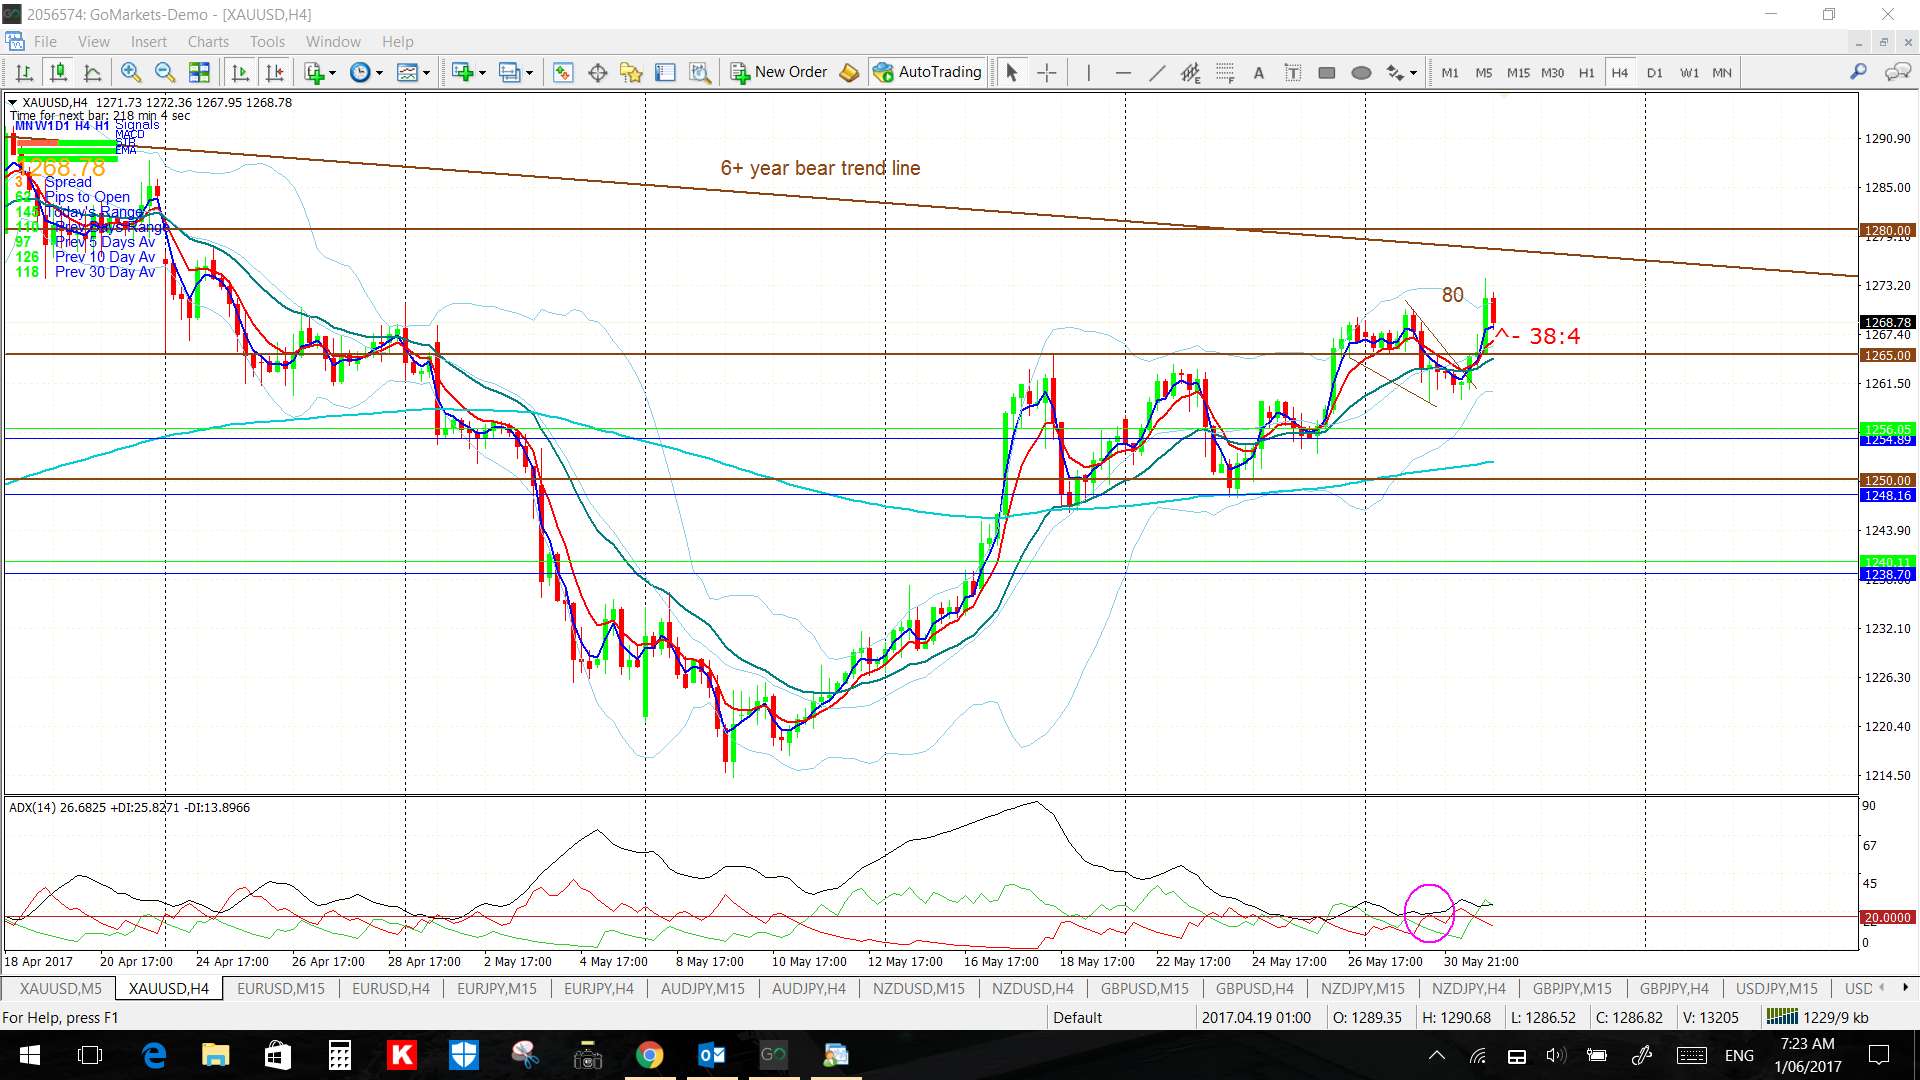
Gold: has given around 80 pips and note the break of $1,265 S/R. There is the major 6-year bear trend line just ahead of price action now and any breakdown on the US$ index would help to support Gold in a move up to this major zone!
Gold 4hr:
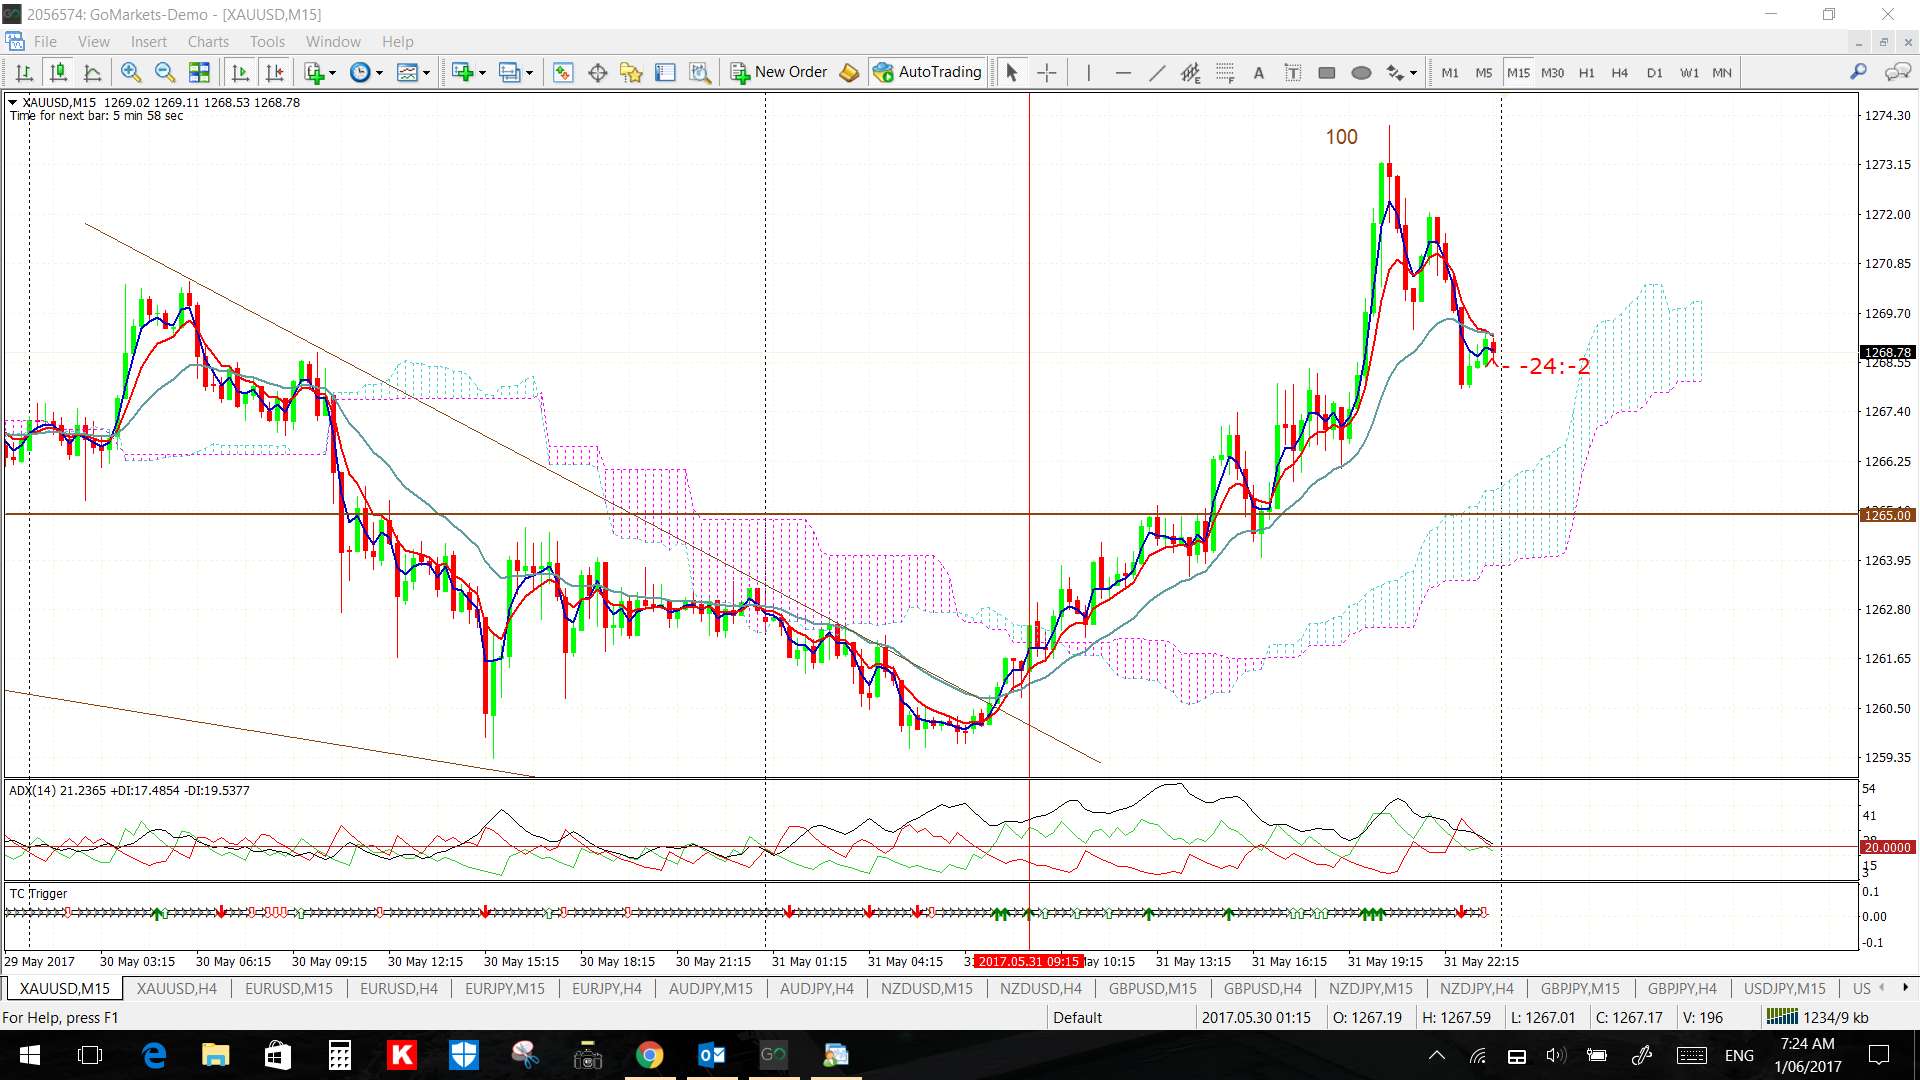
Gold 15 min: the signal candle closed right on the top of the Cloud so if that did not inspire confidence then a close above the $1,265 may have:
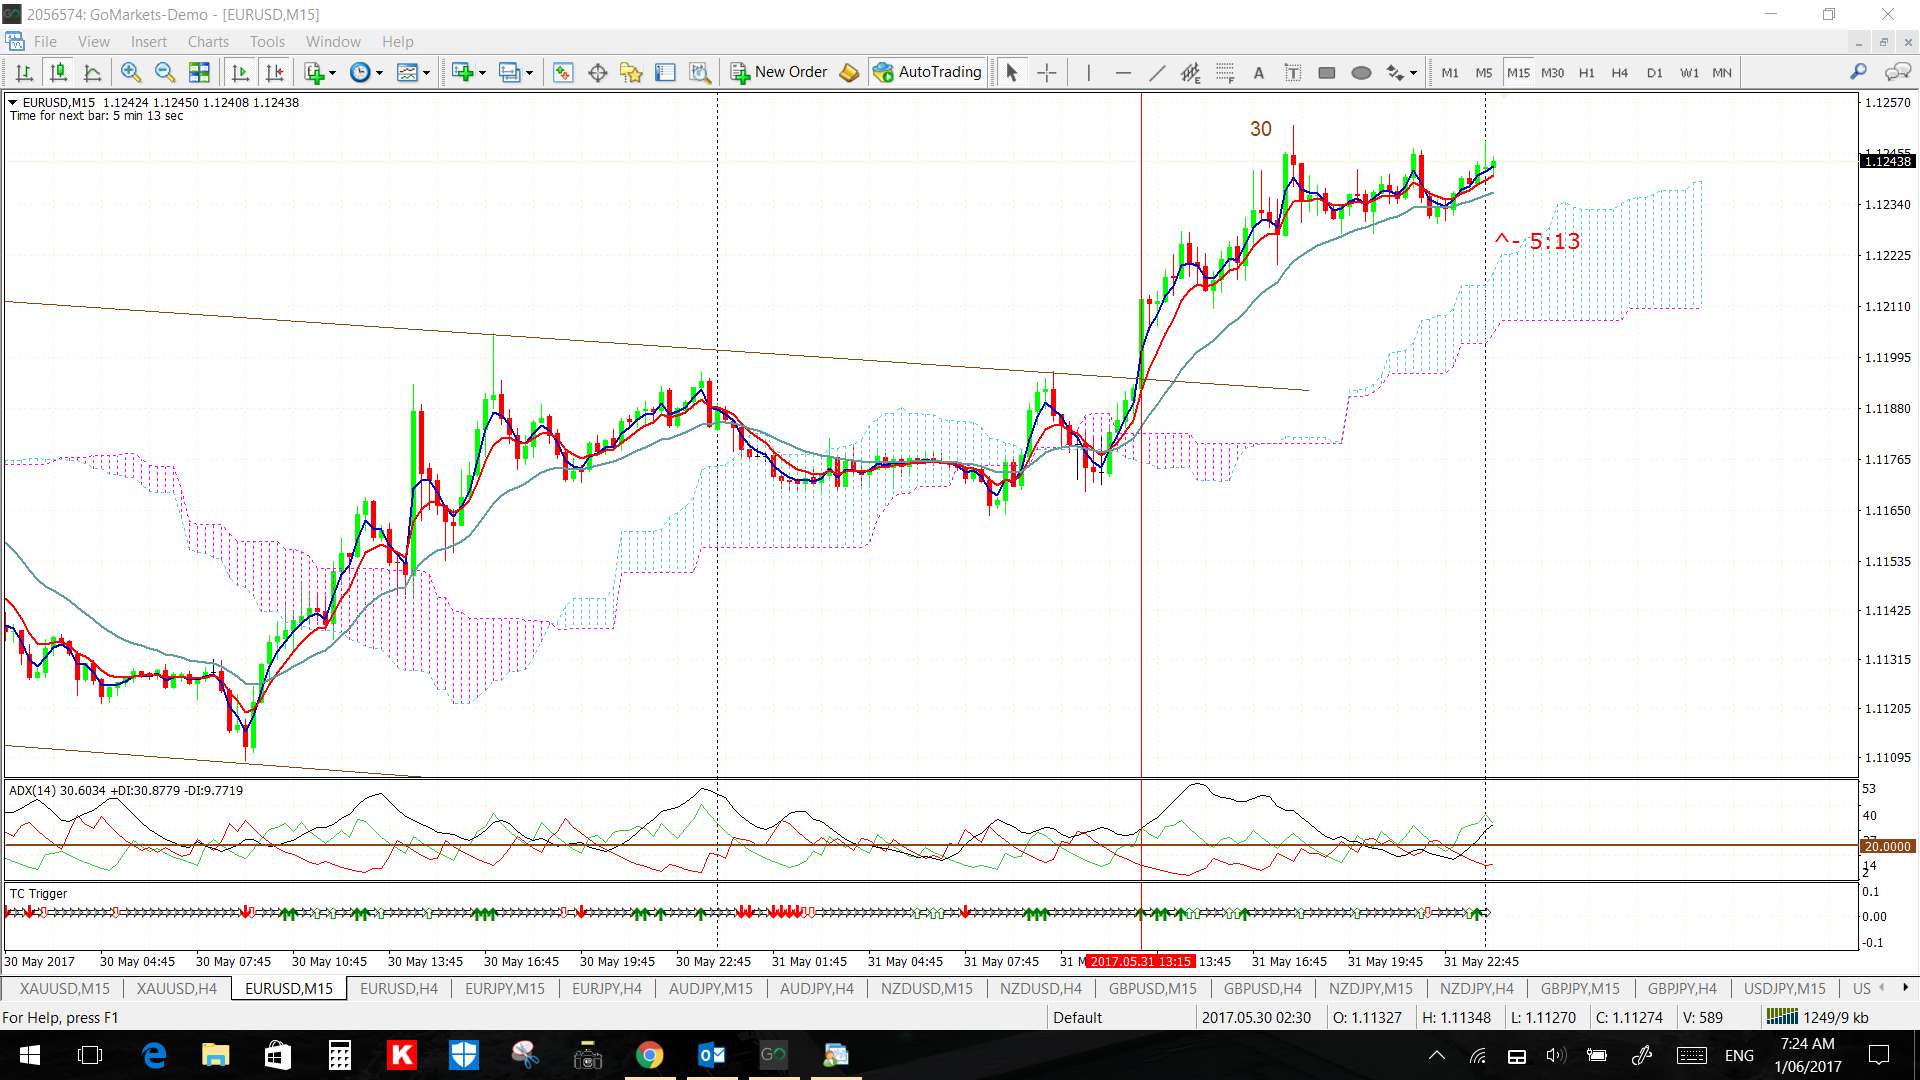
EUR/USD: a breakout, albeit a small one; just 35 pips with NFP looming:
E/U 4hr:

E/U 15 min: the move came with a new TC LONG though:
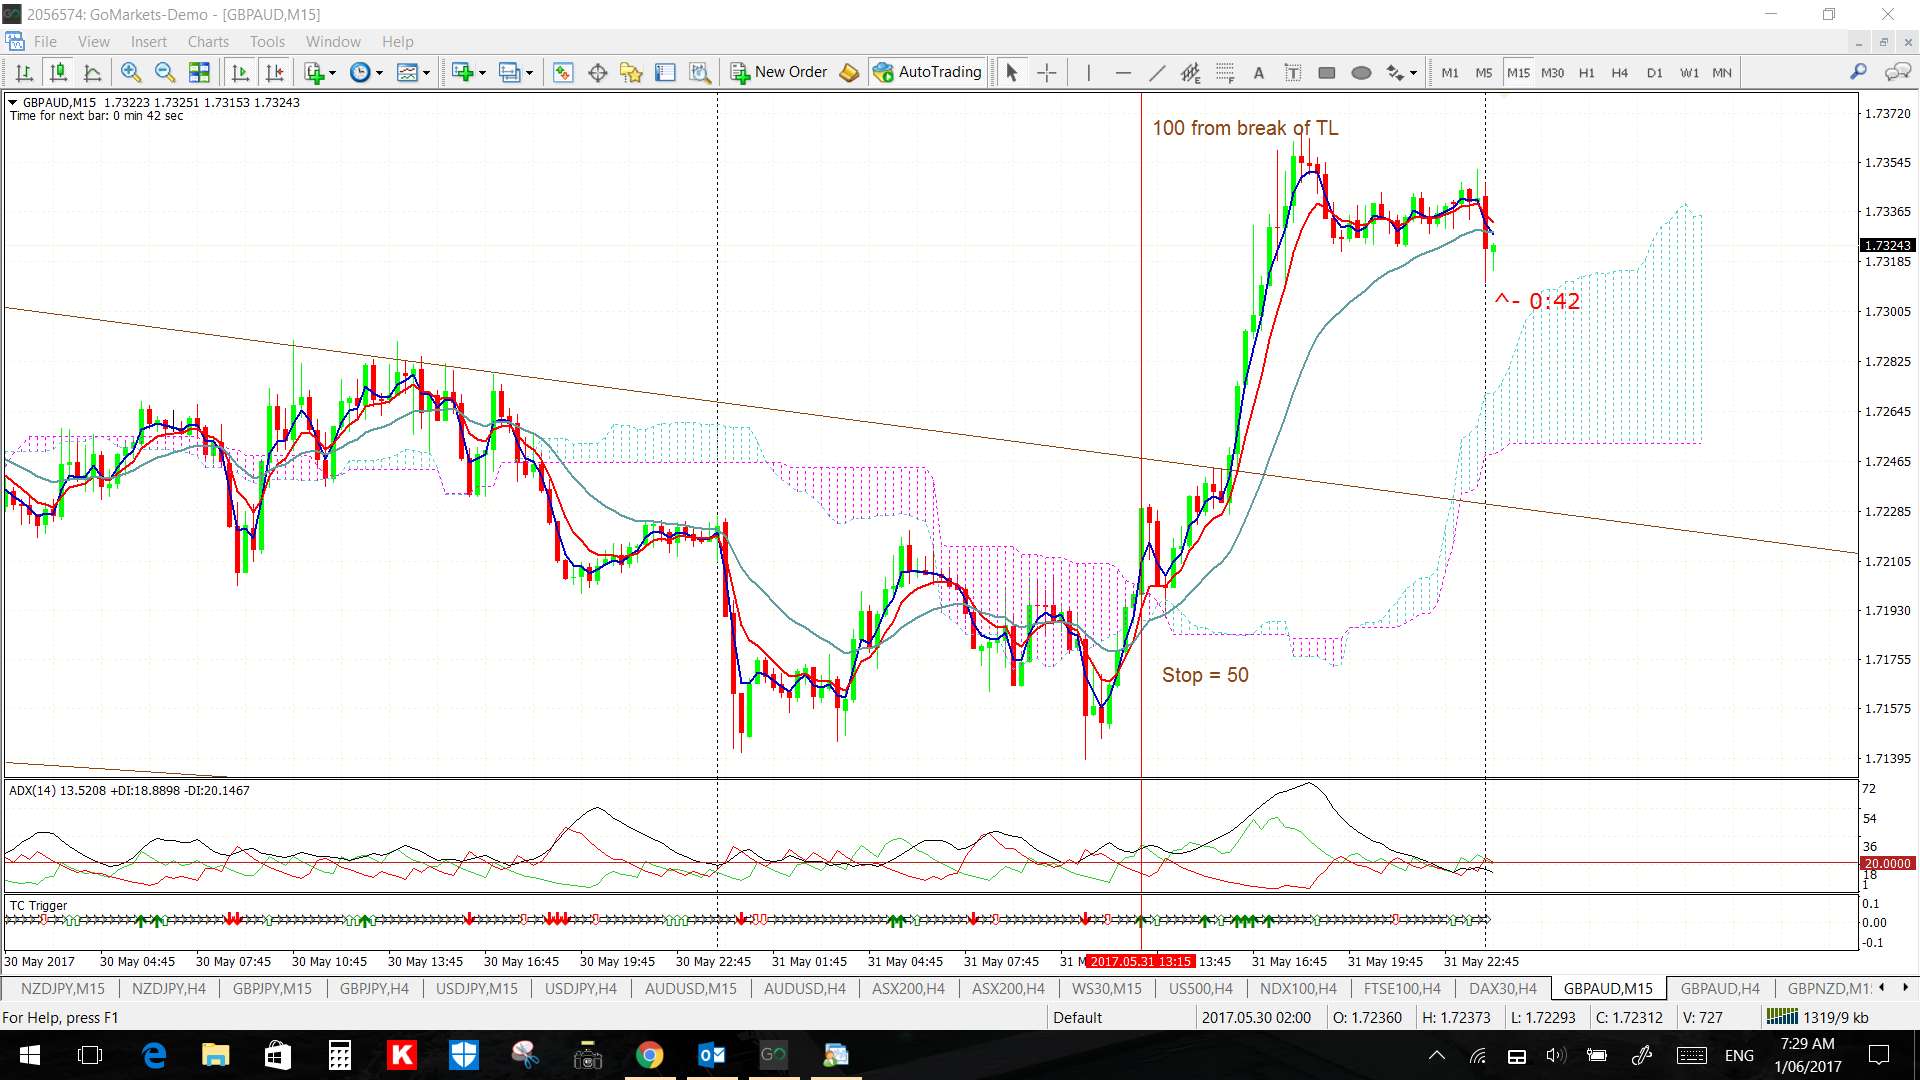
GBP/AUD: a breakout here for almost 100 pips.
G/A 4hr:

G/A 15 min: a new TC signal here too but waiting for a trend line break would have given more confidence. In that case, placing a Stop just the other side of the trend line would have worked:
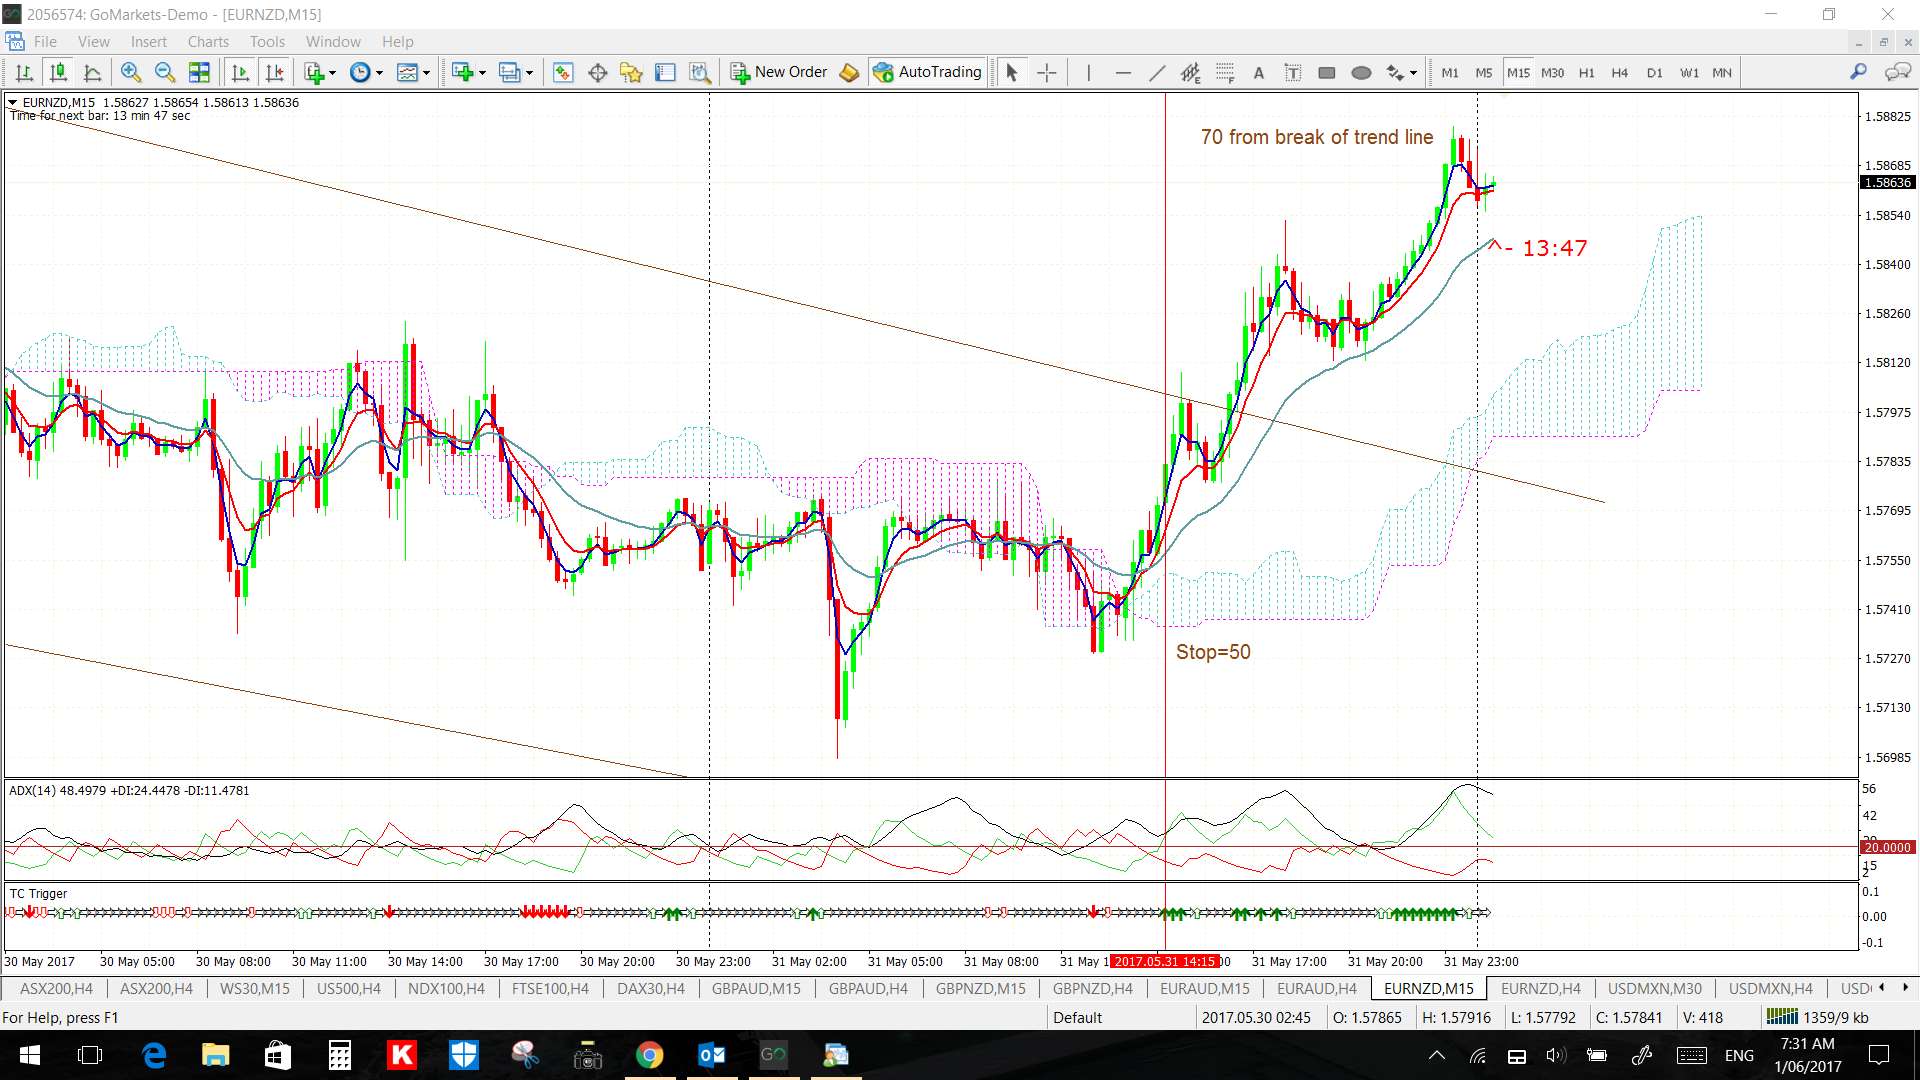
EUR/NZD: a breakout here for just 70 pips.
E/N 4hr:

E/N 15 min: much the same as with the G/A 15 min; wait for a TL break and put Stop just below this:
USD/MXN 4hr: this move peaked at 2,400. Note the revised trend lines here now:
USD/MXN 4hr:

USD/MXN 4hr: revised trend lines:

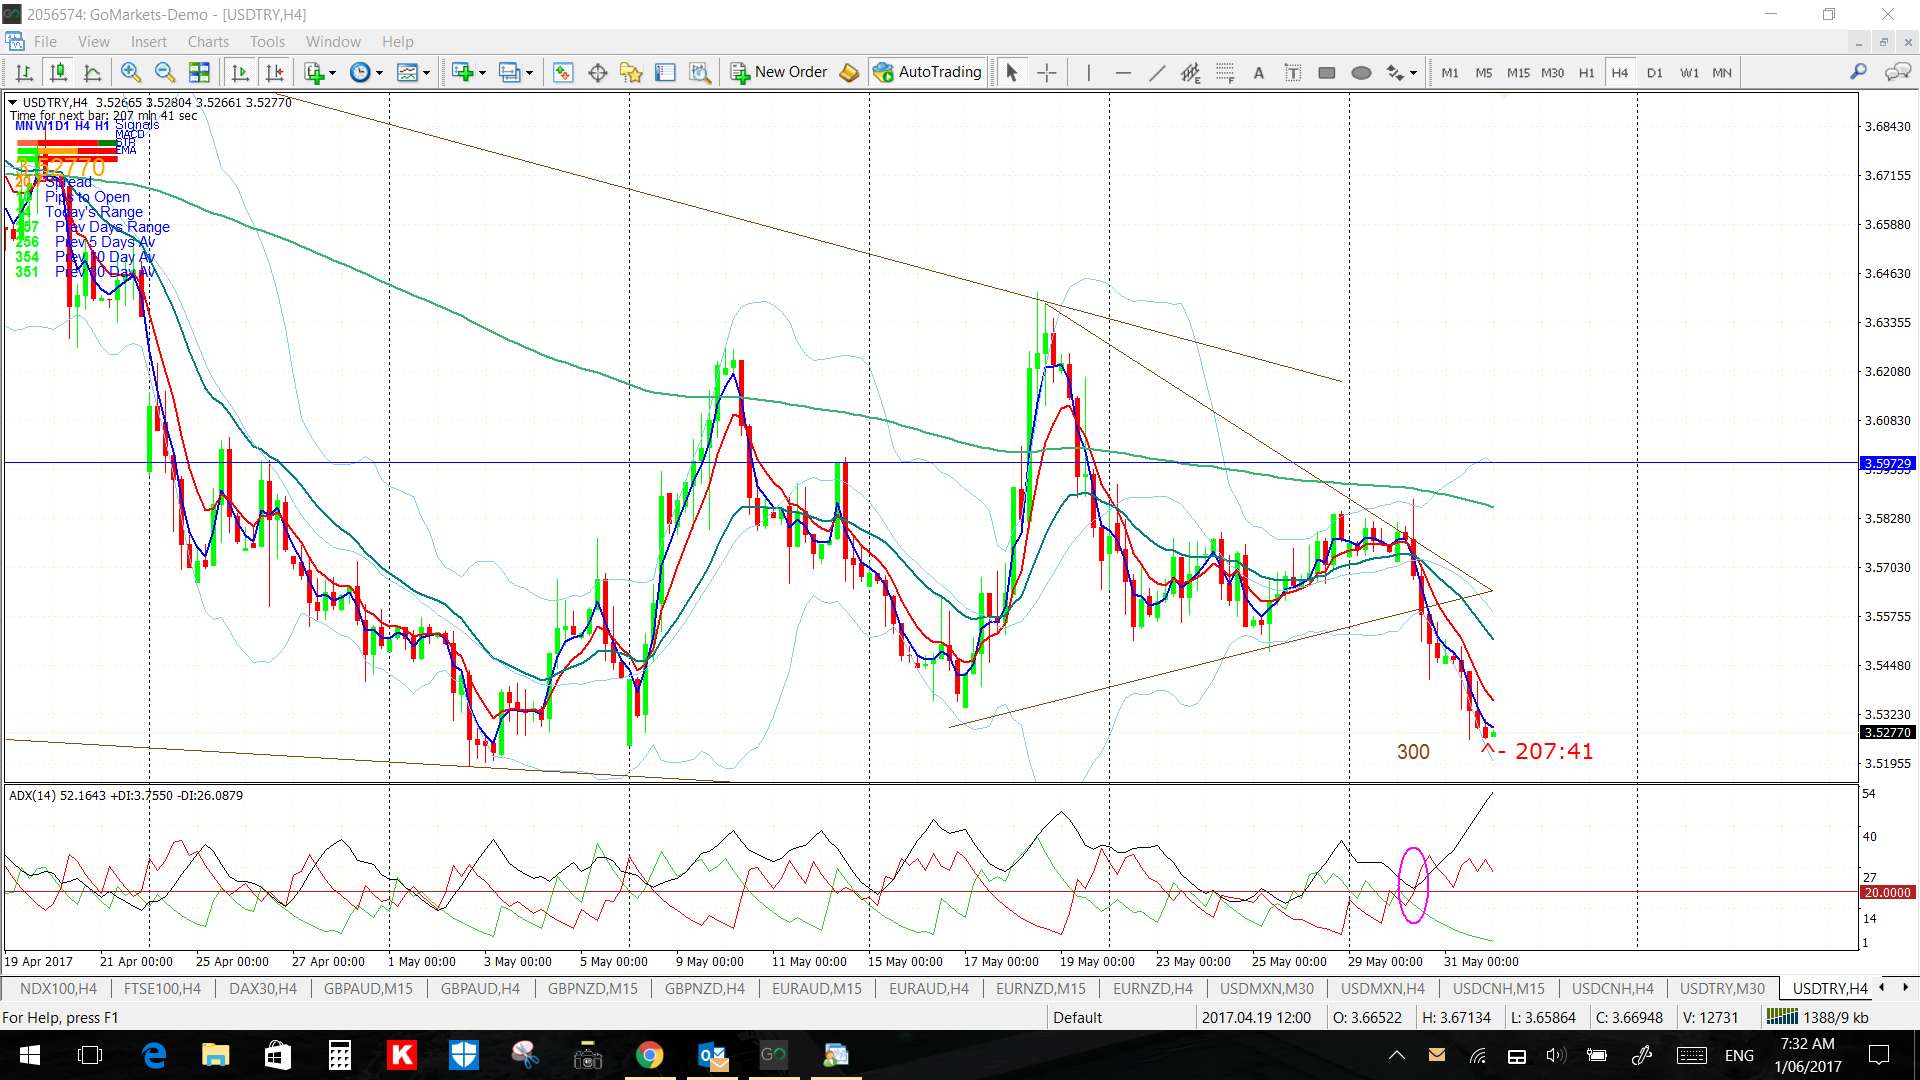
USD/TRY 4hr: this is now at 300 pips:
Other Forex:
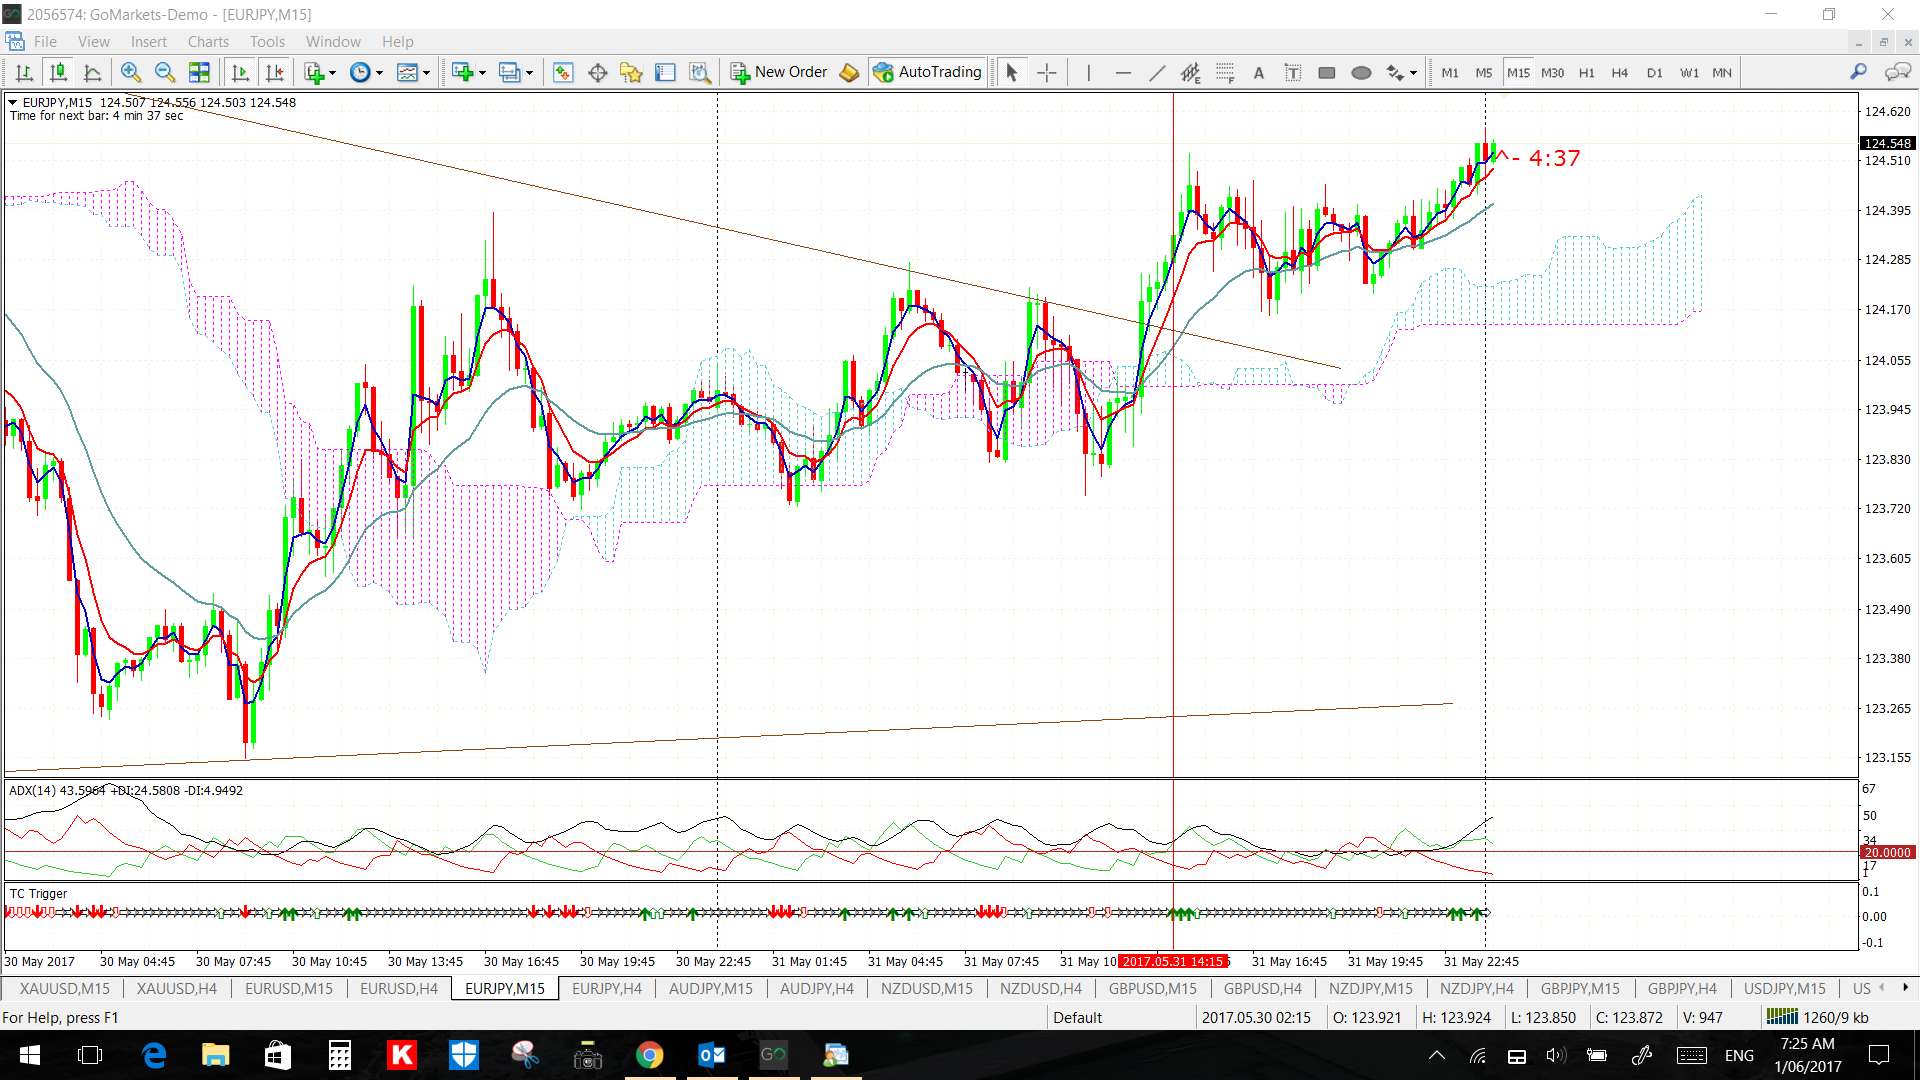
EUR/JPY: a breakout starting here? There has been a TC signal and breakout but it hasn’t moved far:
E/J 4hr

E/J 15 min:
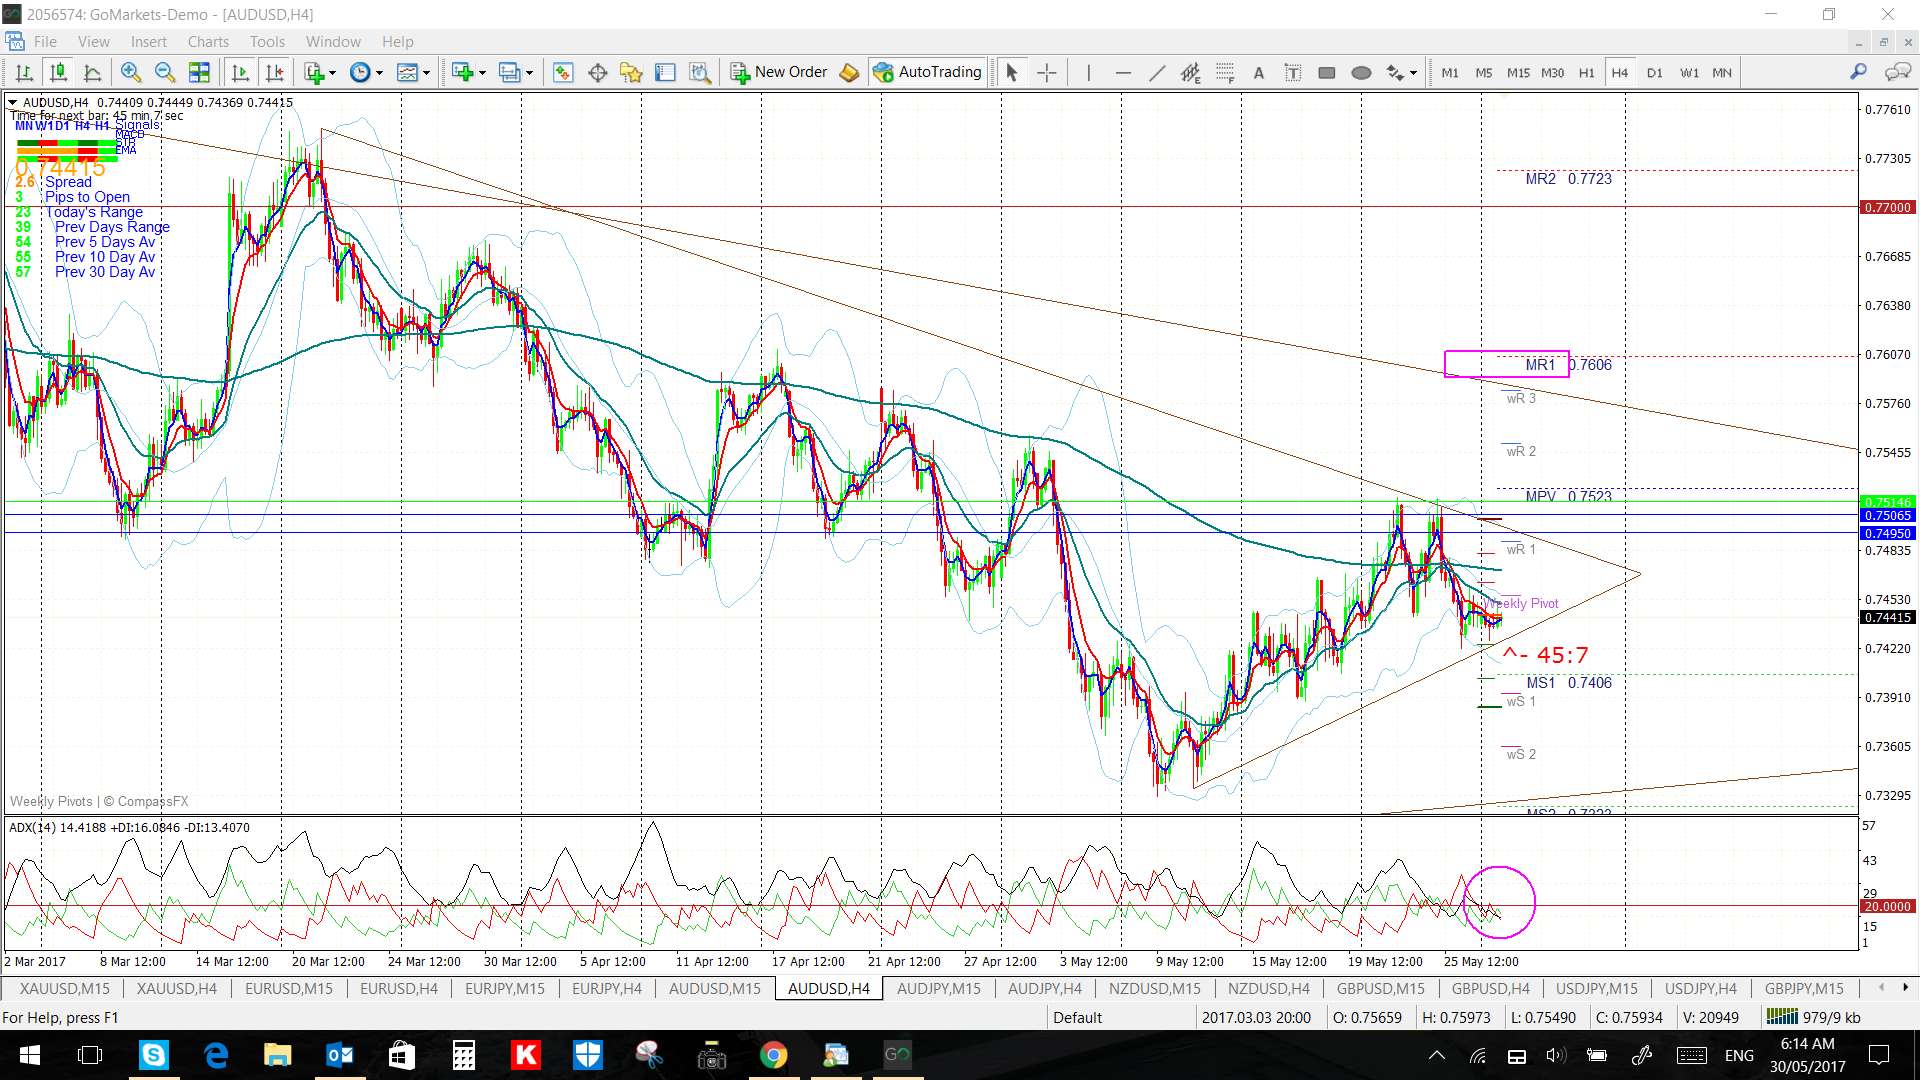
AUD/USD 4hr: watch with today’s AUD, JPY and CNY data:
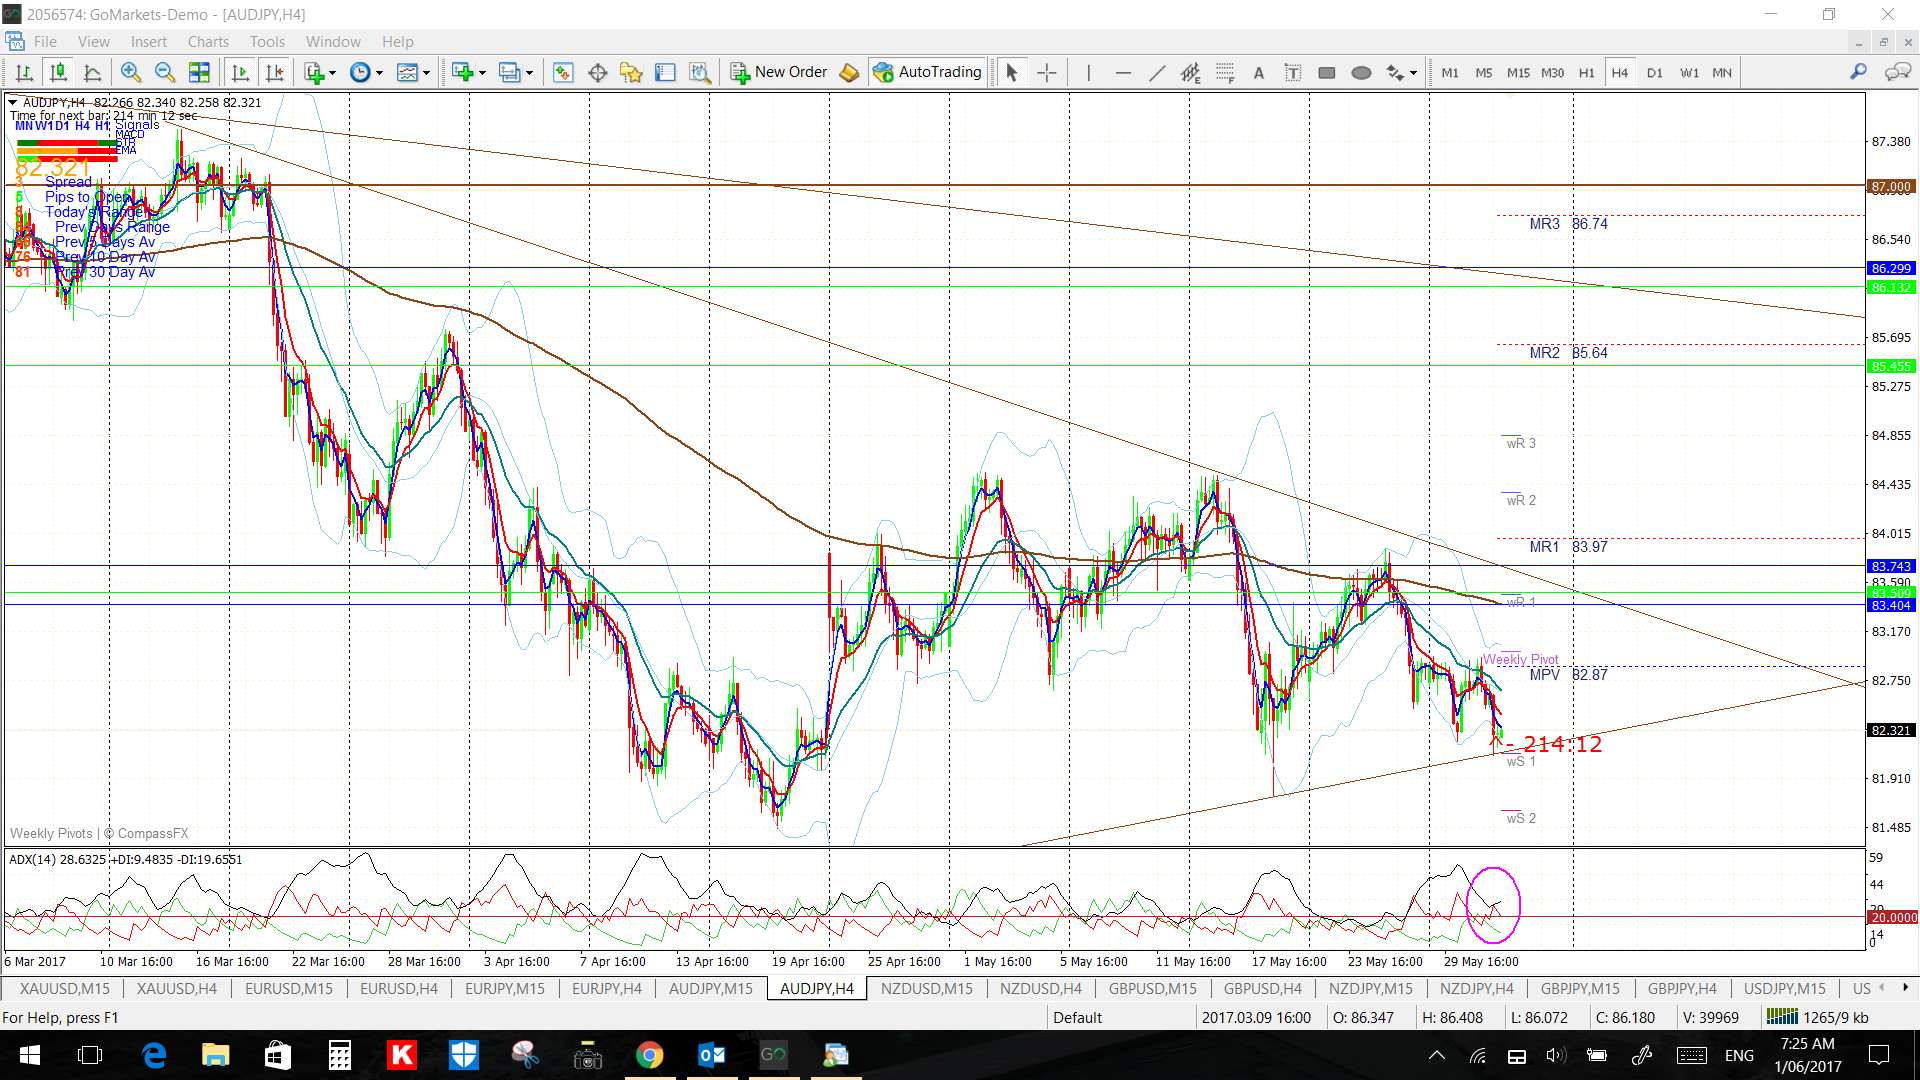
AUD/JPY 4hr: ditto:
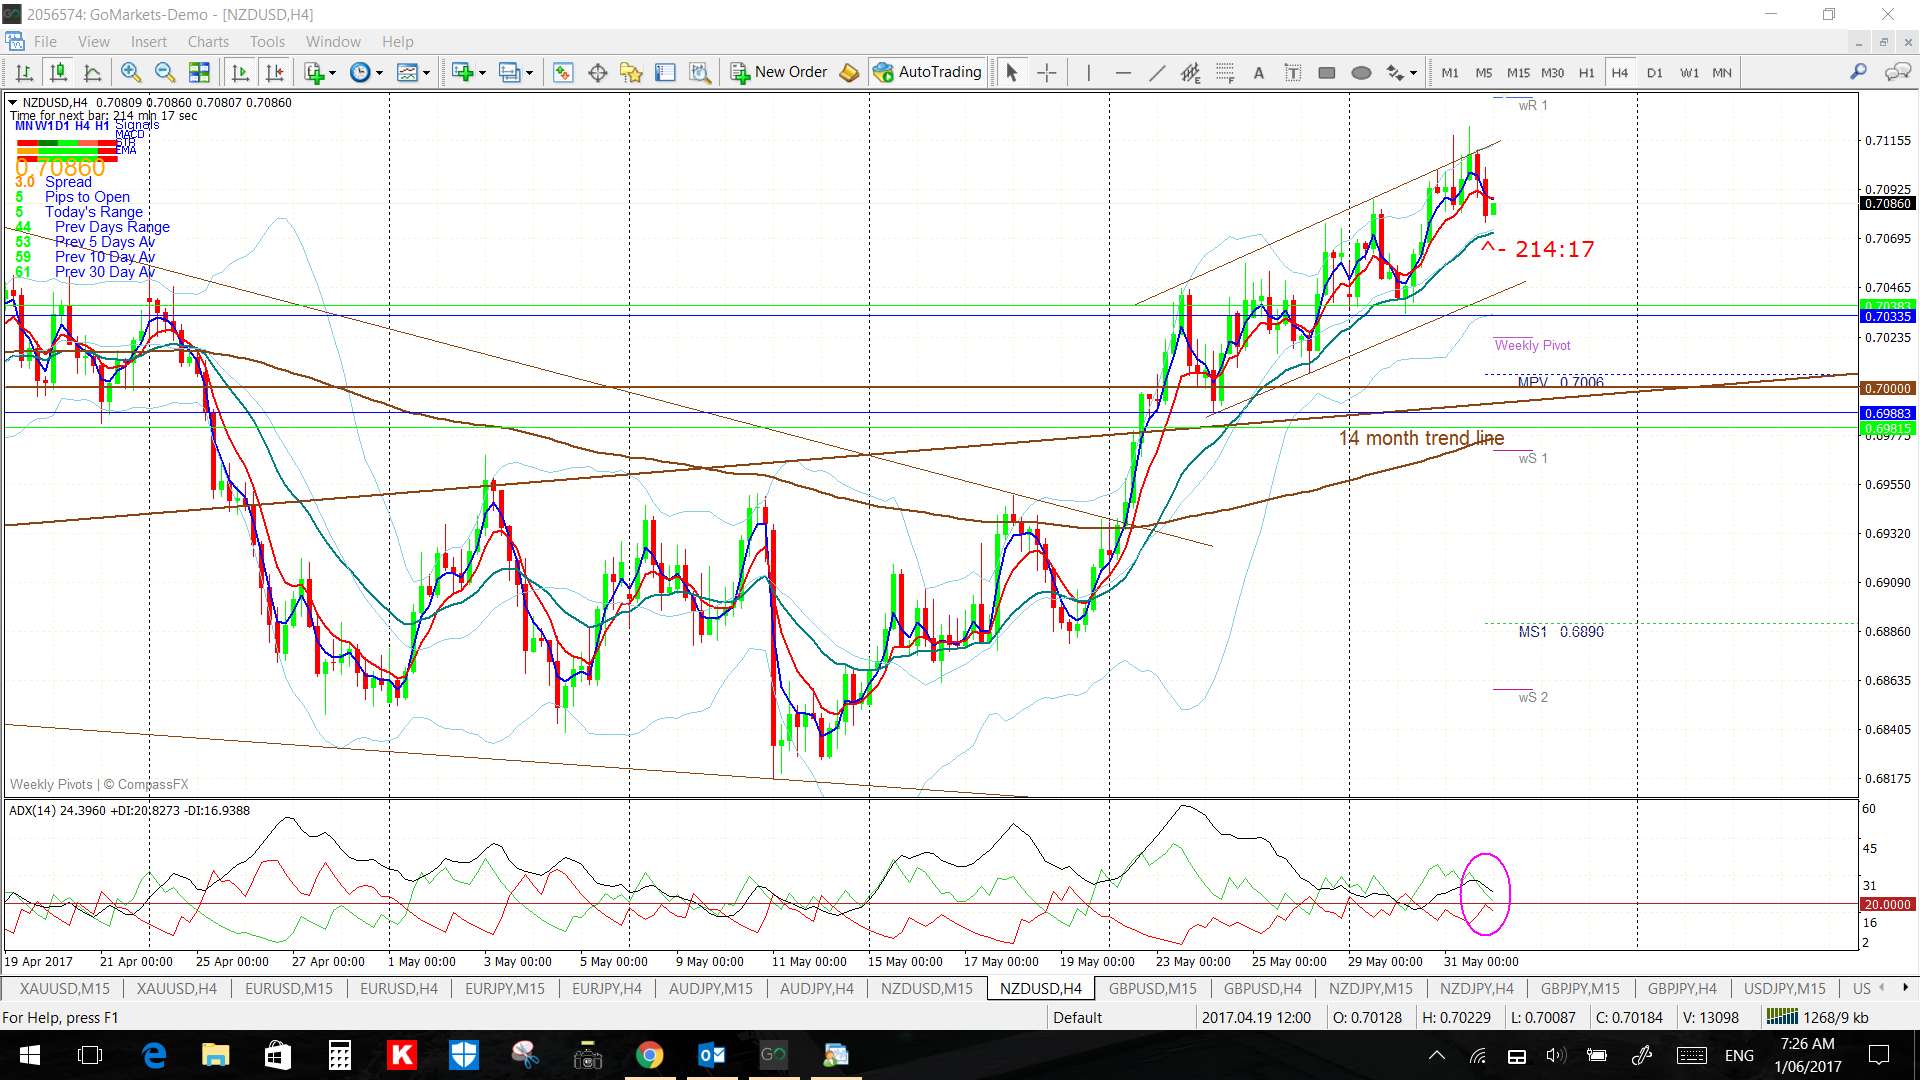
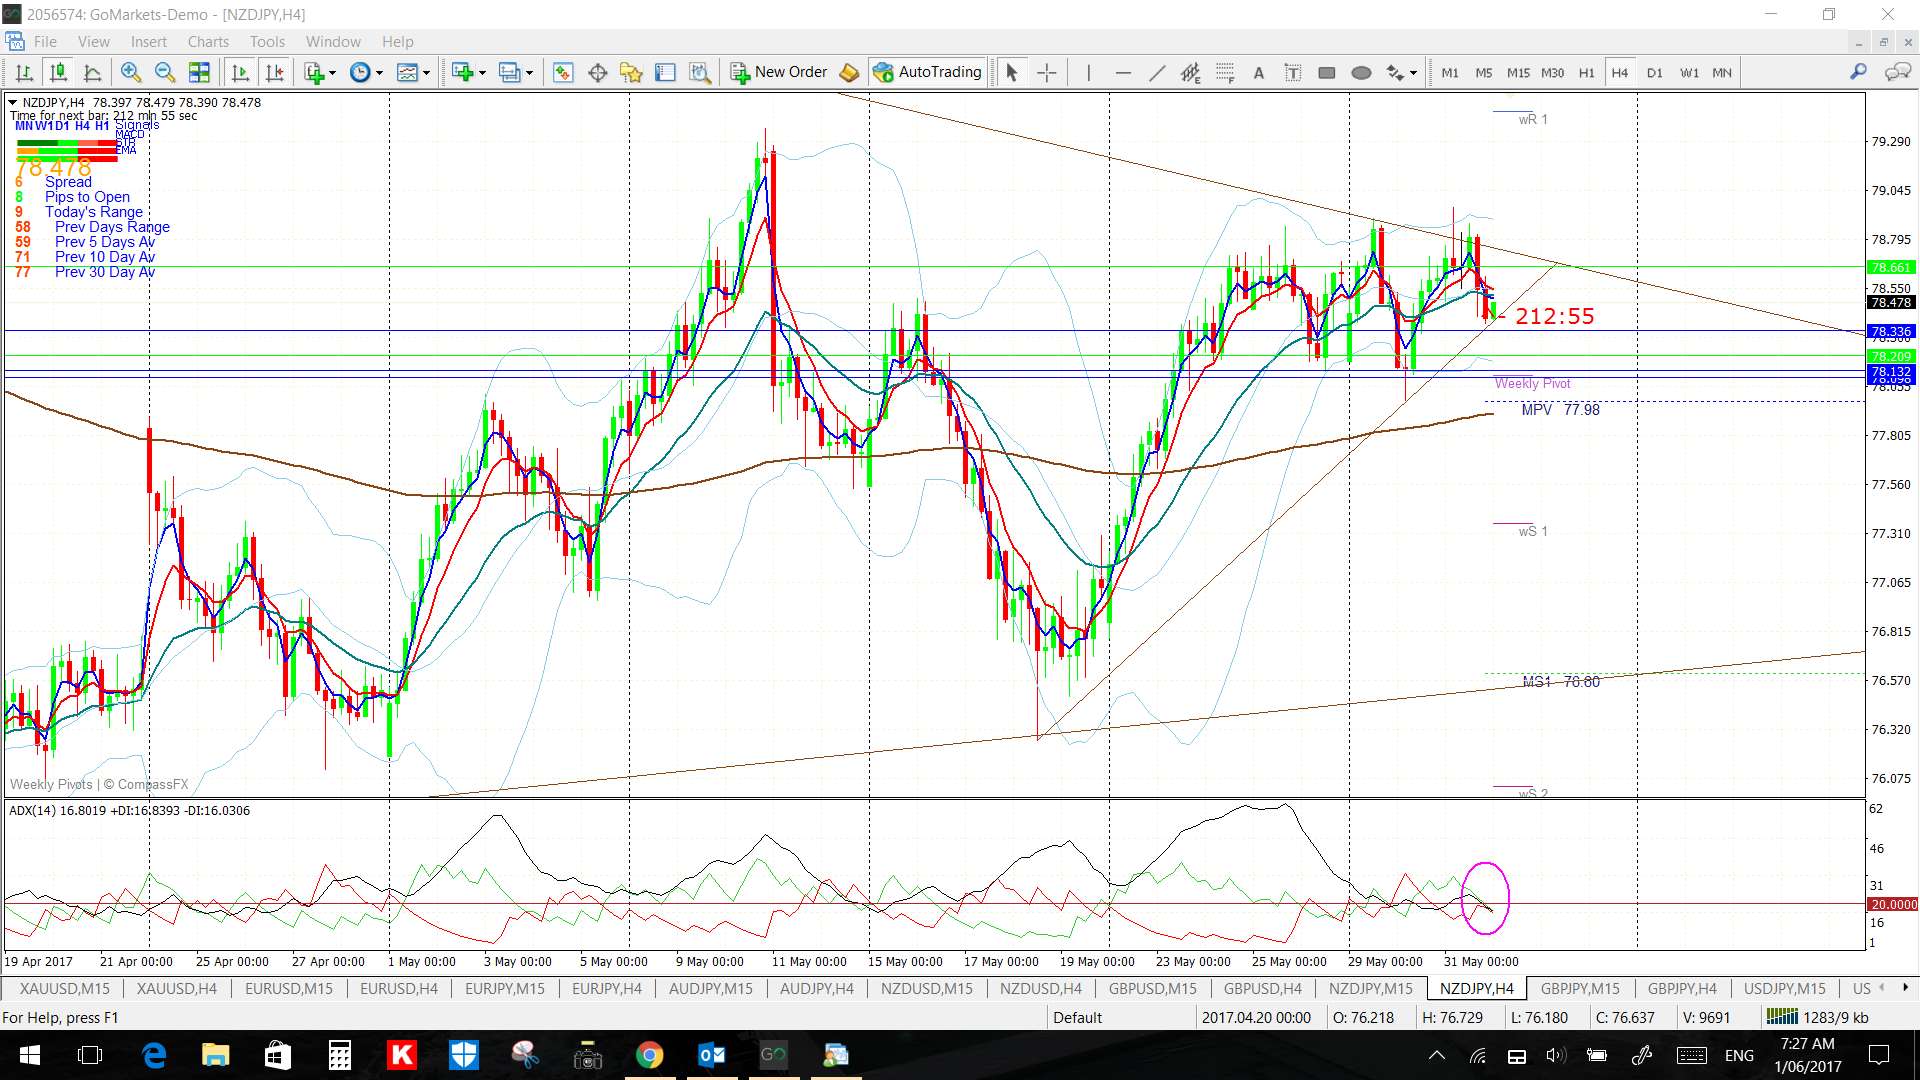
NZD/USD 4hr: watch with CNY data:
NZD/JPY 4hr: diito:
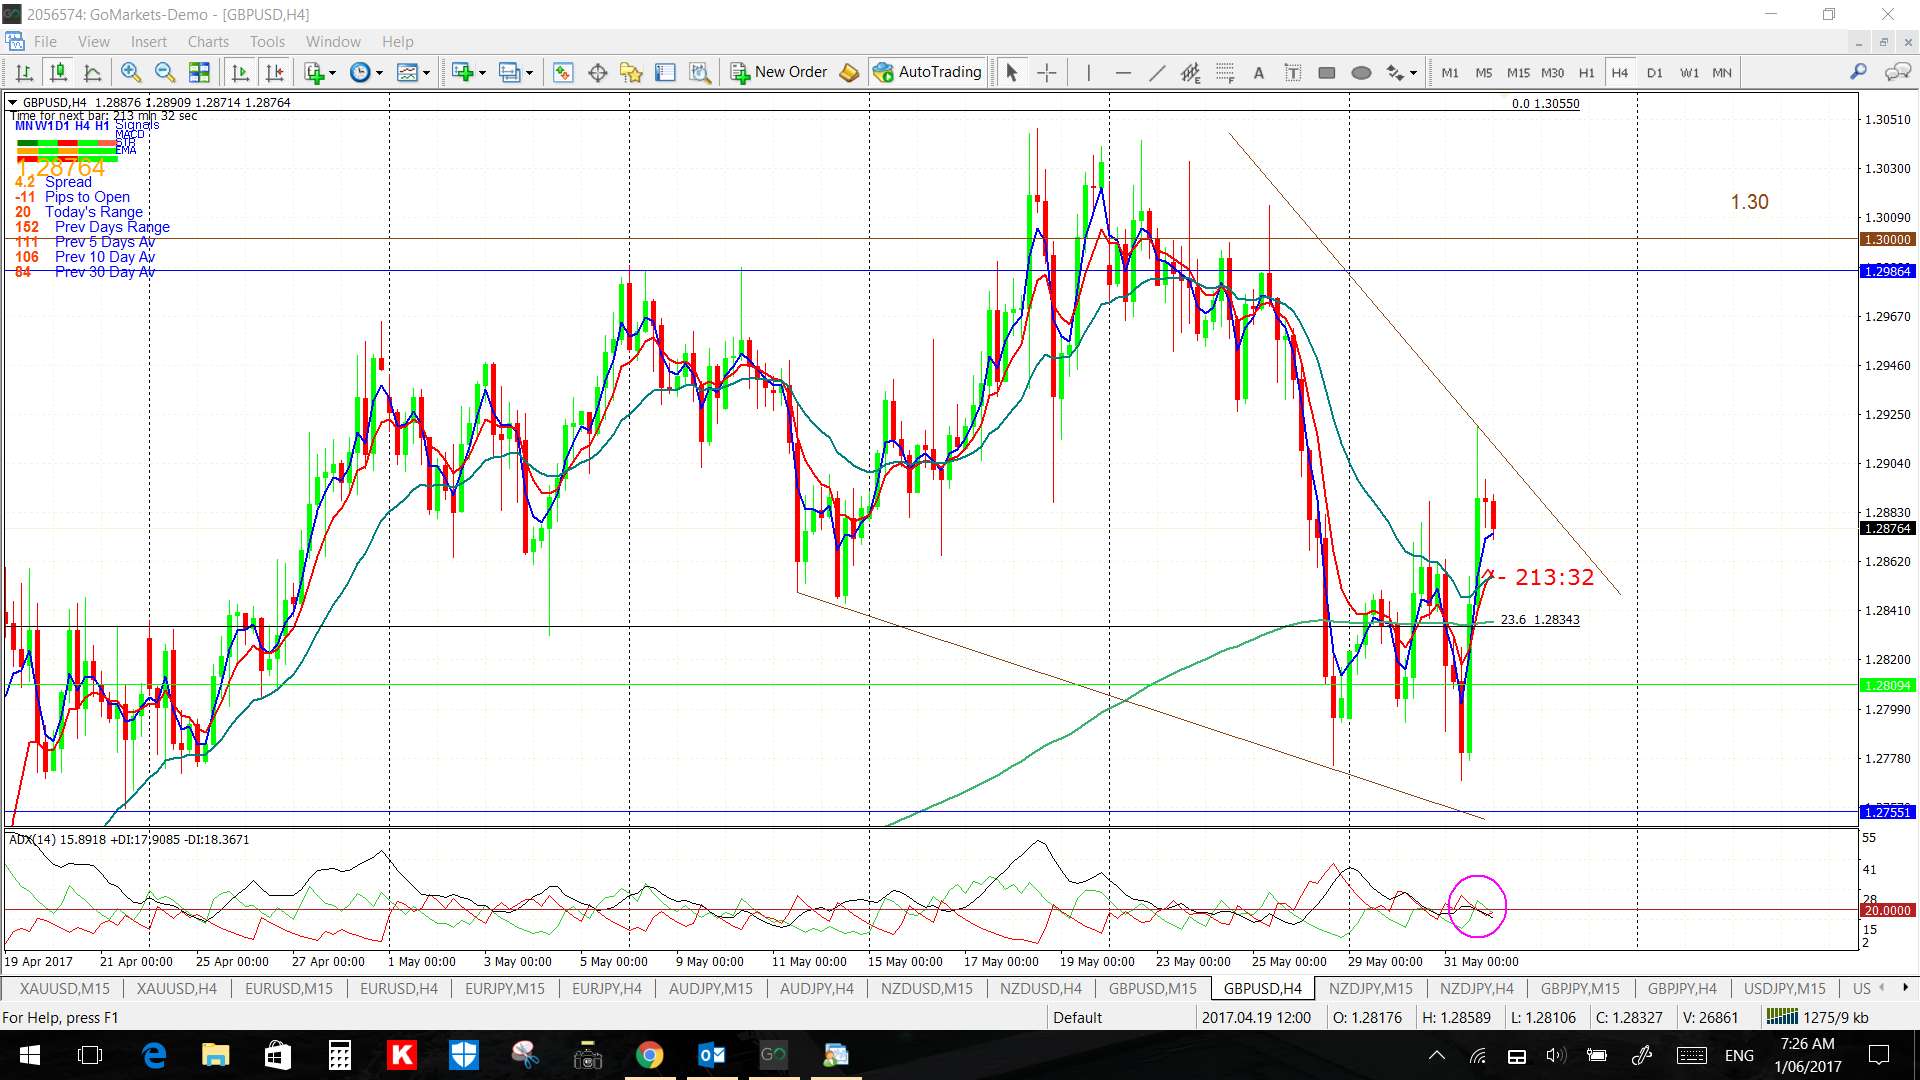
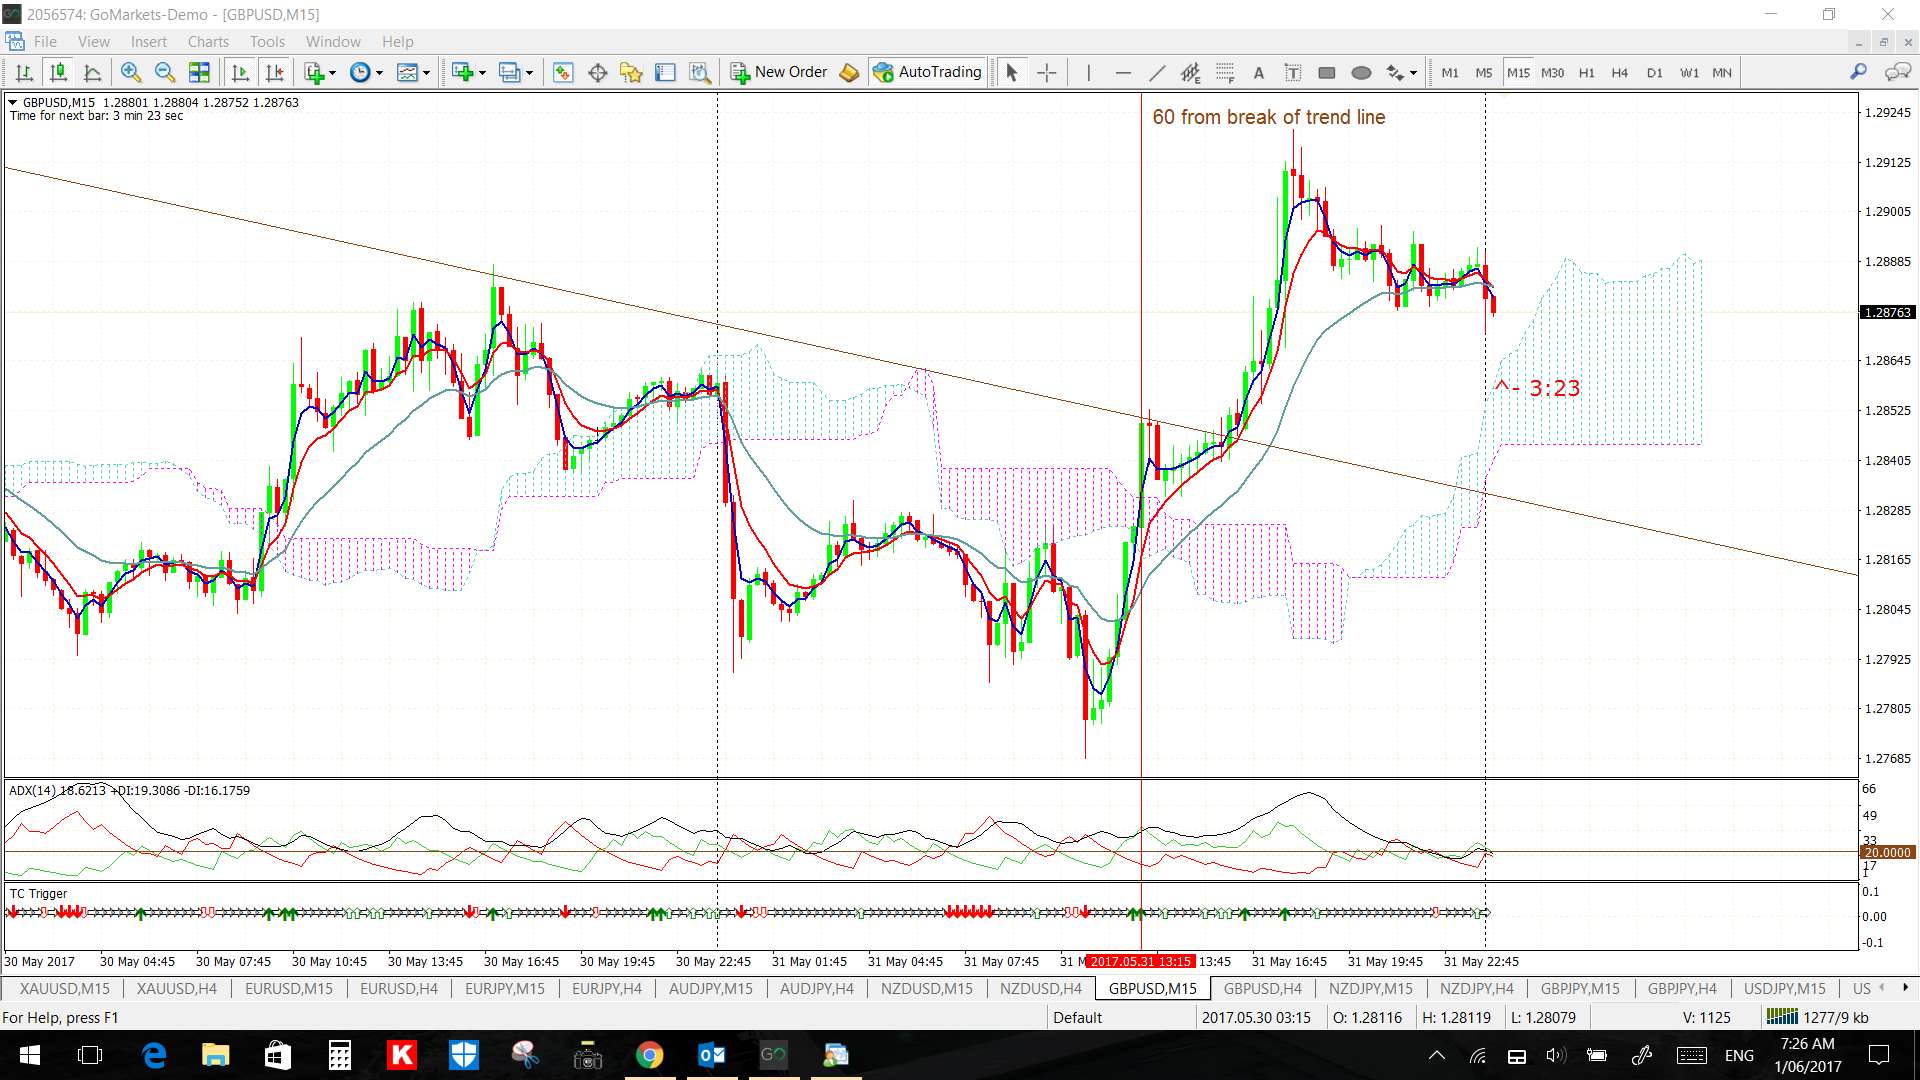
GBP/USD: I’ve revised the trend lines here however, this gave a decent 15 min chart TC trade based off yesterday’s trend lines. Watch with today’s GBP and USD data:
GBP/USD 4hr:
GBP/USD 15 min:
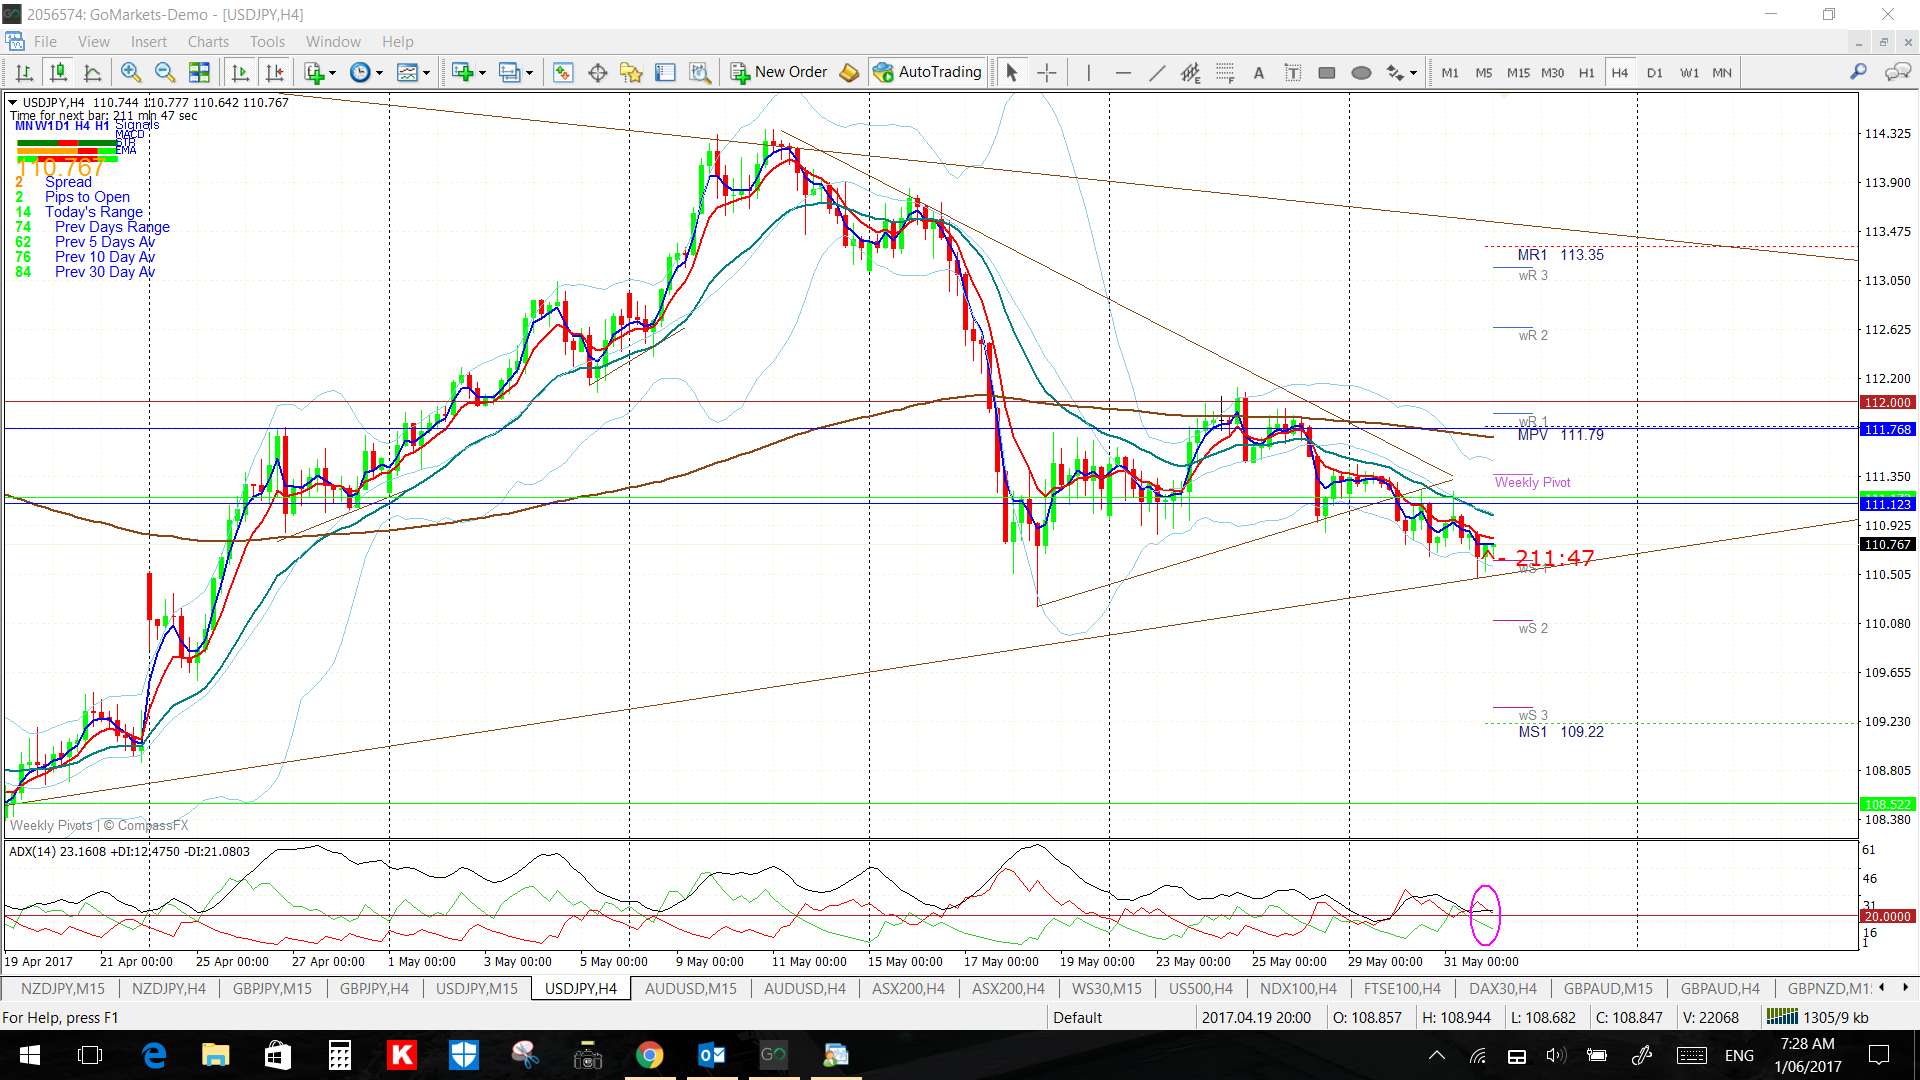
USD/JPY 4hr: watch with JPY and USD data:
GBP/JPY: ranging in the channel BUT this gave a TC 15 min chart trade. Watch with today’s GBP and JPY data:
GBP/JPY 4hr:

GBP/JPY 15 mn:

GBP/NZD 4hr: a move starting?

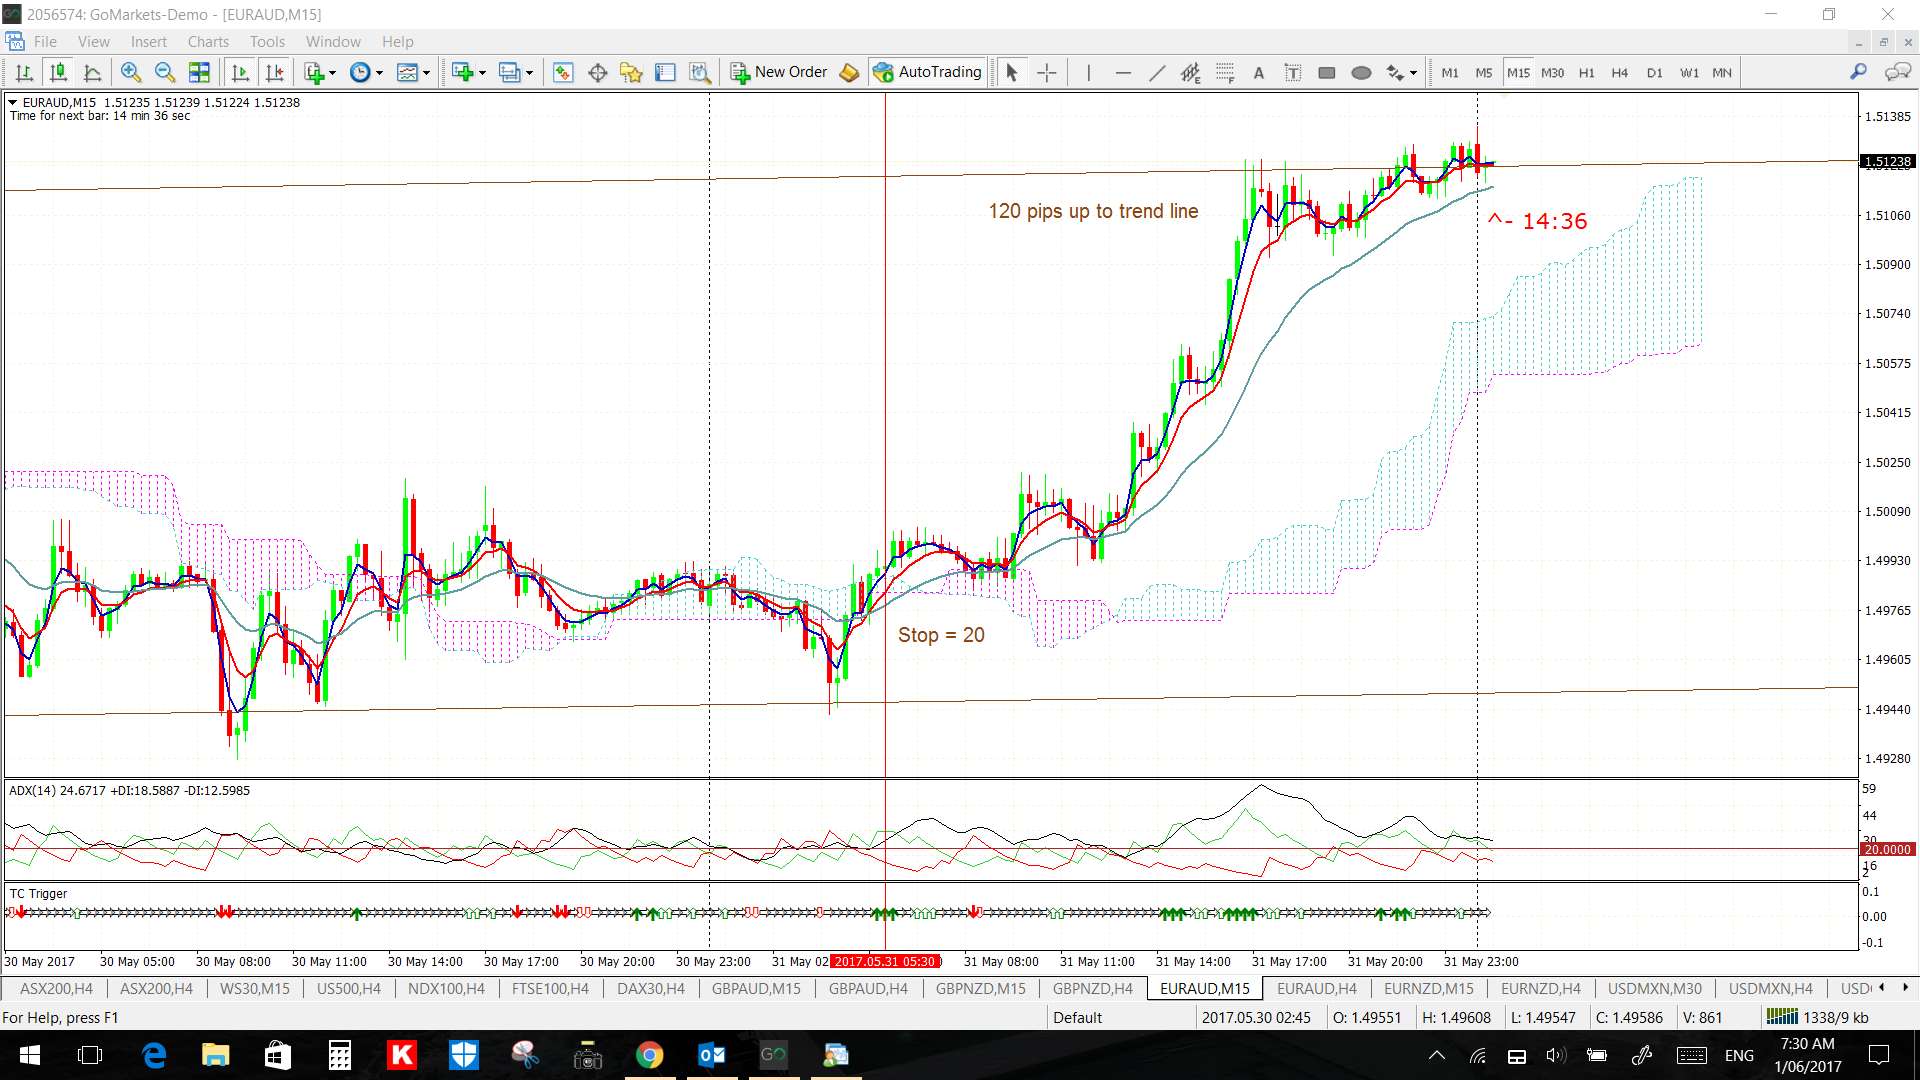
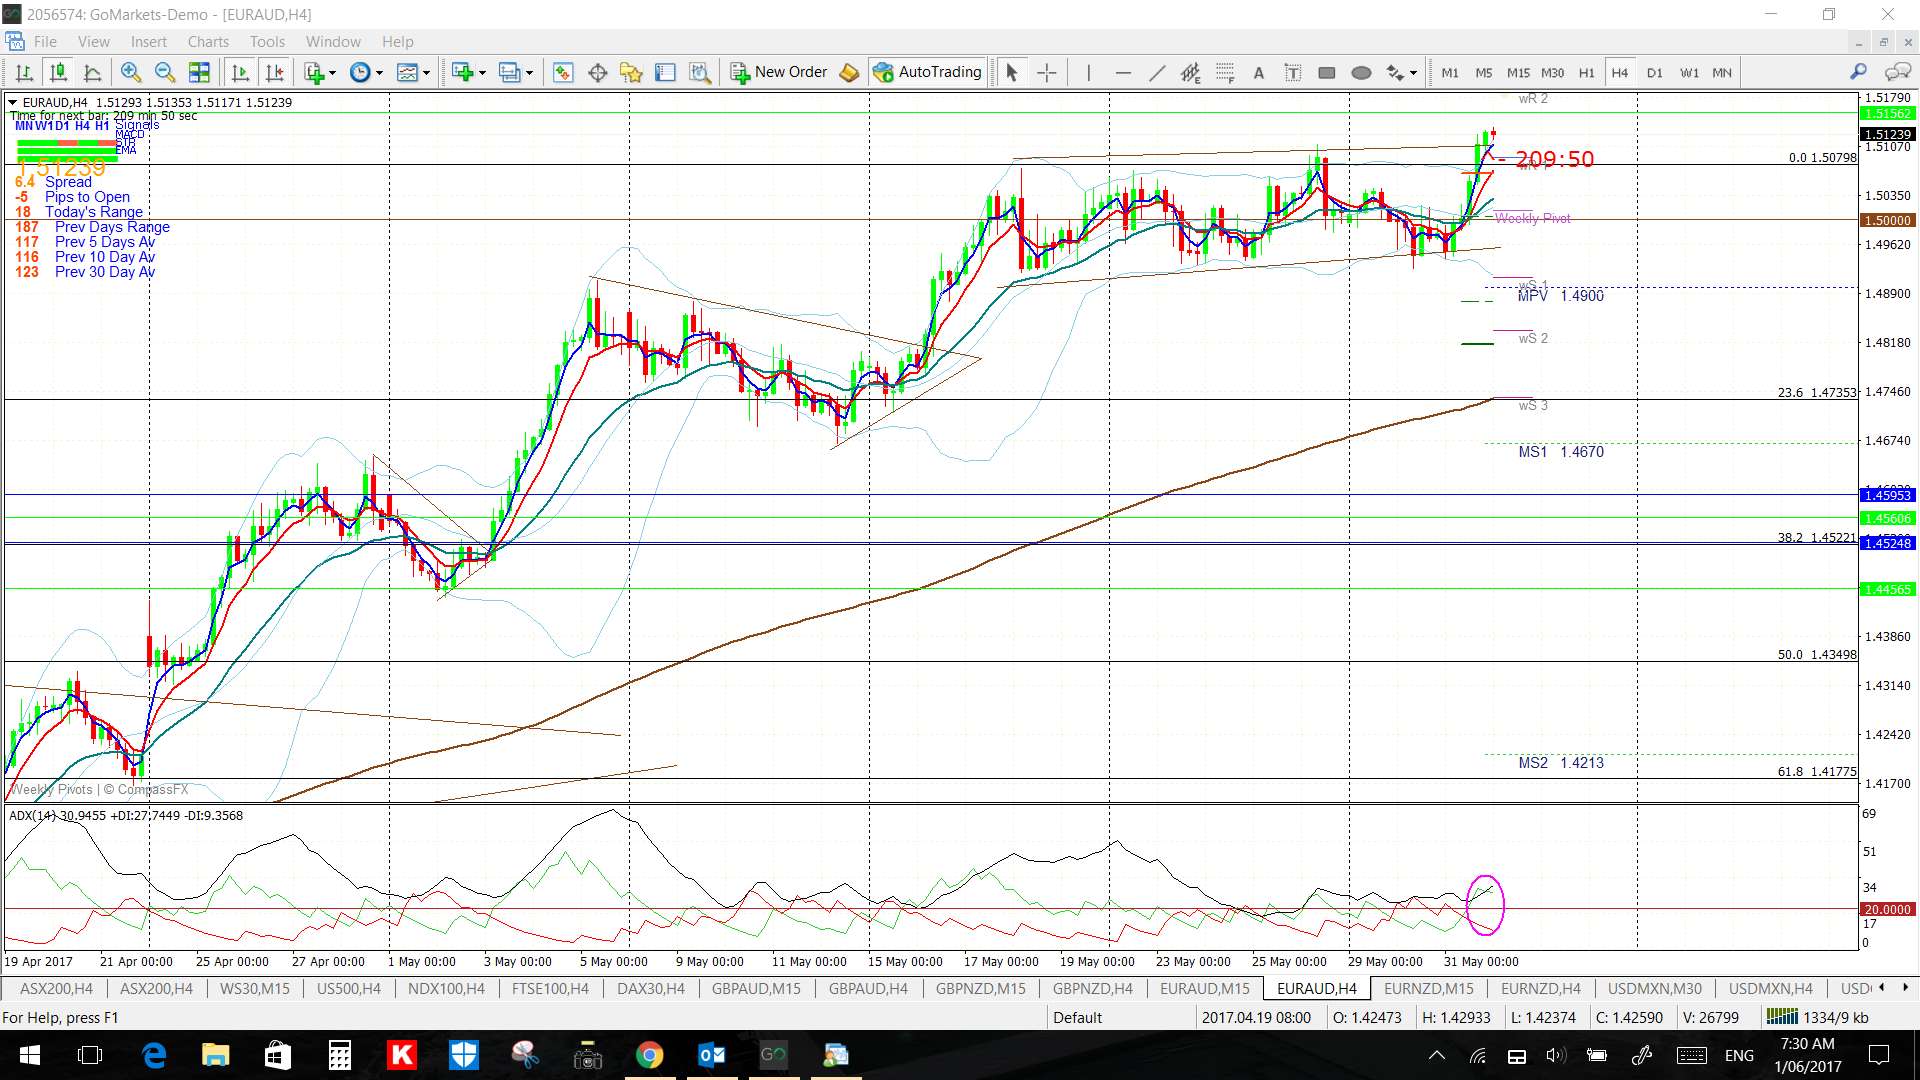
EUR/AUD: this pair has moved to to the upper trend line and, in doing so, gave a great 15 min chart TC trade opportunity:
E/A 4hr:
E/A 15 min: there was great Risk to Reward TC trade here! It triggered at the end of the Asian session although there was a TC Continuation signal at the start of Europe but this later signal would have needed a larger Stop.