The US$ remains in limbo ahead of Tuesday’s President Trump address to the joint session of Congress. This means that many of the consolidation patterns, mostly triangles, noted in my w/e analysis are still valid although there are new 4hr triangles on the AUD/JPY, USD/JPY & GBP/JPY to add to this lengthy list! The same drill applies: watch for momentum-based trend line breakouts.
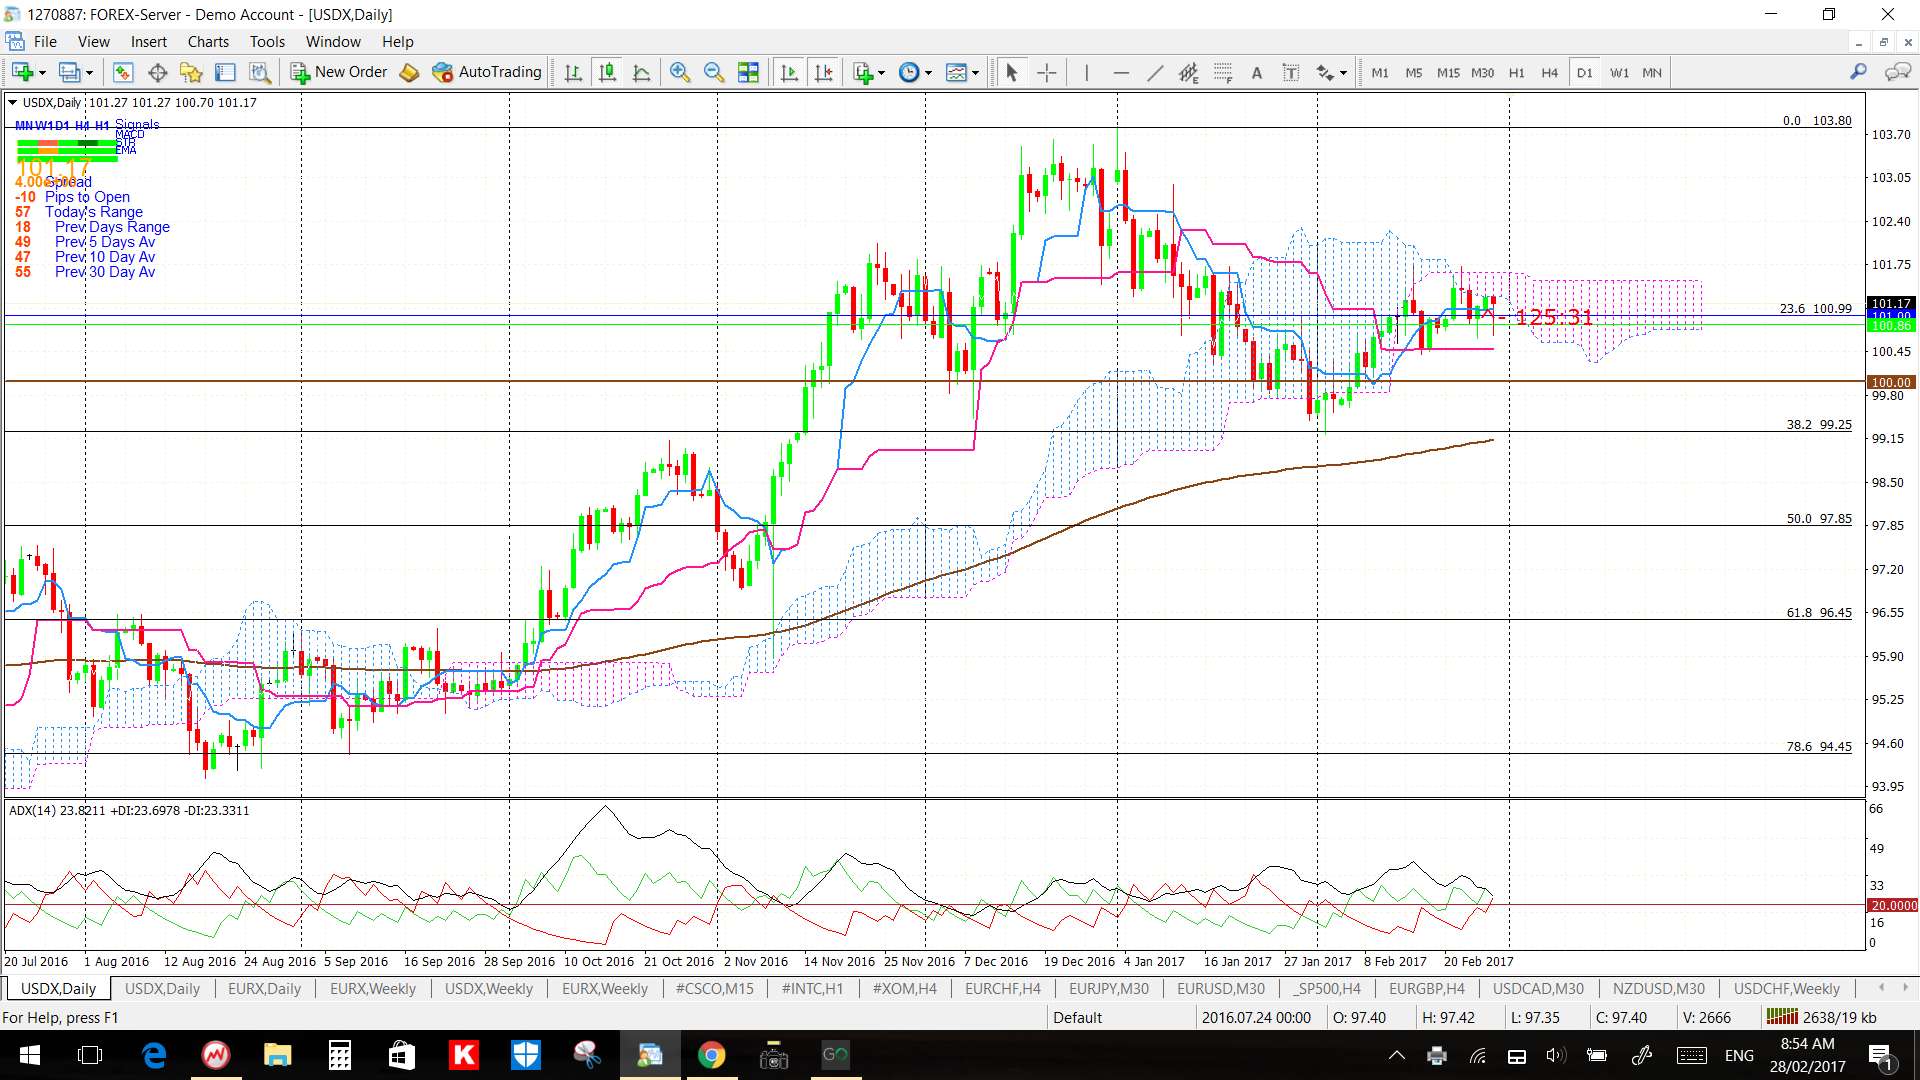
USDX daily: still above 100 but below 102 and still below the daily Cloud, although the latter is broadening reflecting increasing resistance. Watch for impact from Tuesday’s Trump speech and US GDP data:

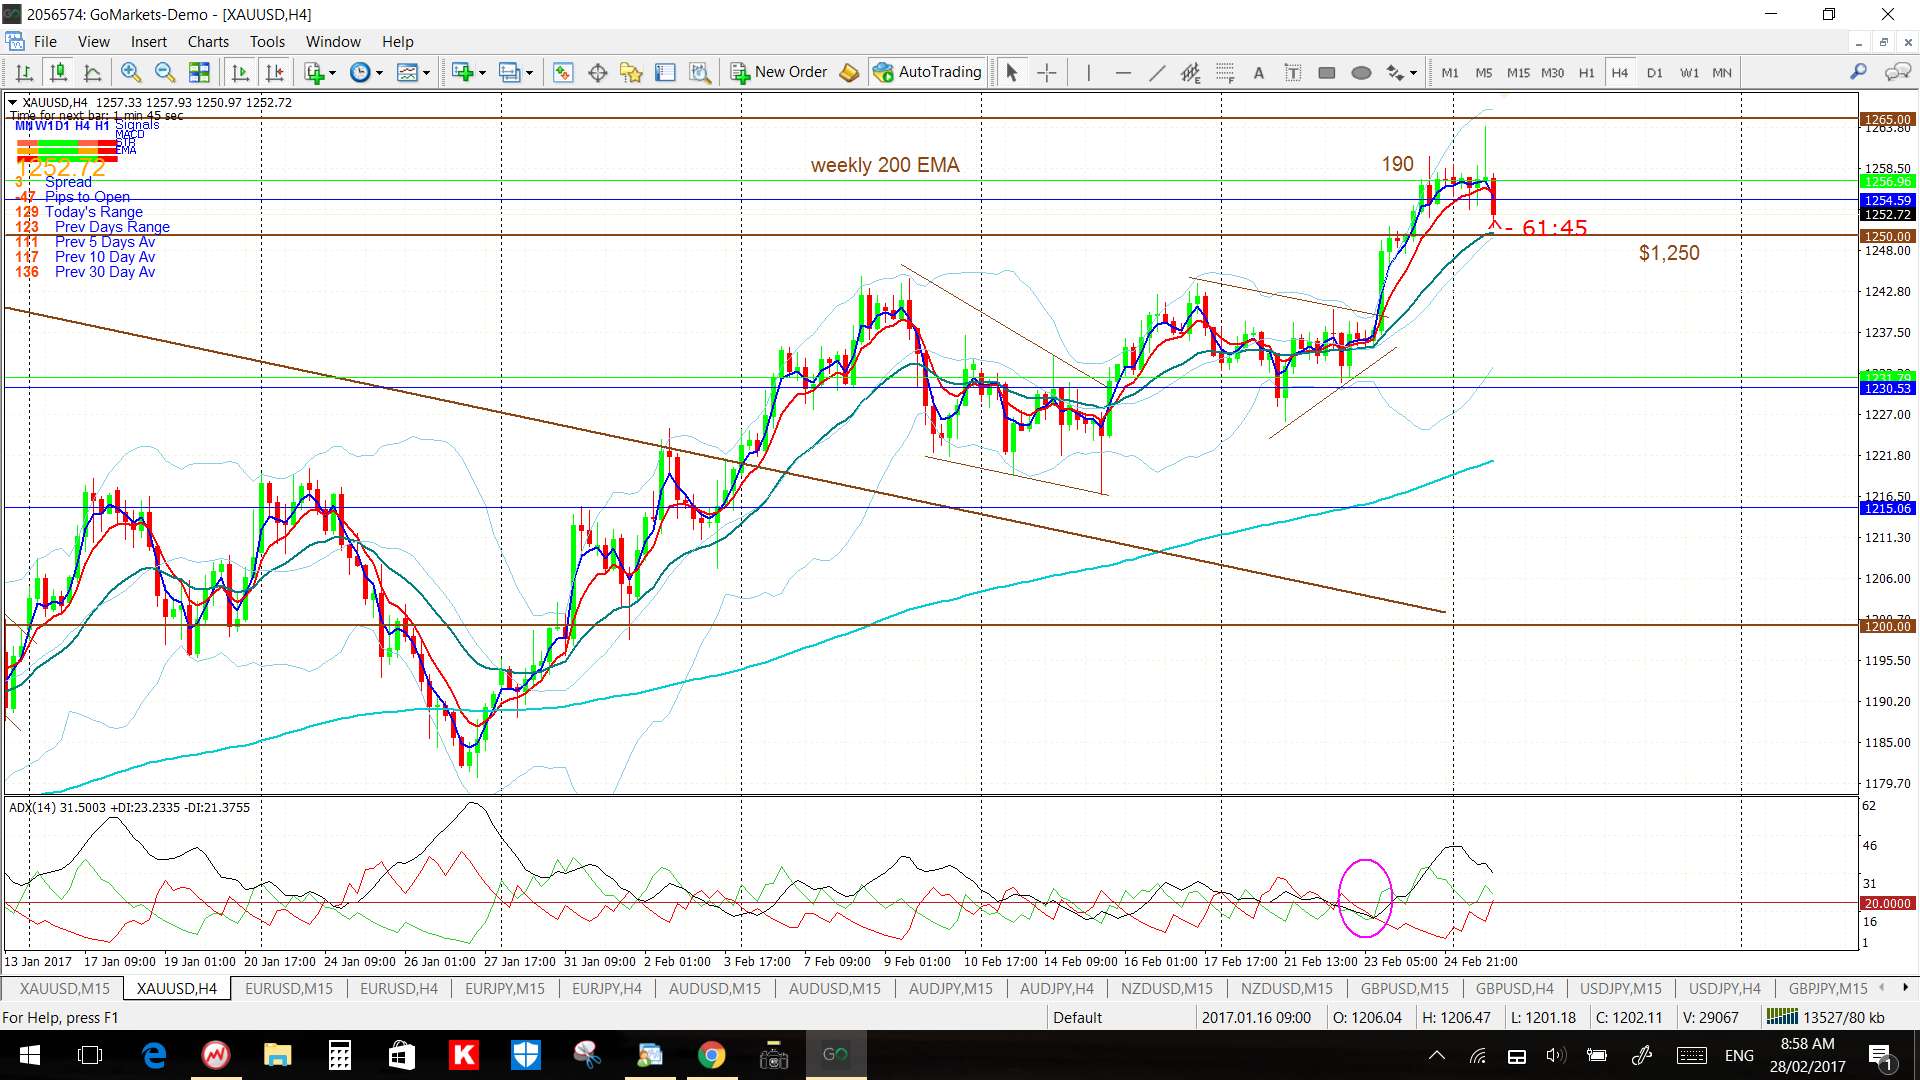
Gold 4hr: I Tweeted yesterday that I was looking for a test of $1,250 and it’s almost there!
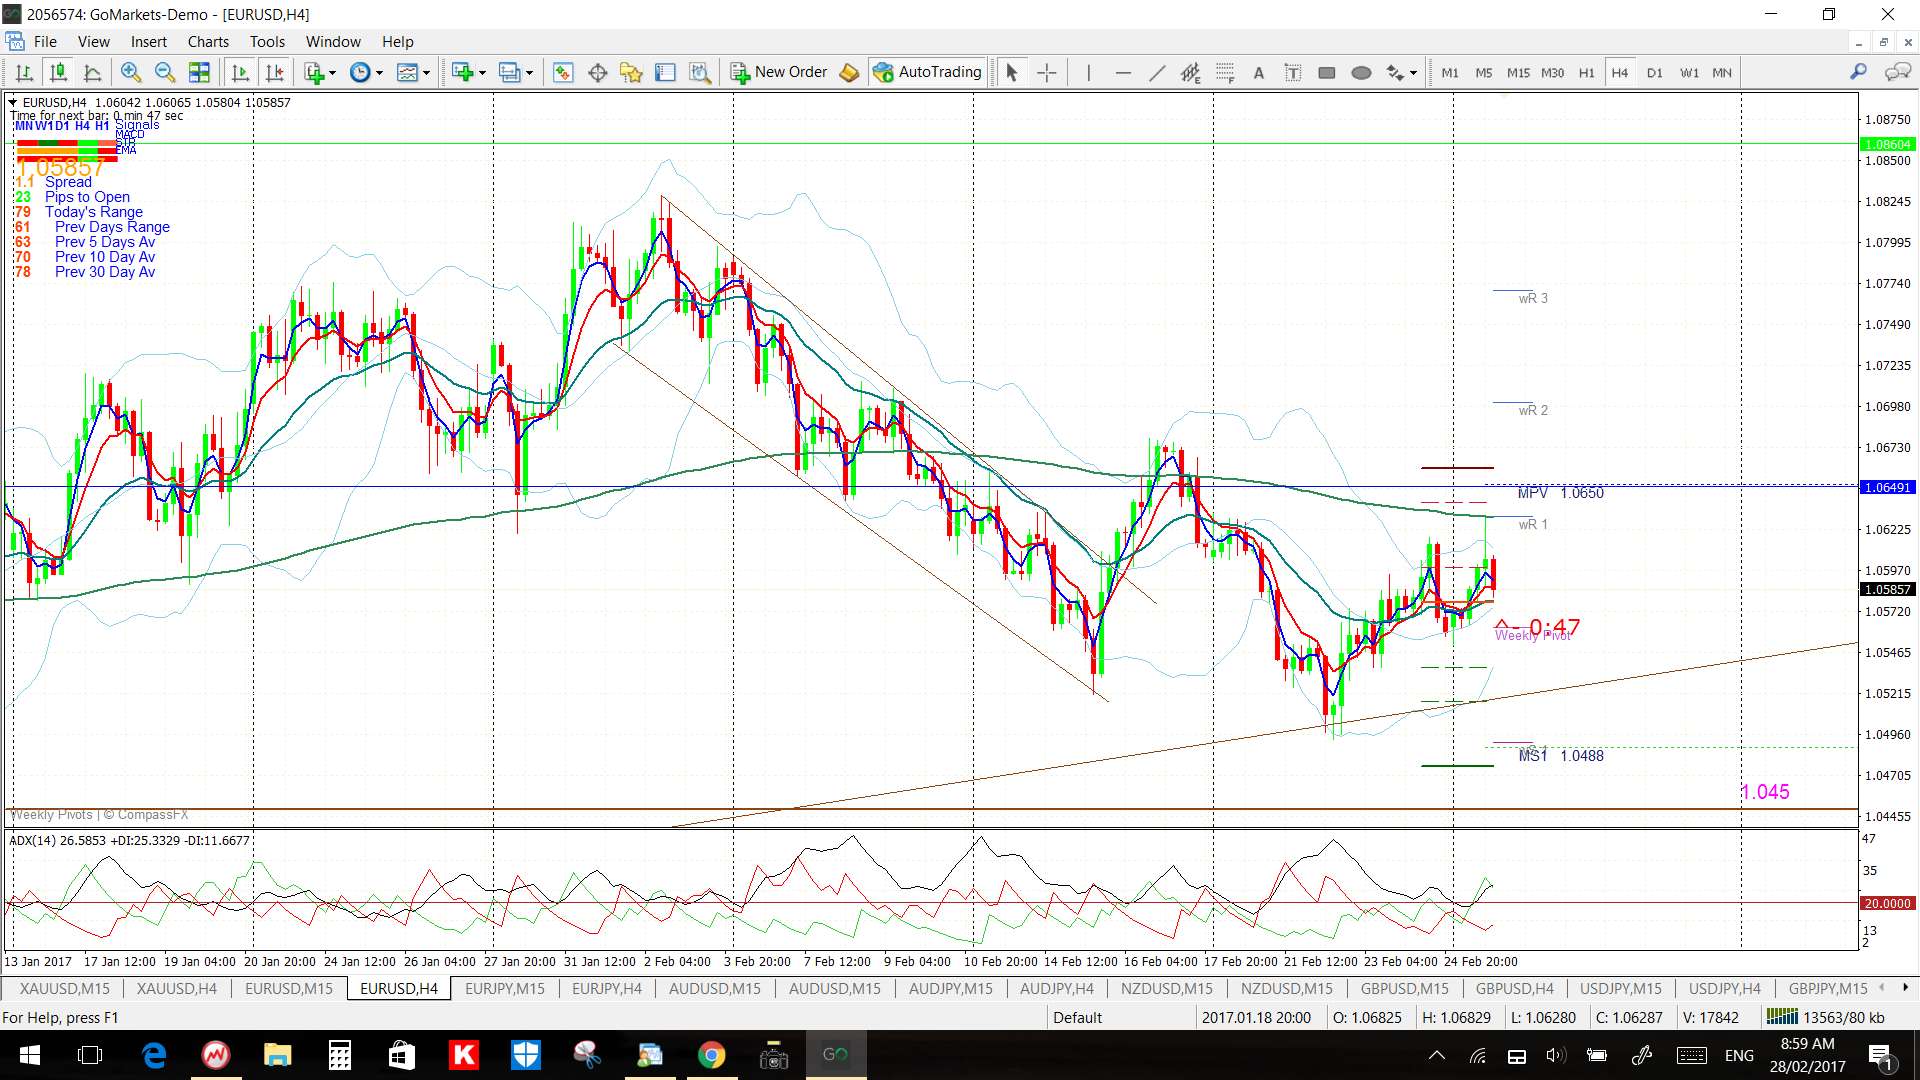
EUR/USD 4hr: still in the larger triangle from the daily chart:
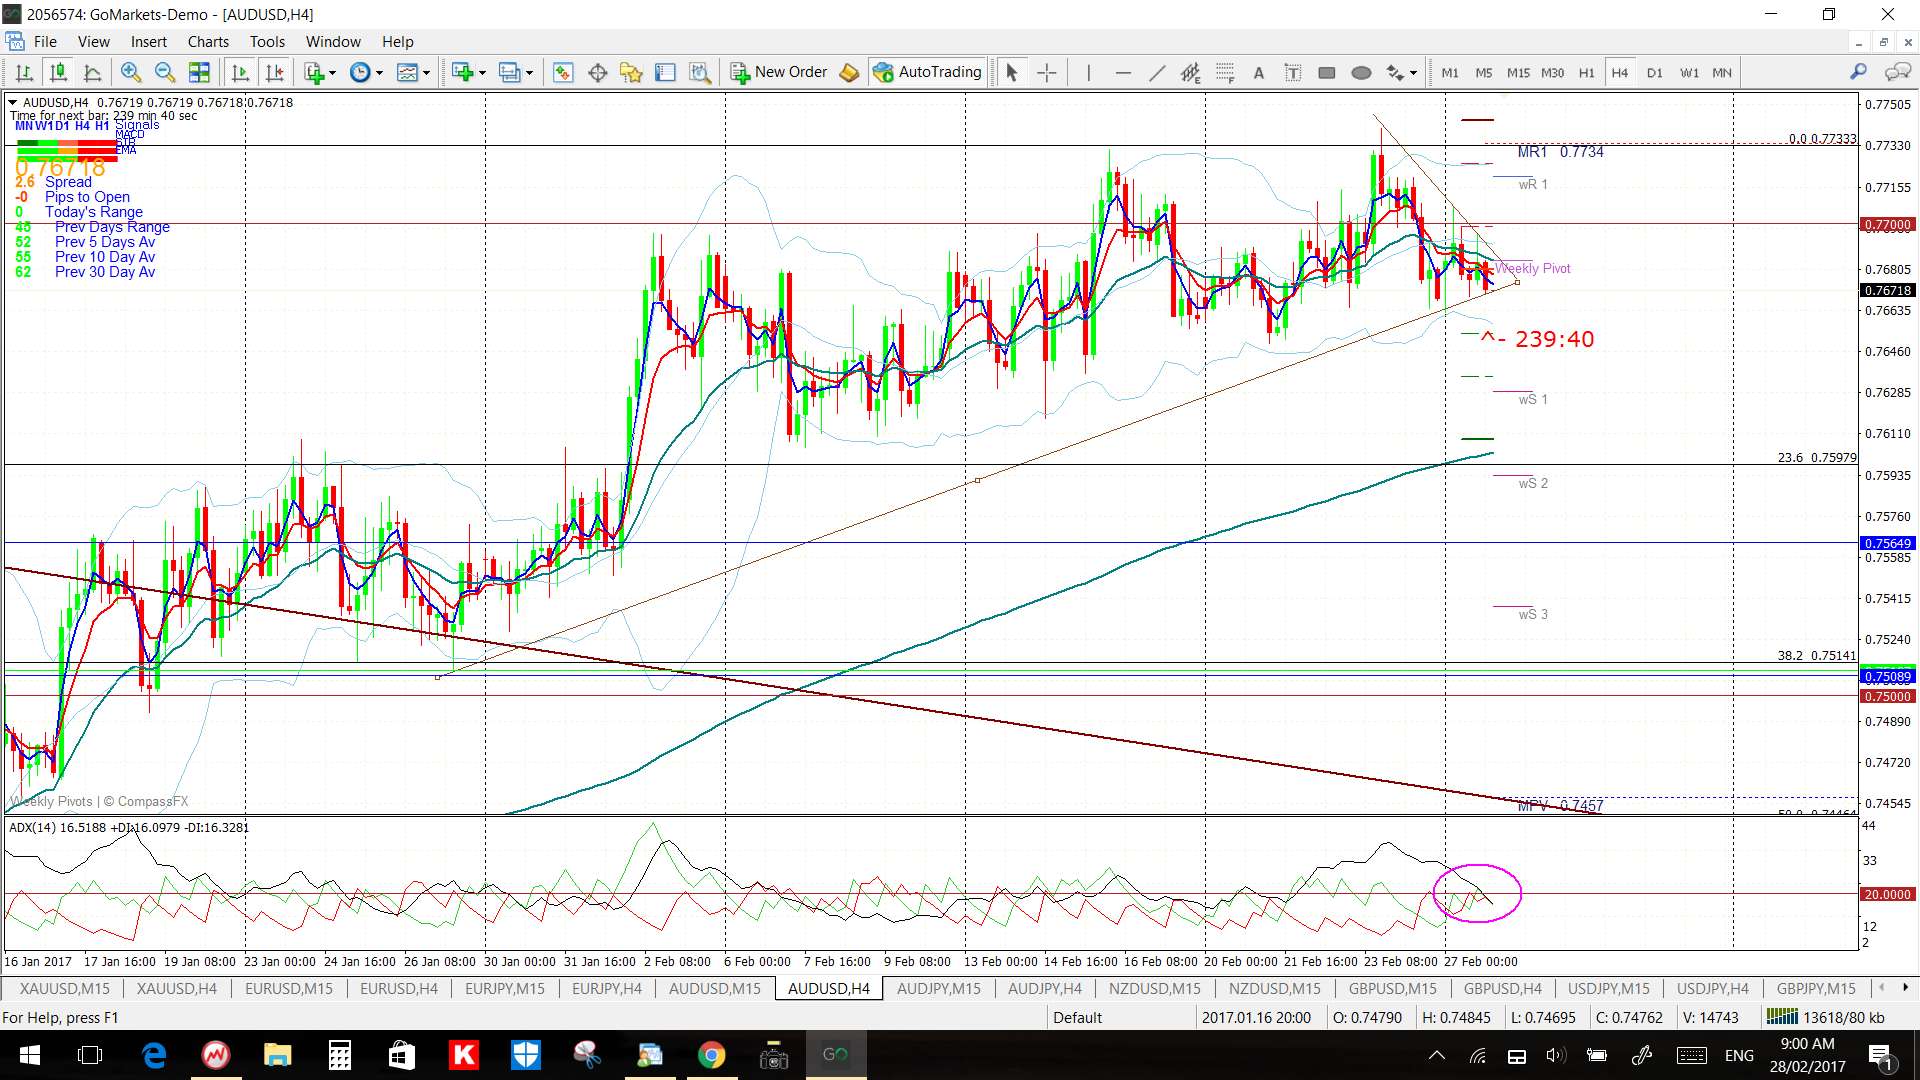
AUD/USD 4hr: little has changed here:
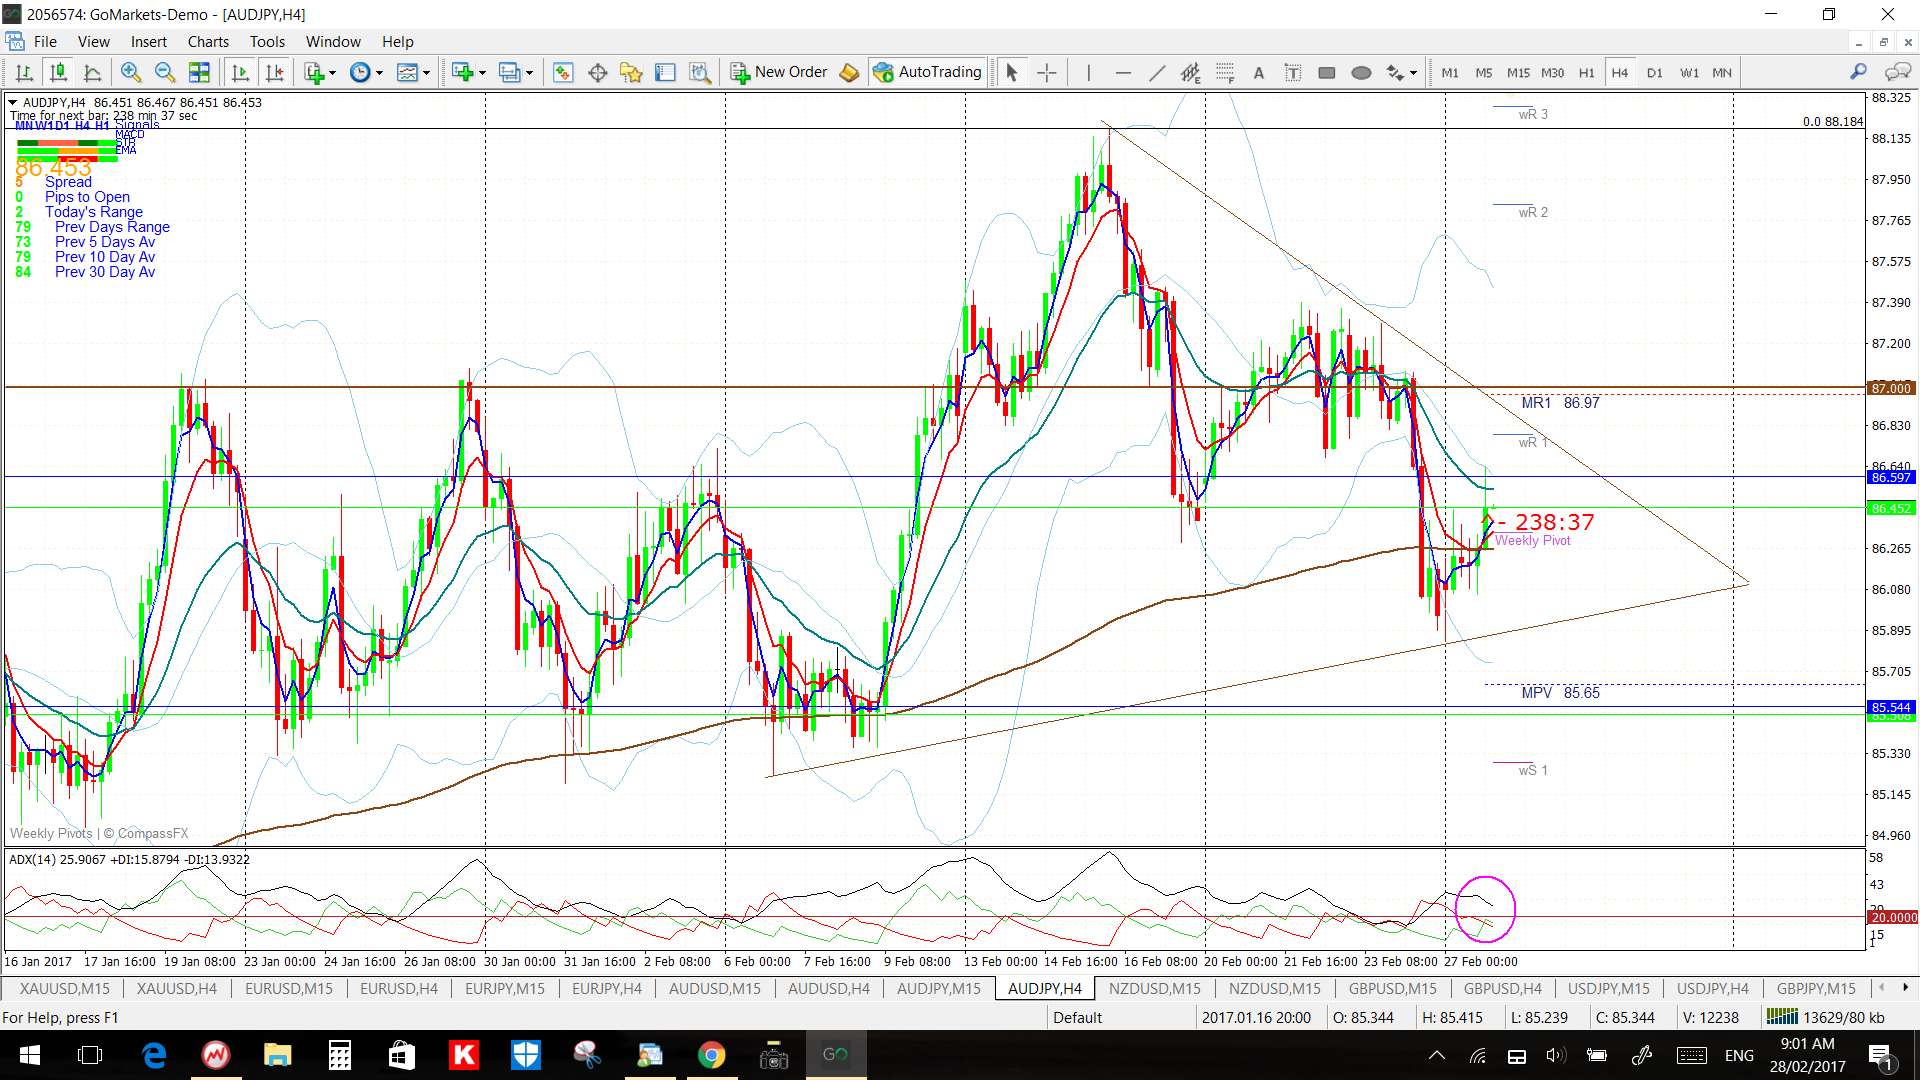
AUD/JPY 4hr: a bit of a bounce yesterday and hence a new 4hr triangle:
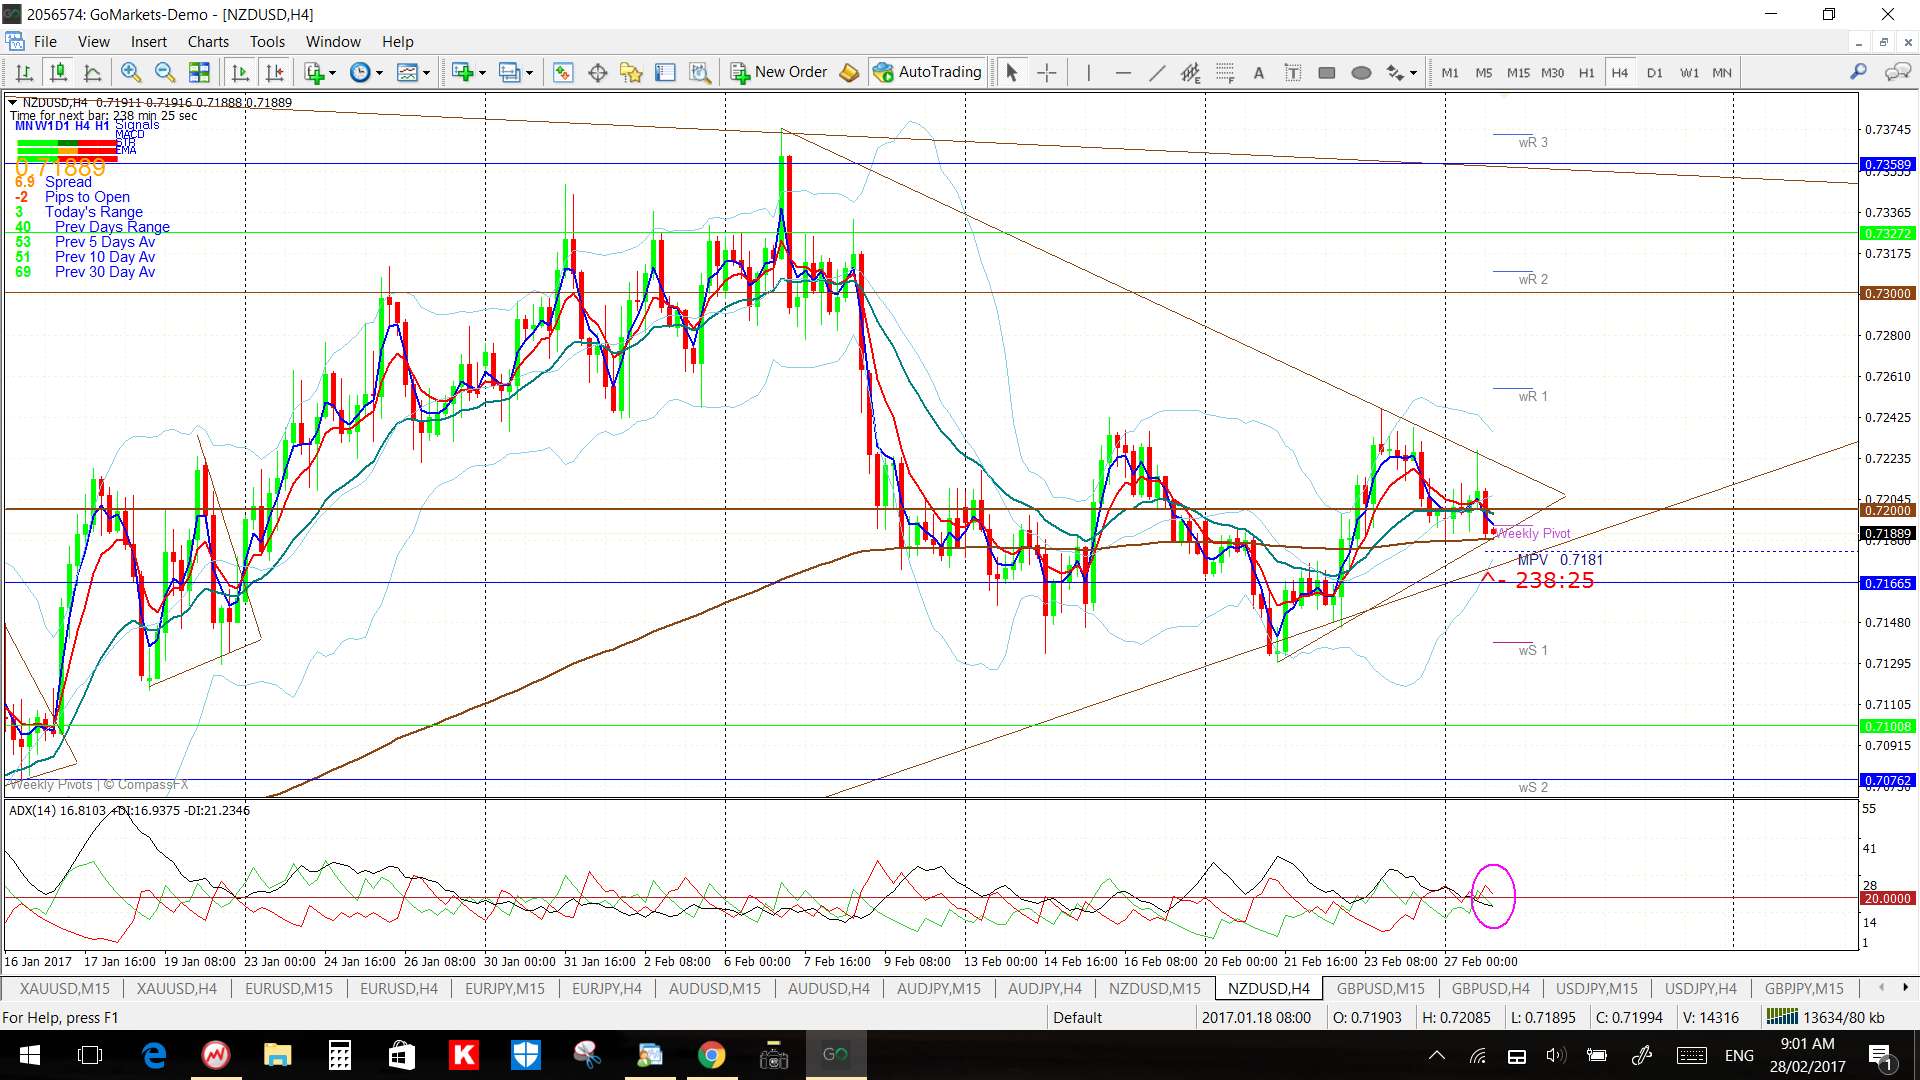
NZD/USD 4hr: not much change here either:
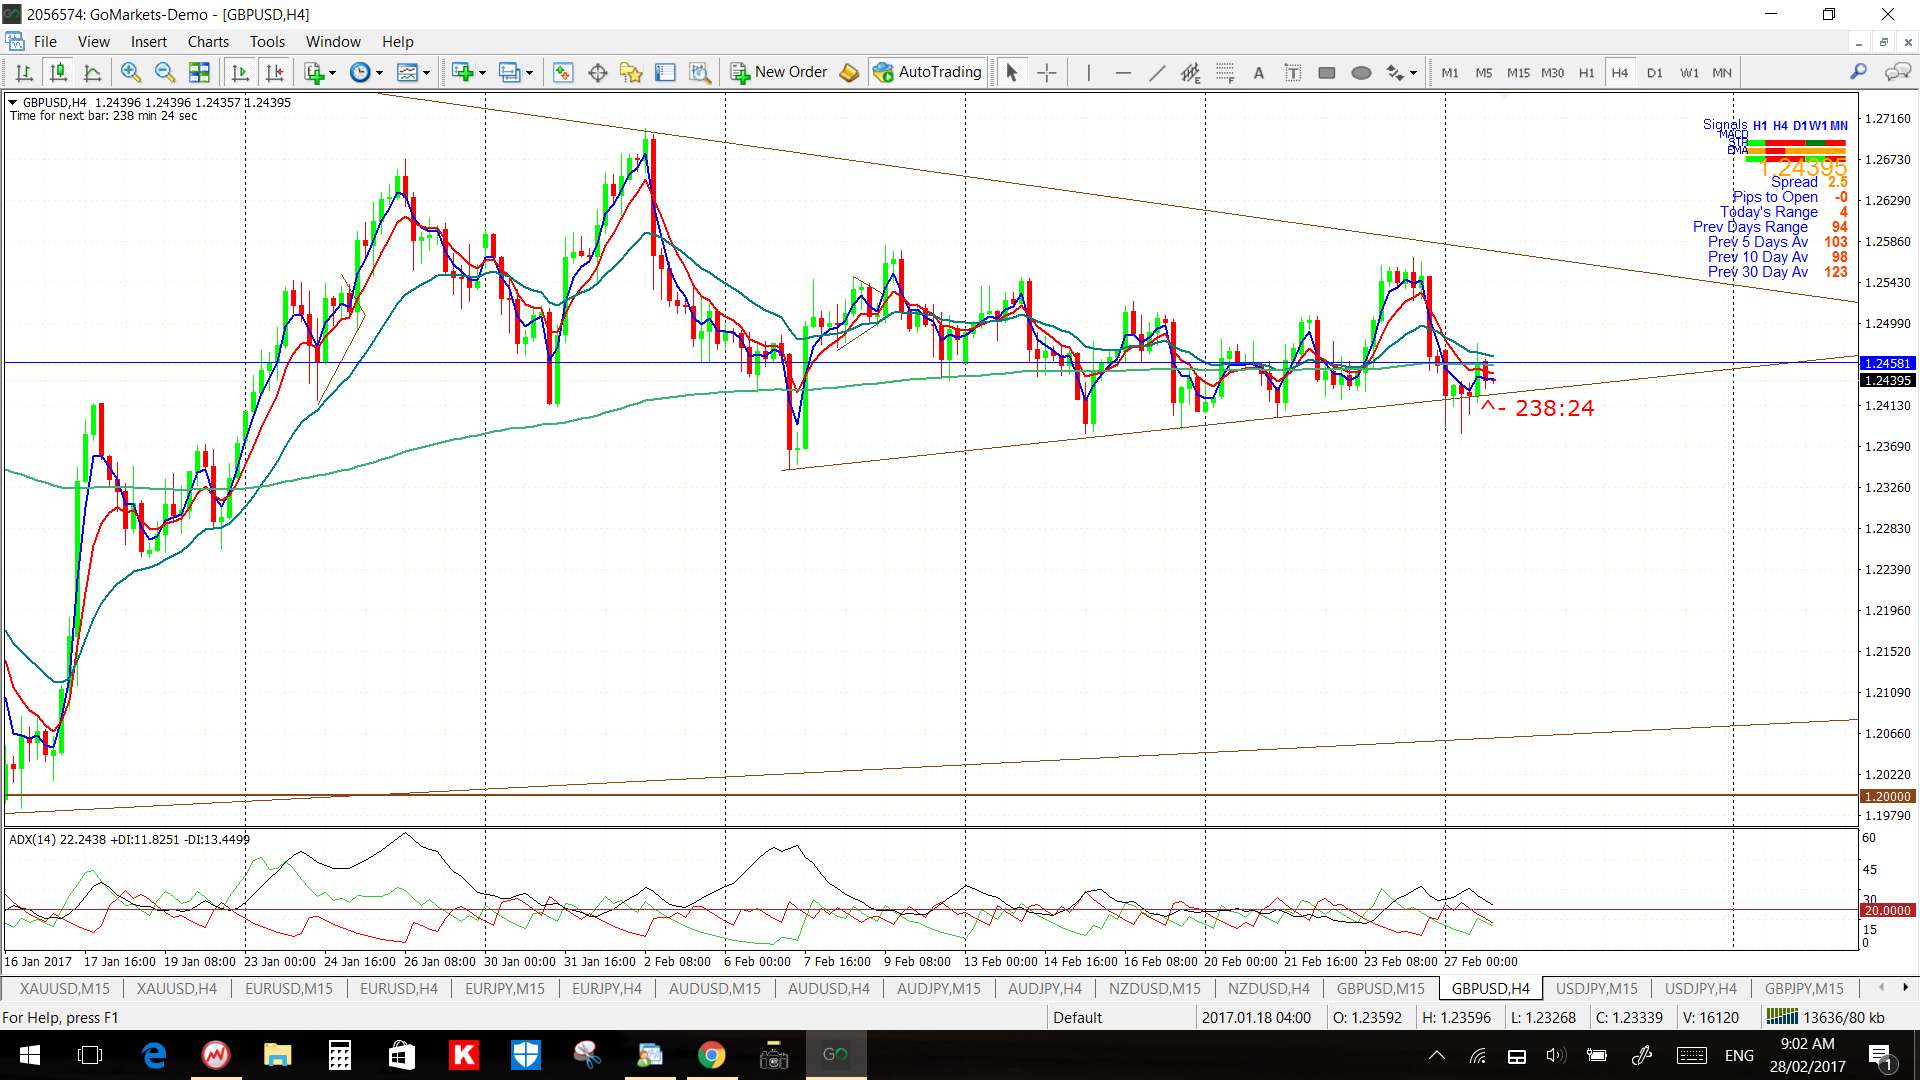
GBP/USD 4hr: note how that 4hr chart support trend line held!
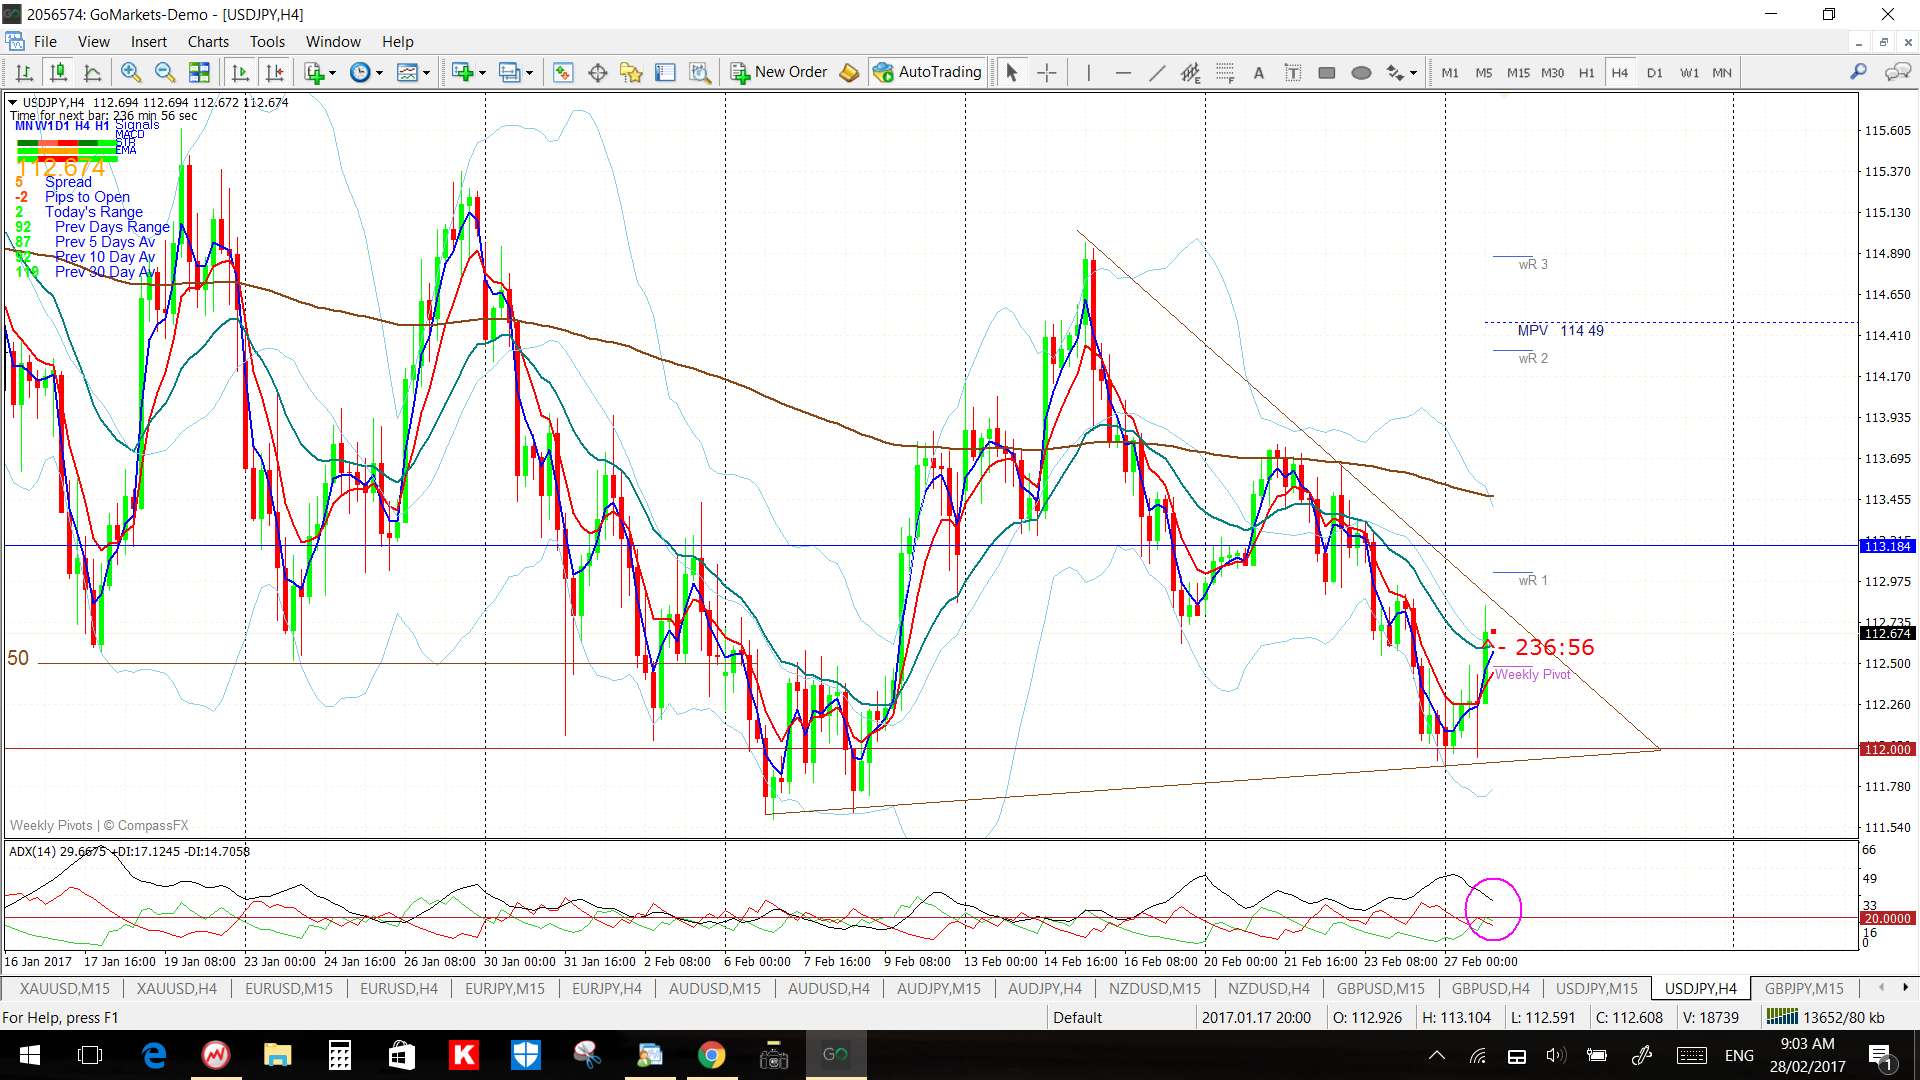
USD/JPY 4hr: like with the AUD/JPY, a bit of a bounce yesterday here too and hence a new 4hr triangle:
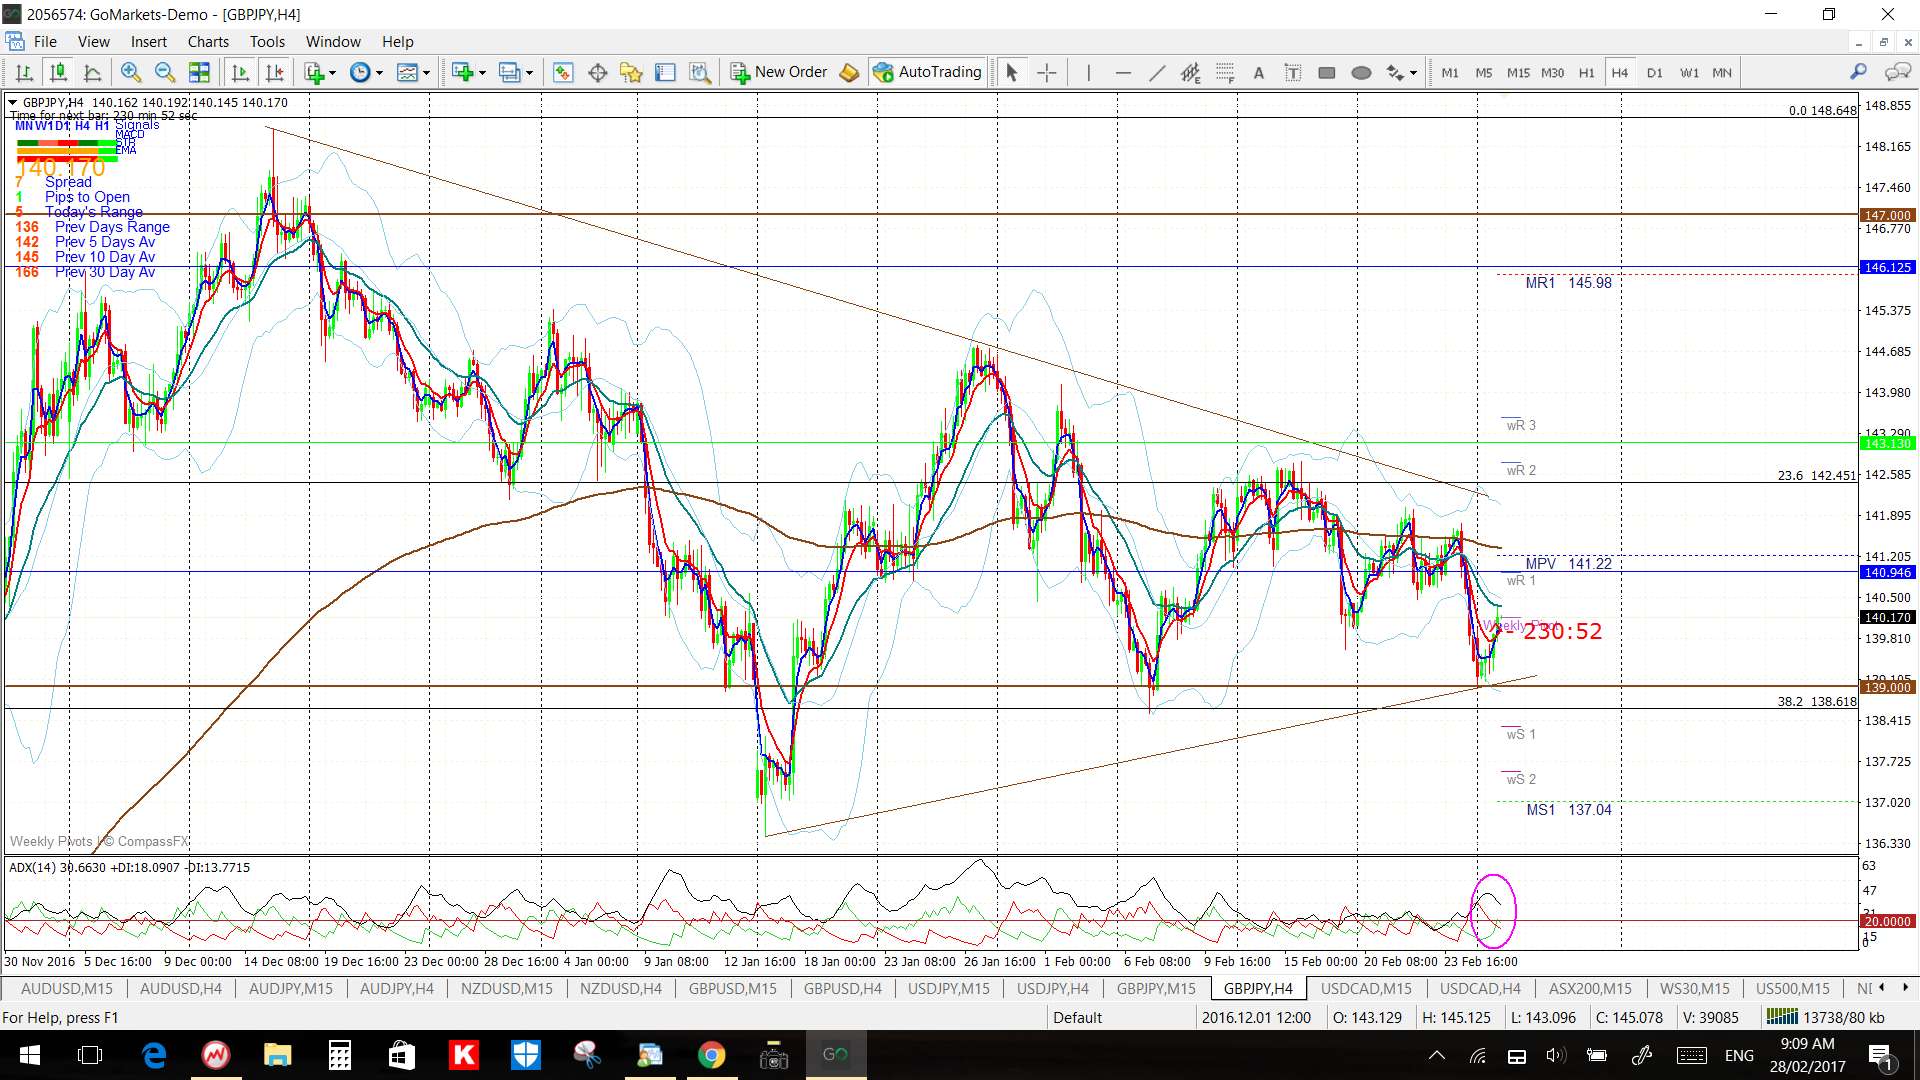
GBP/JPY 4hr: I have adjusted the lower trend line of this previous triangle. I had Tweeted yesterday that whole number levels are major support and for yesterday, it was the 139 level. This remains a level to watch for any make or break activity:
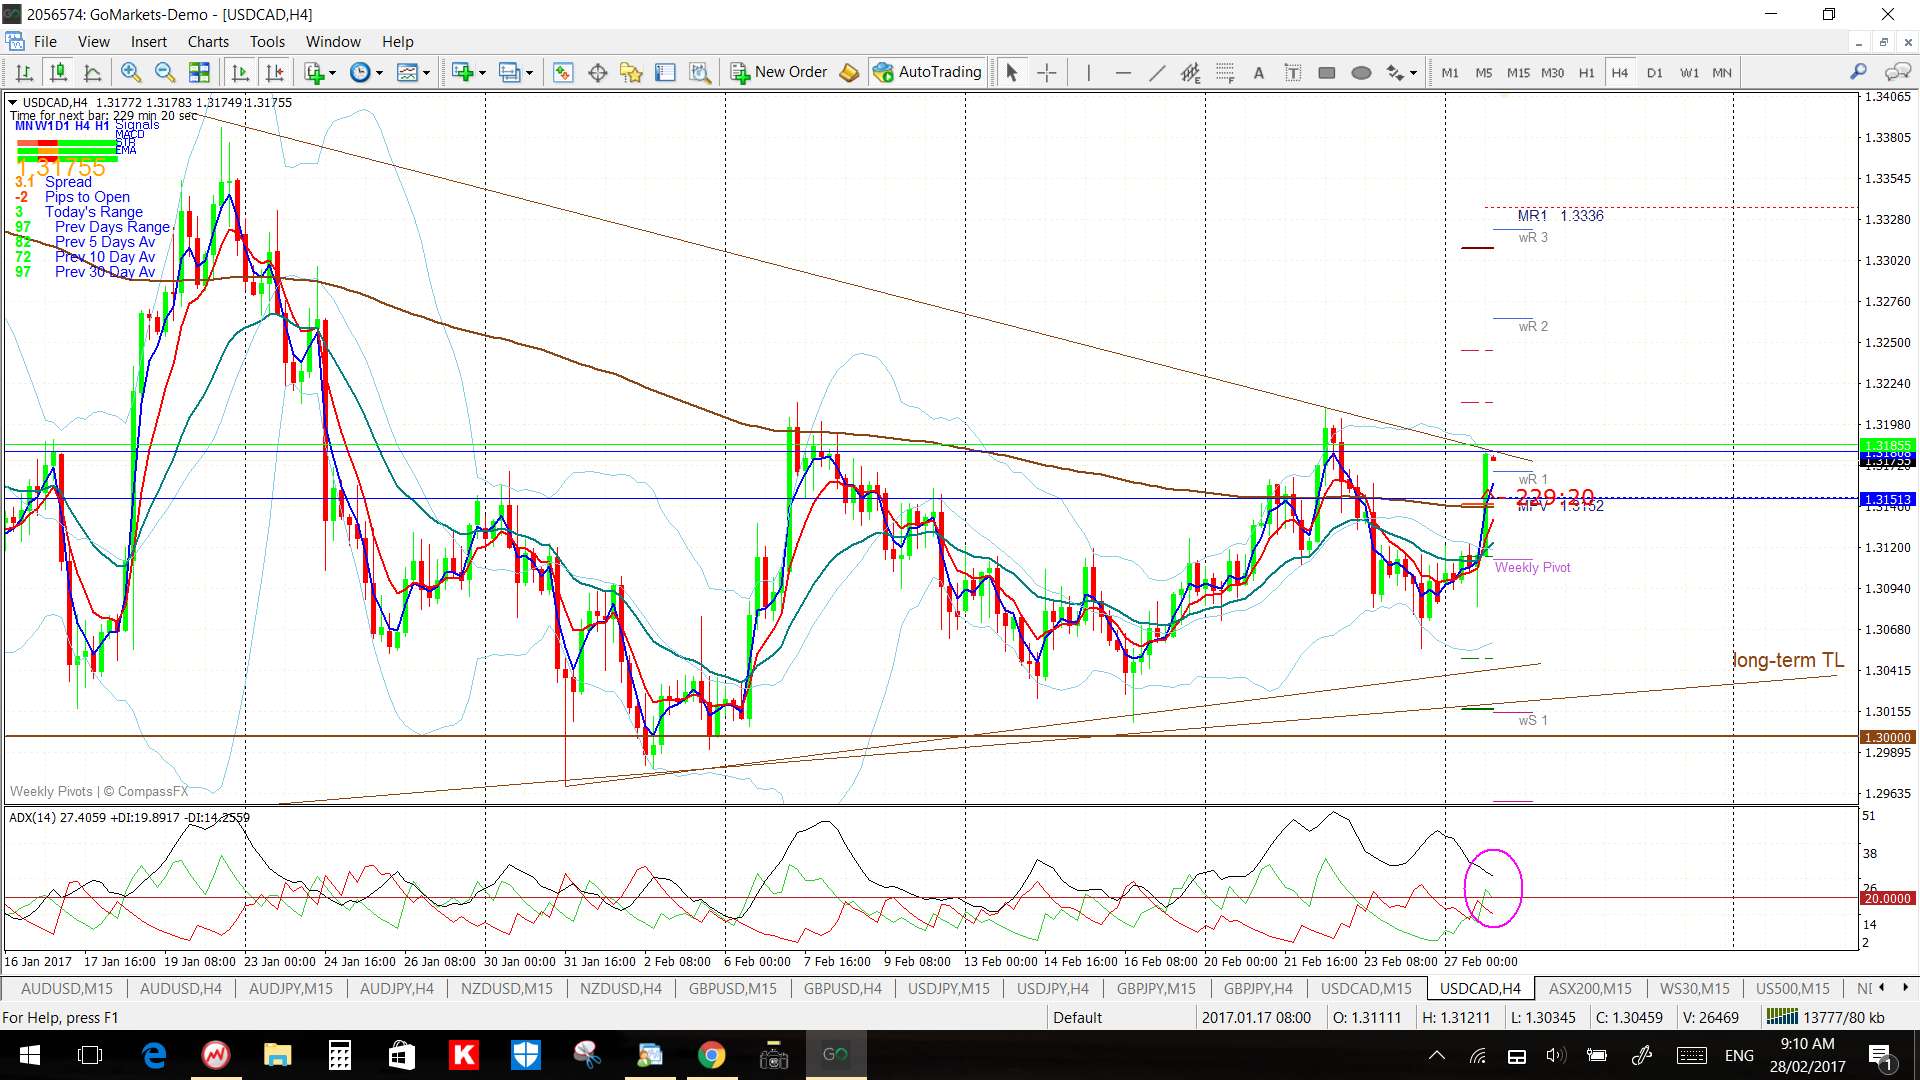
USD/CAD 4hr: up testing the recent wedge trend line:
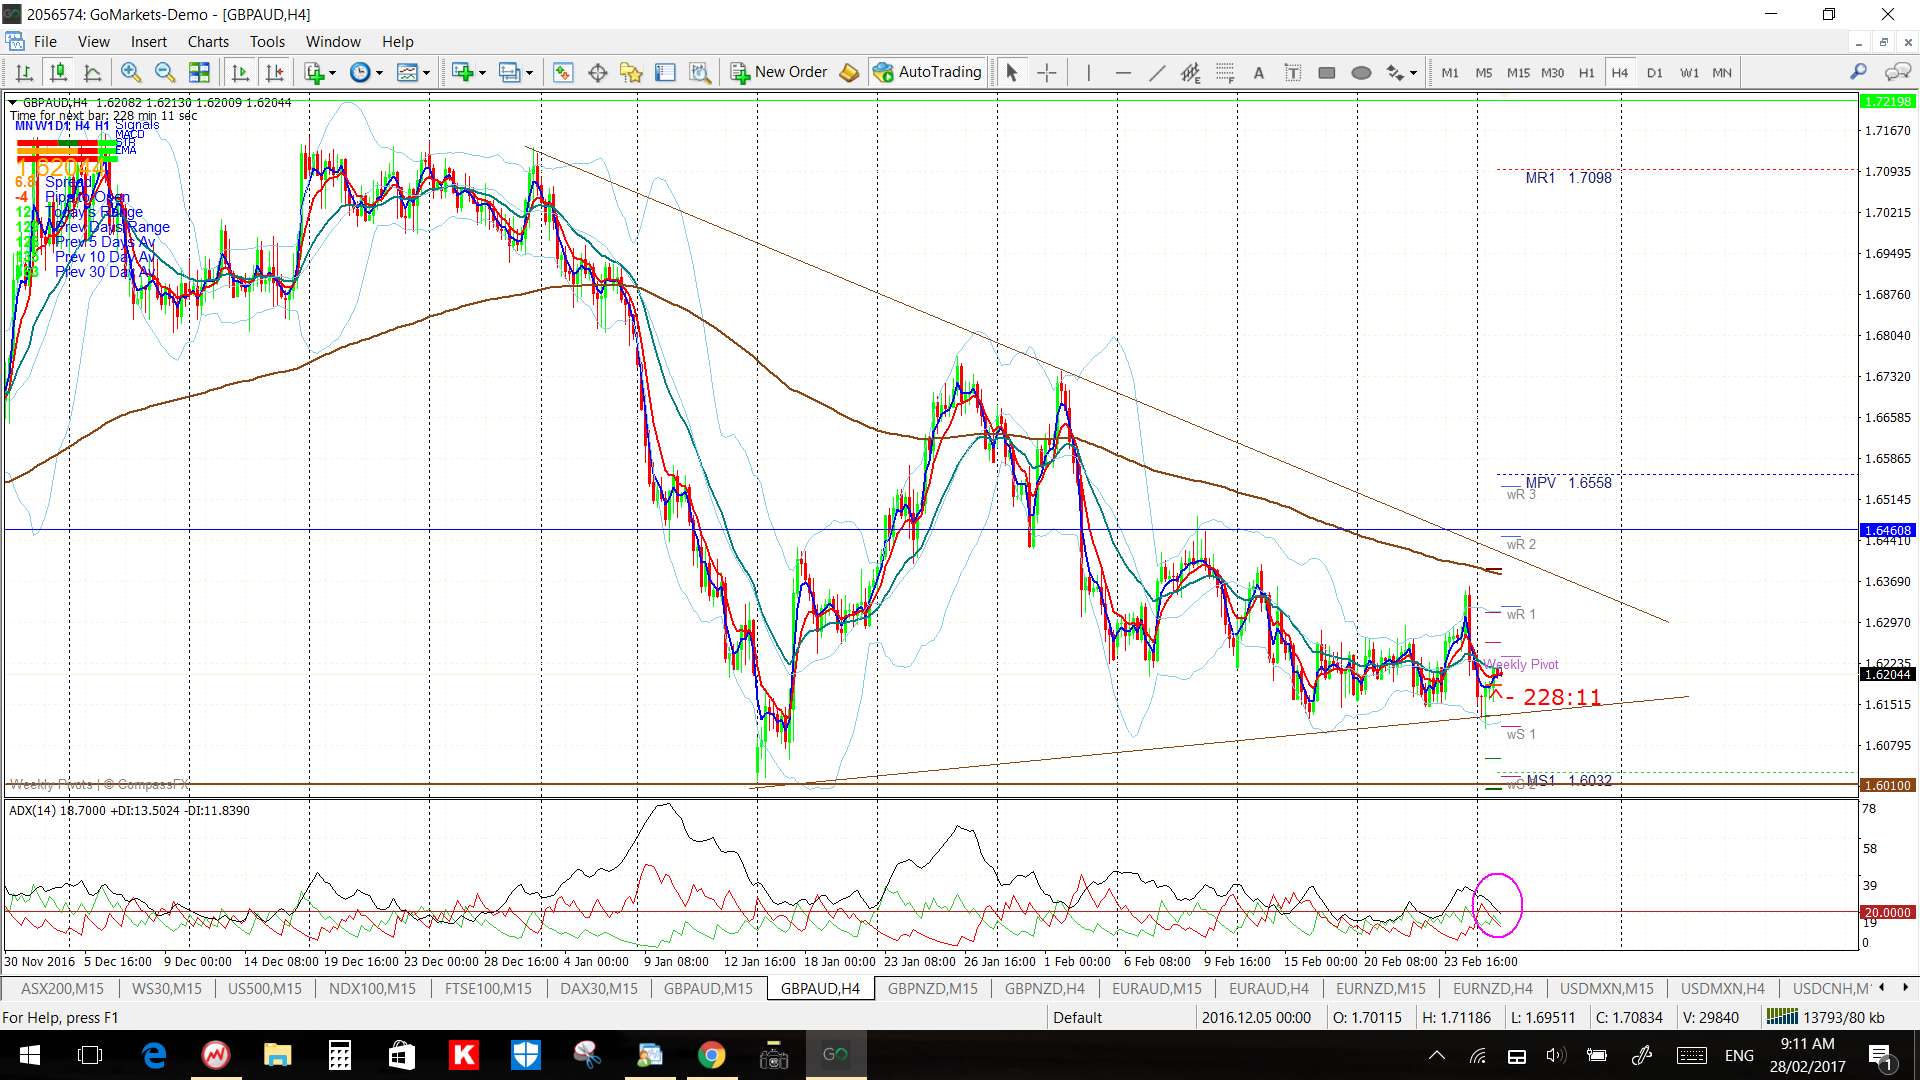
GBP/AUD 4hr: watch for any momentum-based trend line breakout:
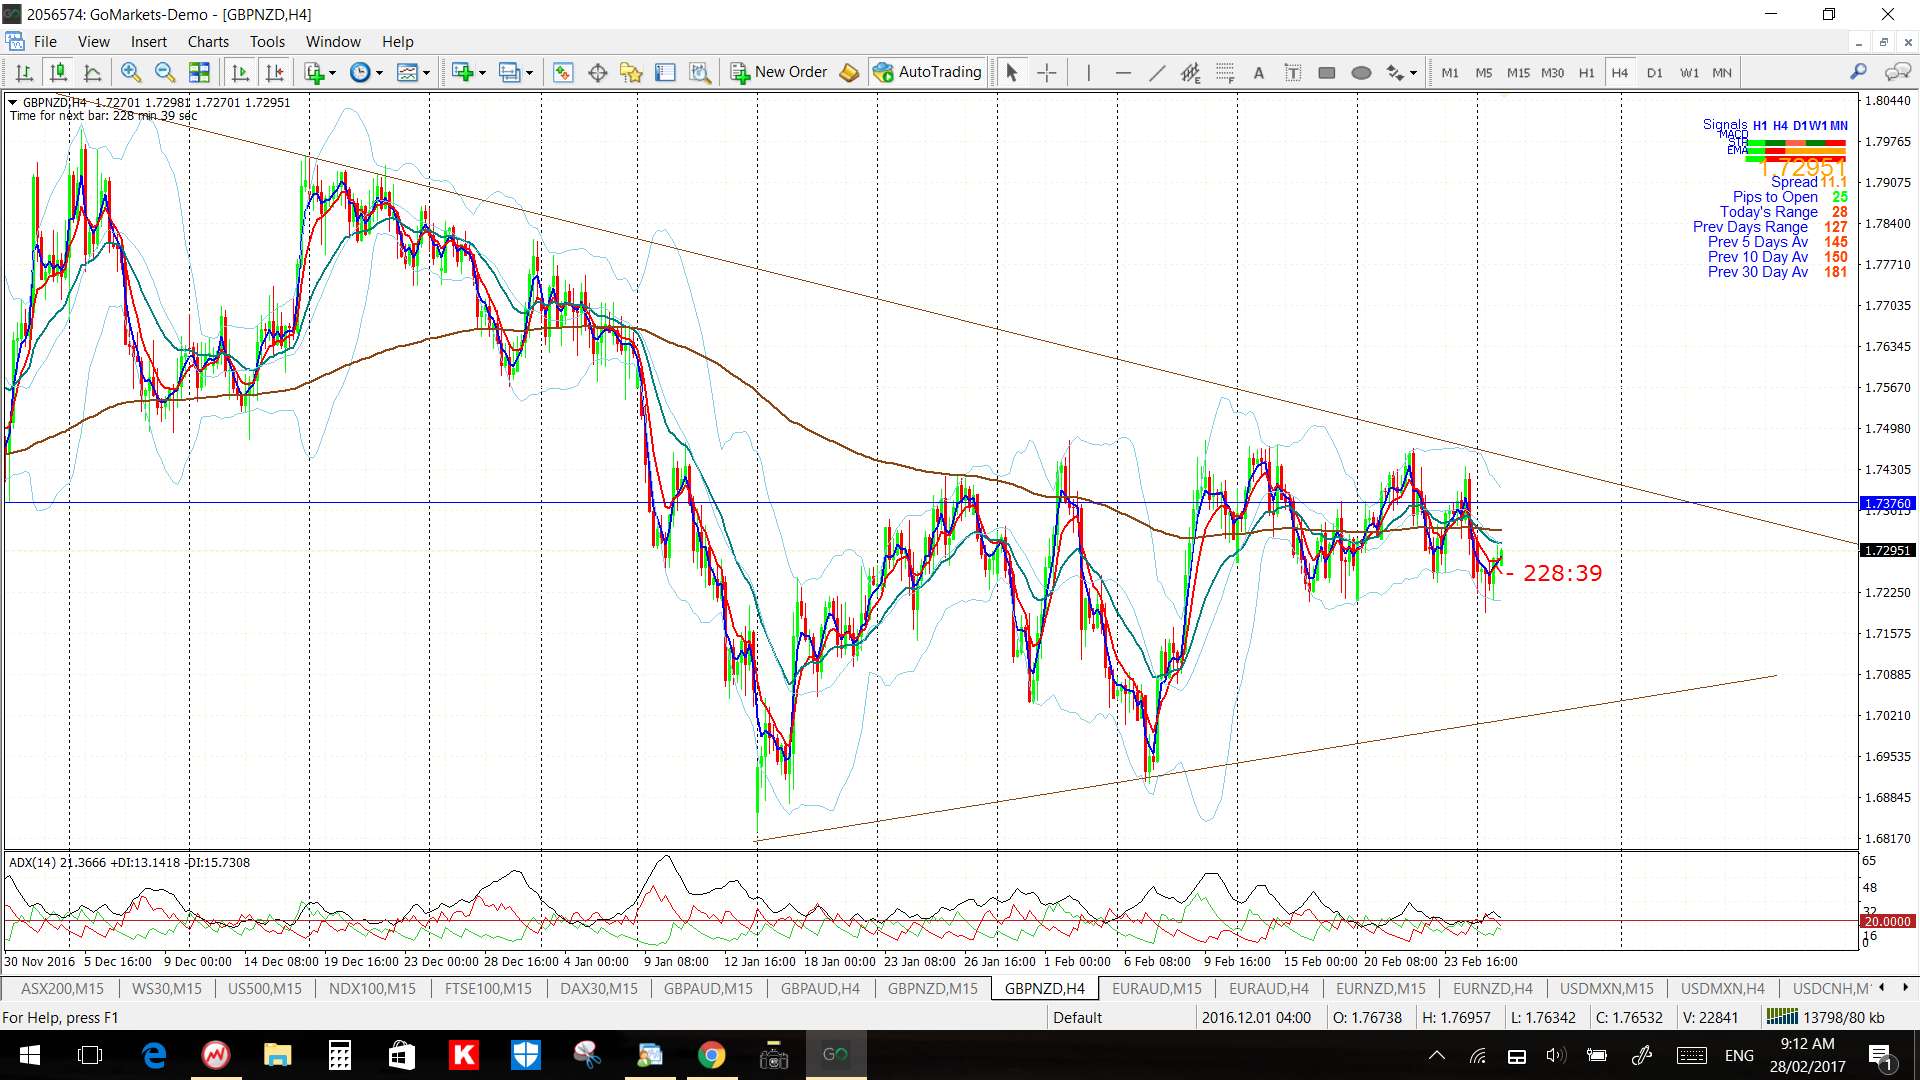
GBP/NZD 4hr: watch for any momentum-based trend line breakout:
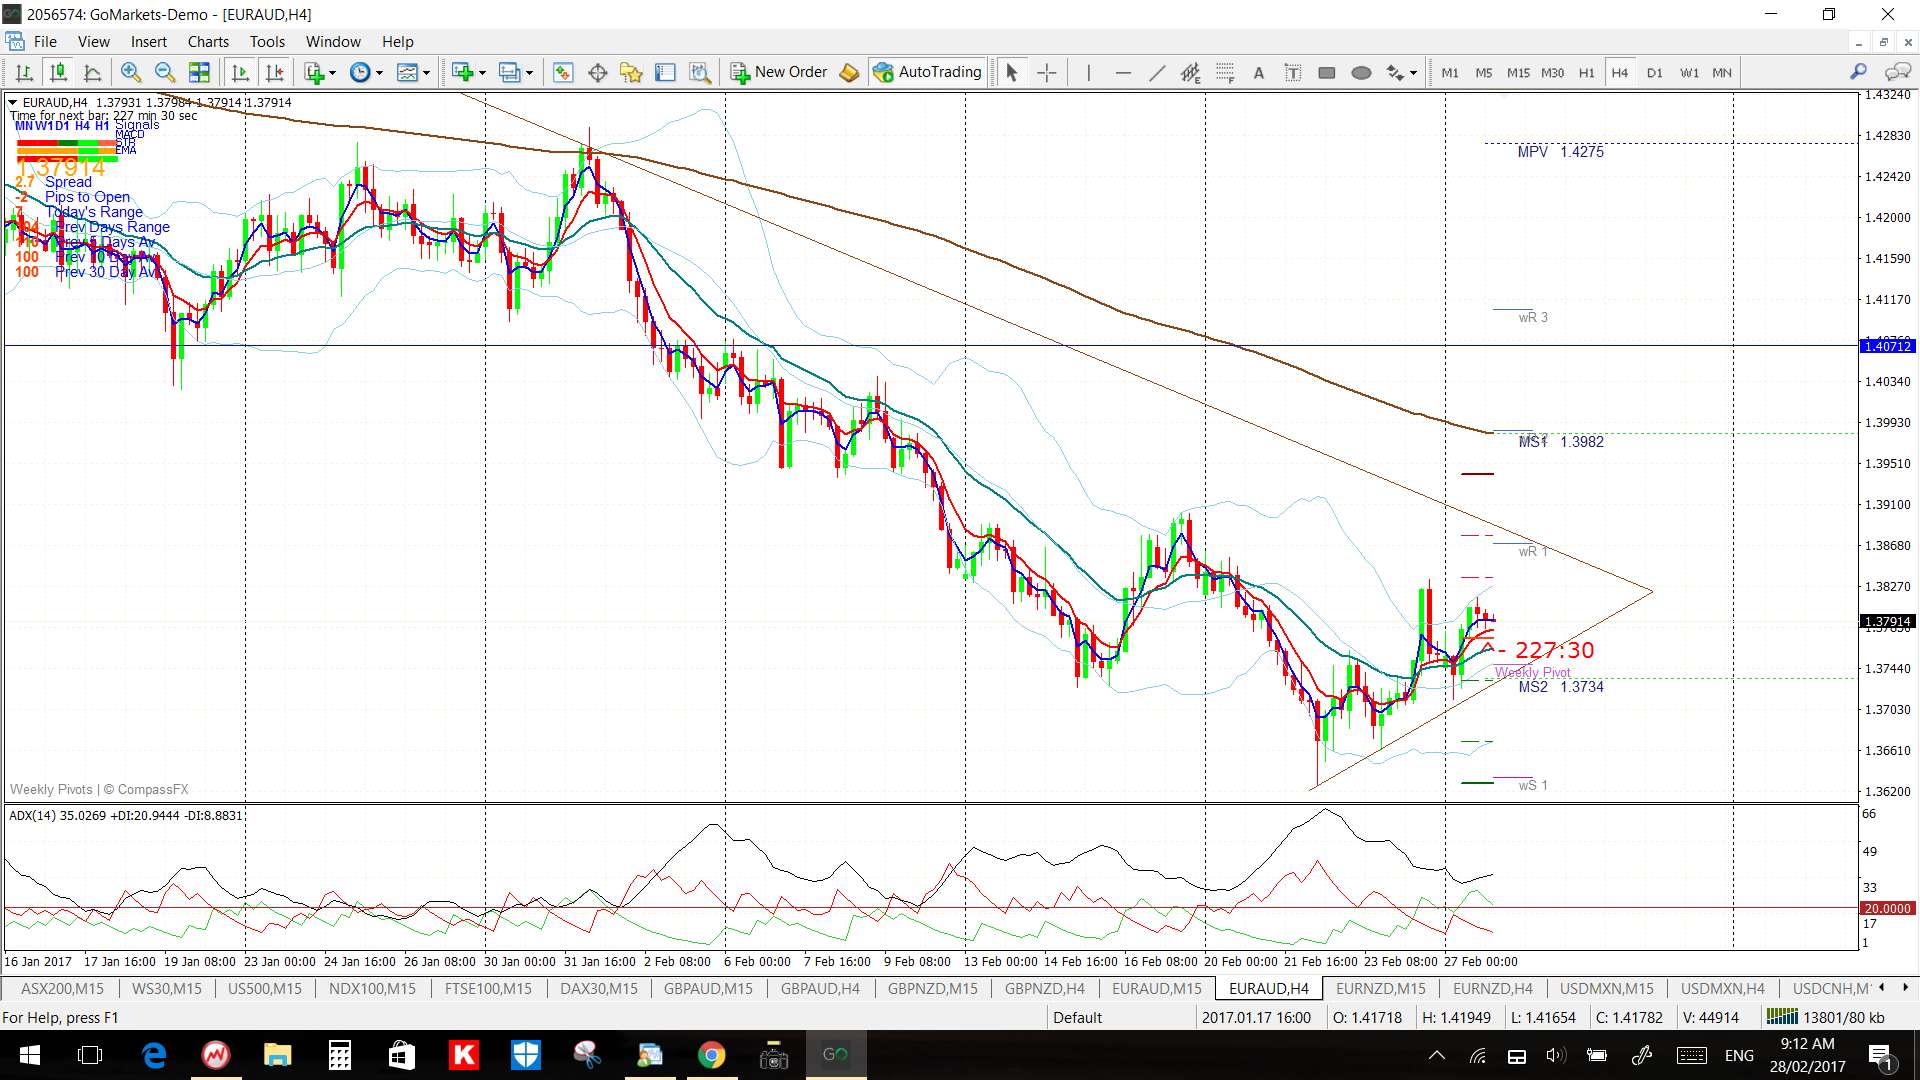
EUR/AUD 4hr: watch for any momentum-based trend line breakout:
EURNZD 4hr: watch for any momentum-based trend line breakout:

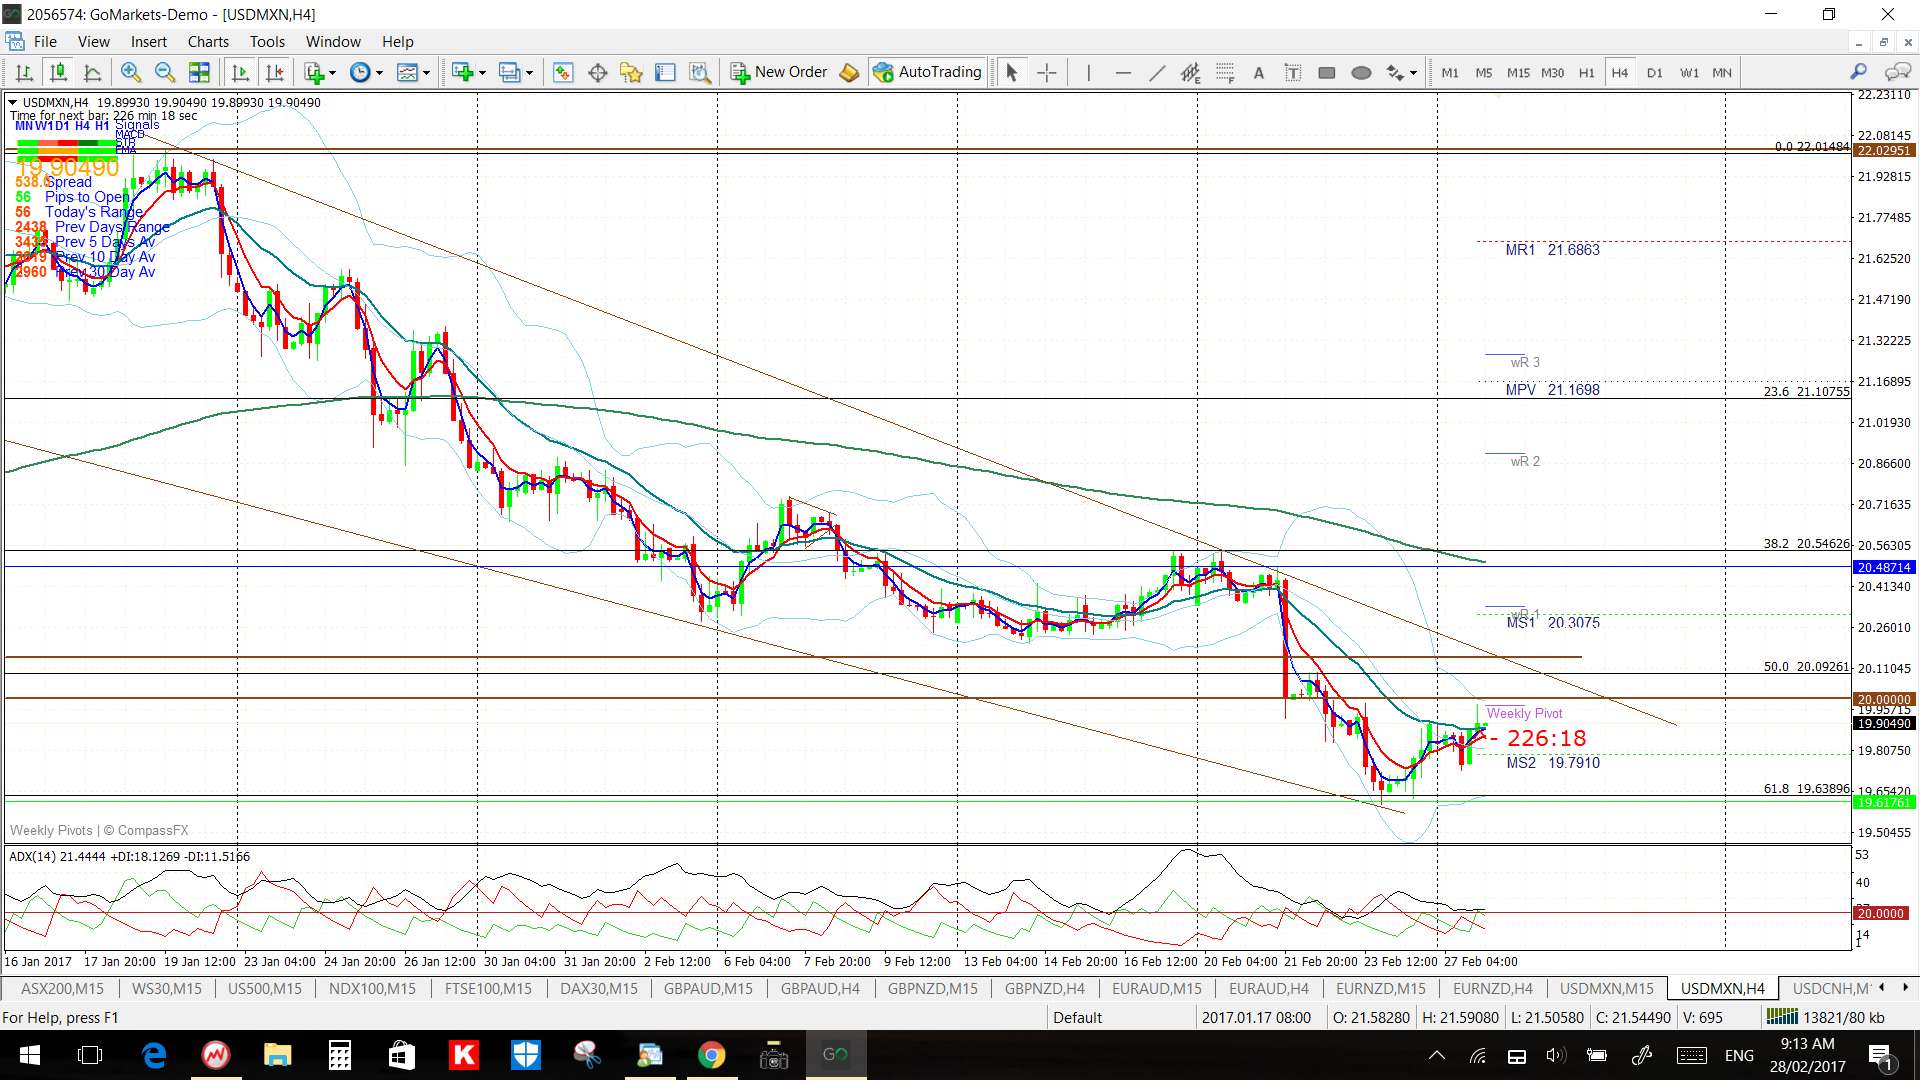
USD/MXN: this pair gives such large moves when it goes that it is worth watching on multiple time frames. There is a channel on the daily and 4hr time frame but it gives decent trend moves within this consolidation:
USD/MXN 4hr: watch for any momentum-based trend line breakout from the 4hr chart’s trading channel.
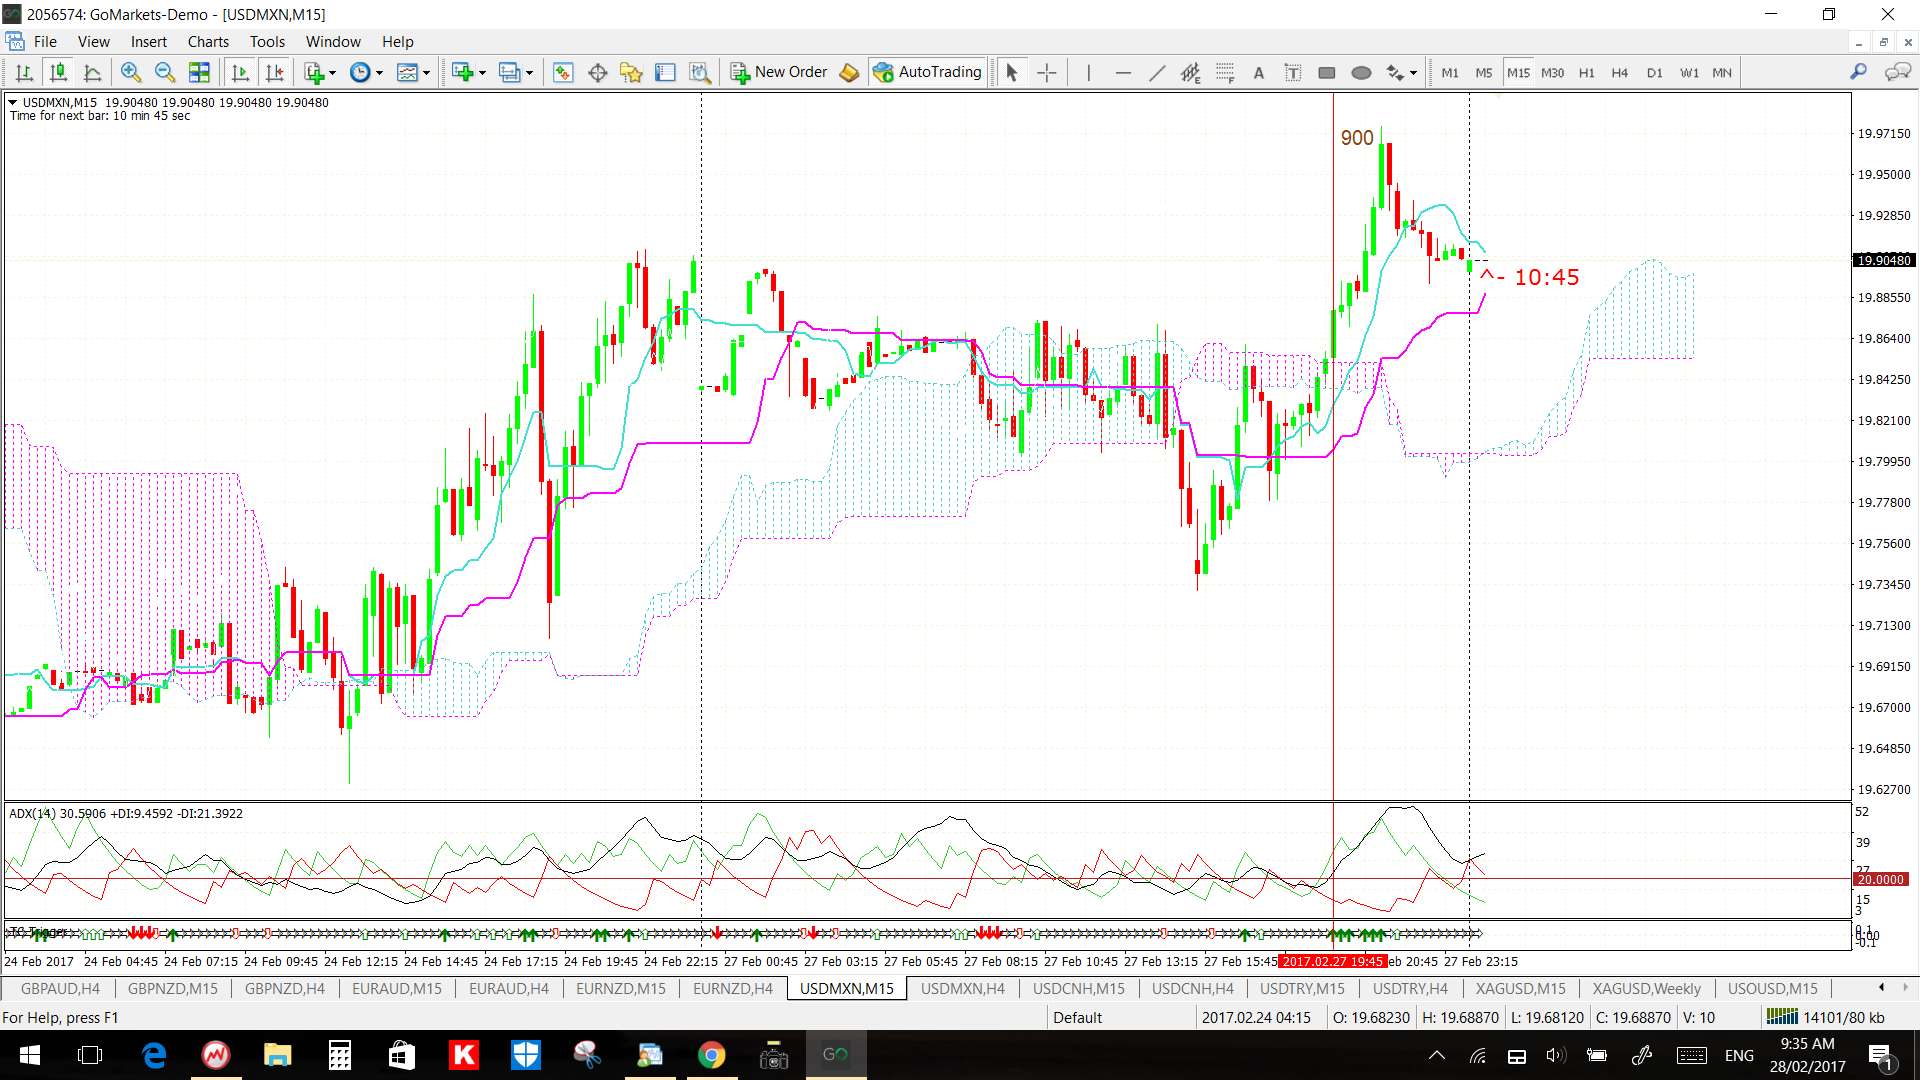
USD/MXN 15 min: Note how the 15 min chart gave one valid signal yesterday and this was during the US session that went on for 900 pips! The earlier bearish Cloud break did not trigger any TC SHORT signal!
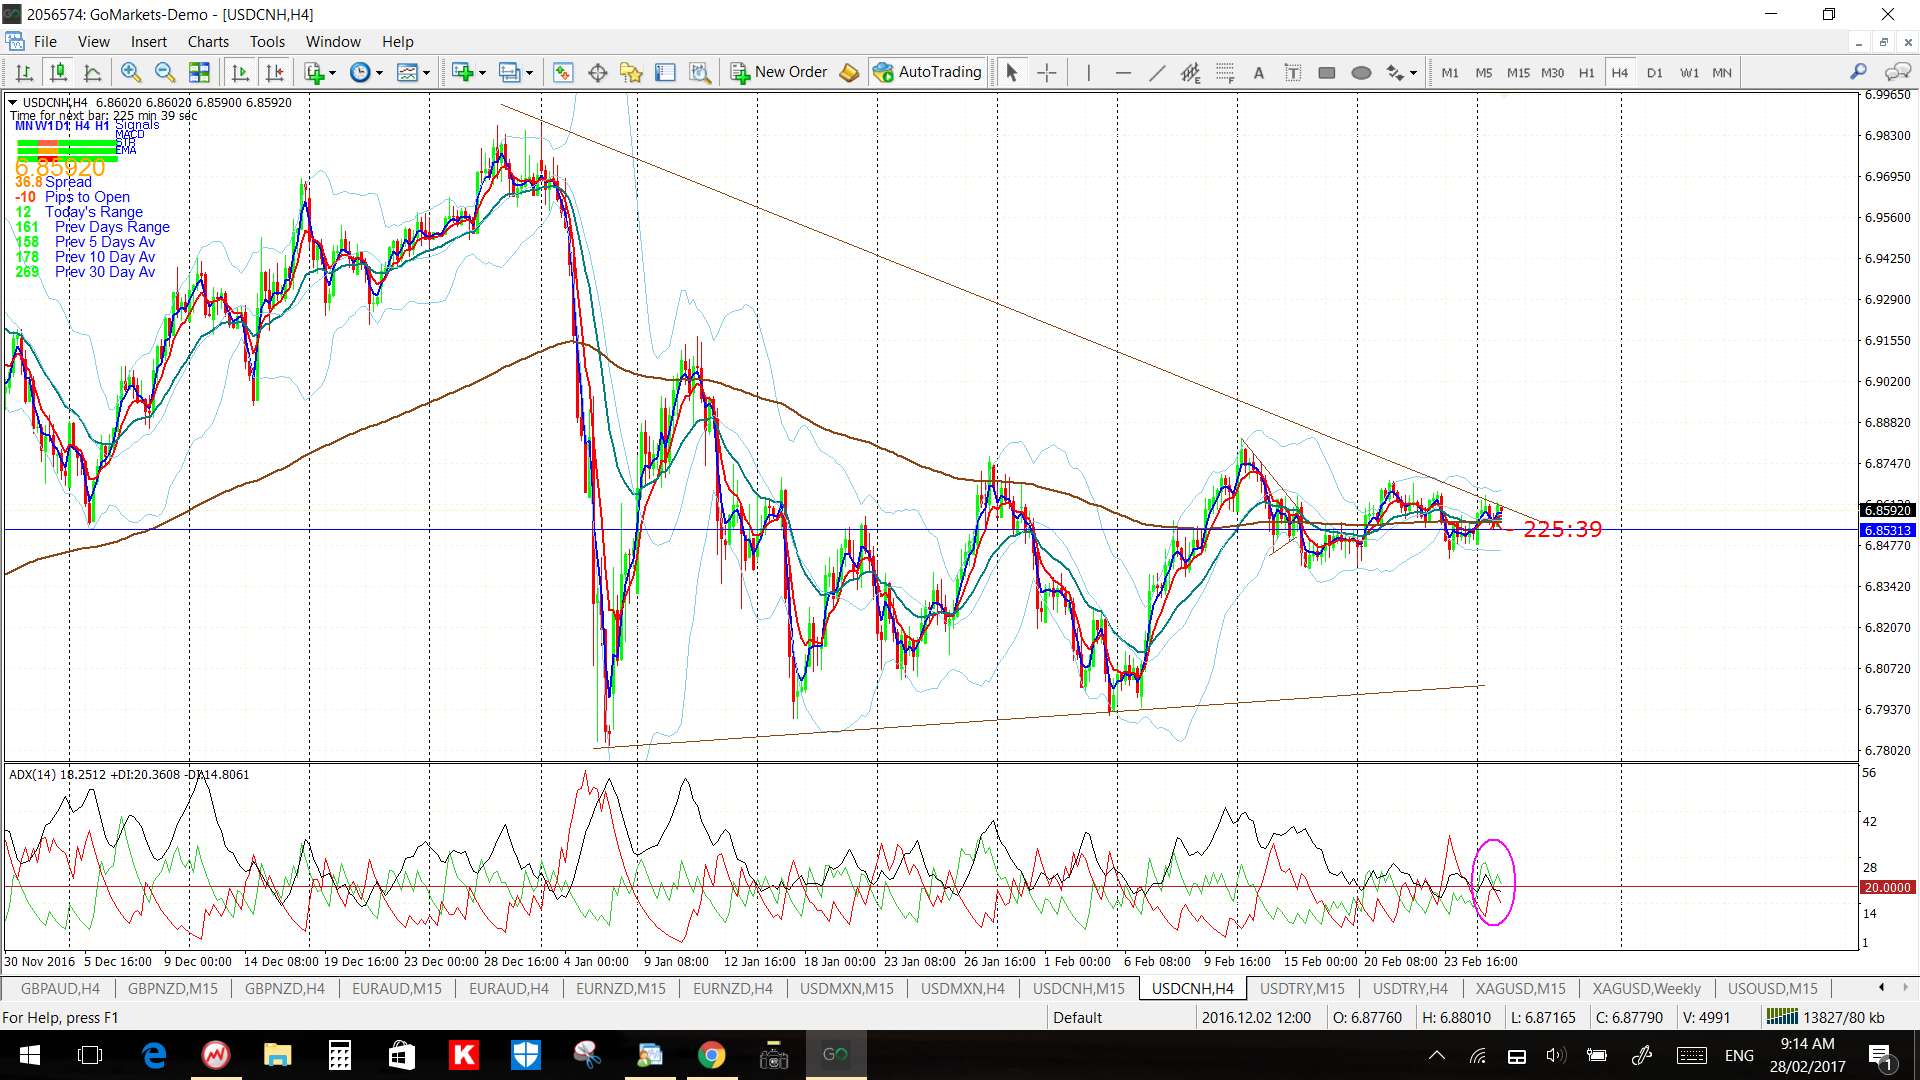
USD/CNH 4hr: watch for any momentum-based trend line breakout:
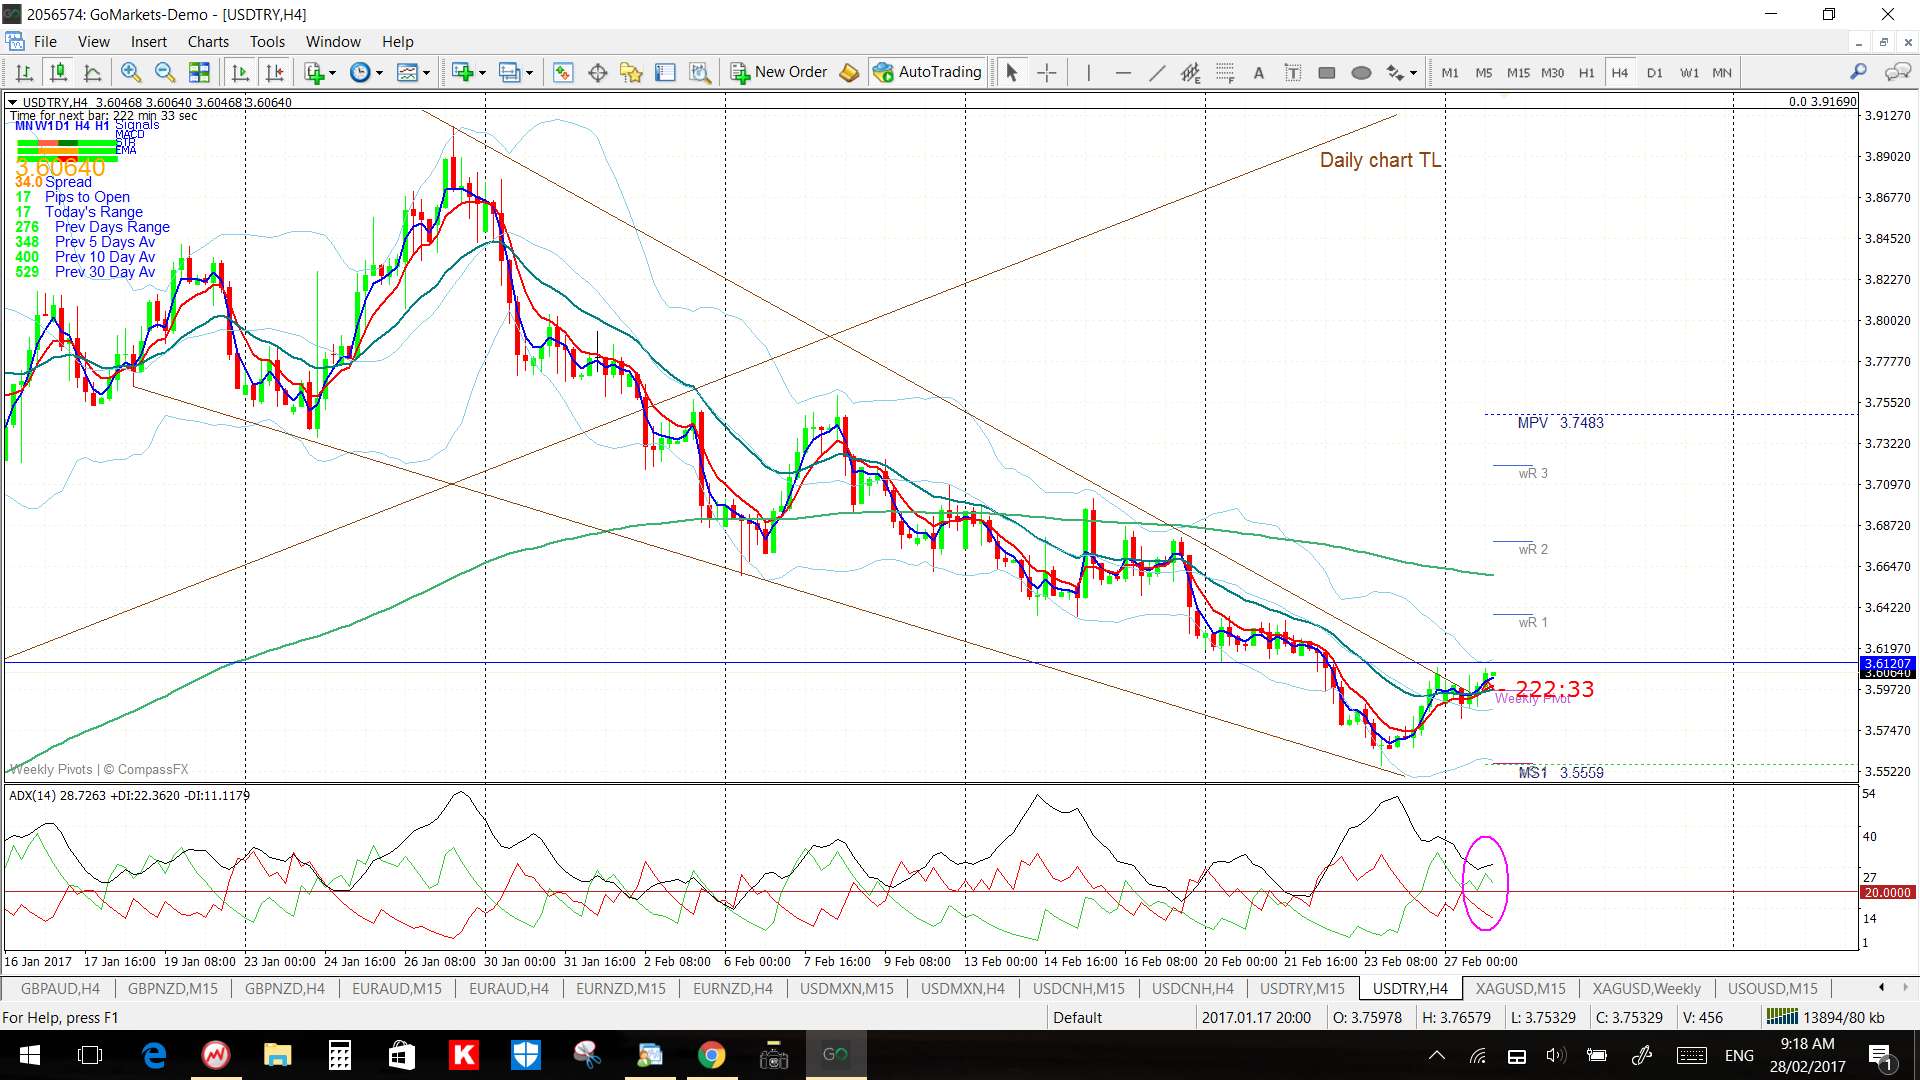
USD/TRY: there looks to be a bullish breakout from this bullish descending wedge. The 15 min chart shows that a new 15 min TC LONG signal came with a break of this trend line for 60 pips. This landscape could all change with Trump speech though!

The post US$: in limbo but helping ‘Trump Triangles’. appeared first on Trade Charting.
The post US$: in limbo but helping ‘Trump Triangles’. appeared first on www.forextell.com.