Last week: Choppy US$ action has meant few TC signals again but one on the Kiwi from the previous week gave up to 120 pips before closing. Many trading instruments remain the victim of the fluctuating sentiment with the US$ and this looks set to continue as the question about the timing of any US interest rates rise remains unanswered. Whether this is the right question for the markets to be focused on seems quite irrelevant at the moment.
This week:
The US$ recovered a bit last week with the help of Friday’s US CPI but it still has some resistance in its path before it can attempt the 100 level again. Whether this period simply marks a pause in bearish reversal for the US$ or the resumption of the longer-term bullish trend remains unclear. There is still great focus on just when the US Federal Reserve will raise interest rates and the US$ and, as a consequence, many FX pairs continue to fluctuate with the ups and downs of this sentiment. There is a lot of US$-sensitive data, Fed speeches and three days of G7 meetings to potentially impact the US$ this week but Friday’s Prelim GDP figure may prove to be the focal point. An update on the FX Indices can be found through this link.
Monday is a public holiday in many trading regions: CHF, EUR (France & Germany), GBP and USD.
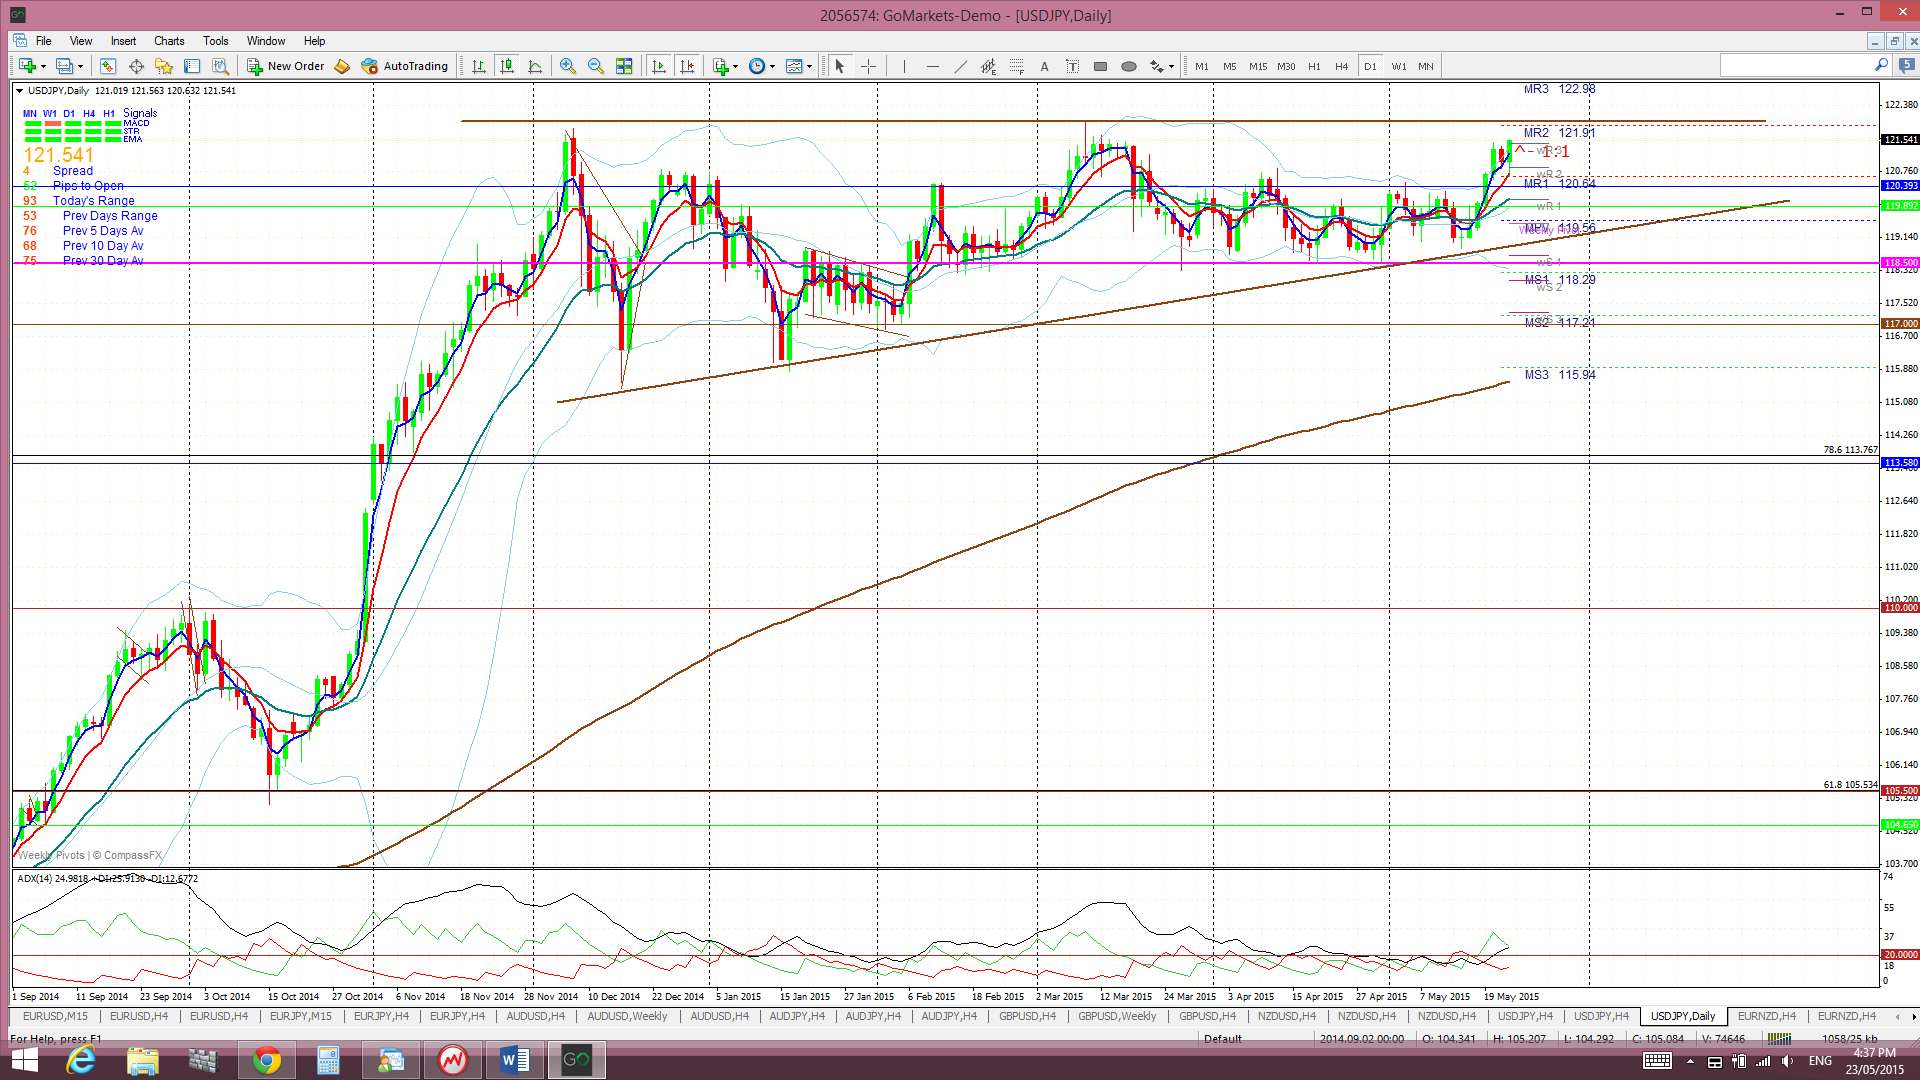
USD/JPY: this is getting close to the upper trend line of a 6-month ascending triangle pattern. Is a bullish breakout on the way or another bounce reversal?
There were ECB Central Bank meetings over the w/e so watch for any possible FX impact from these at Monday open. The Greek-debt situation remains a major topic of discussion and there is no solution to this in sight as yet, as well, we now have the term Brexit to add to our trading lexicon as well as Grexit!
Friday is the last trading day of the month and so monthly candles will close at the end of the week.
Events in the Ukraine and the Middle East, as well as with Greek Debt talks, continue to have the potential to undermine any developing ‘risk’ appetite and need to be monitored.
Stocks and broader market sentiment:
Many stock indices ended up posting bullish weekly candles except for the major S&P500 and DJIA. Trading has been choppy though as uncertainty about the timing of any US interest rate hike remains.
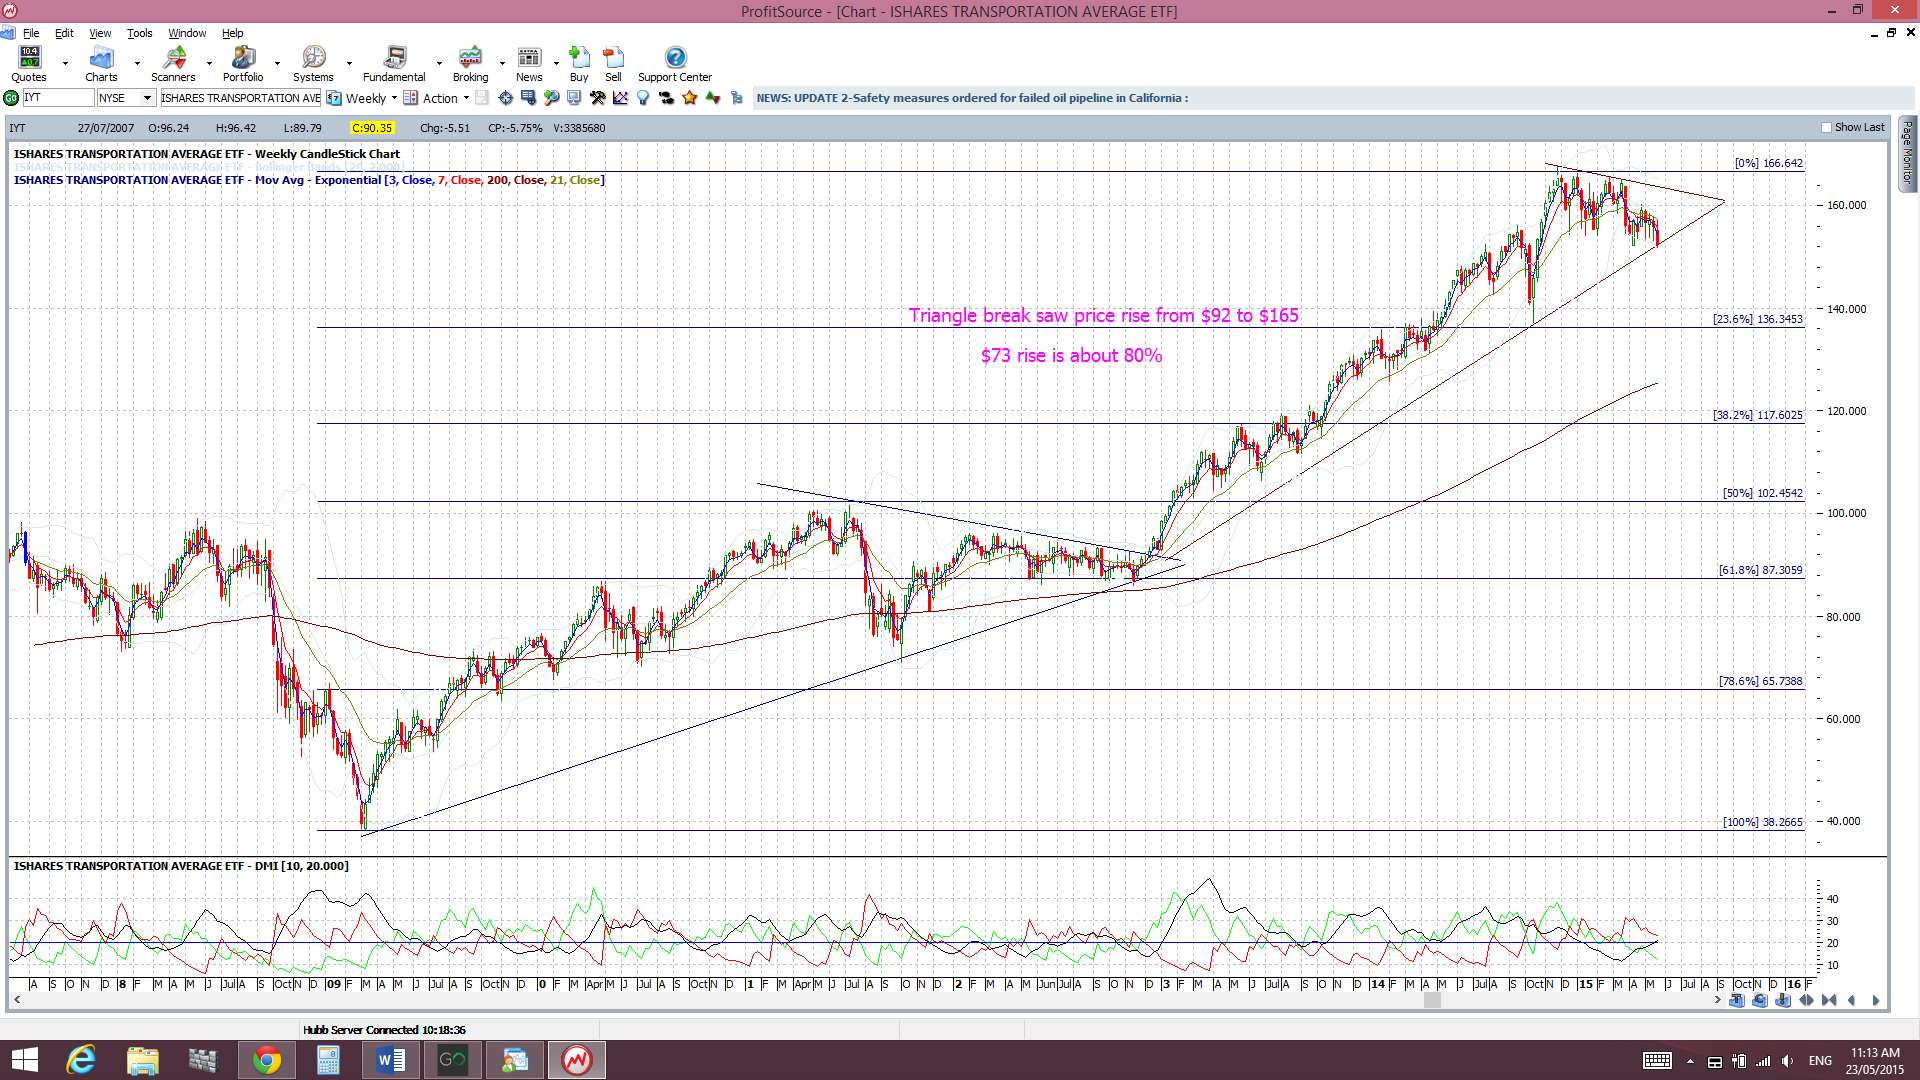
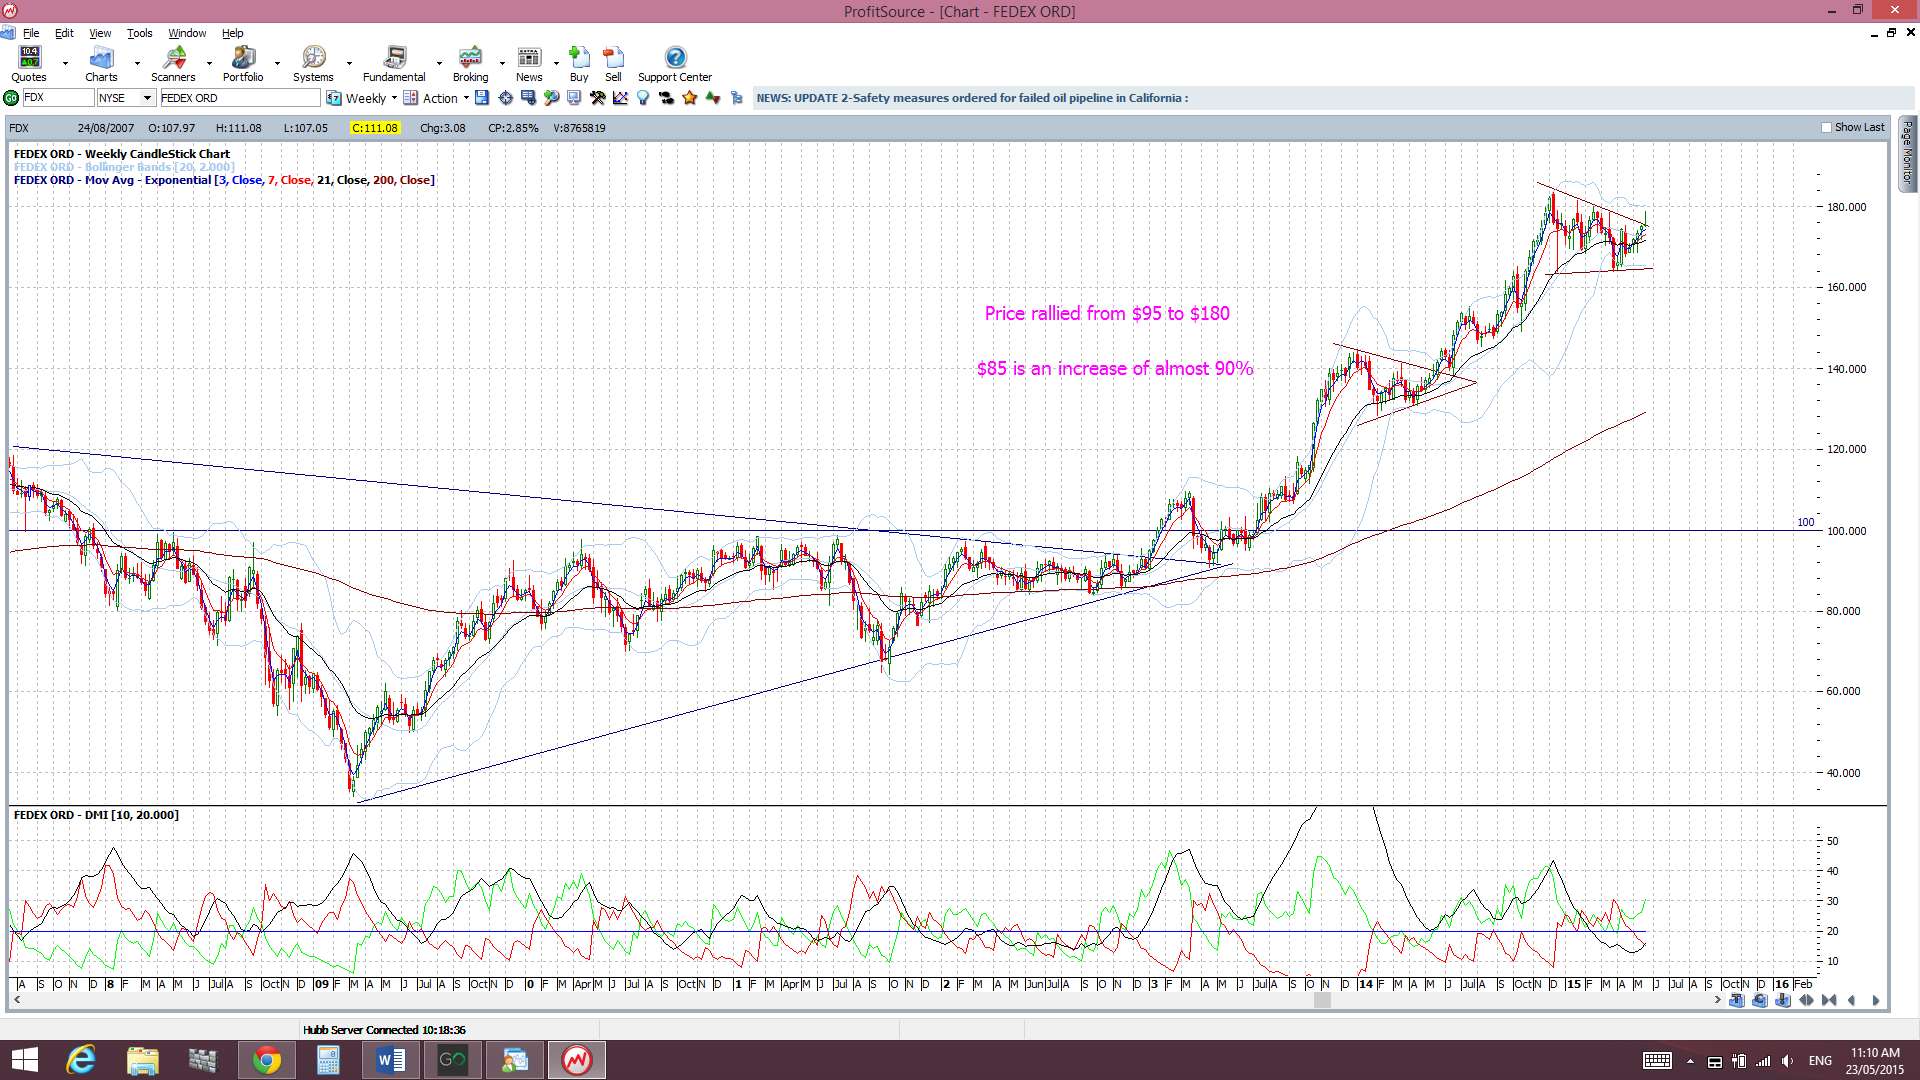
There has been commentary about the US ‘Transports’ being down with this reflecting a potential slowing US economy. However the transport ETF, whilst having a bearish week, is still above support for the time being. Also, Fedex actually looks to be trying for a bullish breakout! (click on charts to enlarge image)
IYT Transport ETF:
FDX: Fedex weekly:
Thus, I continue to watch out for further clues as to any new momentum move, long or short though! In particular I’m looking out for:
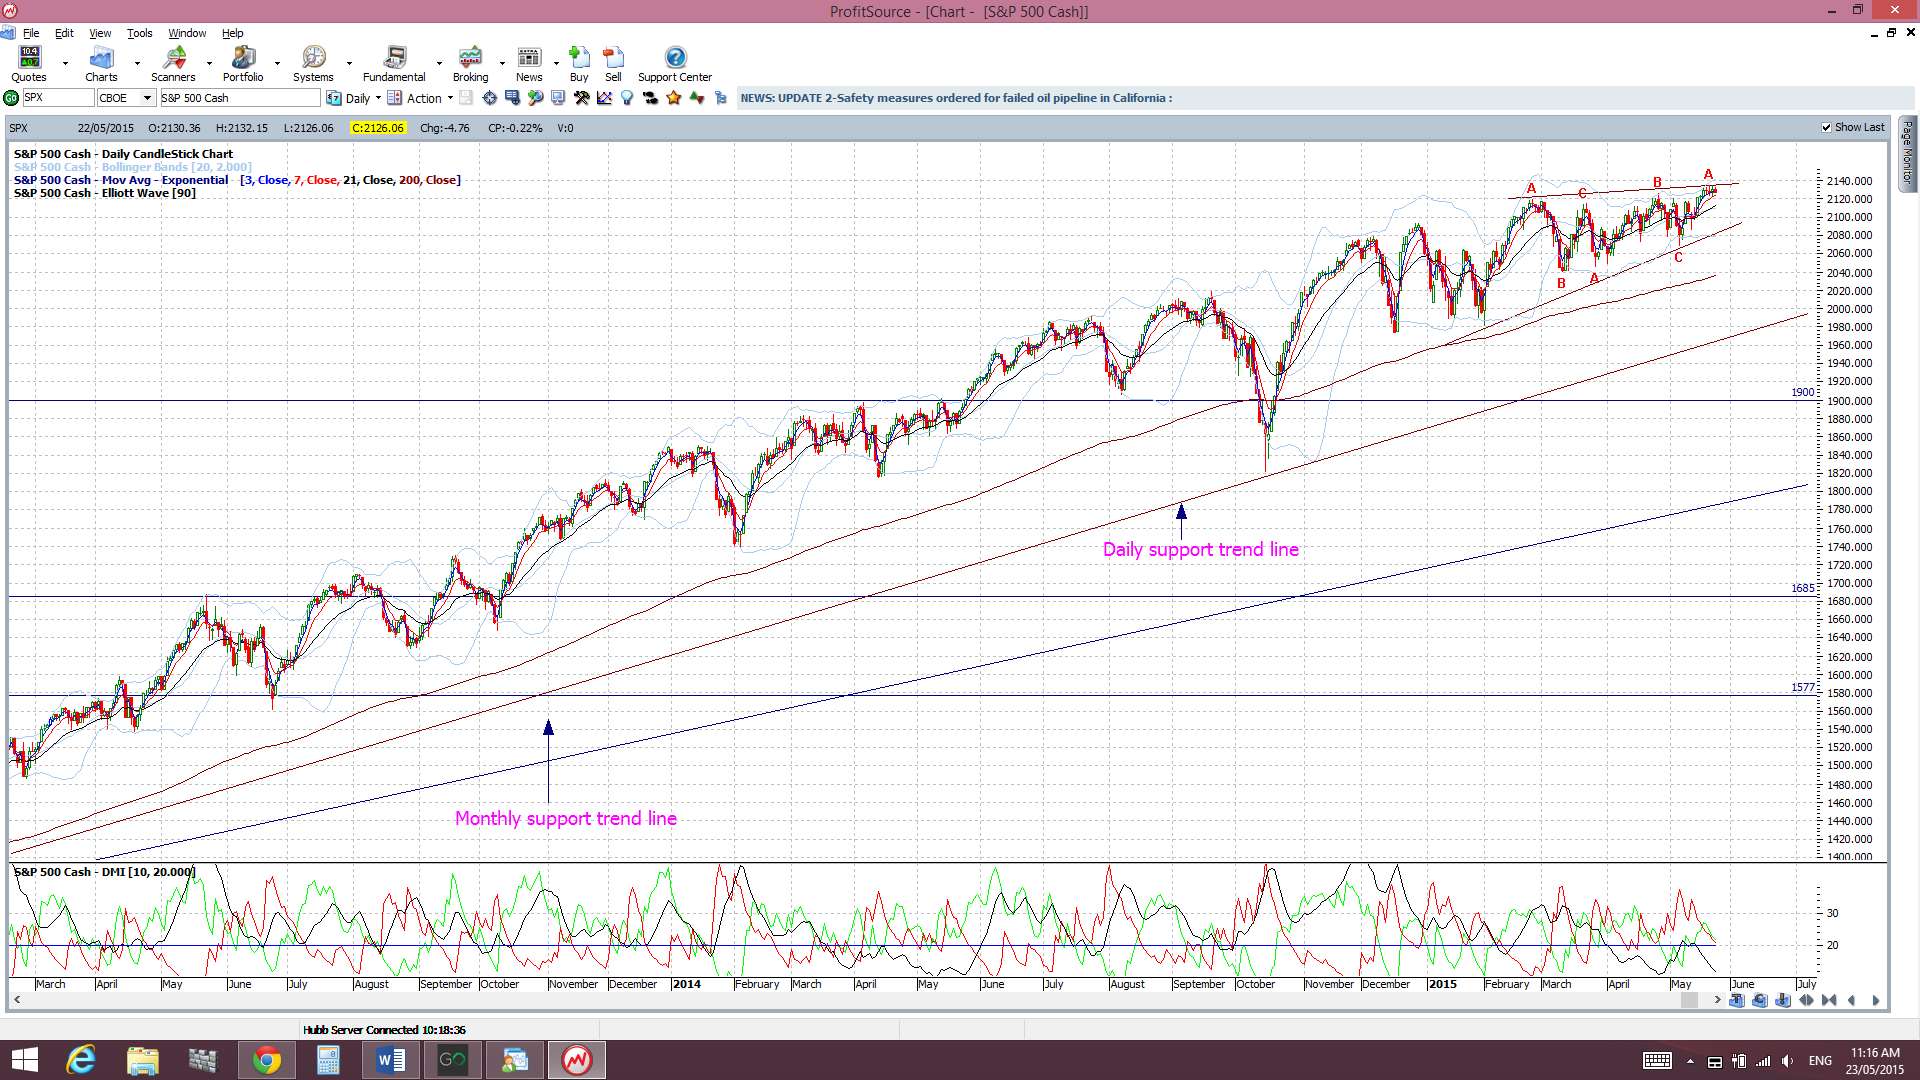
S&P500 daily chart: The index is still trading above the psychological 2,100 level and above daily trend line support. The possible bearish ascending wedge is still in play though and so I’ll keep watching these trend lines:
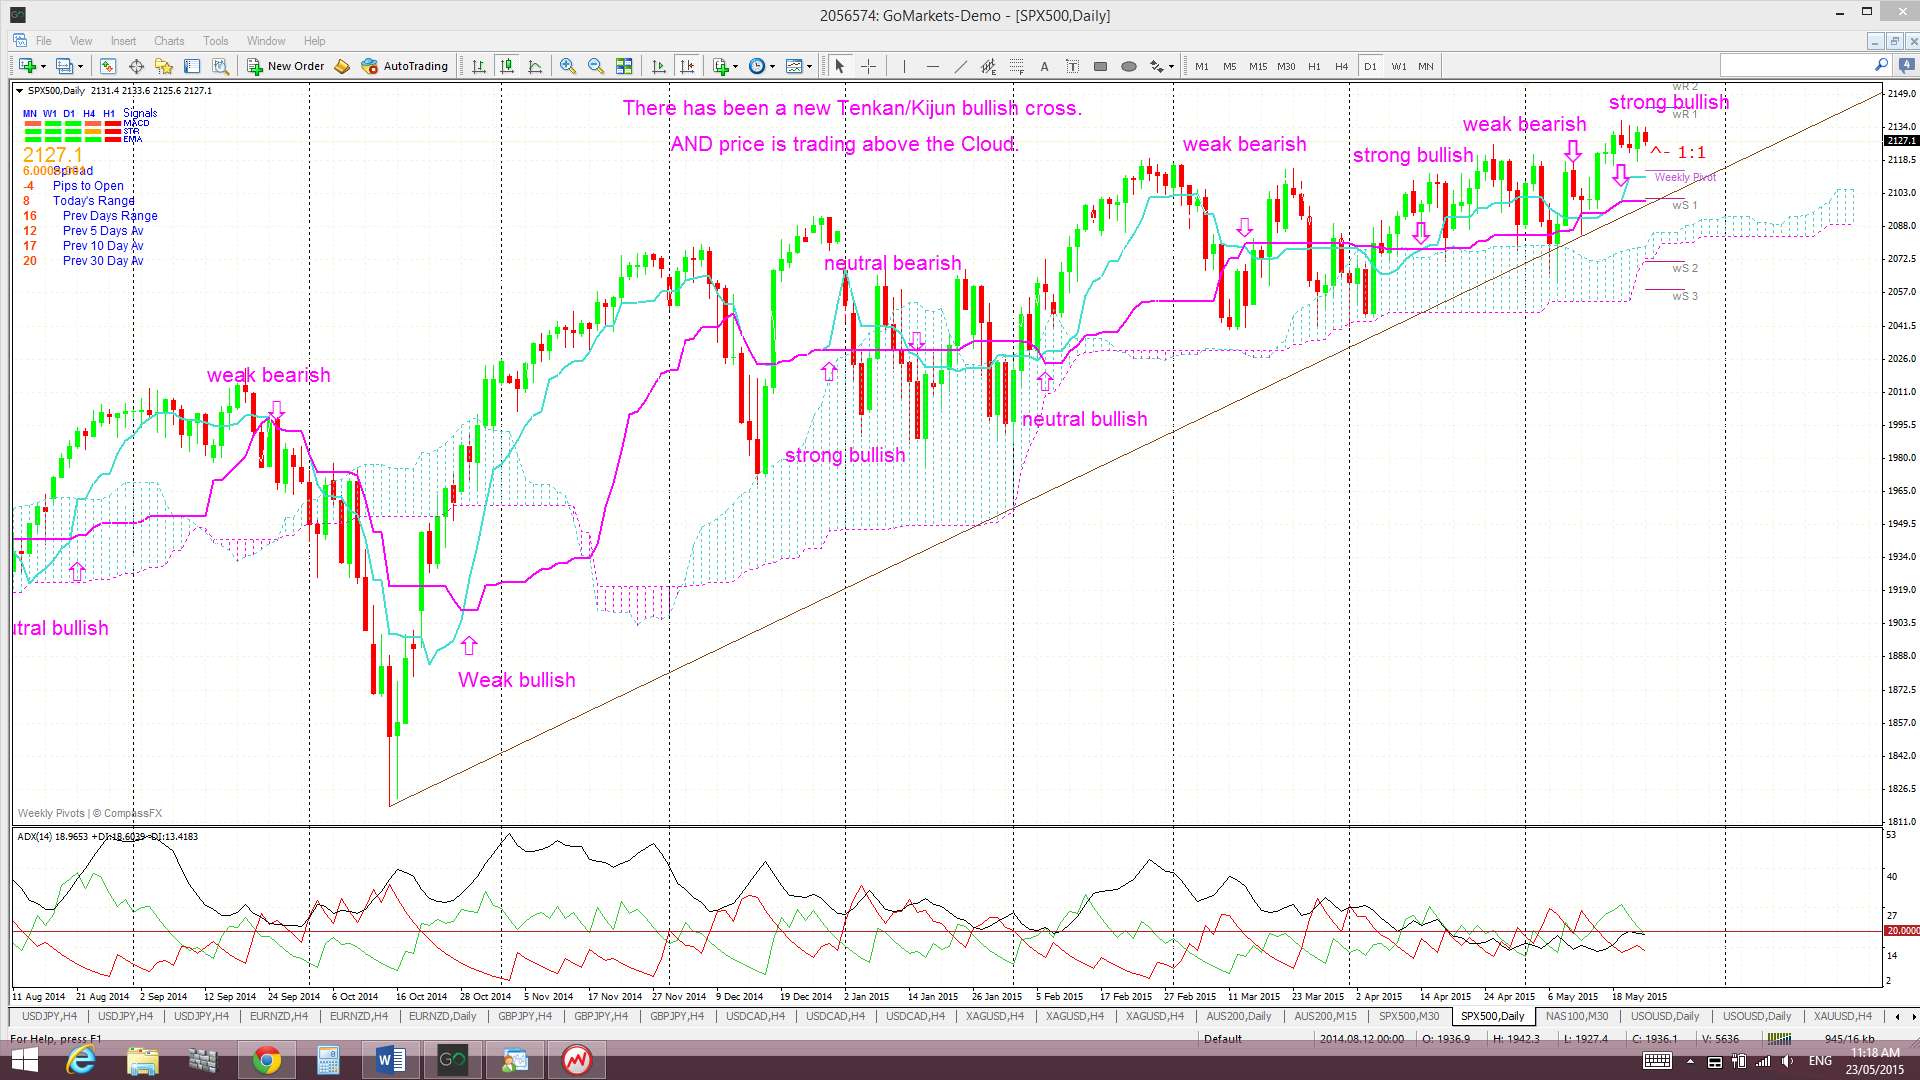
Ichimoku S&P500 chart: a clear cross of the blue Tenkan-sen line below the pink Kijun-sen line. There has been a recent bullish Tenkan/Kijun cross here and this evolved above the Cloud and so is deemed a ‘STRONG’ signal. We need to see the Tenkan and Kijun lines tick upwards though to endorse this signal:
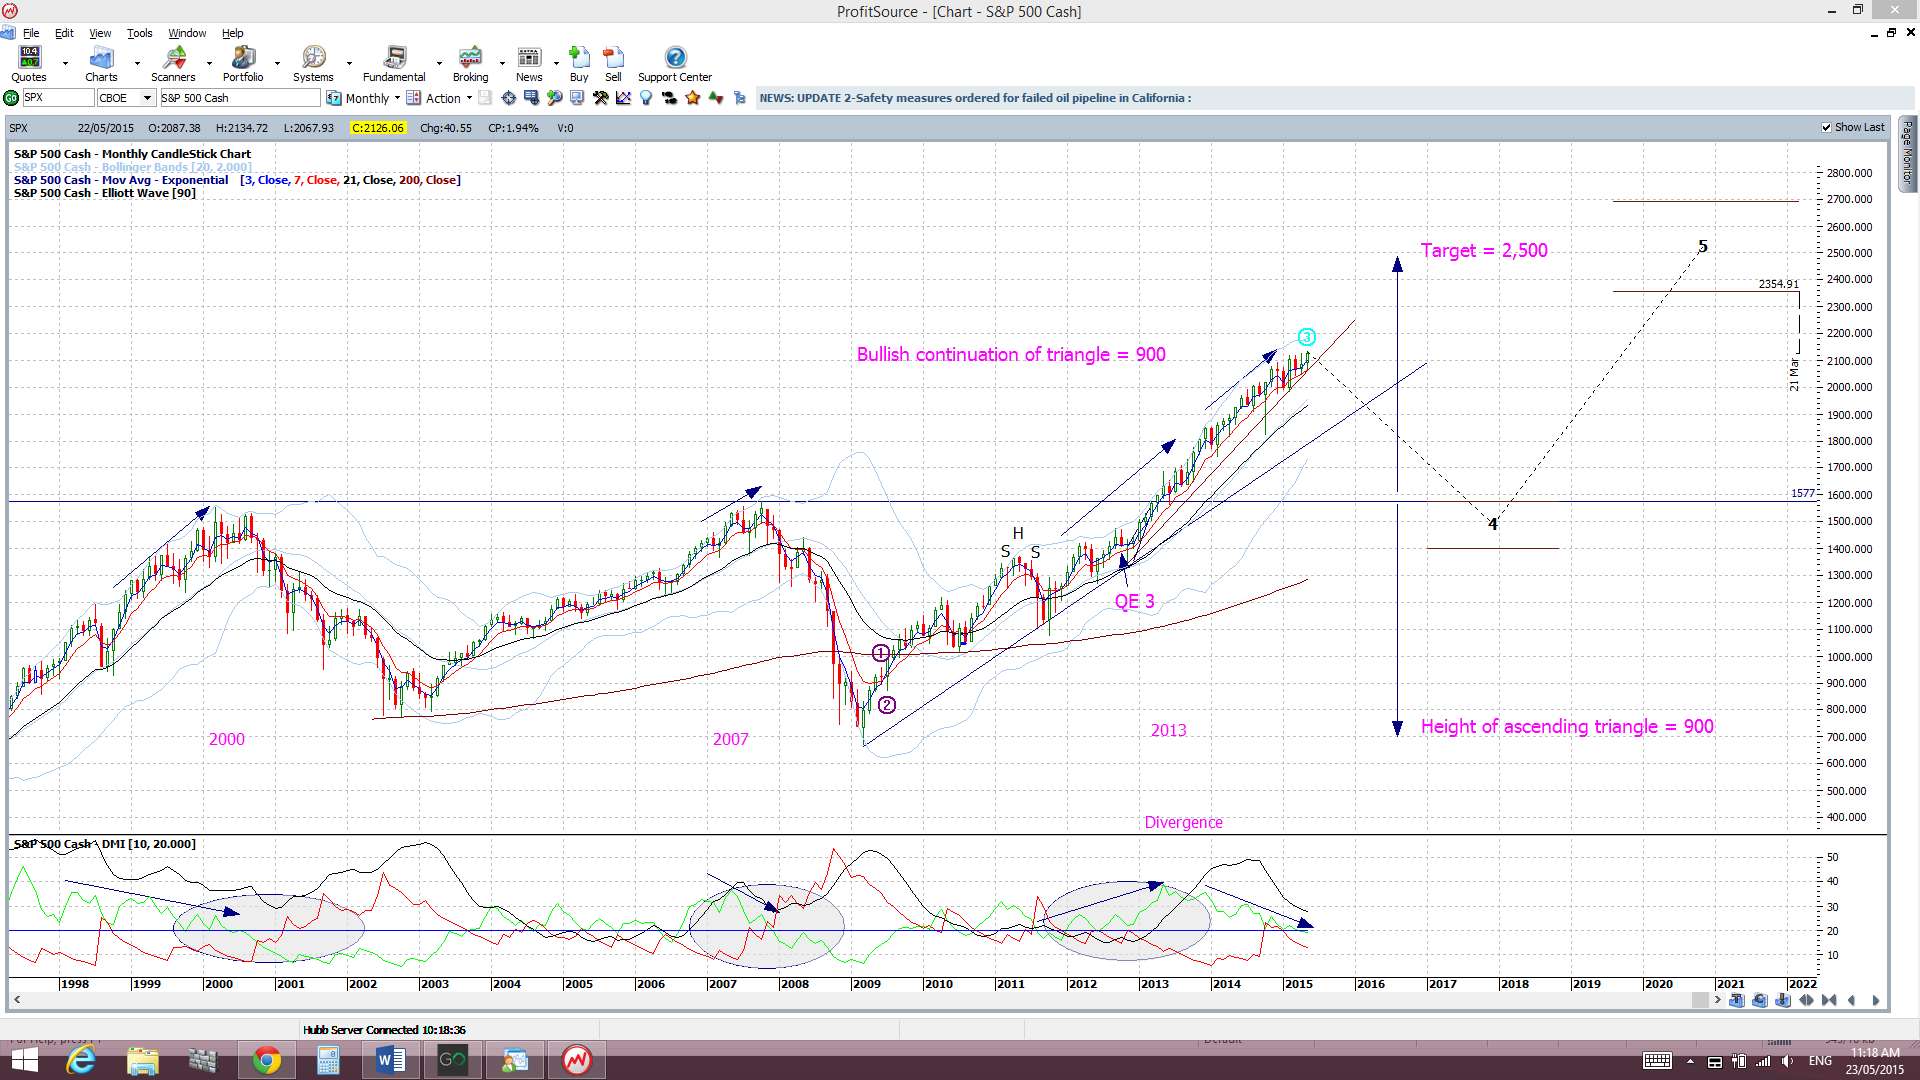
S&P500 monthly chart: a break of the monthly support trend line. The monthly trend line remains intact. A break of this support level would suggest to me of a more severe pull back or correction.
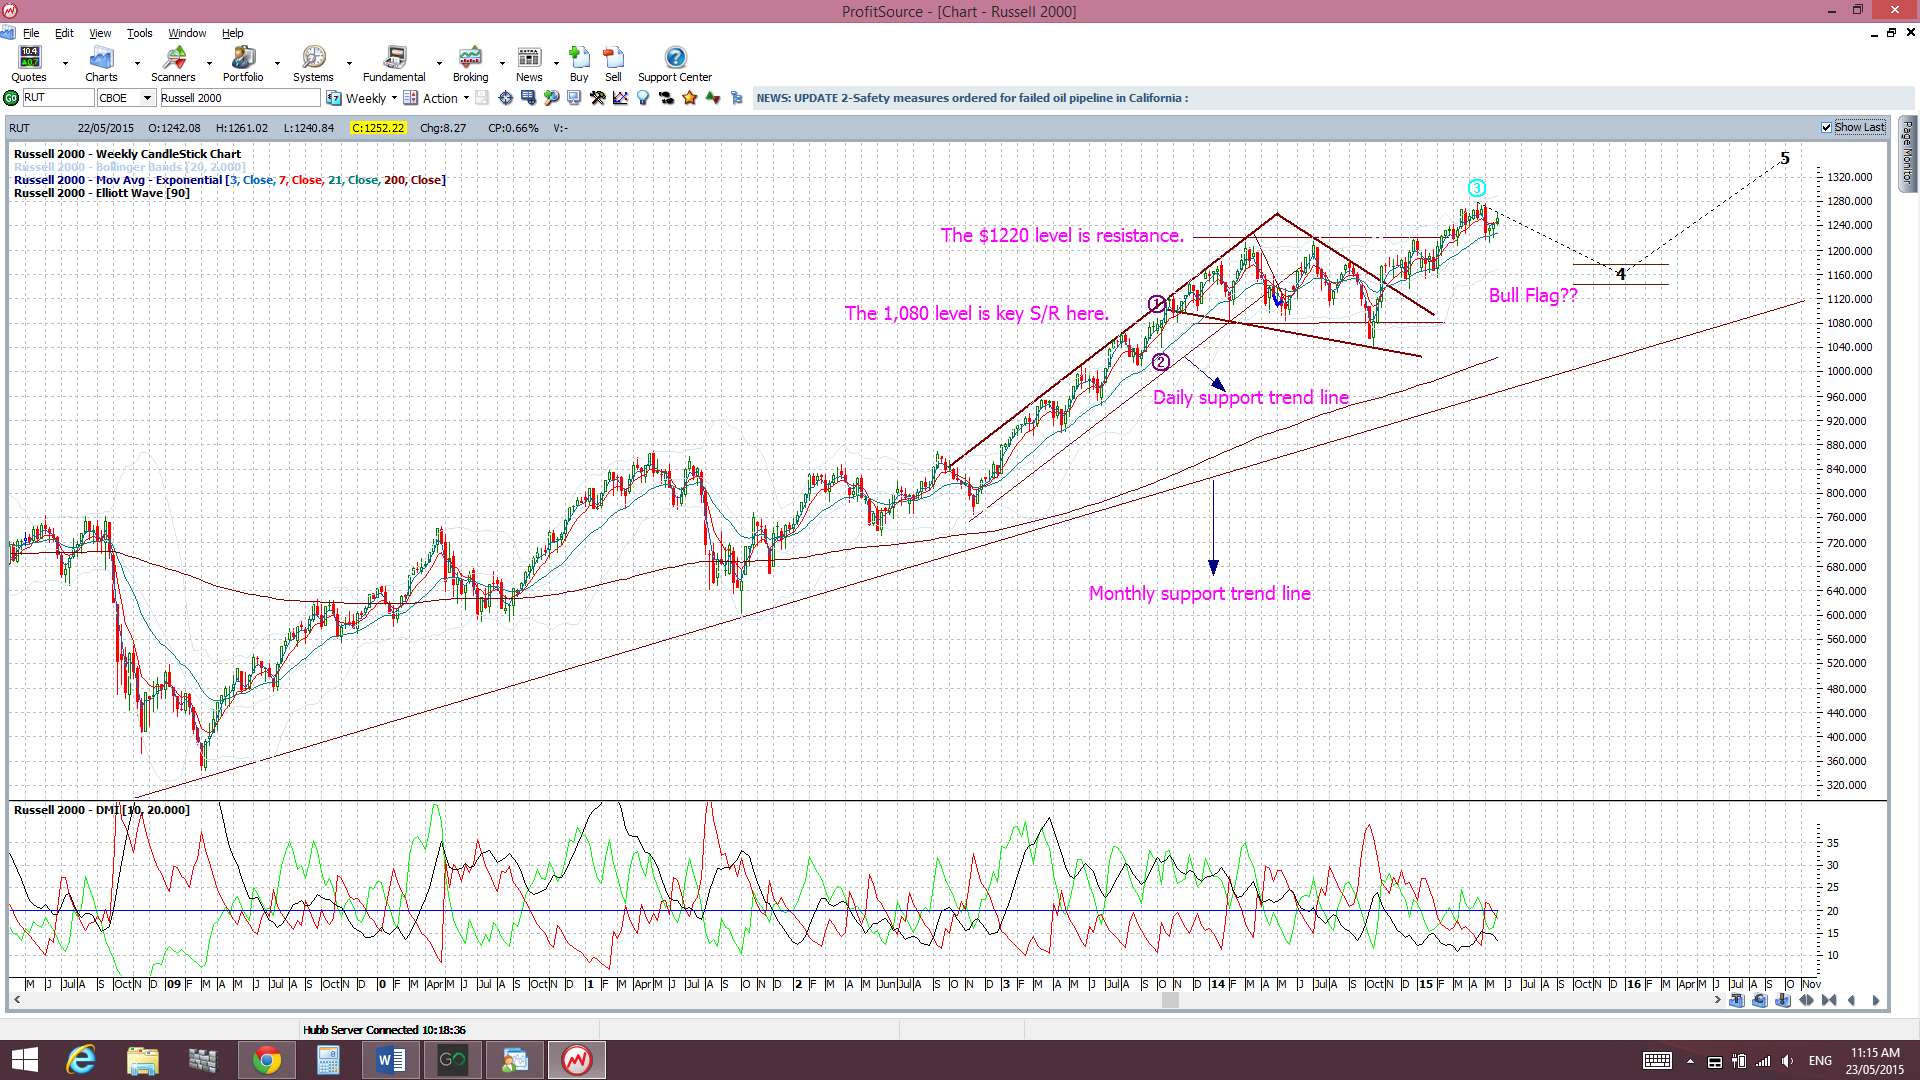
Russell 2000 Index: this small caps index is considered a US market ‘bellwether’. This is still trading above the key 1,220 level and printed a bullish, albeit small, weekly candle.
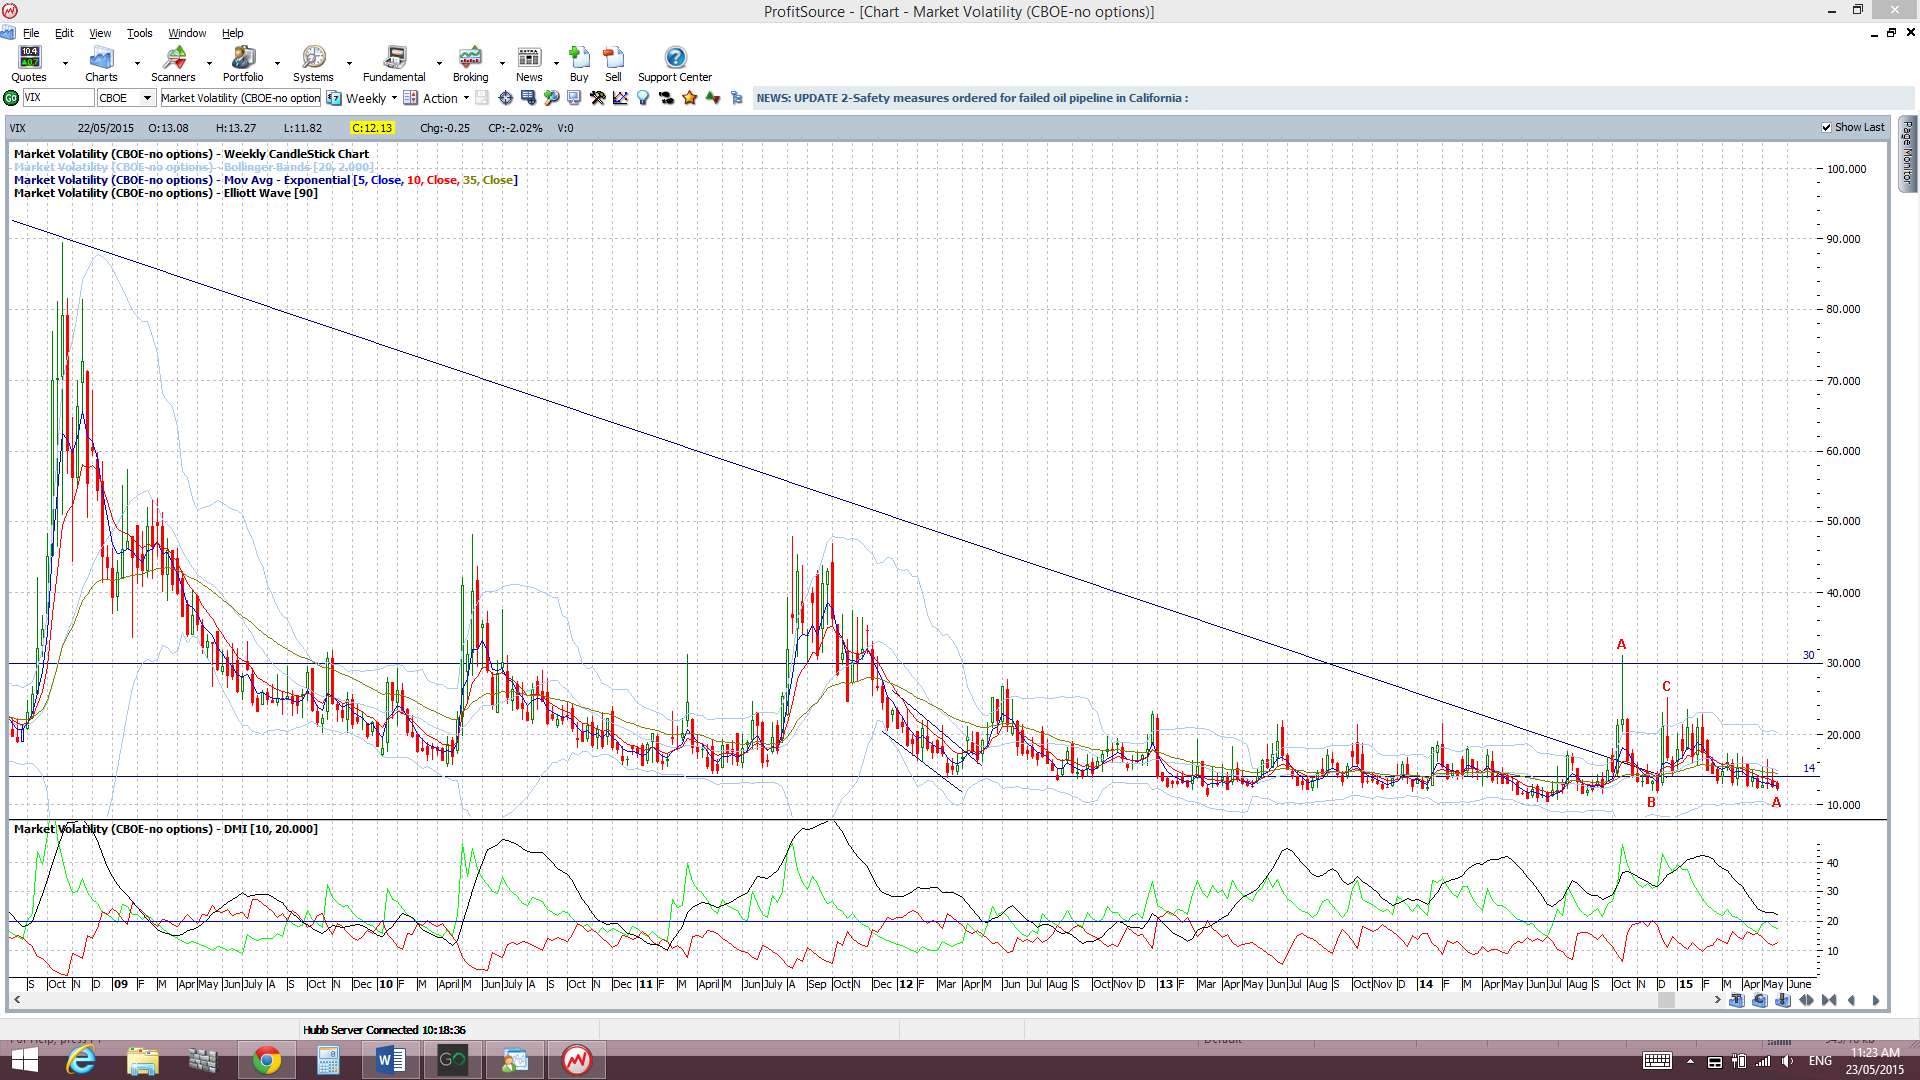
VIX Index: The ‘Fear’ index is still below the 14 level and printed a bearish weekly candle.
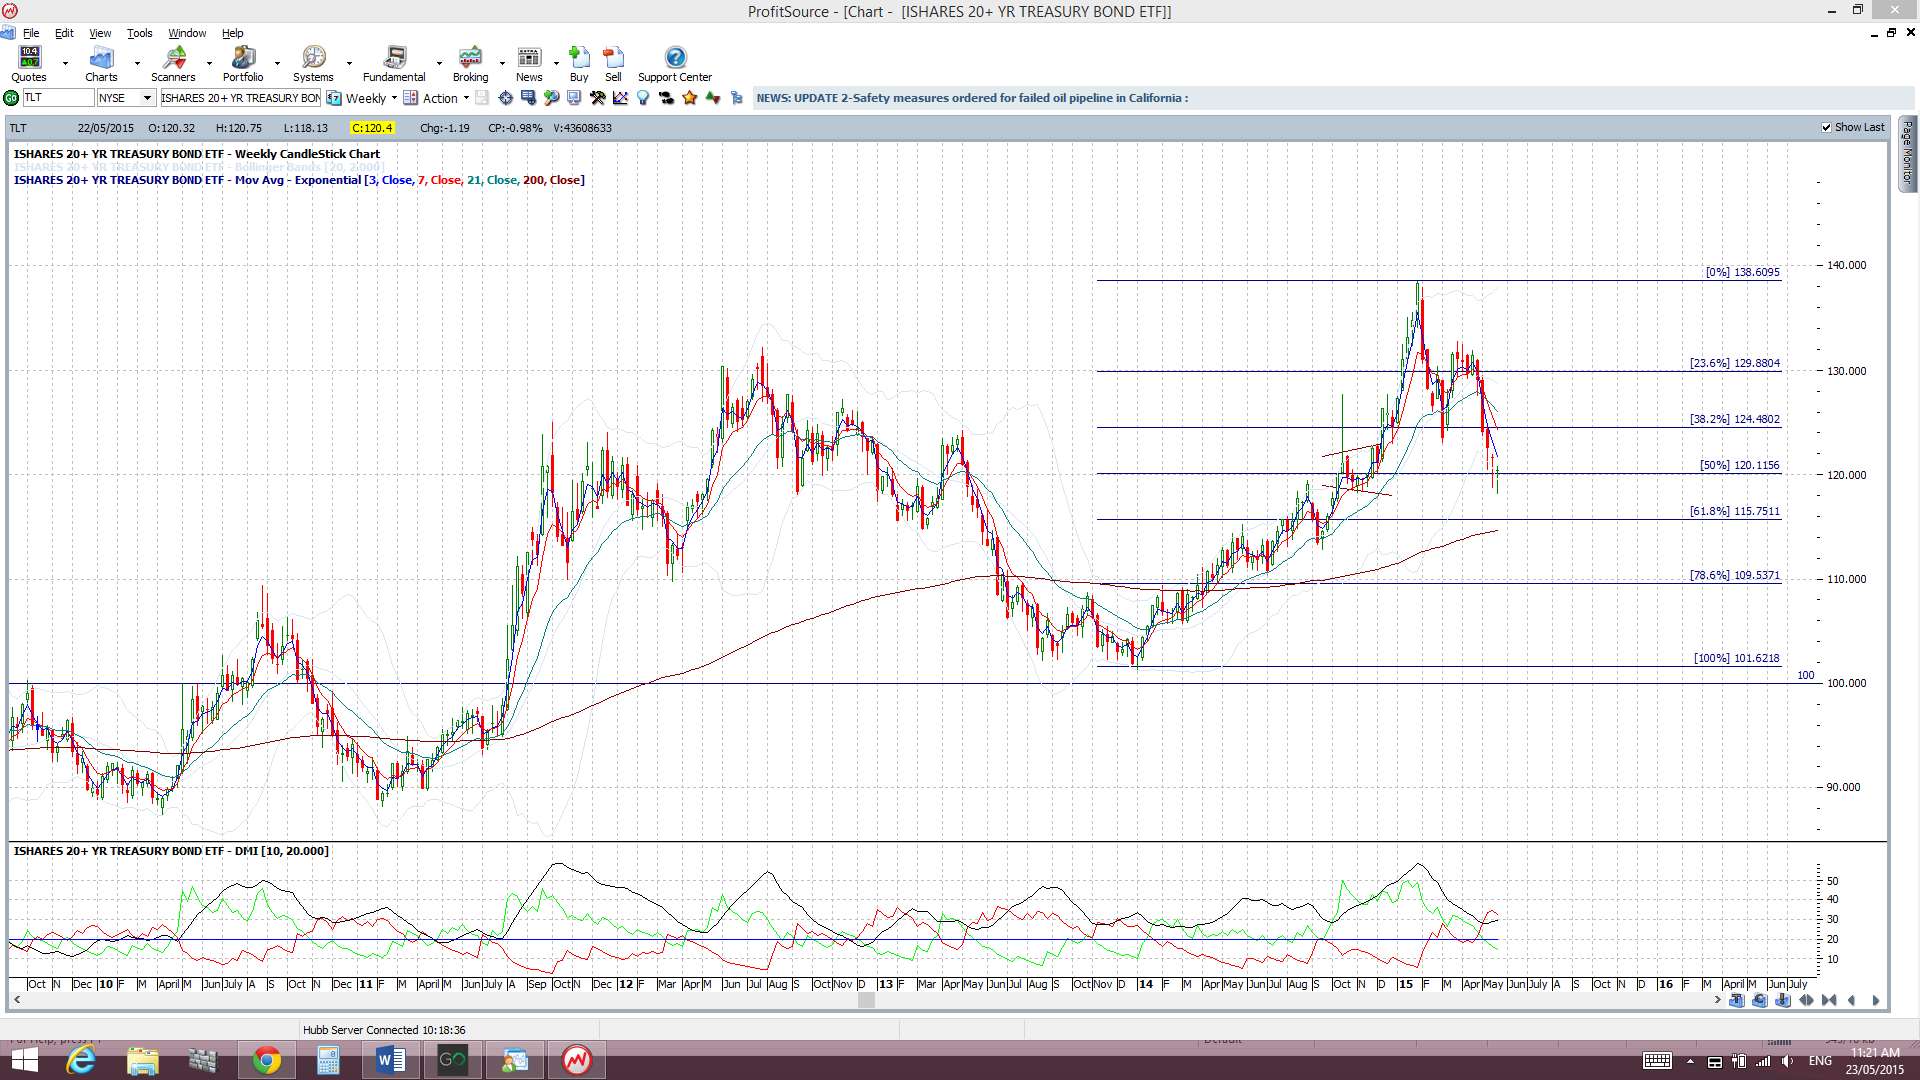
Bonds: The bond ETF had a marginal week but the two Doji candles point to the indecision here. The 50% retracement fib of the recent bull run is acting as some support for now.
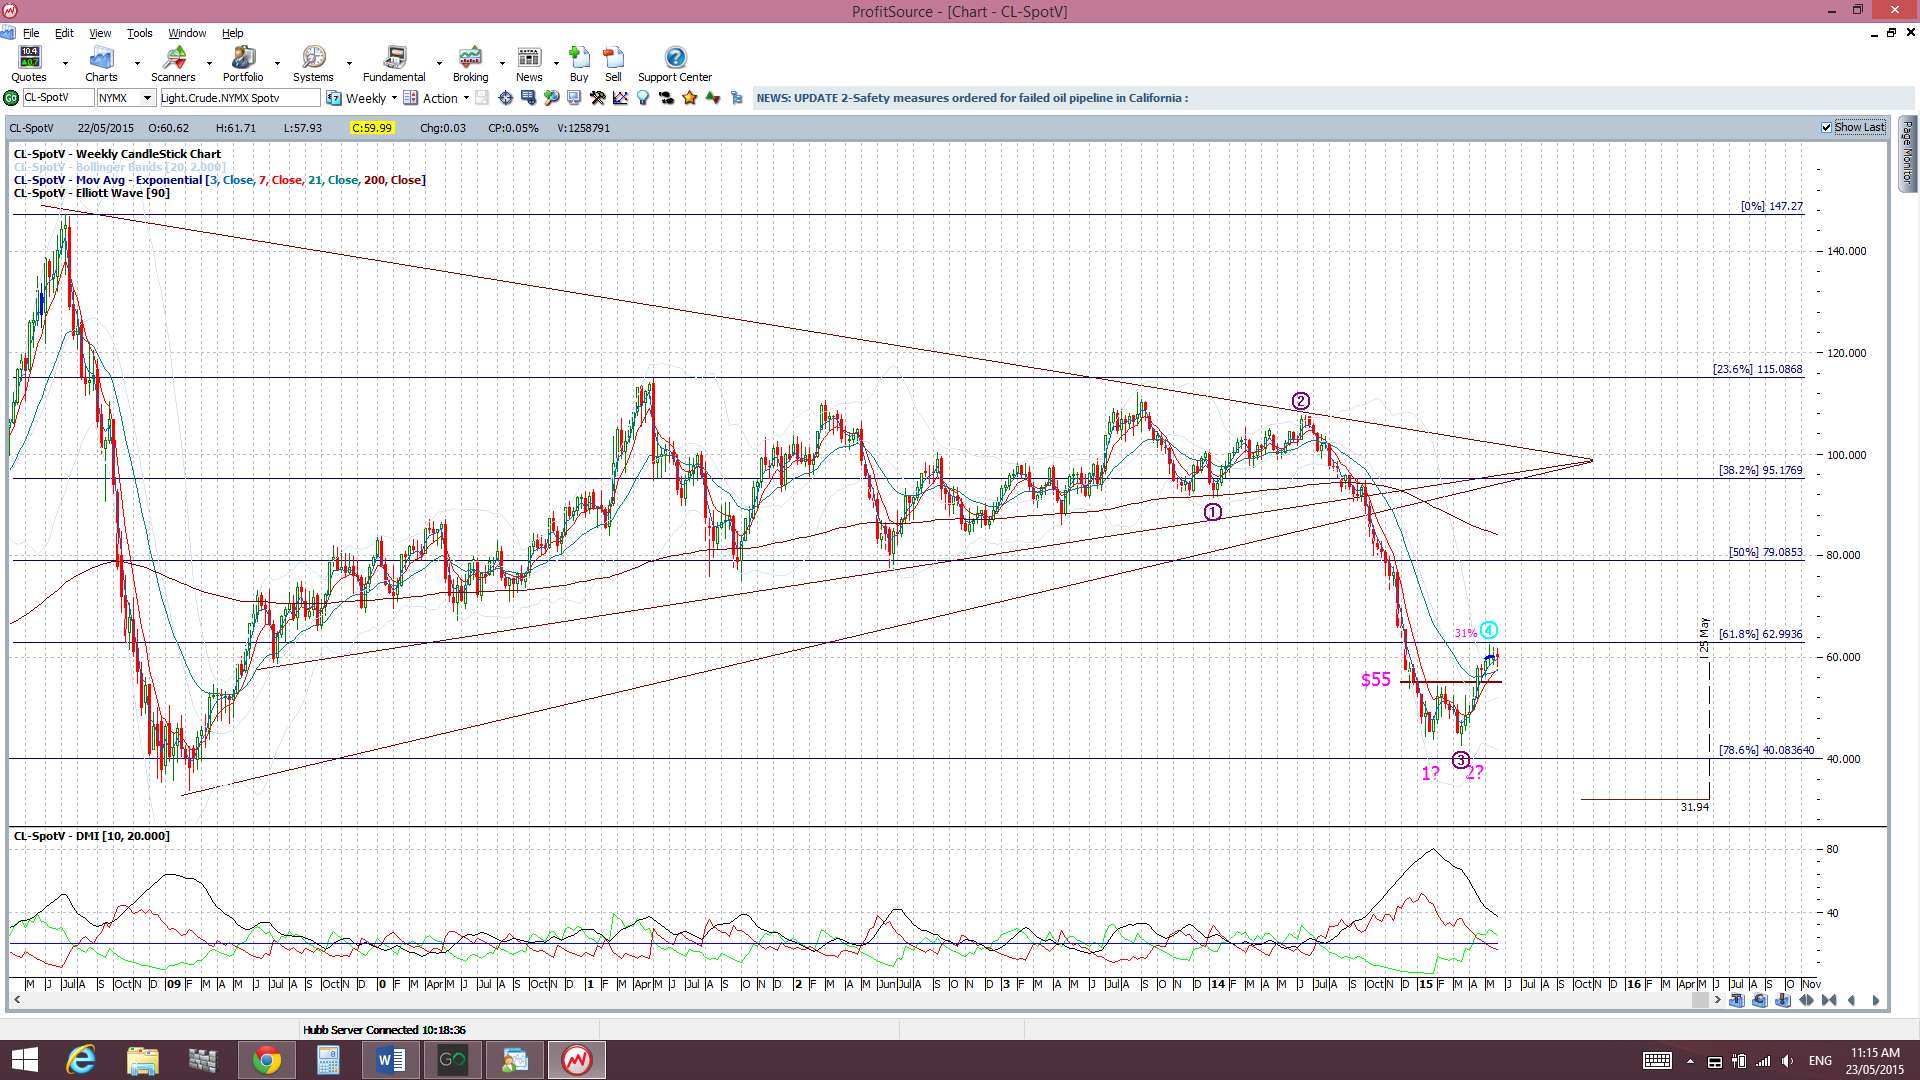
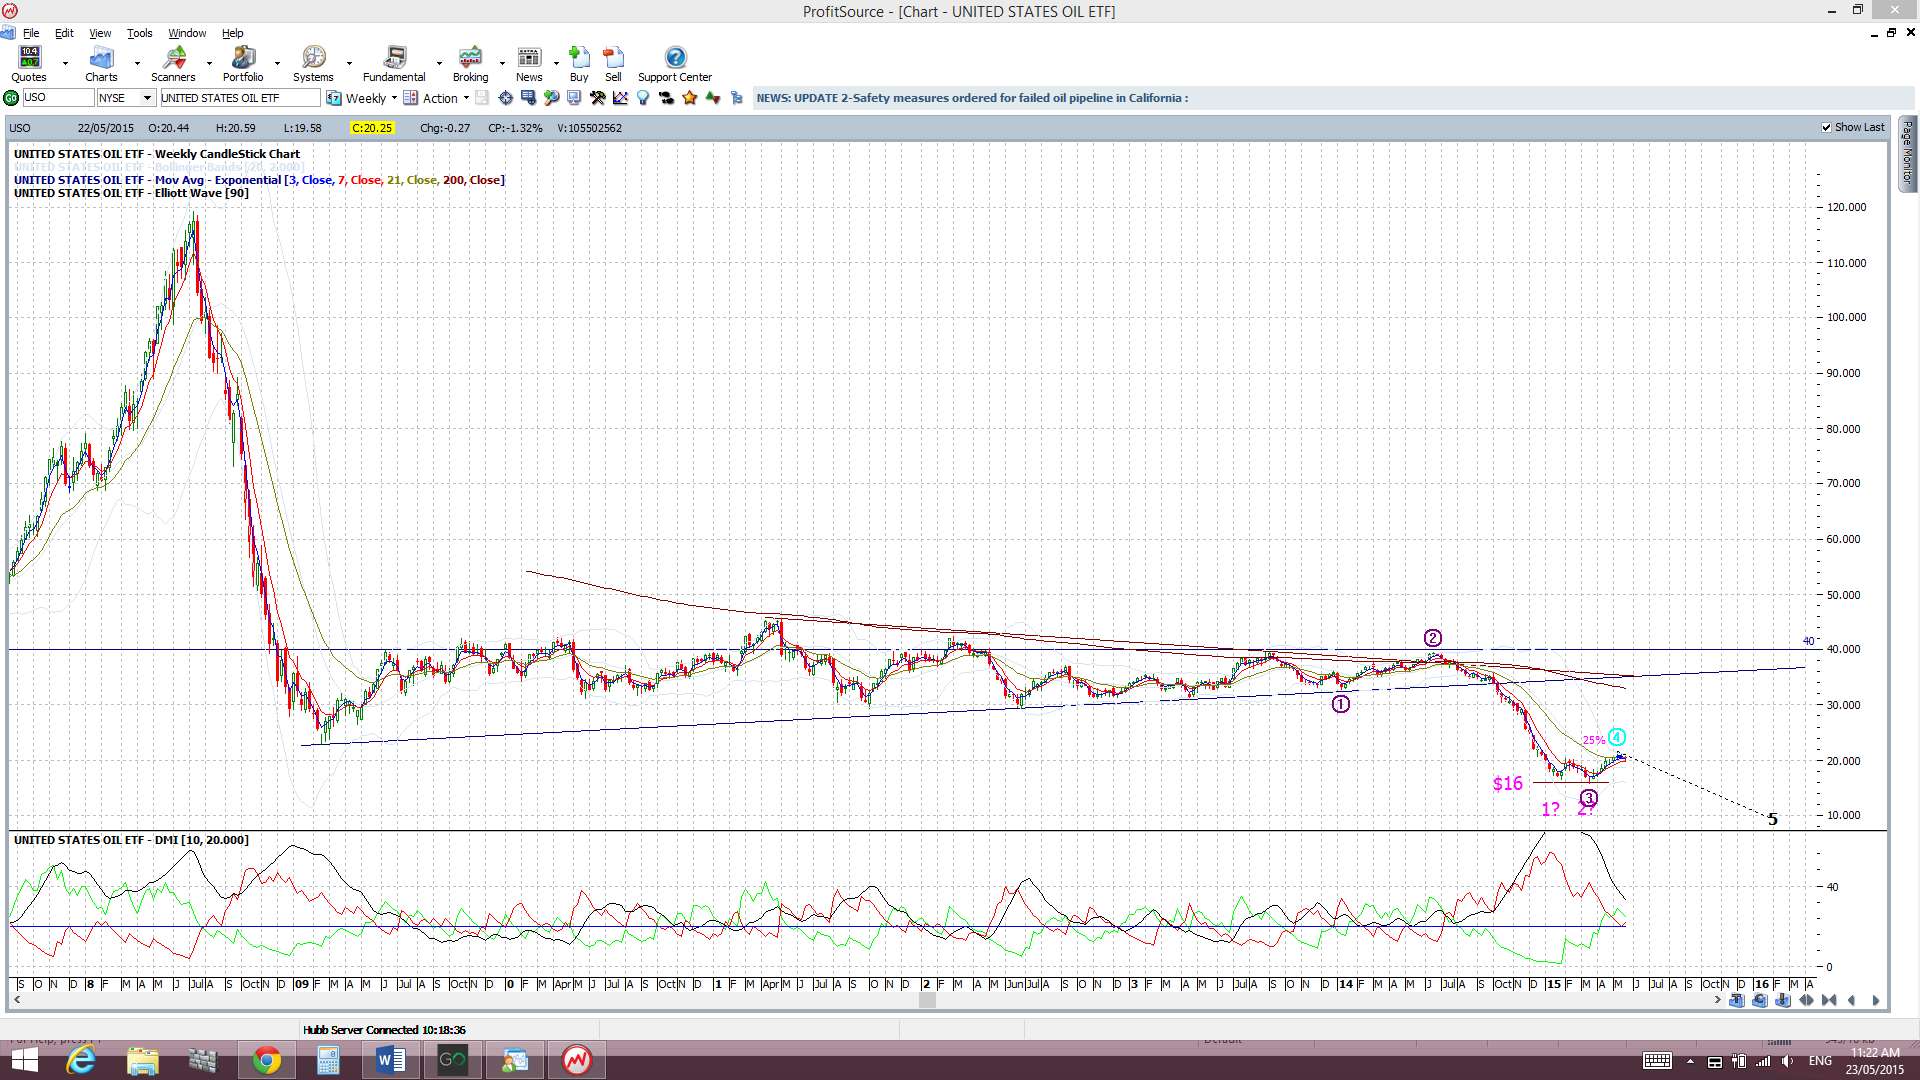
Oil: Oil had a bearish week although is holding above the breakout region from the bullish ‘Double Bottom’. I’m still on the lookout for a test of the $55 ‘neck line’ breakout level before possible continuation but it continues consolidating just under the $60 level for the time being. USO is holding above $20 after a bullish ‘Double Bottom’ breakout for now although it printed a small bearish weekly candle.
Trading Calendar Items to watch out for:
- Mon 25th: EUR,GBP, CHF & USA Bank Holiday.
- Tue 26th: NZD Trade Balance. USD Core Durable Goods & CB Consumer Confidence.
- Wed 27th: CAD BoC Rate Statement. ECB Financial Stability Report. G7 meetings Day 1.
- Thurs 28th: AUD Private Capital Expenditure. USD Unemployment Claims. G7 meetings Day 2.
- Fri 29th: NZD ANZ Business Confidence. GBP Second Estimates GDP. CAD GDP. USD Prelim GDP. G7 meetings Day 3.
Forex:
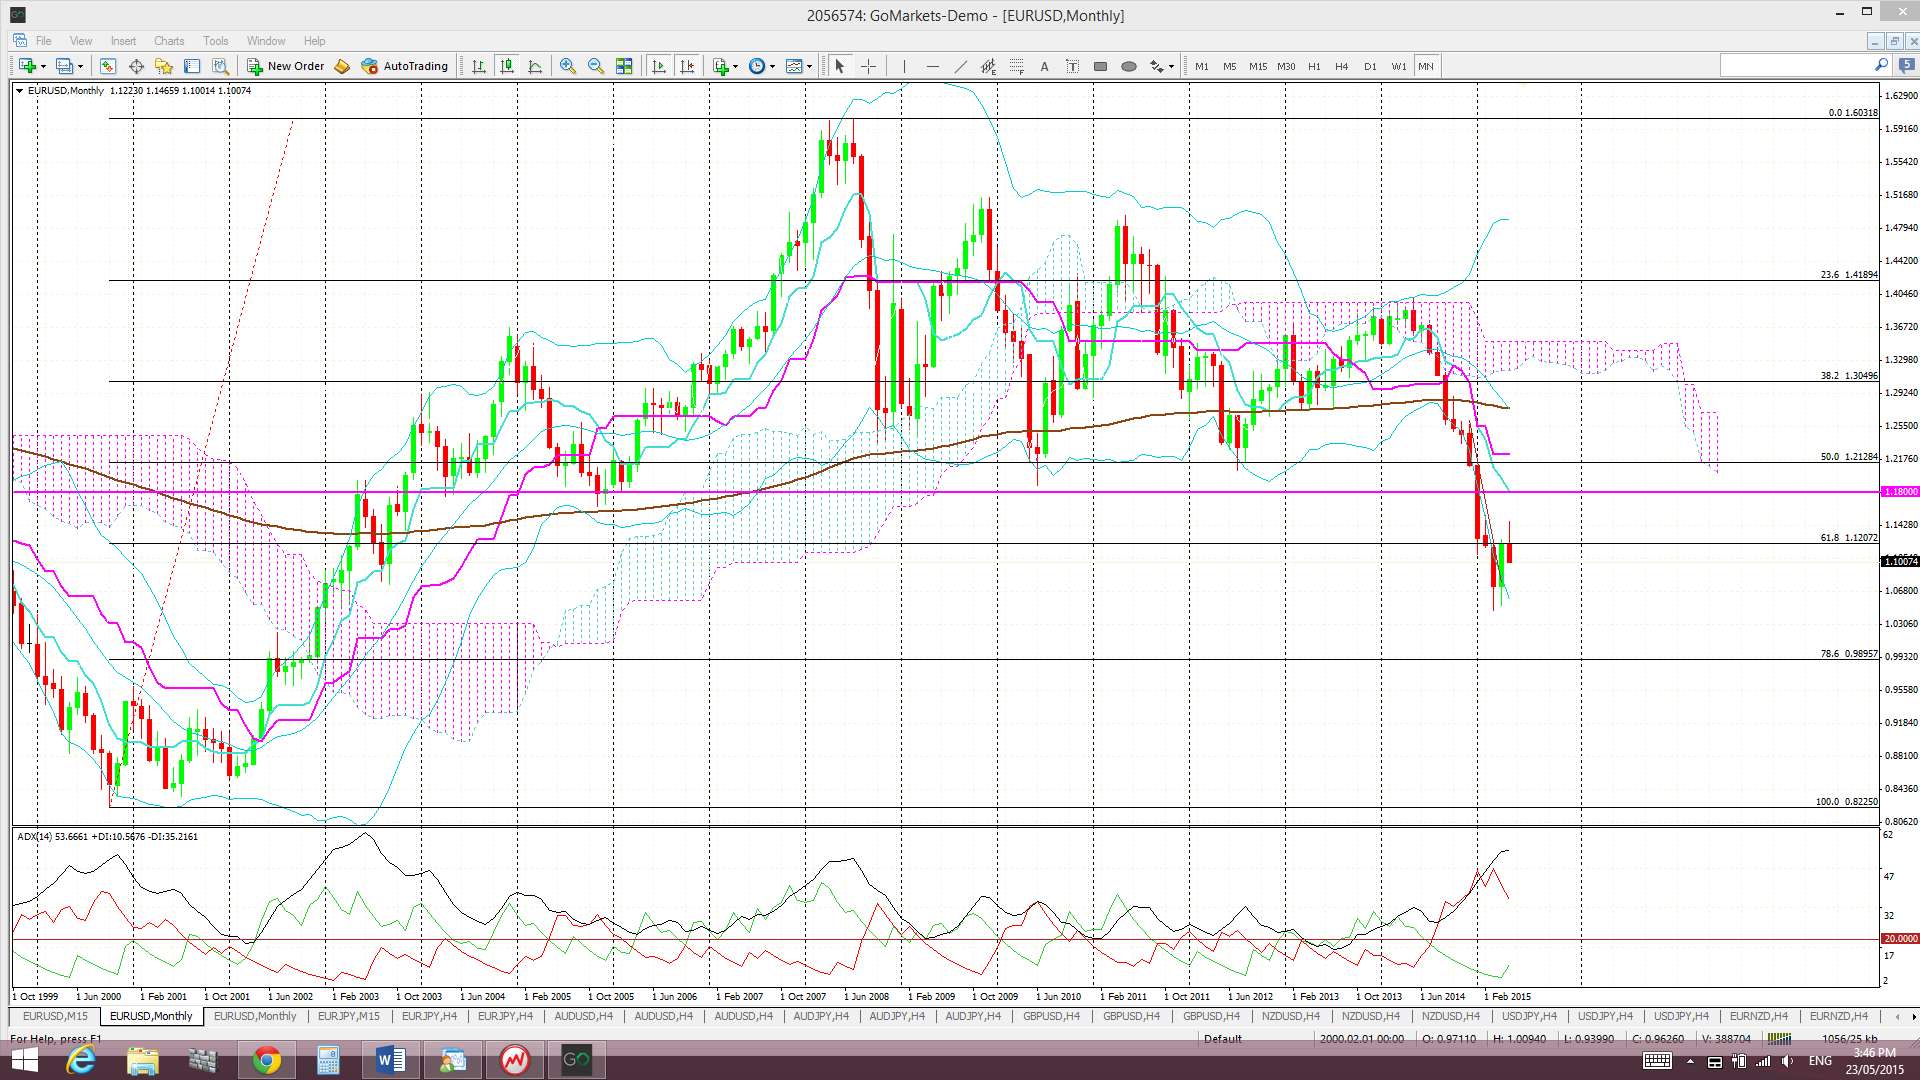
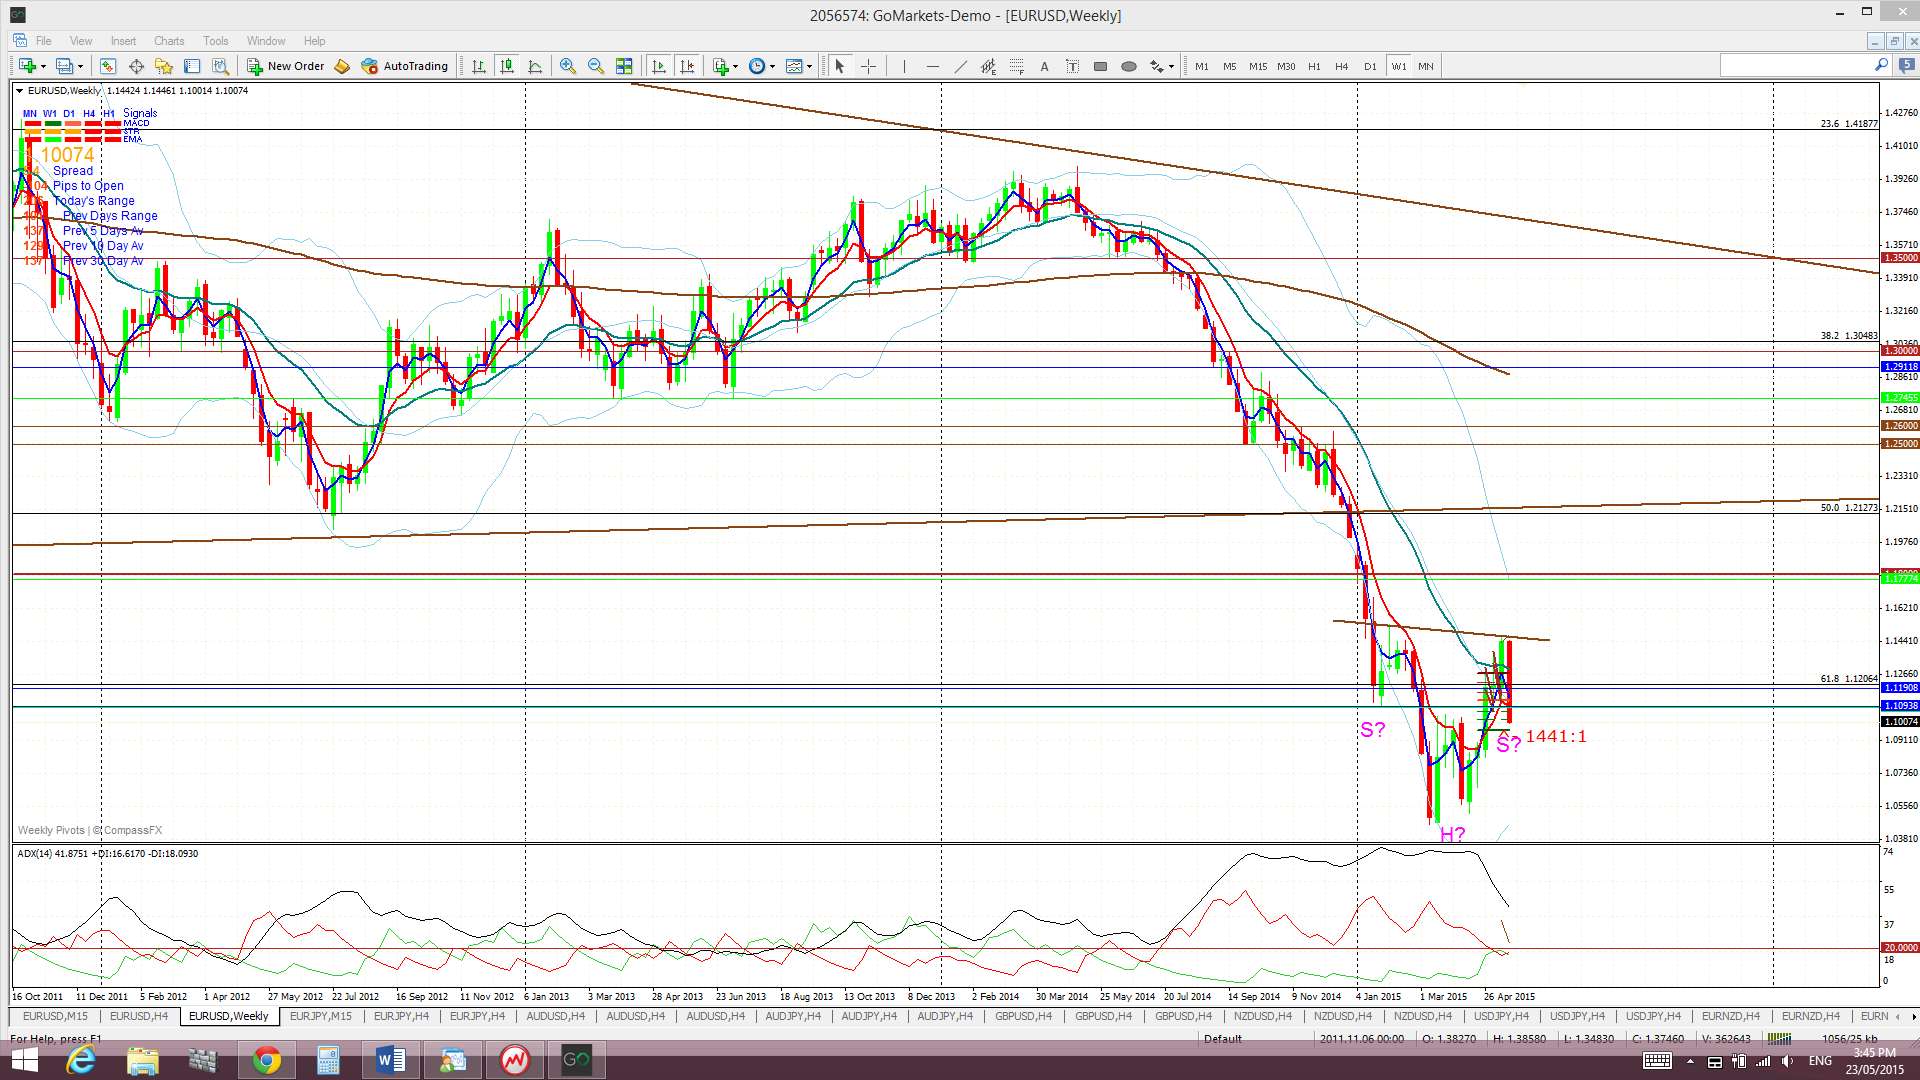
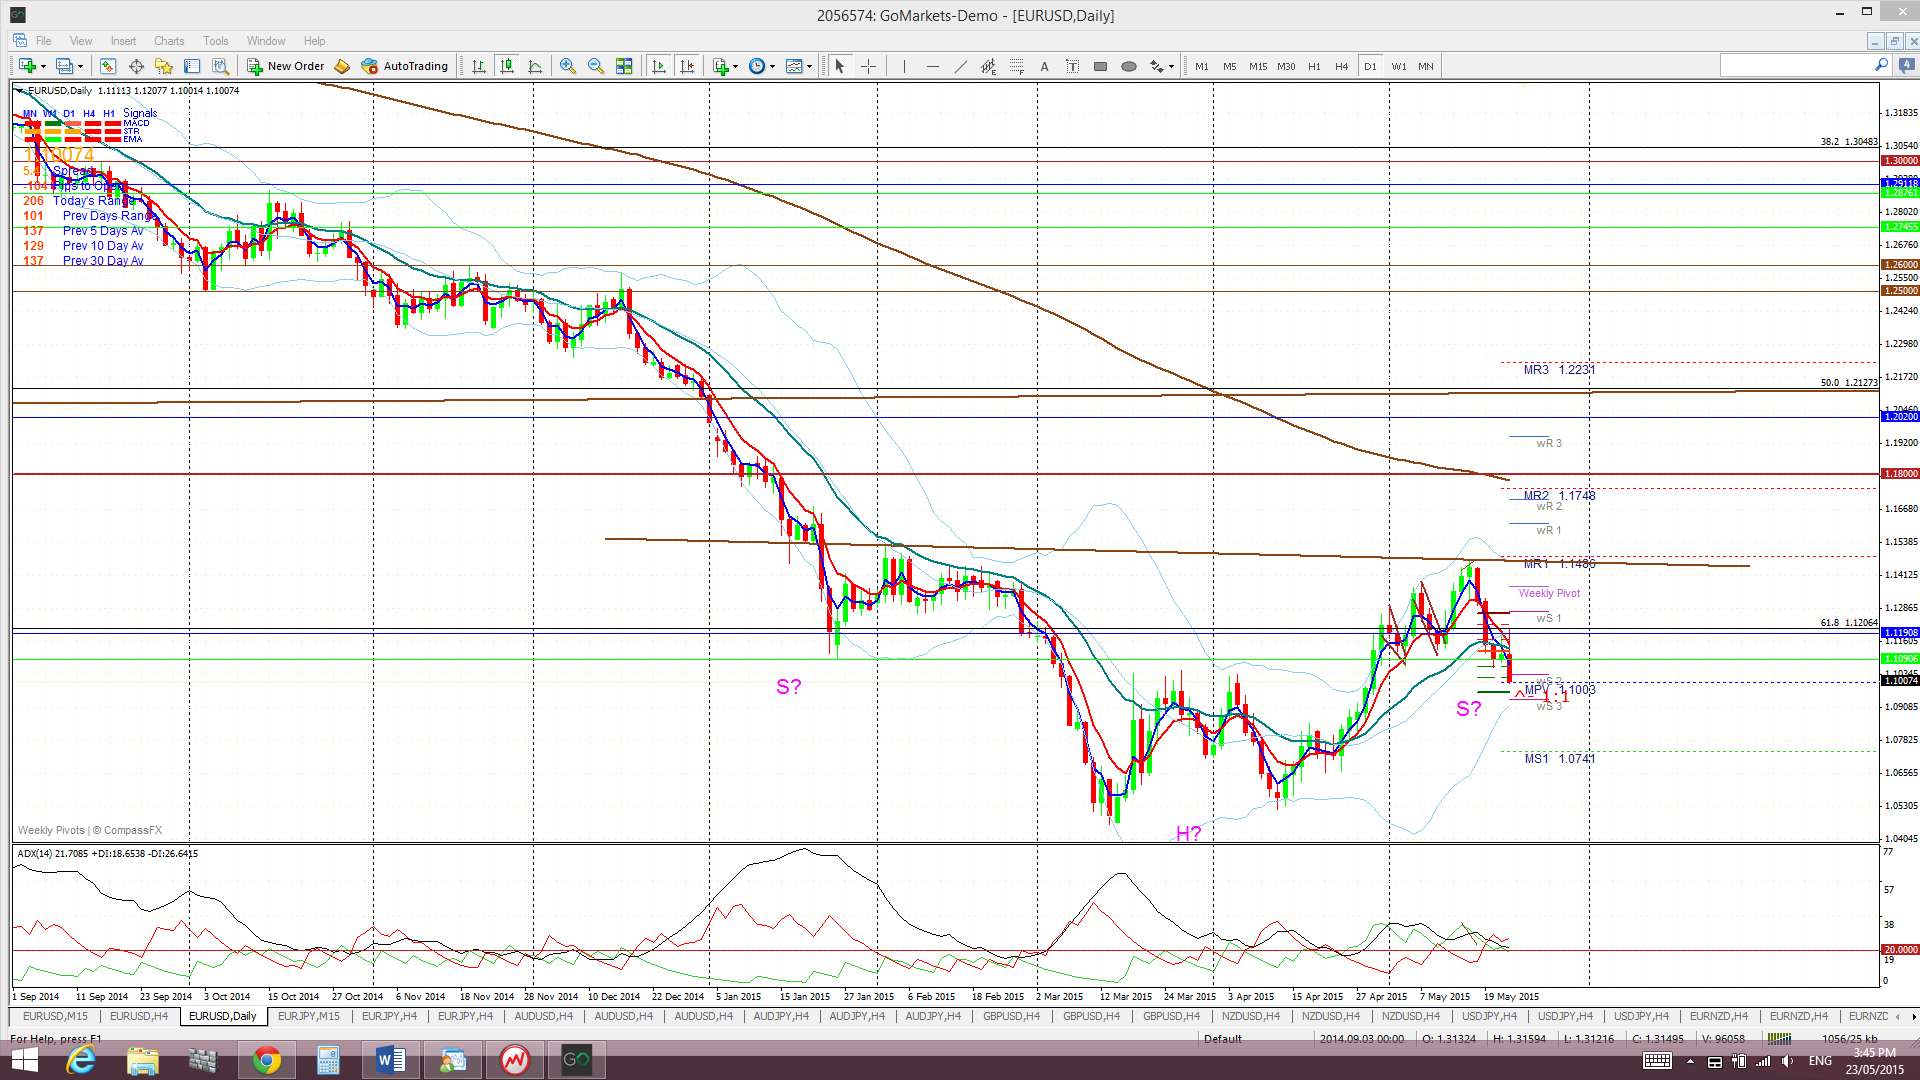
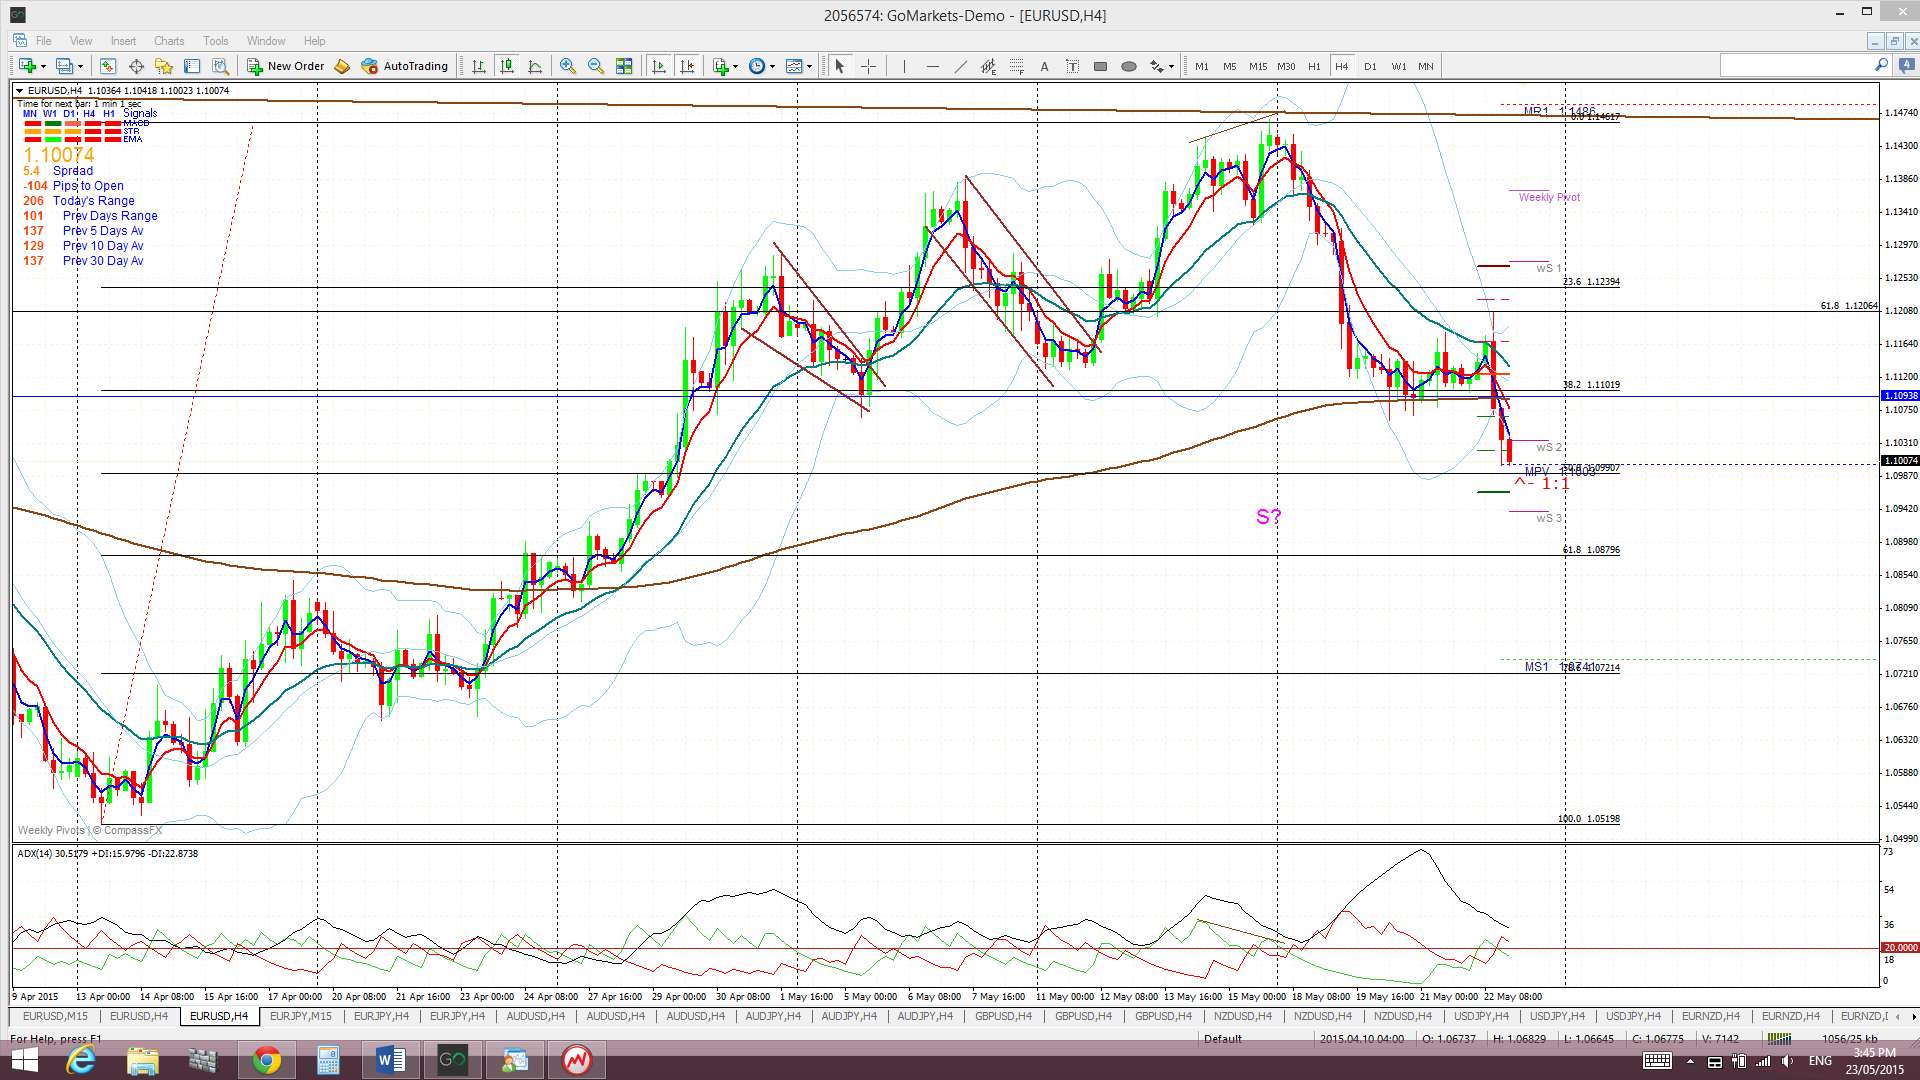
E/U: The E/U retreated back below the key 1.12 level last week but closed at the psychological 1.10 level, monthly pivot and 50% fib of the recent swing high move with the top of the daily Cloud just below current price and adding some support as well. ECB QE talk and upbeat US CPI data combined to put pressure on the E/U with the Greek-debt situation continuing to weigh-in here too and with the latter being one of the main topics of discussion during w/e ECB meetings. One contrary technical image though comes from the weekly E/U chart as it shows a bullish ‘inverse H&S’ possibly forming up.
It’s not surprising that this pair continues to struggle at the 1.12 level as this is the 61.8% fib of the 2000-2008 swing high move and, thus, a major possible turning point: a monthly close back above this level would support continuation, possibly to test the 1.18 level. A failure to take back 1.12 though would only help support more bearish continuation. The monthly candle closes at the end of the coming week and will be worth monitoring:
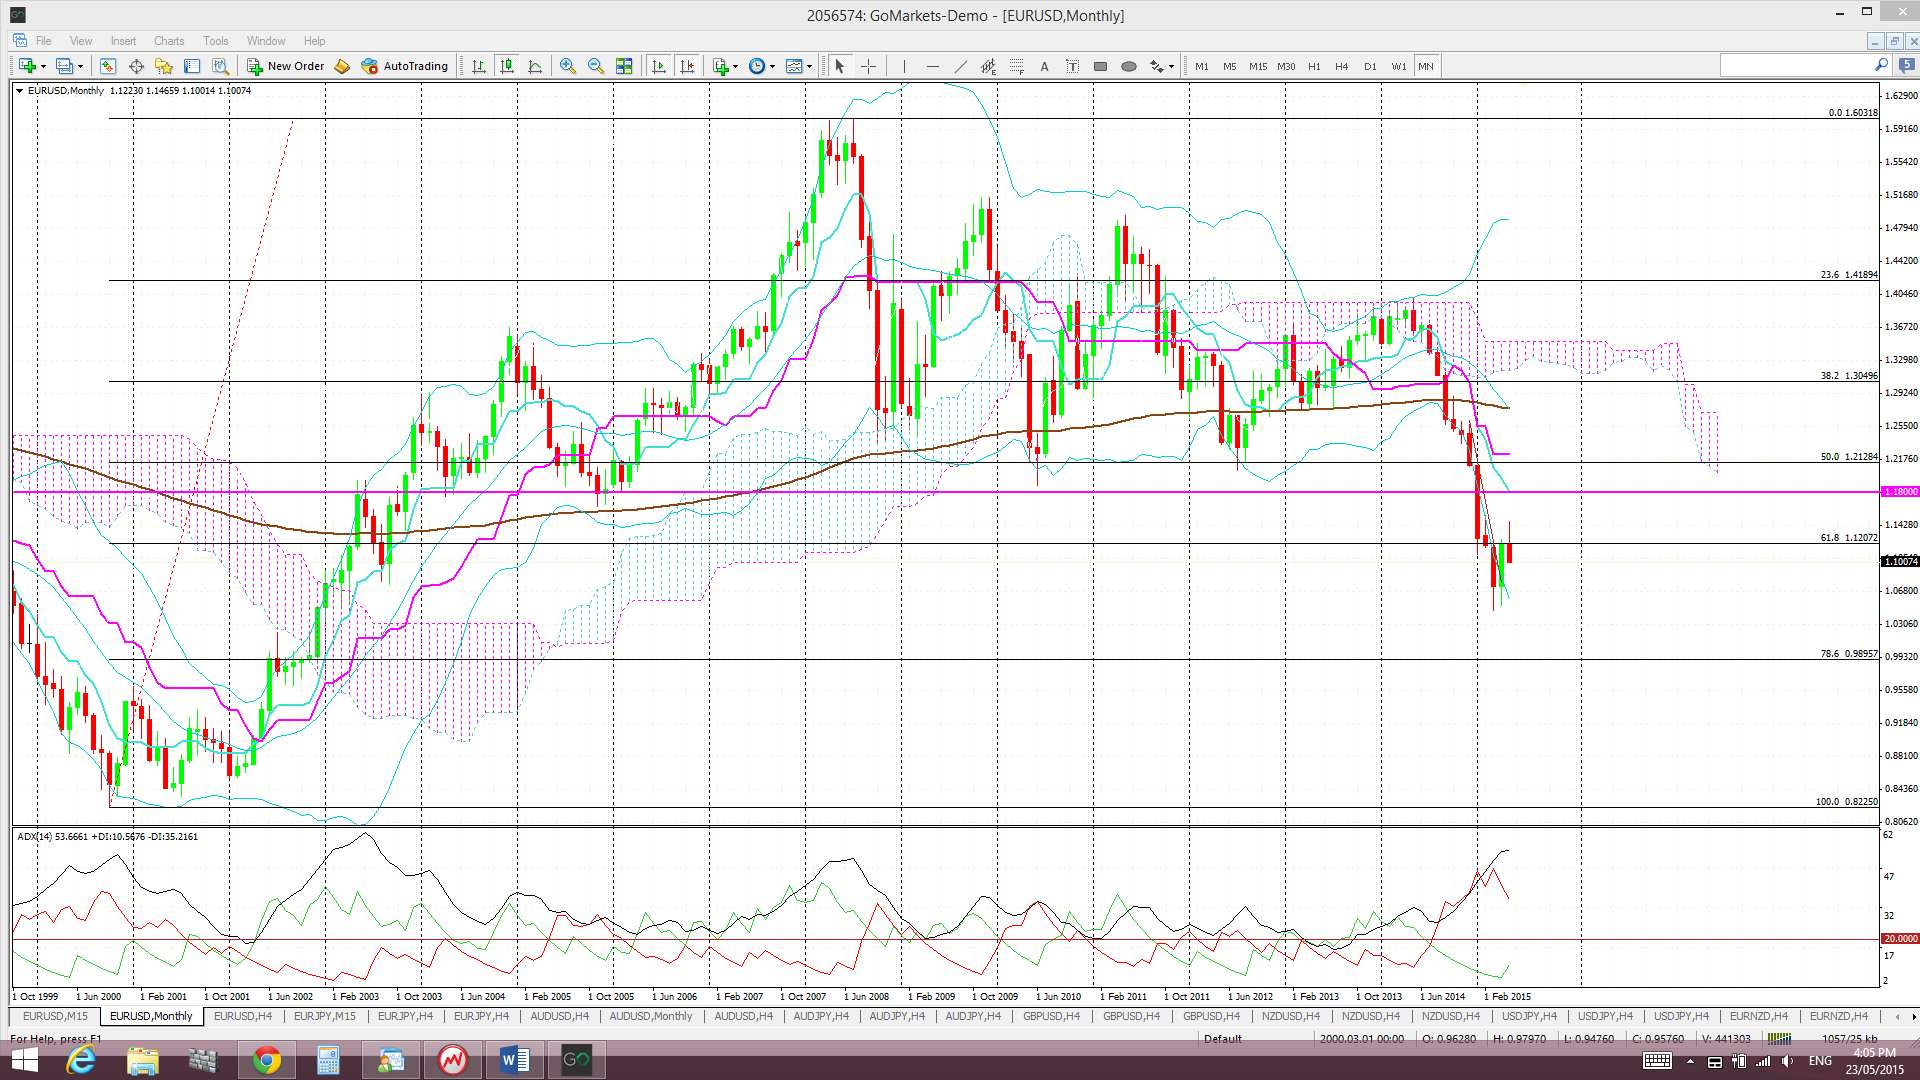
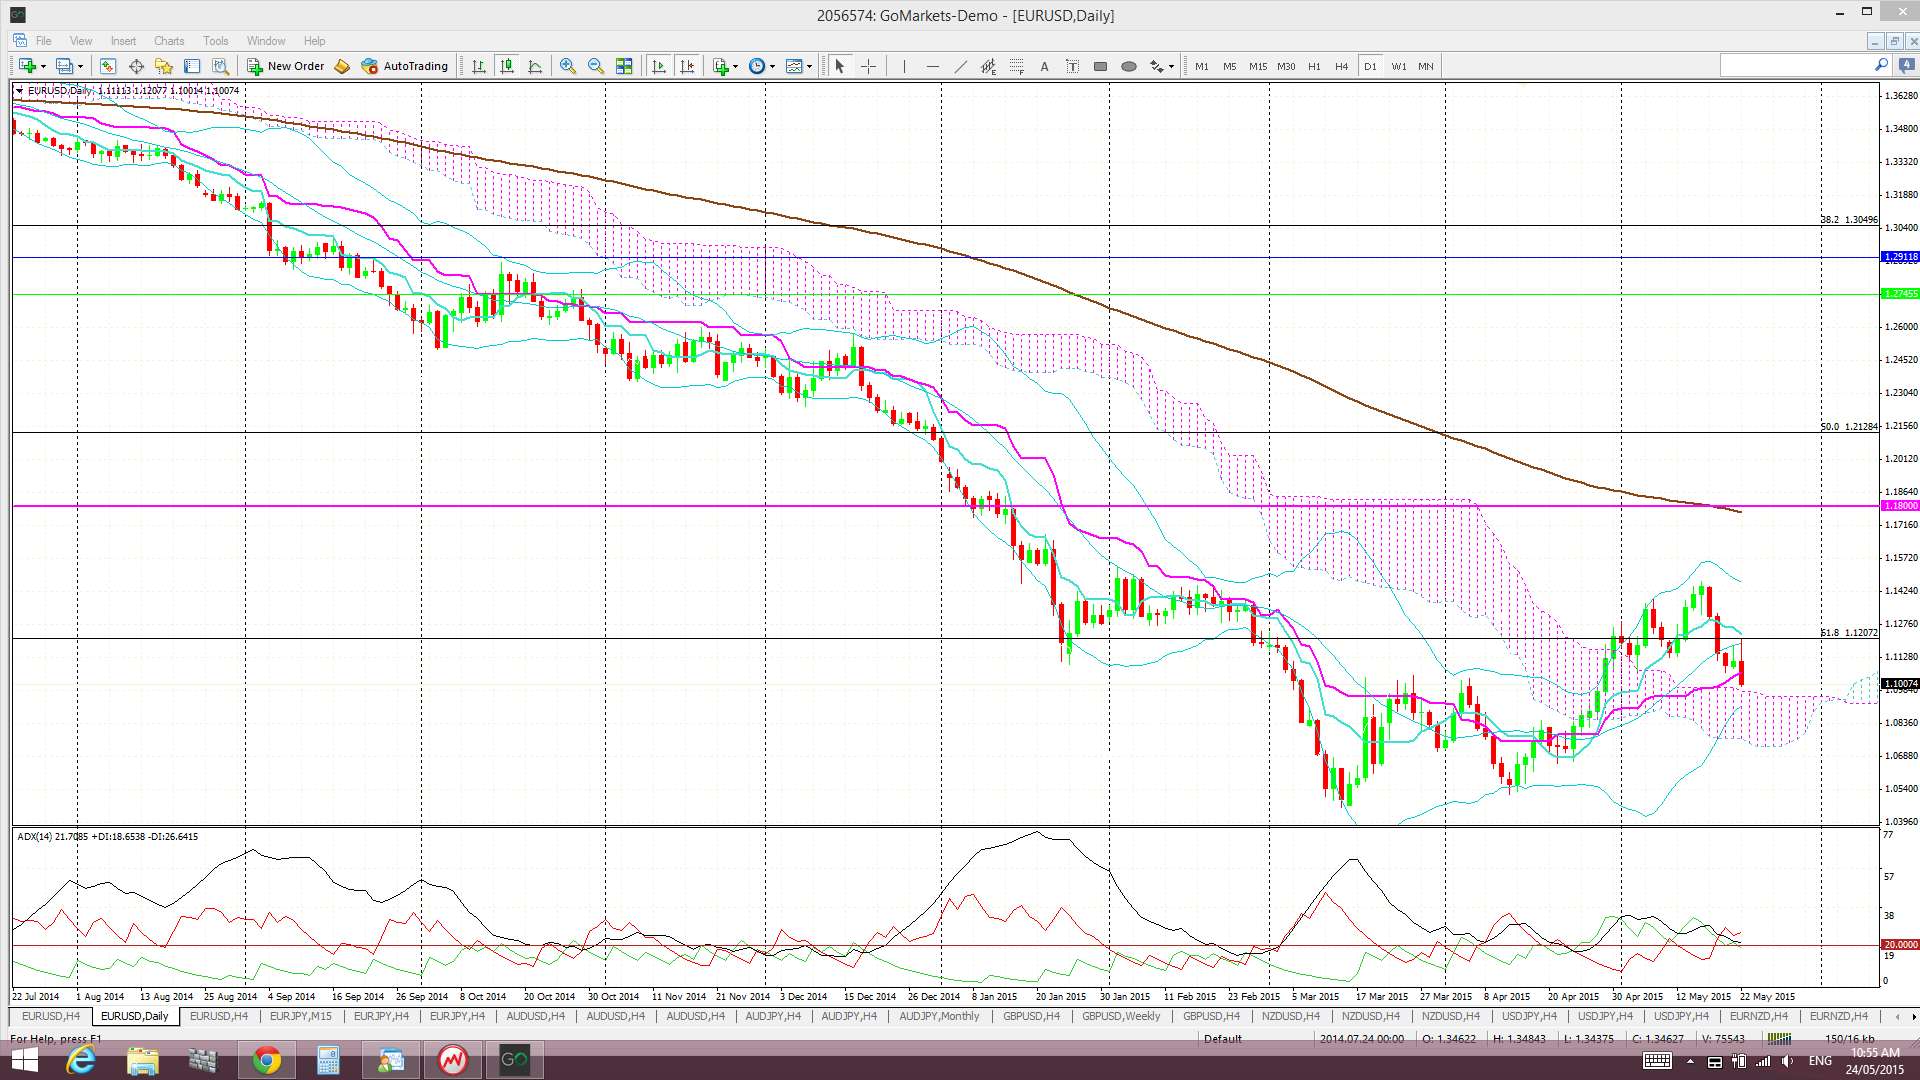
Descending triangle on the monthly chart: Despite the recent bullish activity there is still an overall bearish pattern in play on the E/U monthly chart: a 4,000 pip bearish descending triangle breakdown on the monthly chart. The descending triangle pattern is a bearish continuation pattern and has a base at around the 1.18 level. The height of this triangle is about 4,000 pips. Technical theory would suggest that the bearish breakdown of this triangle below 1.18 might see a similar move. It is worth noting that this would bring the E/U down near 0.80 and to levels not seen since 2000/2001!
Price is still trading above the Ichimoku Cloud on the daily chart but below the Cloud on the 4hr, weekly and monthly charts.
The weekly candle closed as a large bearish, almost engulfing, candle.
- I’m watching for any new TC signal on this pair, the inverse H&S and the 1.12 level.
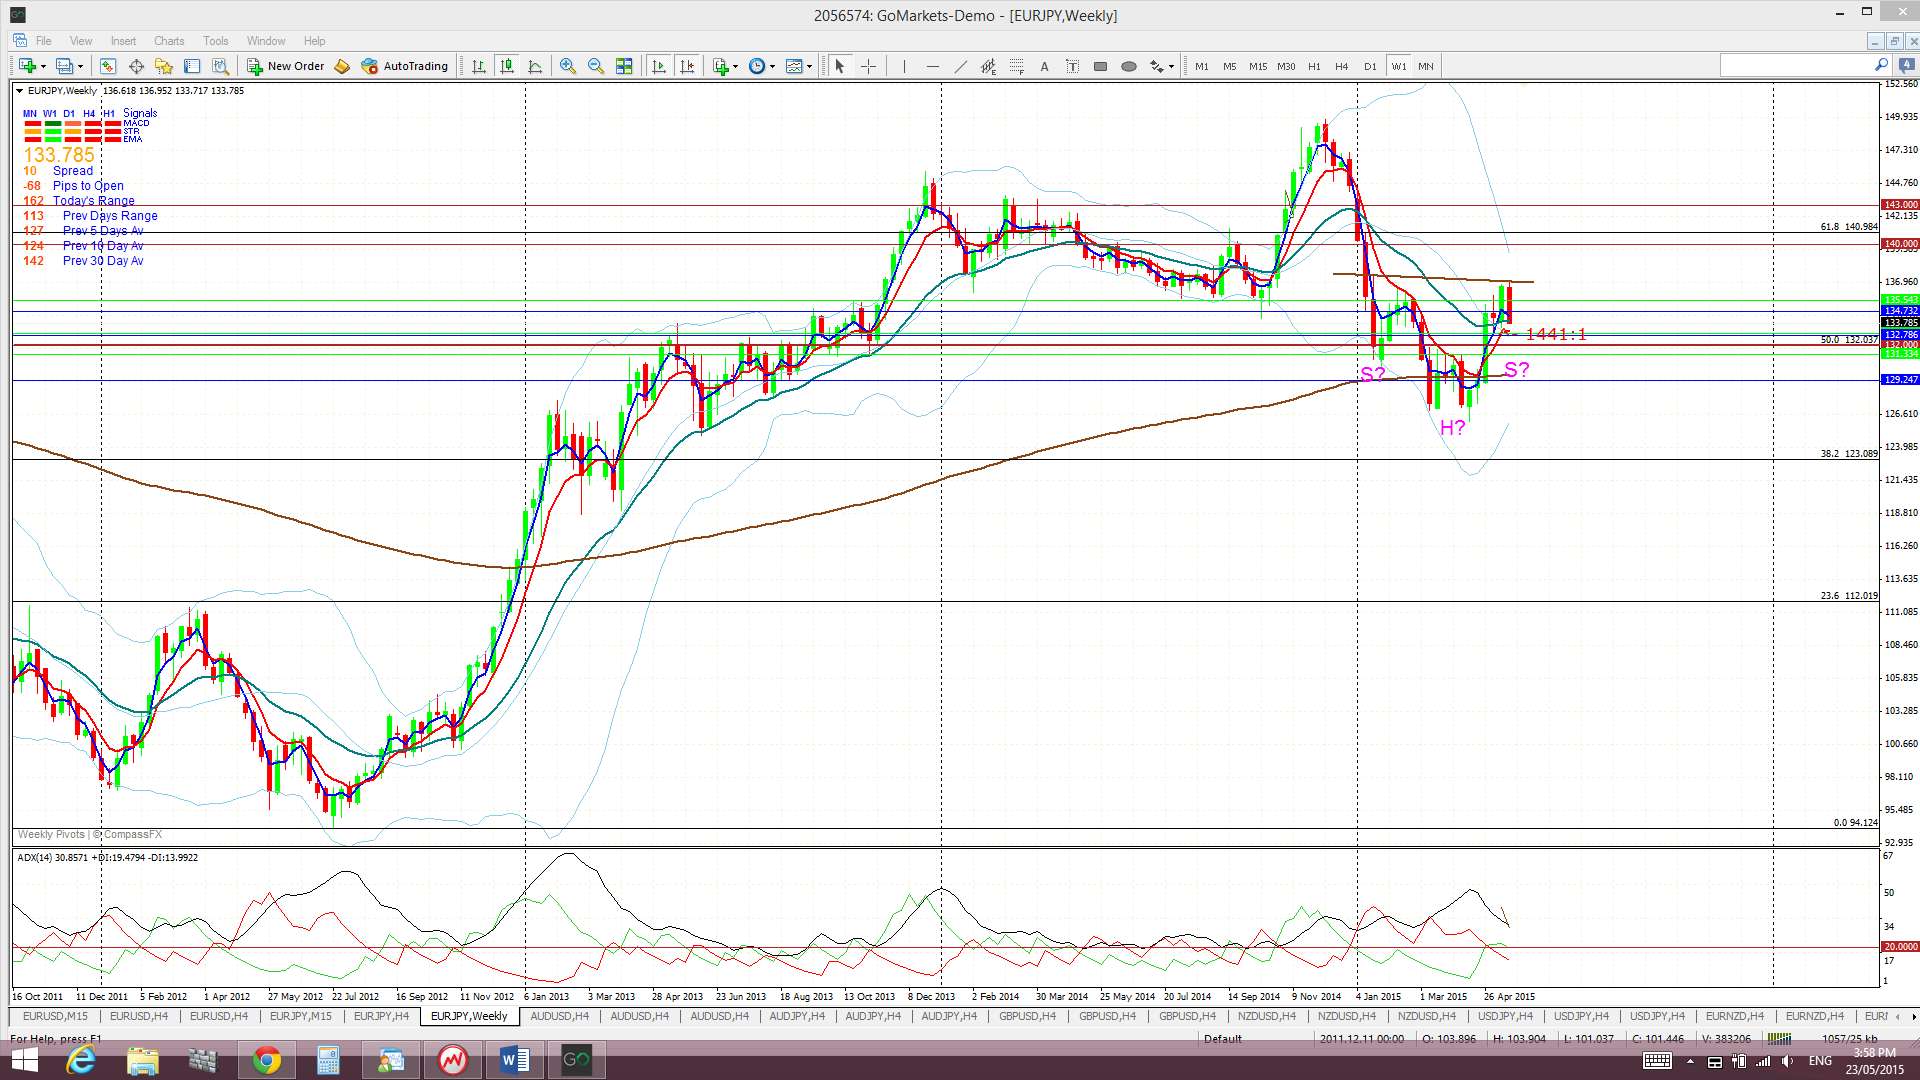
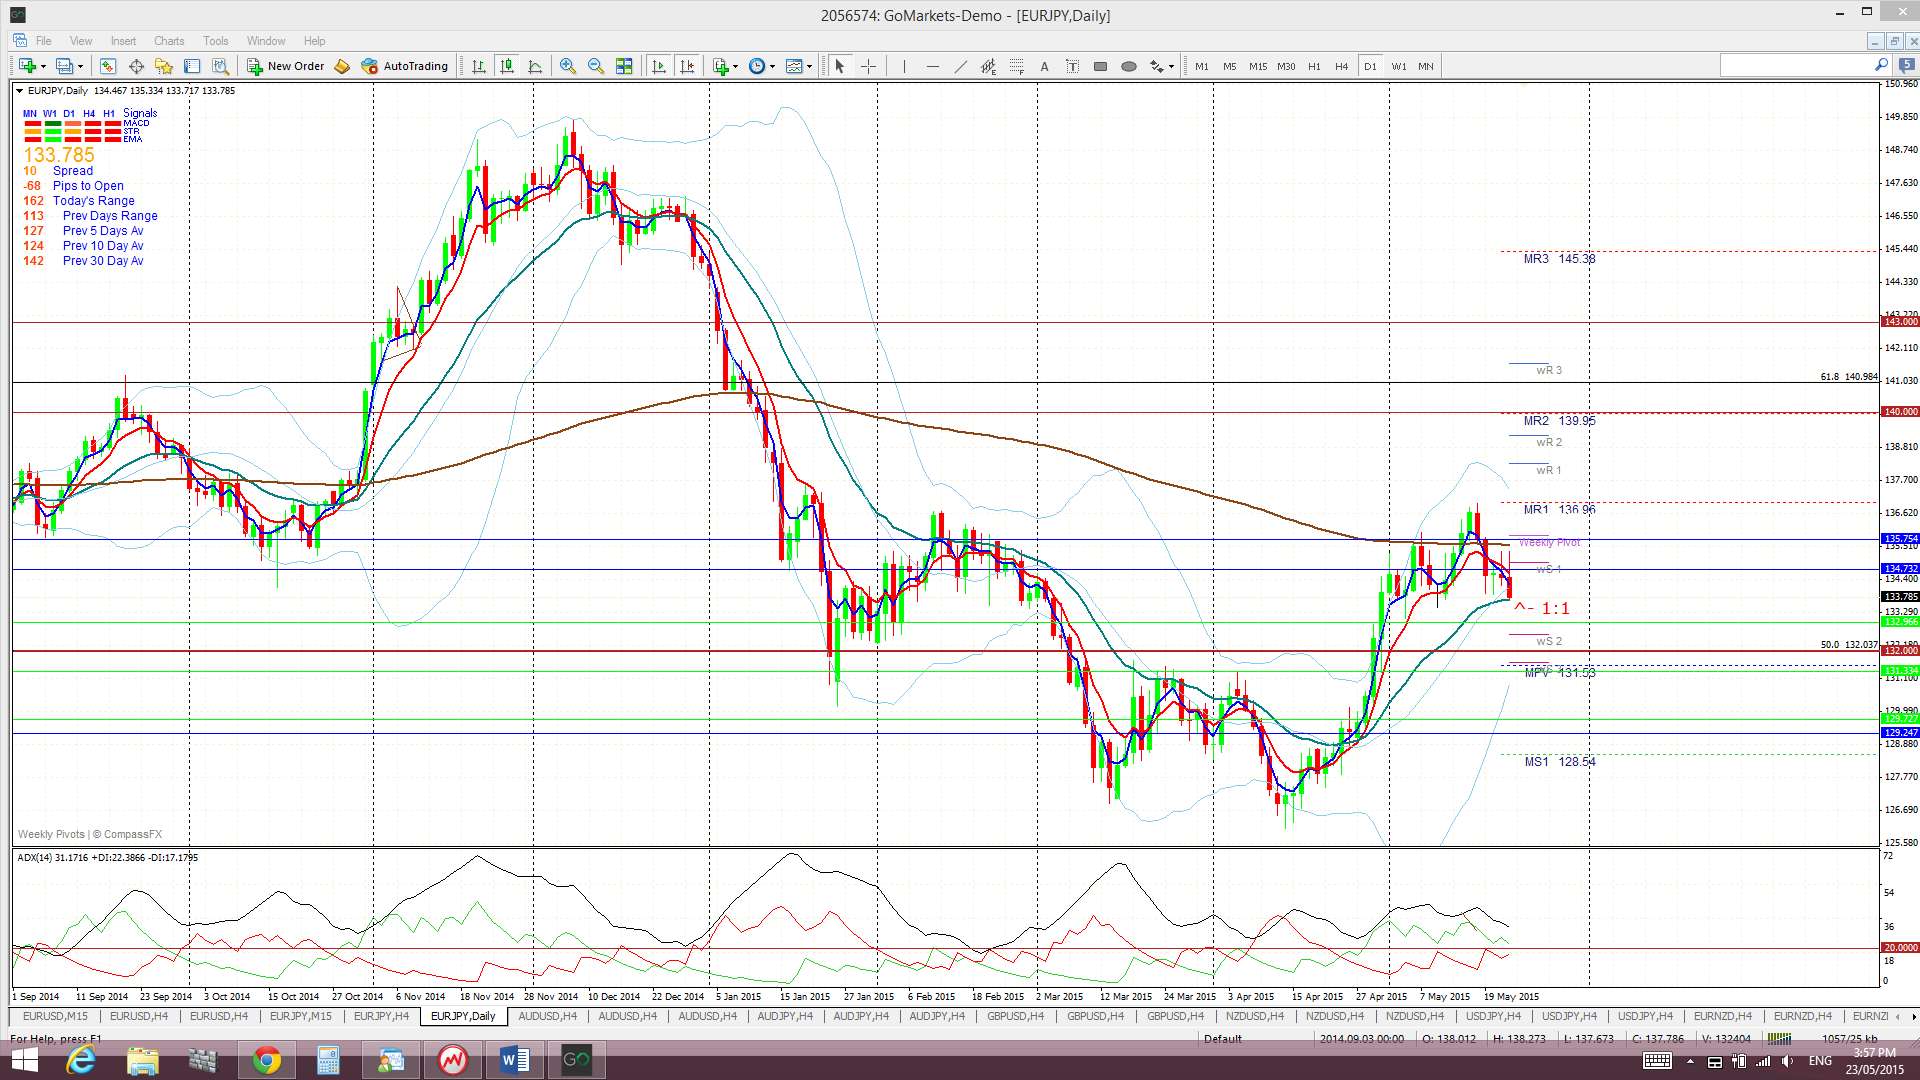
E/J: The E/J also retreated last week and moved back below the daily 200 EMA but found support from the 134 level and 23.6% fib of the recent swing high move.
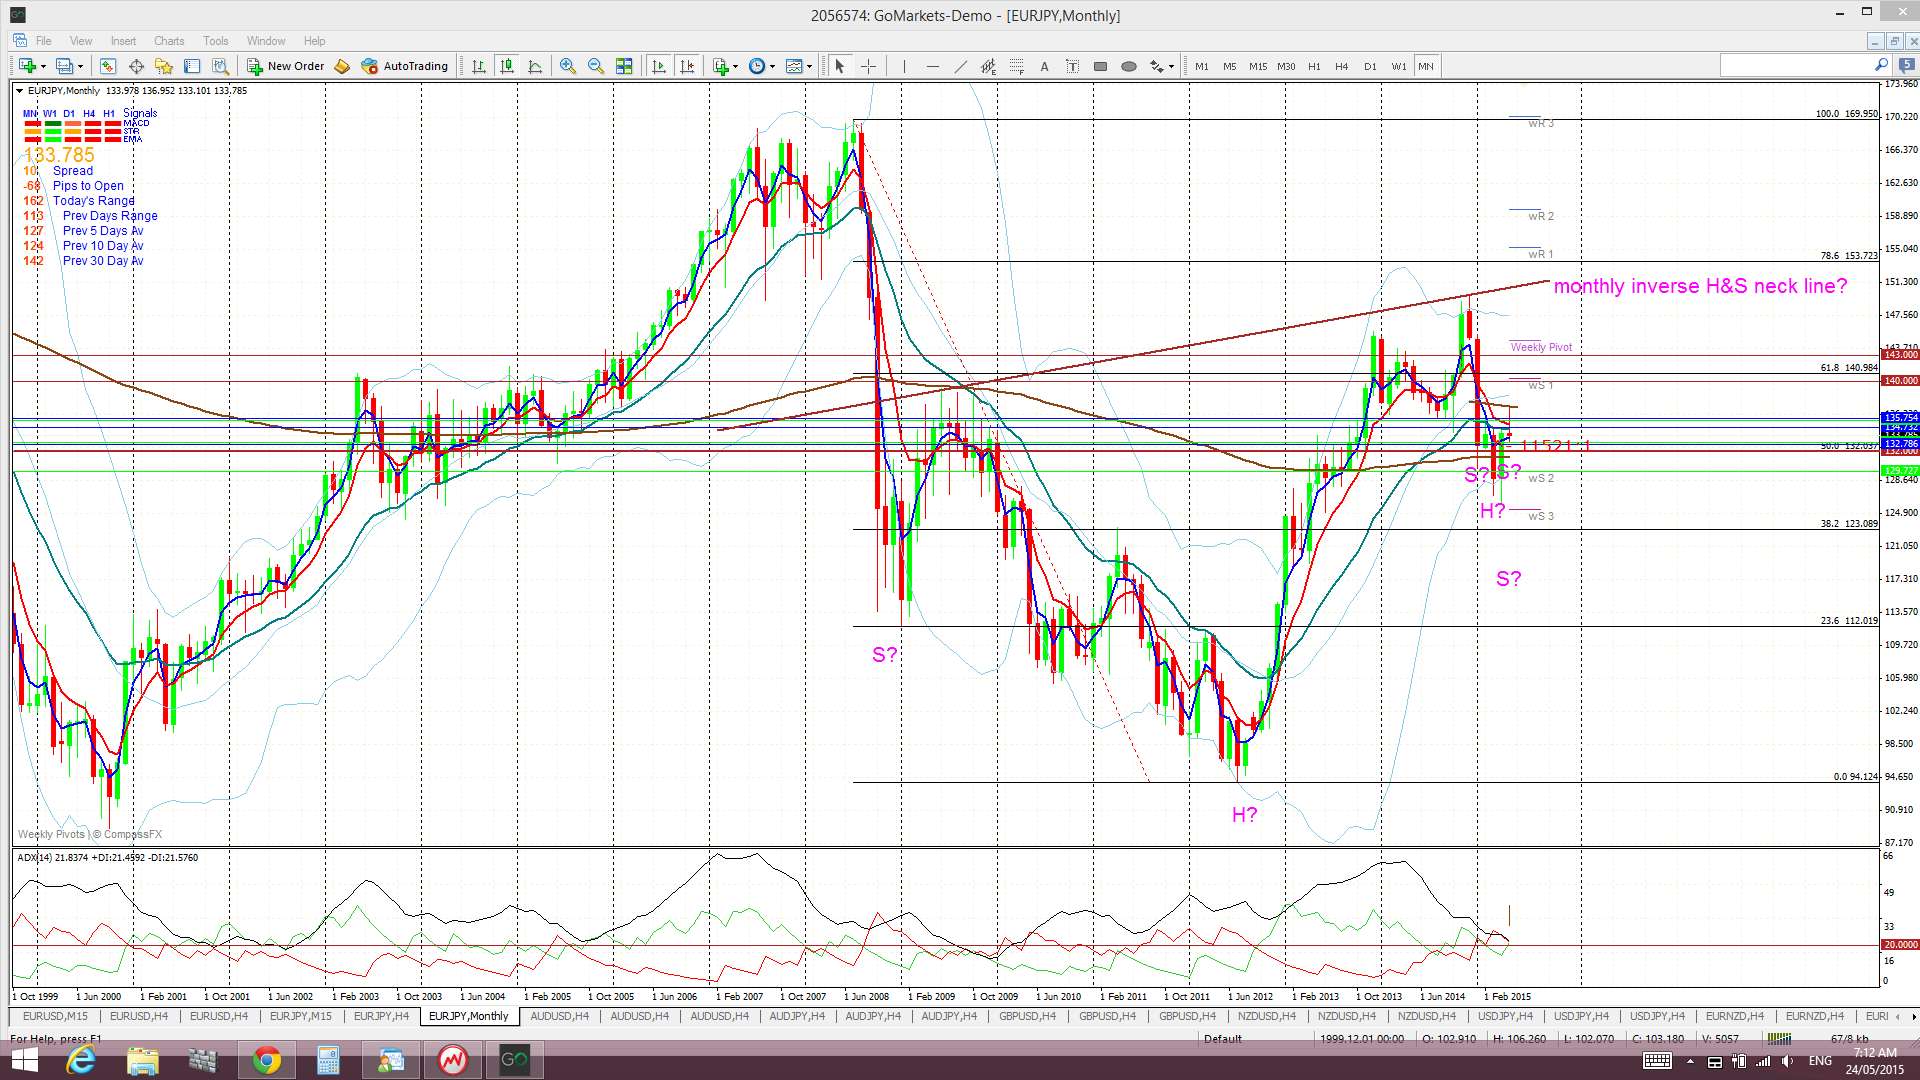
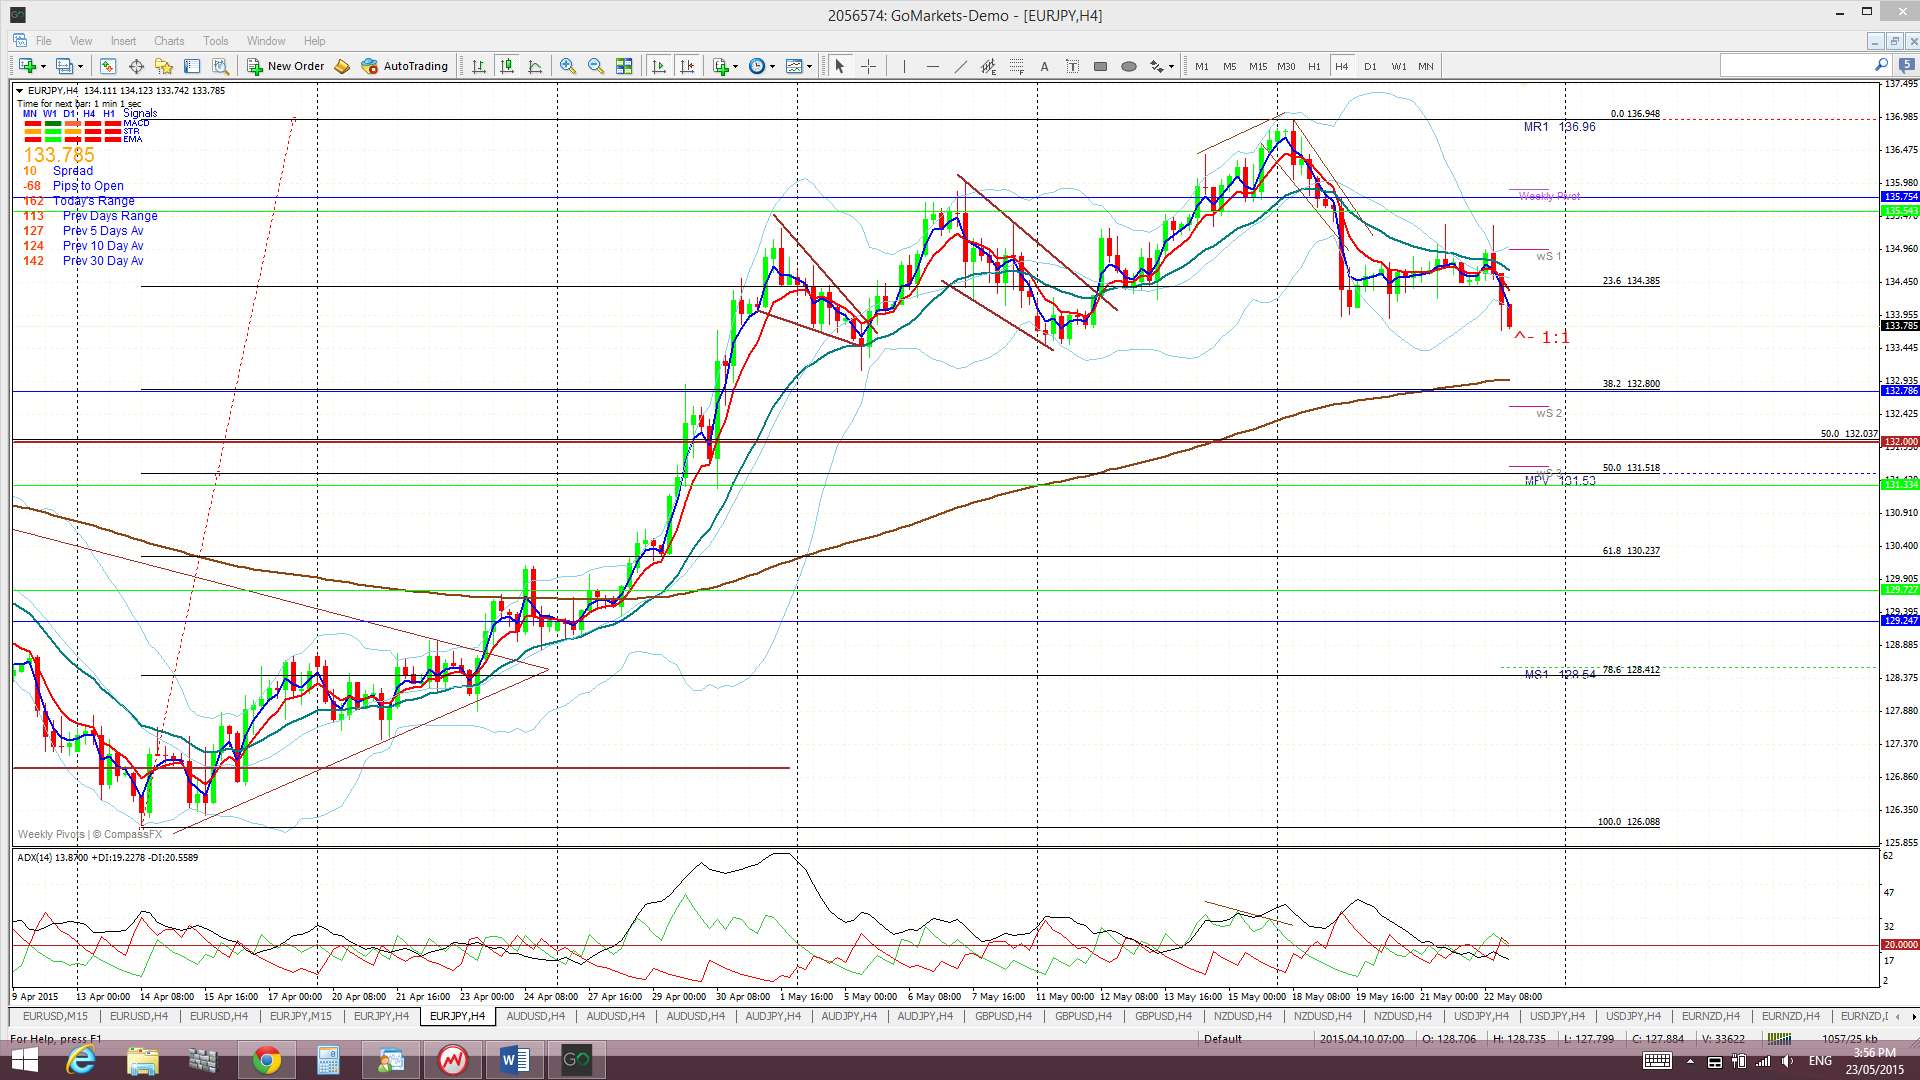
Like with the E/U, I’m seeing a possible bullish inverse H&S here too on the weekly chart. However, I’m also seeing a similar but larger bullish pattern on the monthly chart! Whilst there has been a recent bearish shift as seen on the 4hr chart the lack of momentum with this move, as seen from the ADX, is suggesting caution with loading up SHORT here just yet too.
Price is still trading below the Cloud on the 4hr and weekly charts but above on the daily and monthly charts.
The weekly candle closed as a large bearish candle.
- I’m watching for any new TC signal on this pair, the inverse H&S and the daily 200 EMA.
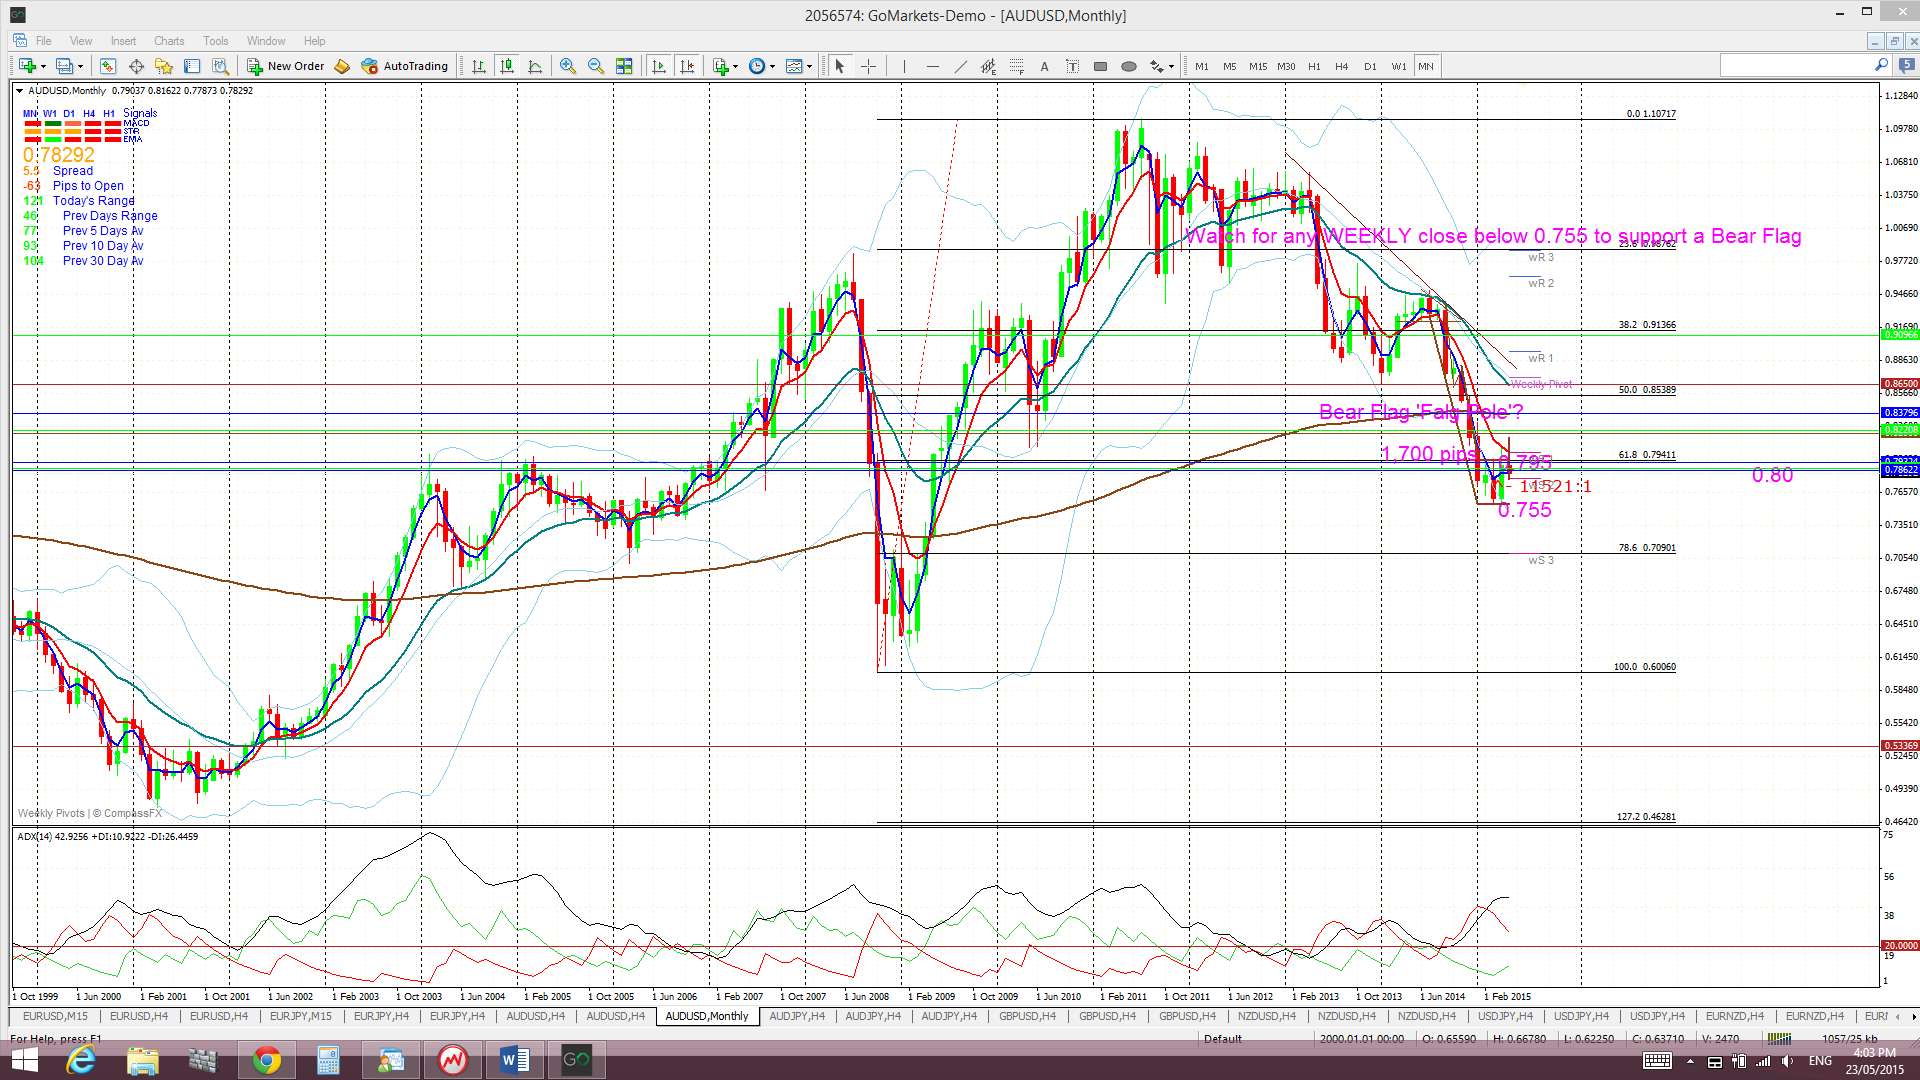
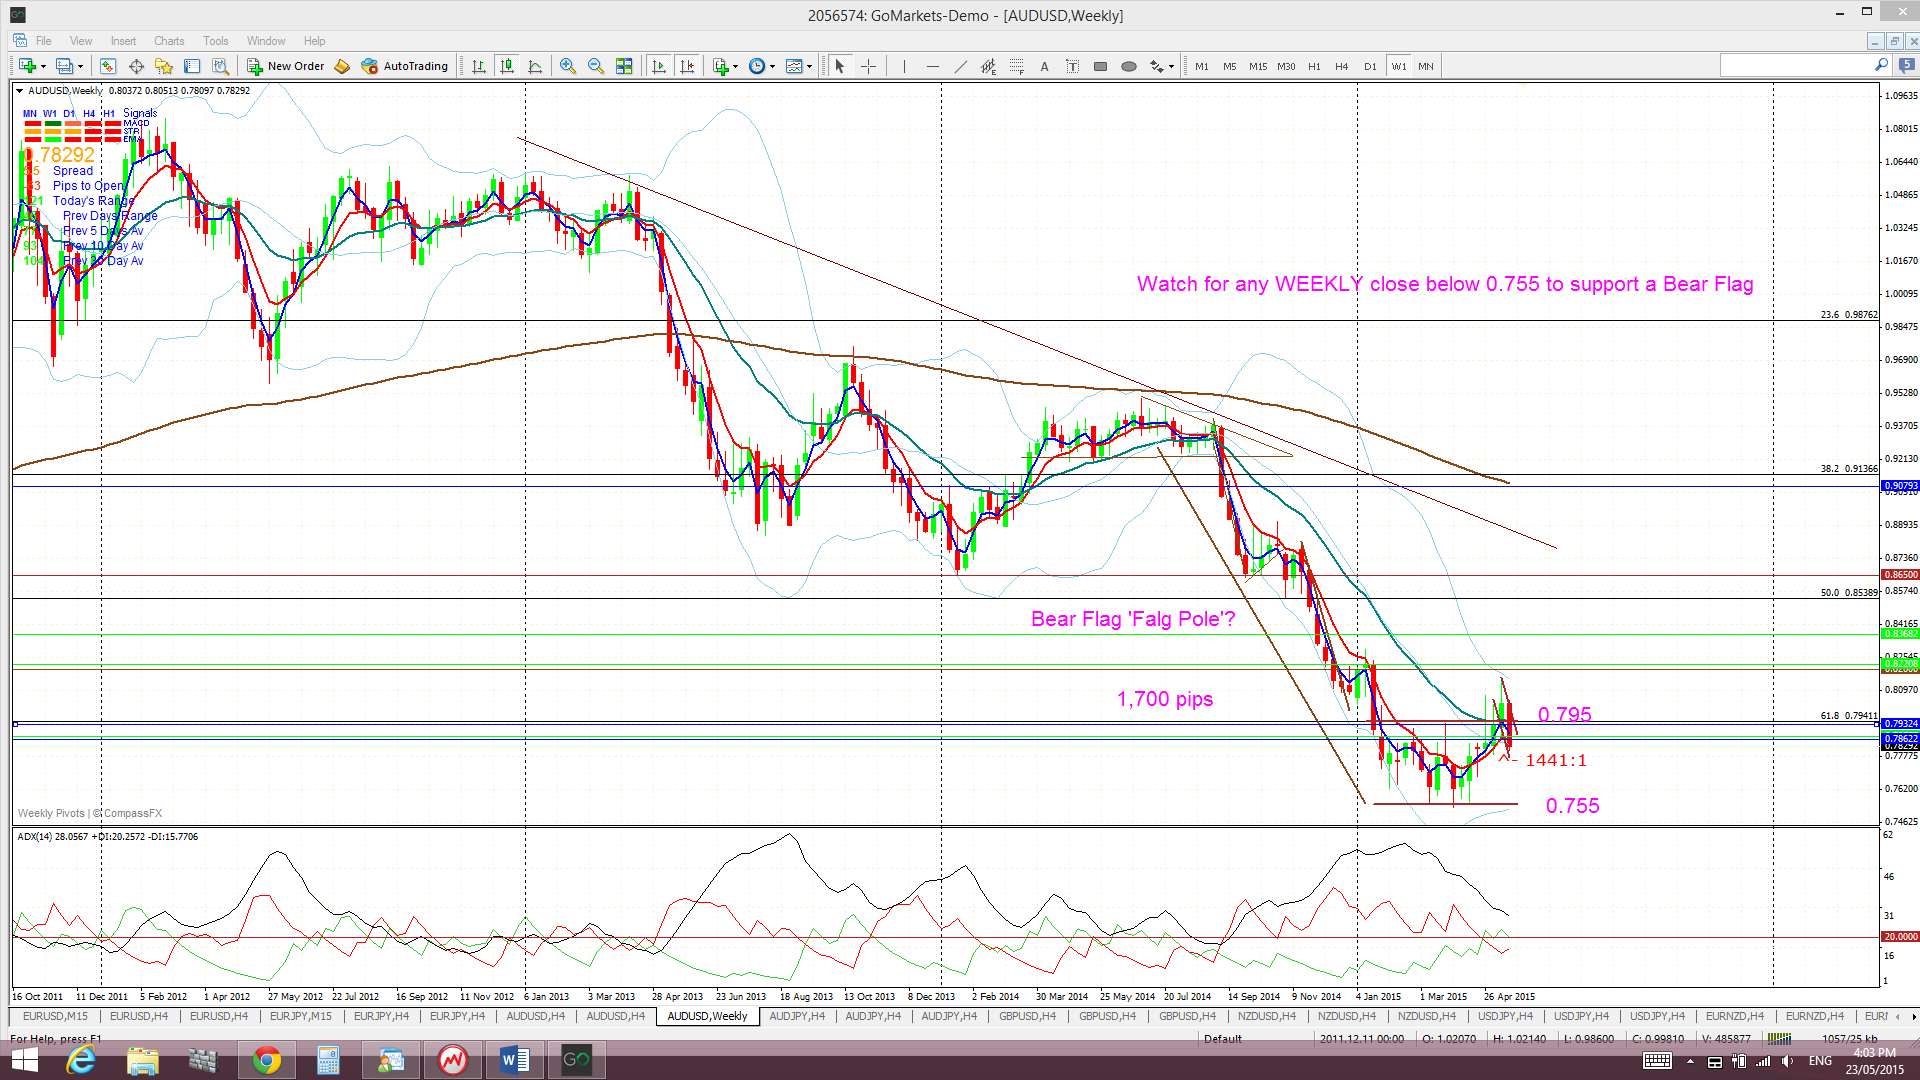
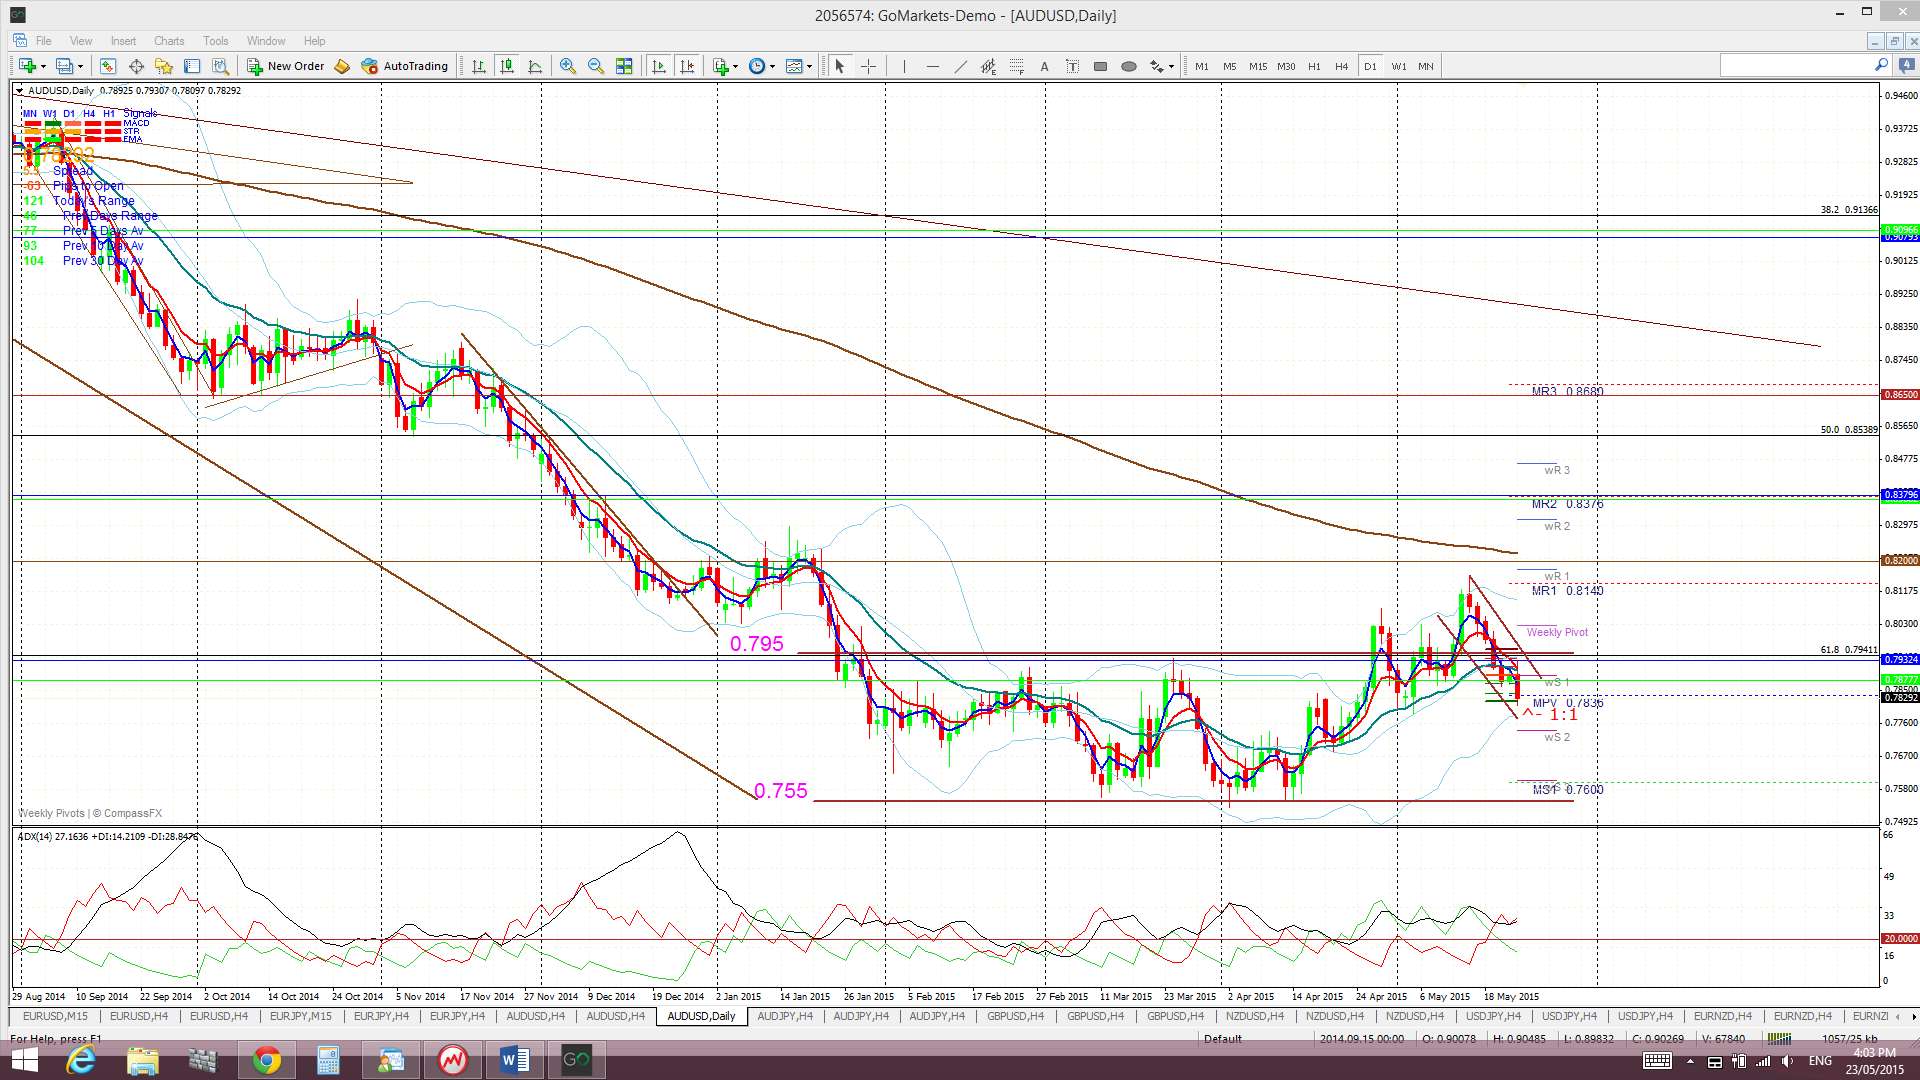
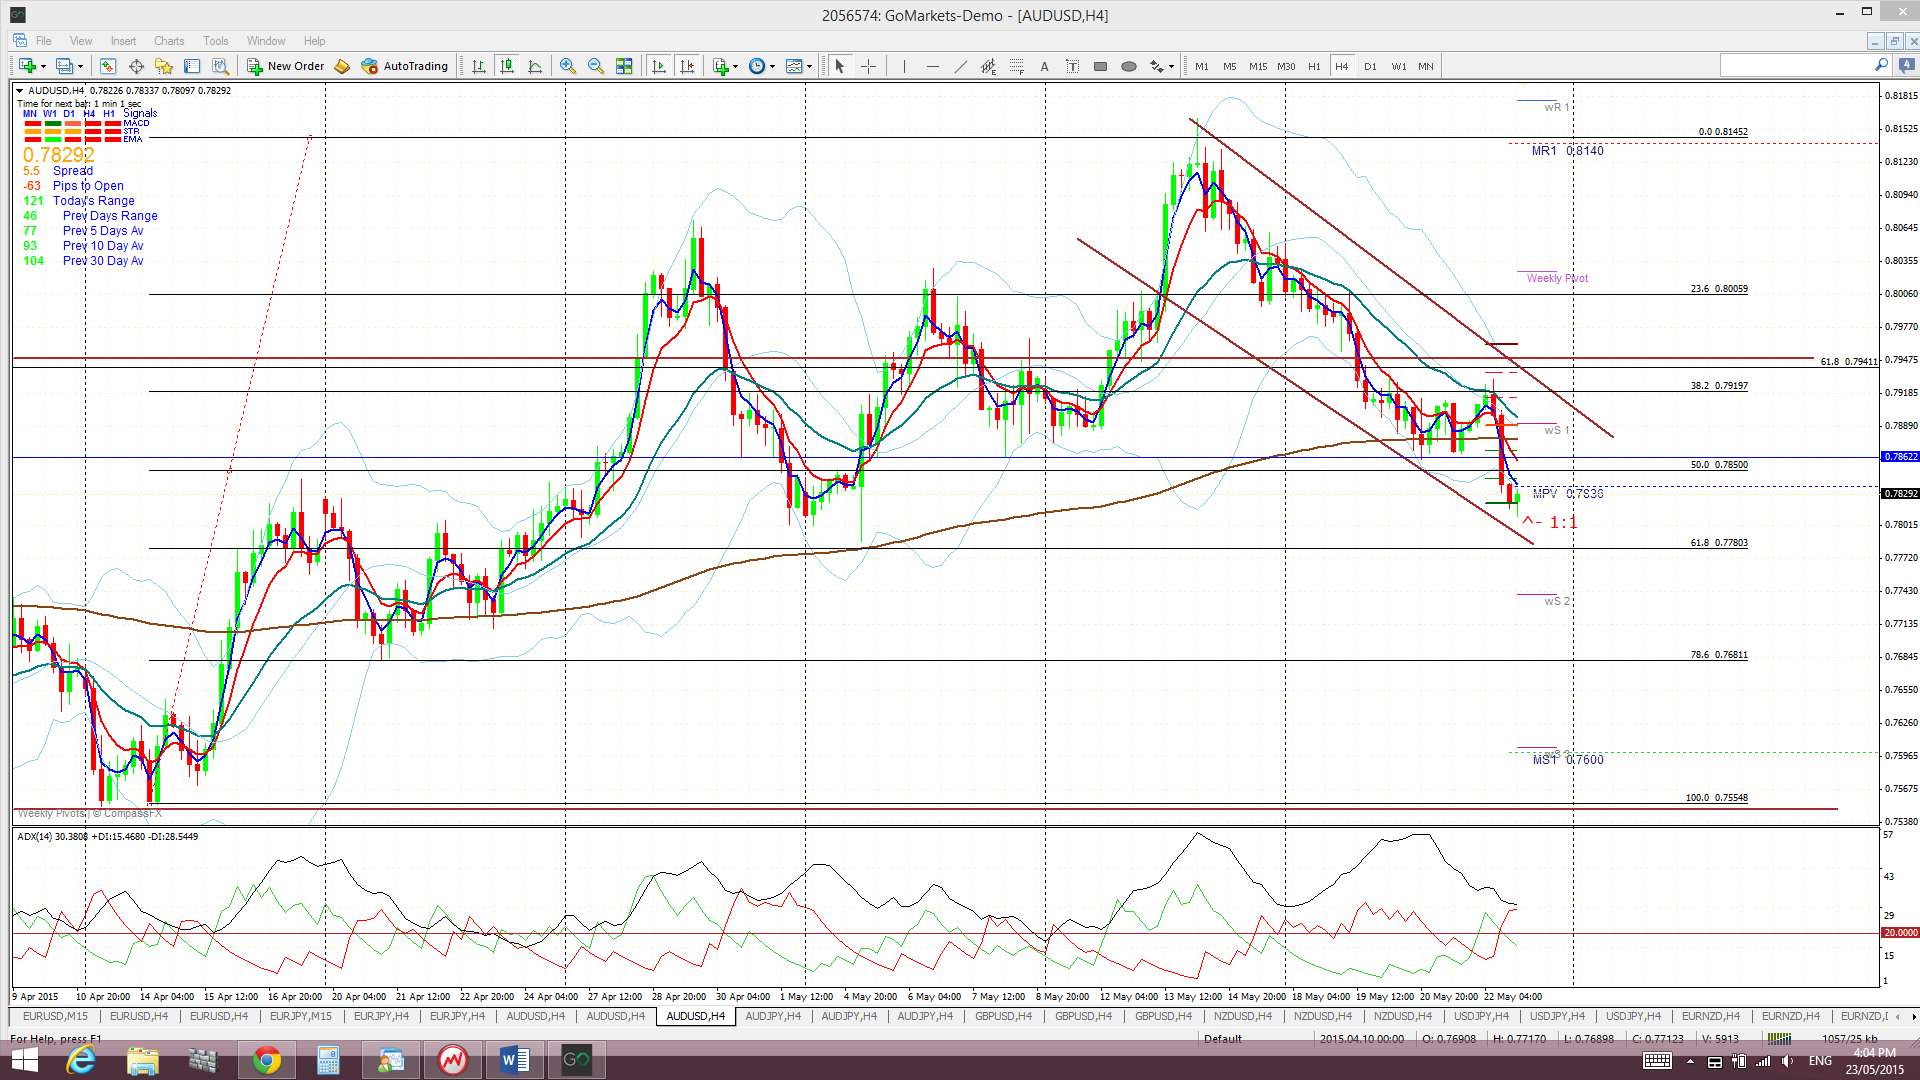
A/U: The A/U pulled back below the 0.795 level last week and this action is conforming to a descending trading channel. The 0.795 is a major level for this pair as it represents two key Fibonacci retracements: the 61.8% of the 2008-2011 move and the 50% fib of the 2001-2011 move (click on chart to enlarge):
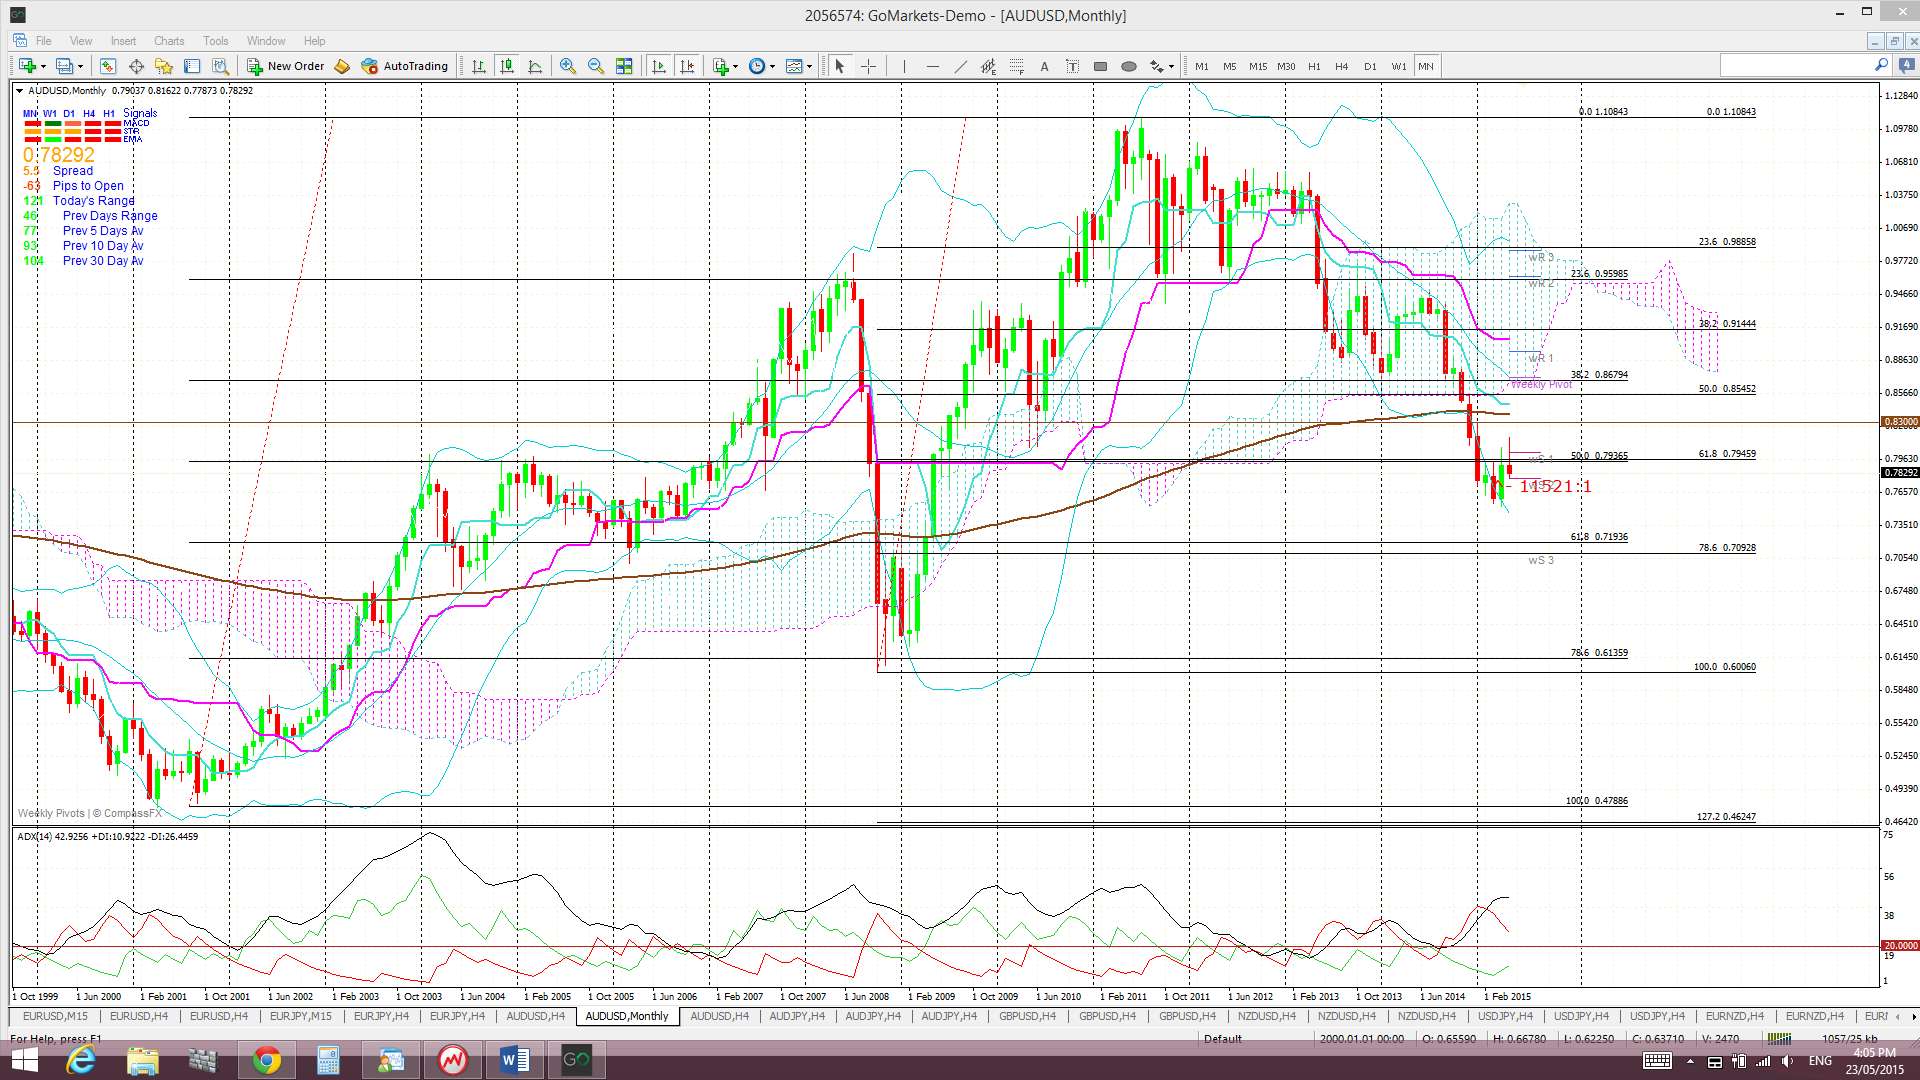
The daily charts shows a bit of a basing or cupping pattern evolving with the recent trading channel giving this a Cup ‘n’ Handle appearance. The weekly chart though shows a possible bearish H&S still brewing with any break and hold below 0.755 supporting this.
Price is trading below the Cloud on the 4hr, weekly and monthly charts but above the Cloud on the daily chart.
The weekly candle closed as a bearish engulfing candle.
- I’m watching for any new TC signal on this pair, the 0.795 level and the channel trend lines.
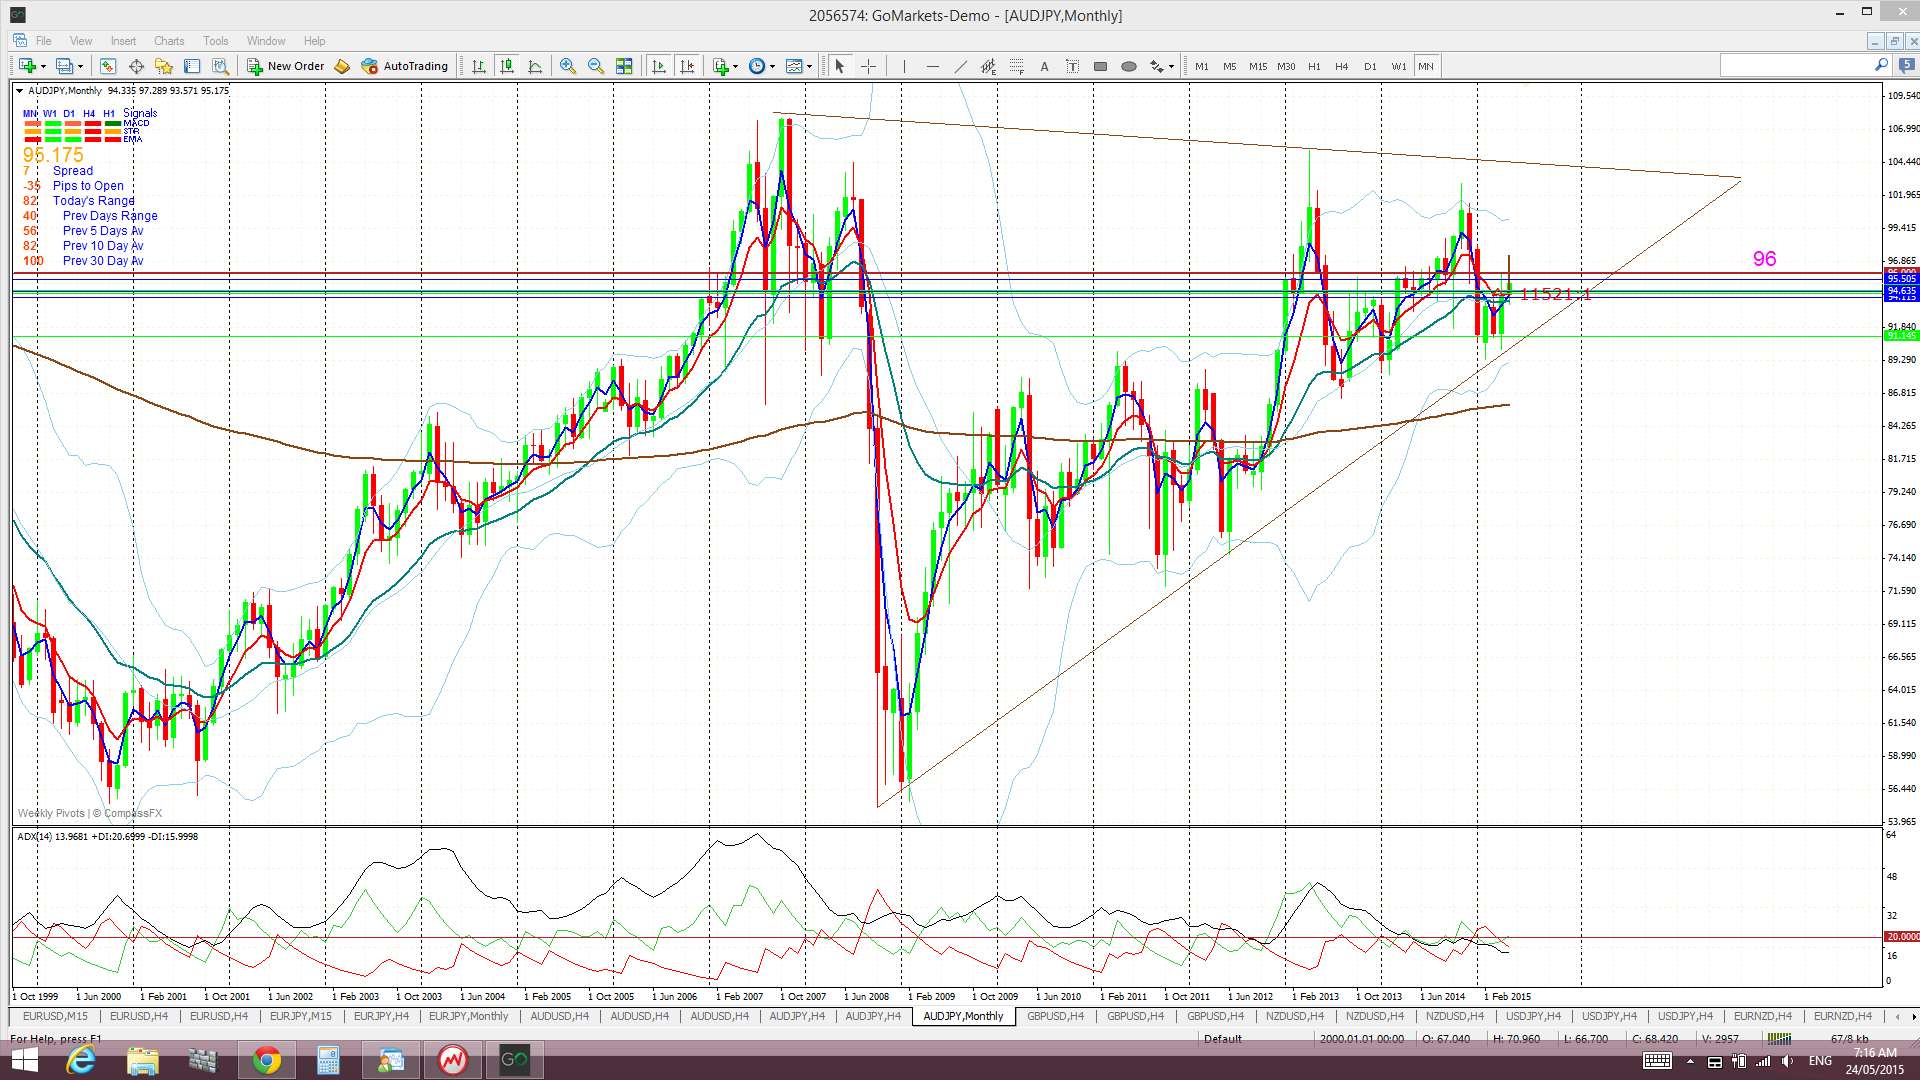
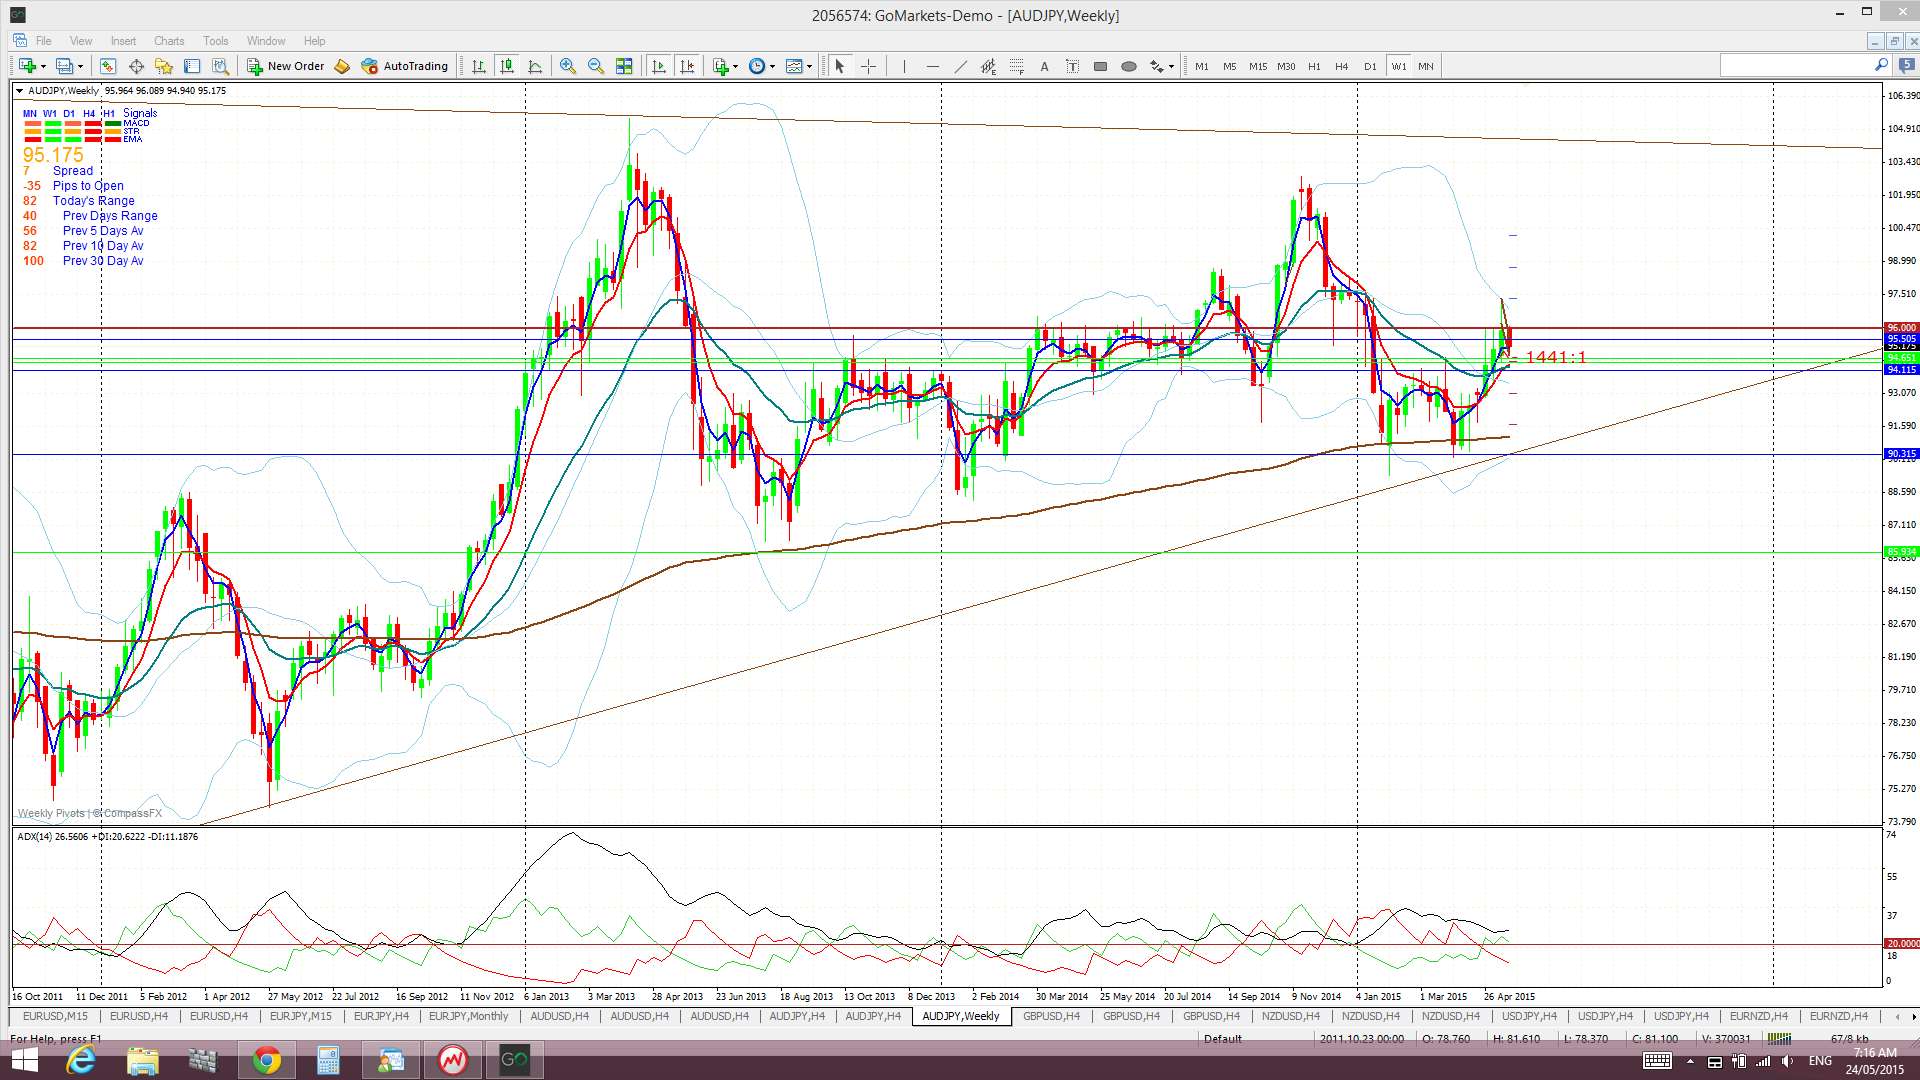
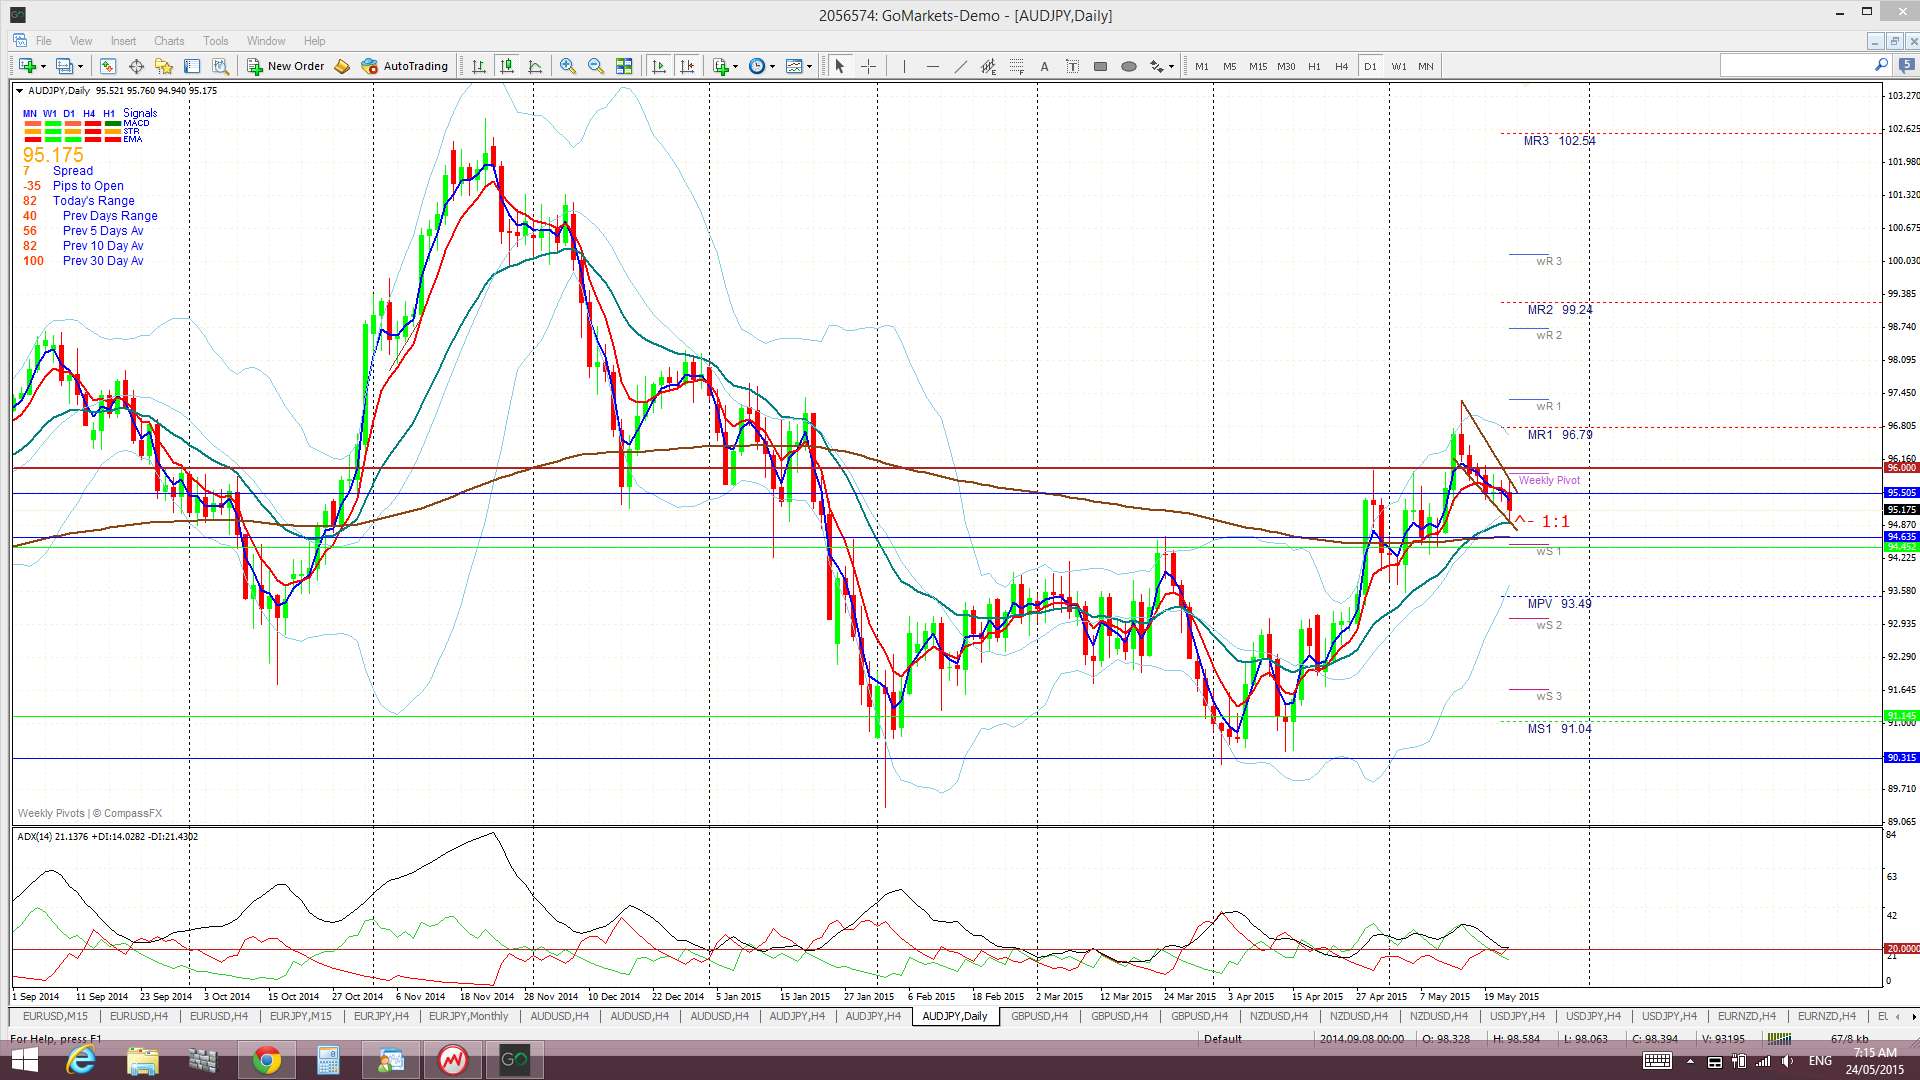
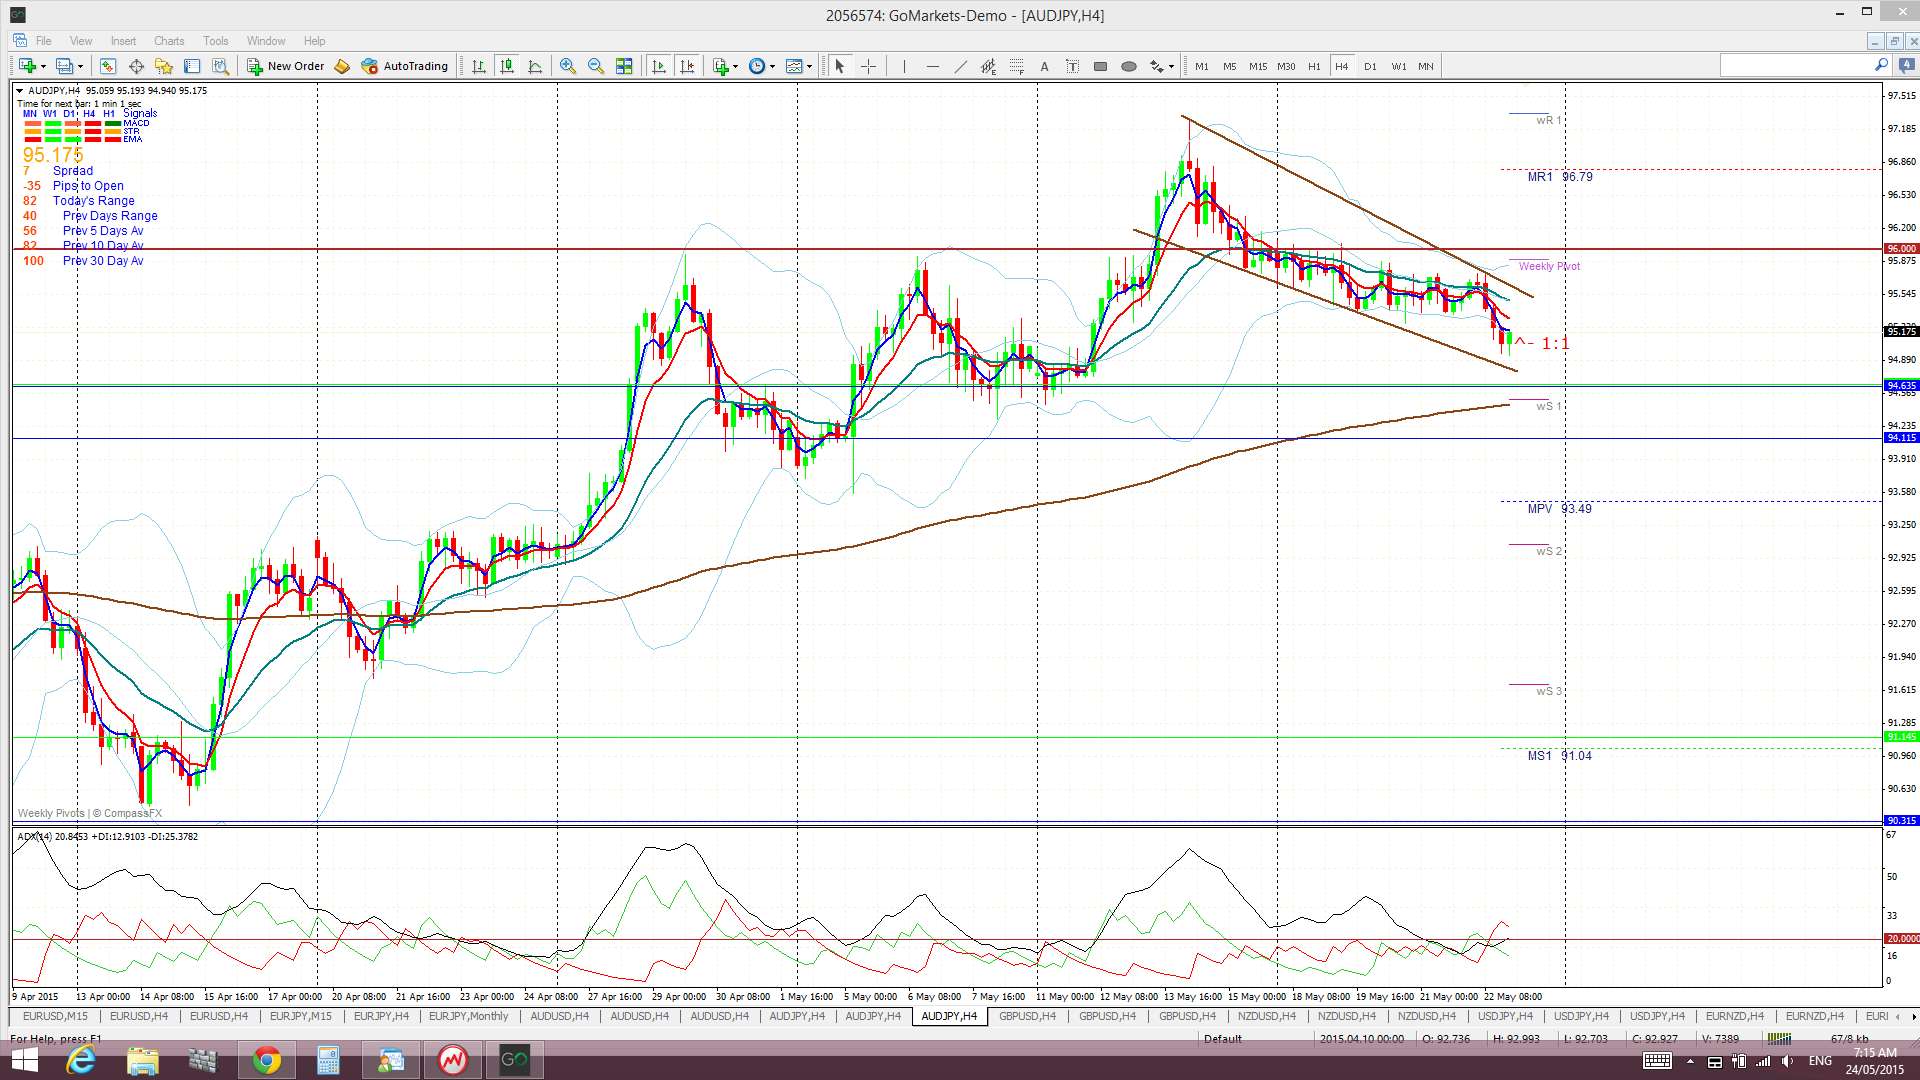
A/J: The A/J chopped around under the S/R level of 96 last week and this action is conforming to a descending trading channel here too. 96 is a major S/R level for this pair and remains the one to watch in coming sessions; for either a make or break.
The weekly chart continues to show price action holding above the weekly 200 EMA and the monthly chart shows the A/J conforming to a triangle pattern.
Price is trading below the Cloud on the 4hr and weekly charts but above on the daily and monthly charts.
The weekly candle closed as a small bearish coloured, almost ‘inside’, candle.
- I’m watching for any new TC signal on this pair, the 96 level and the channel trend lines.
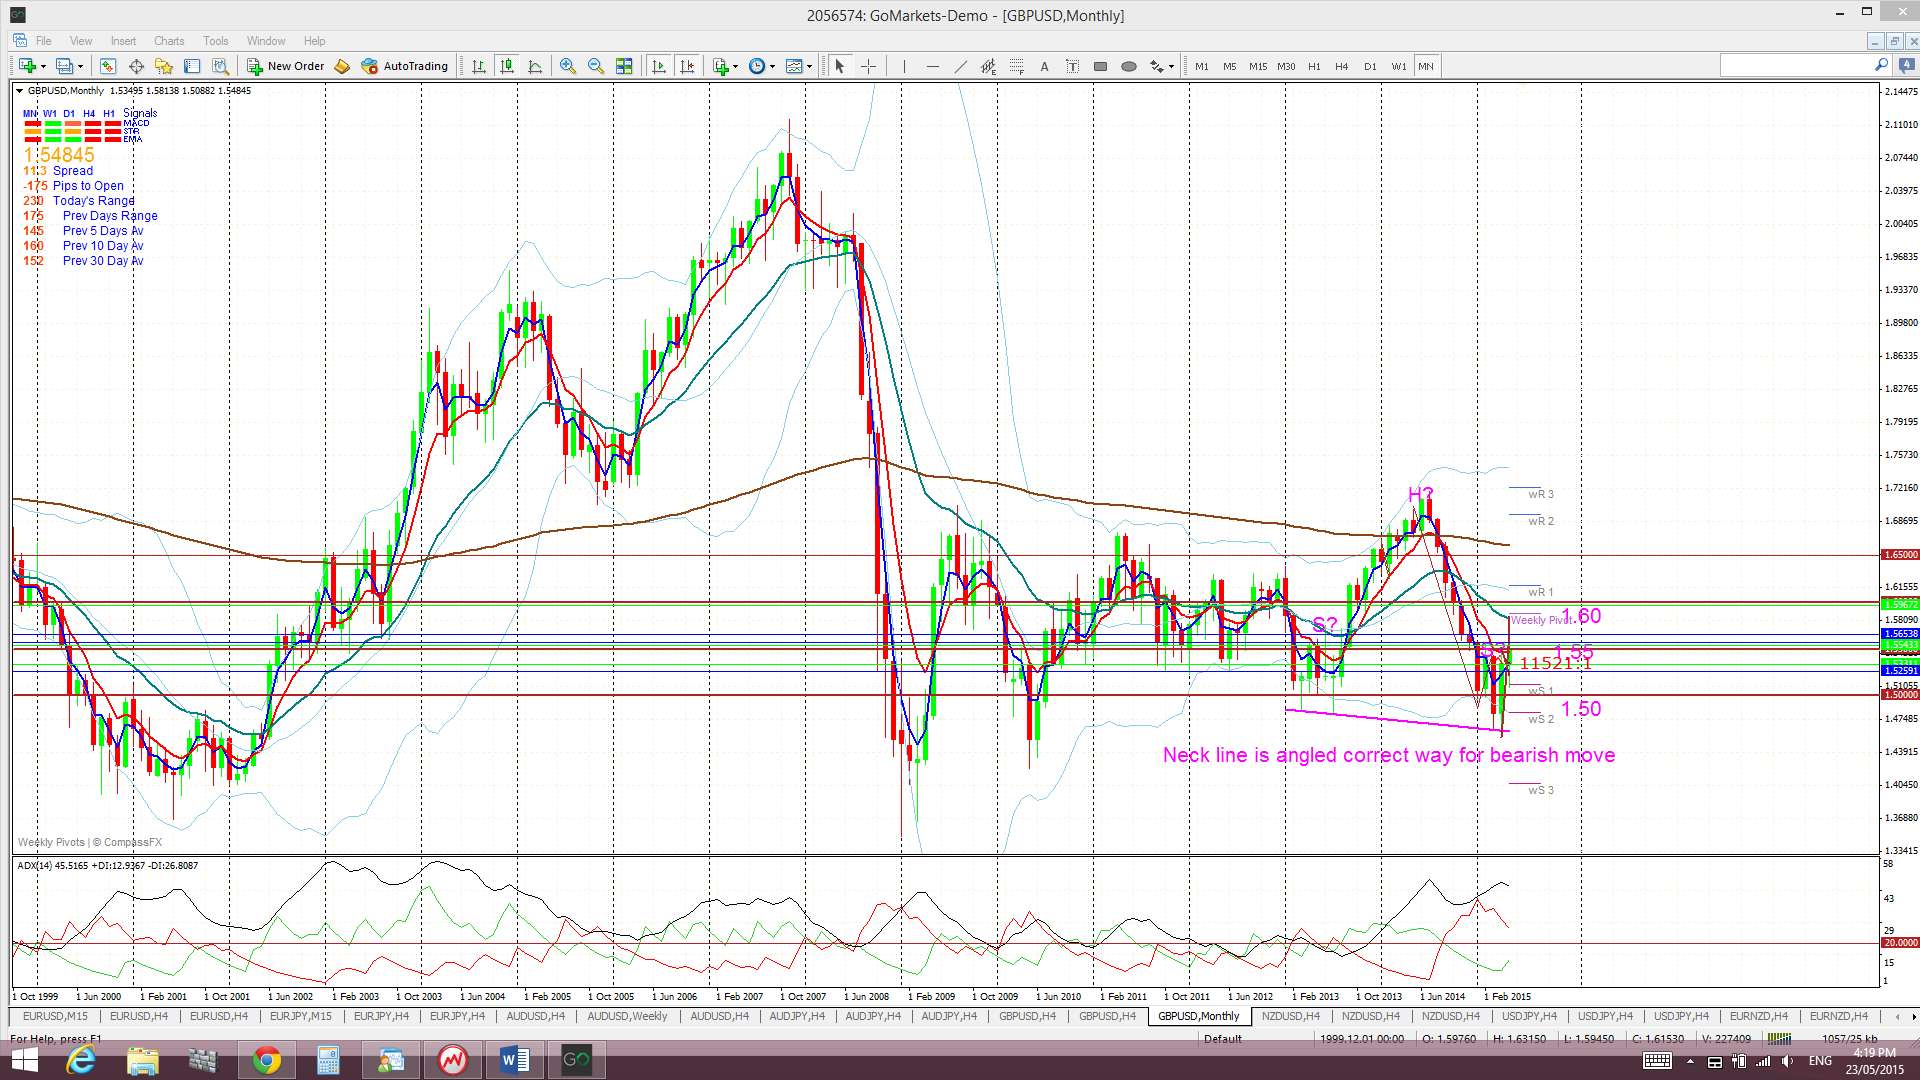
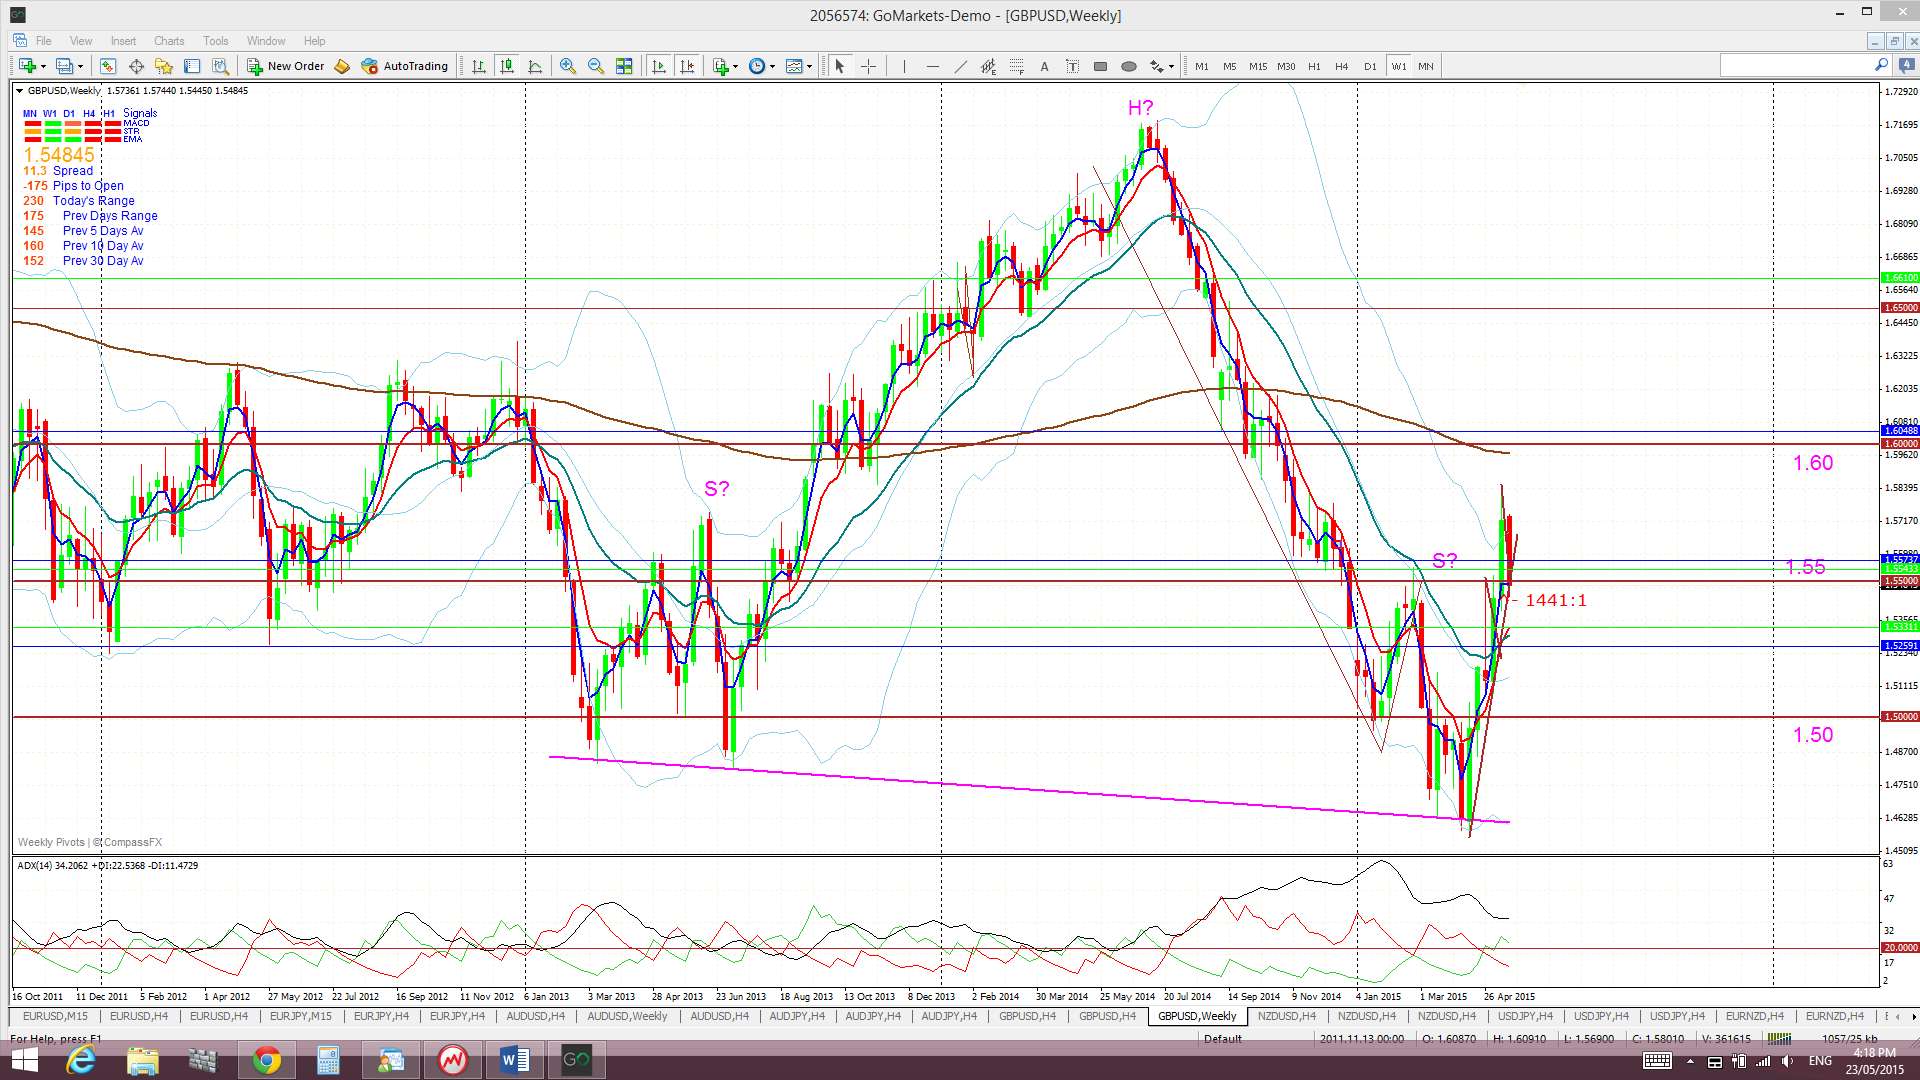
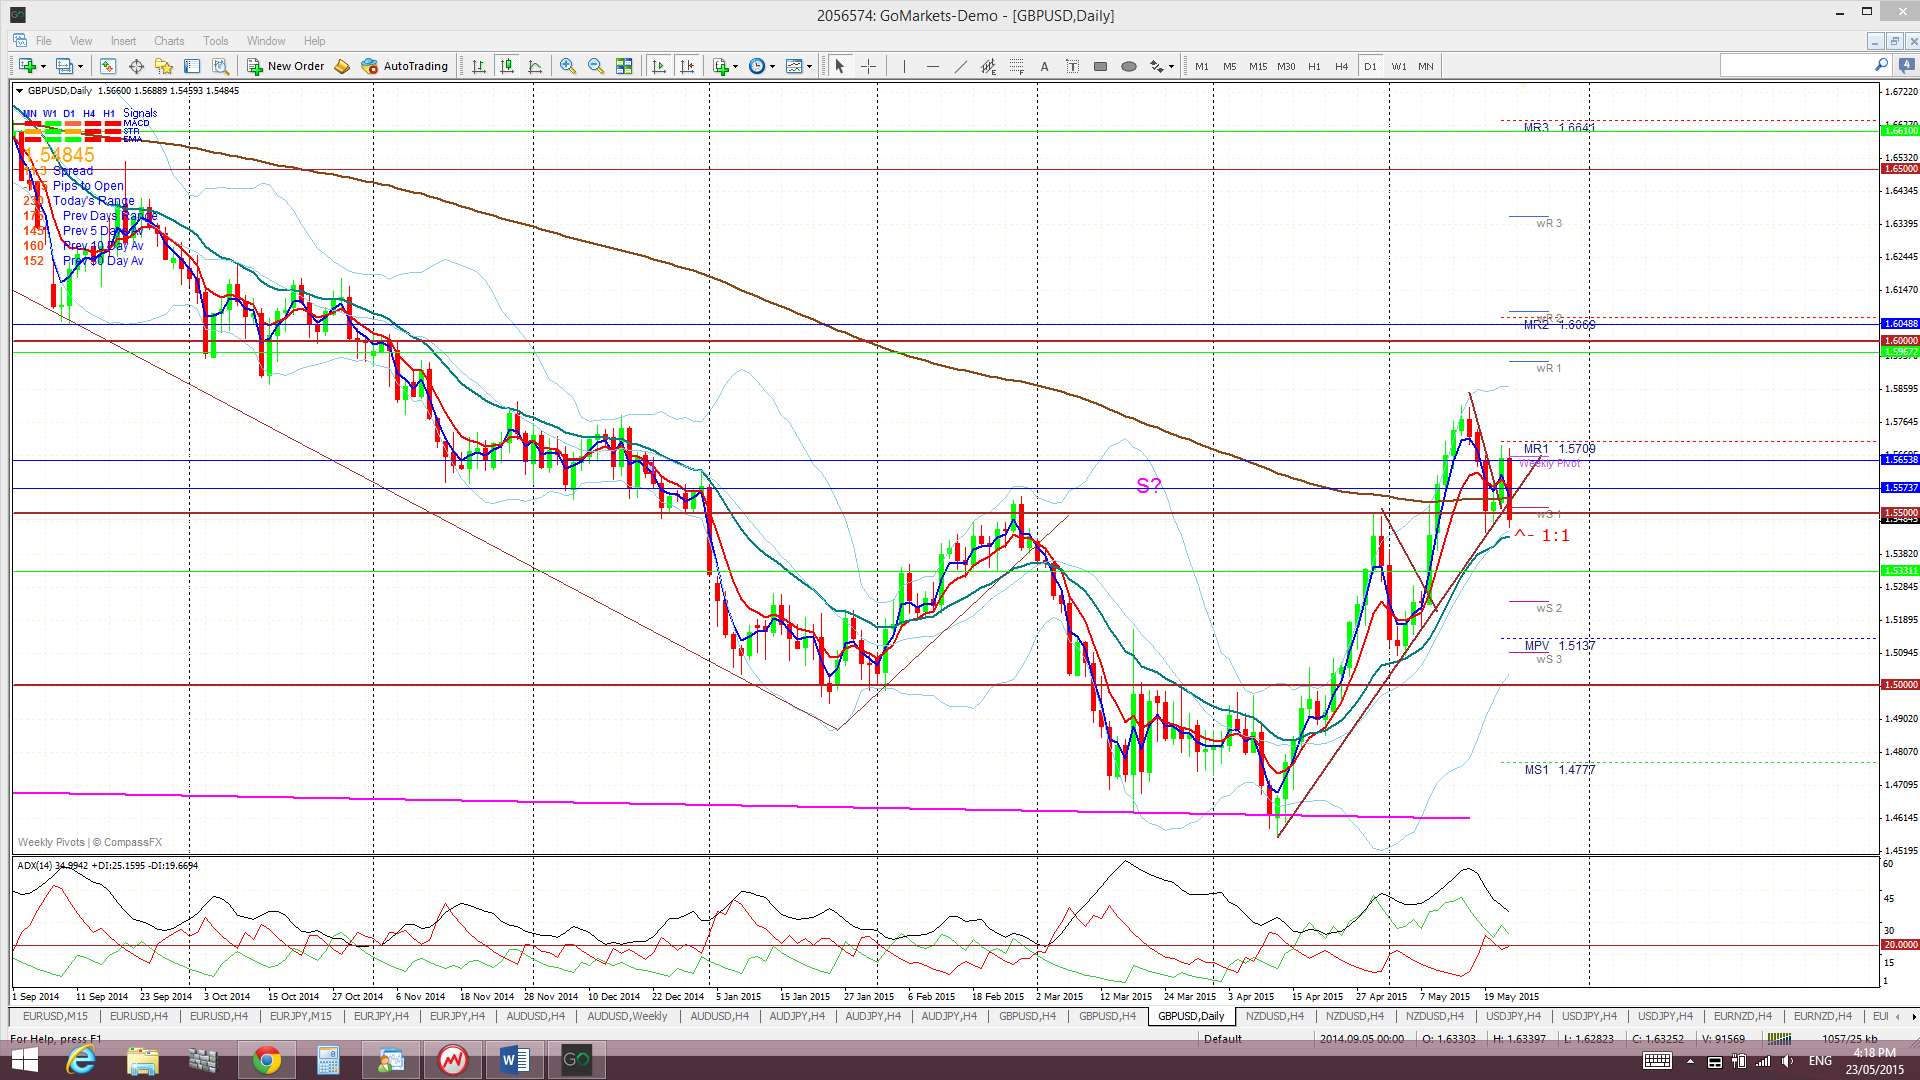
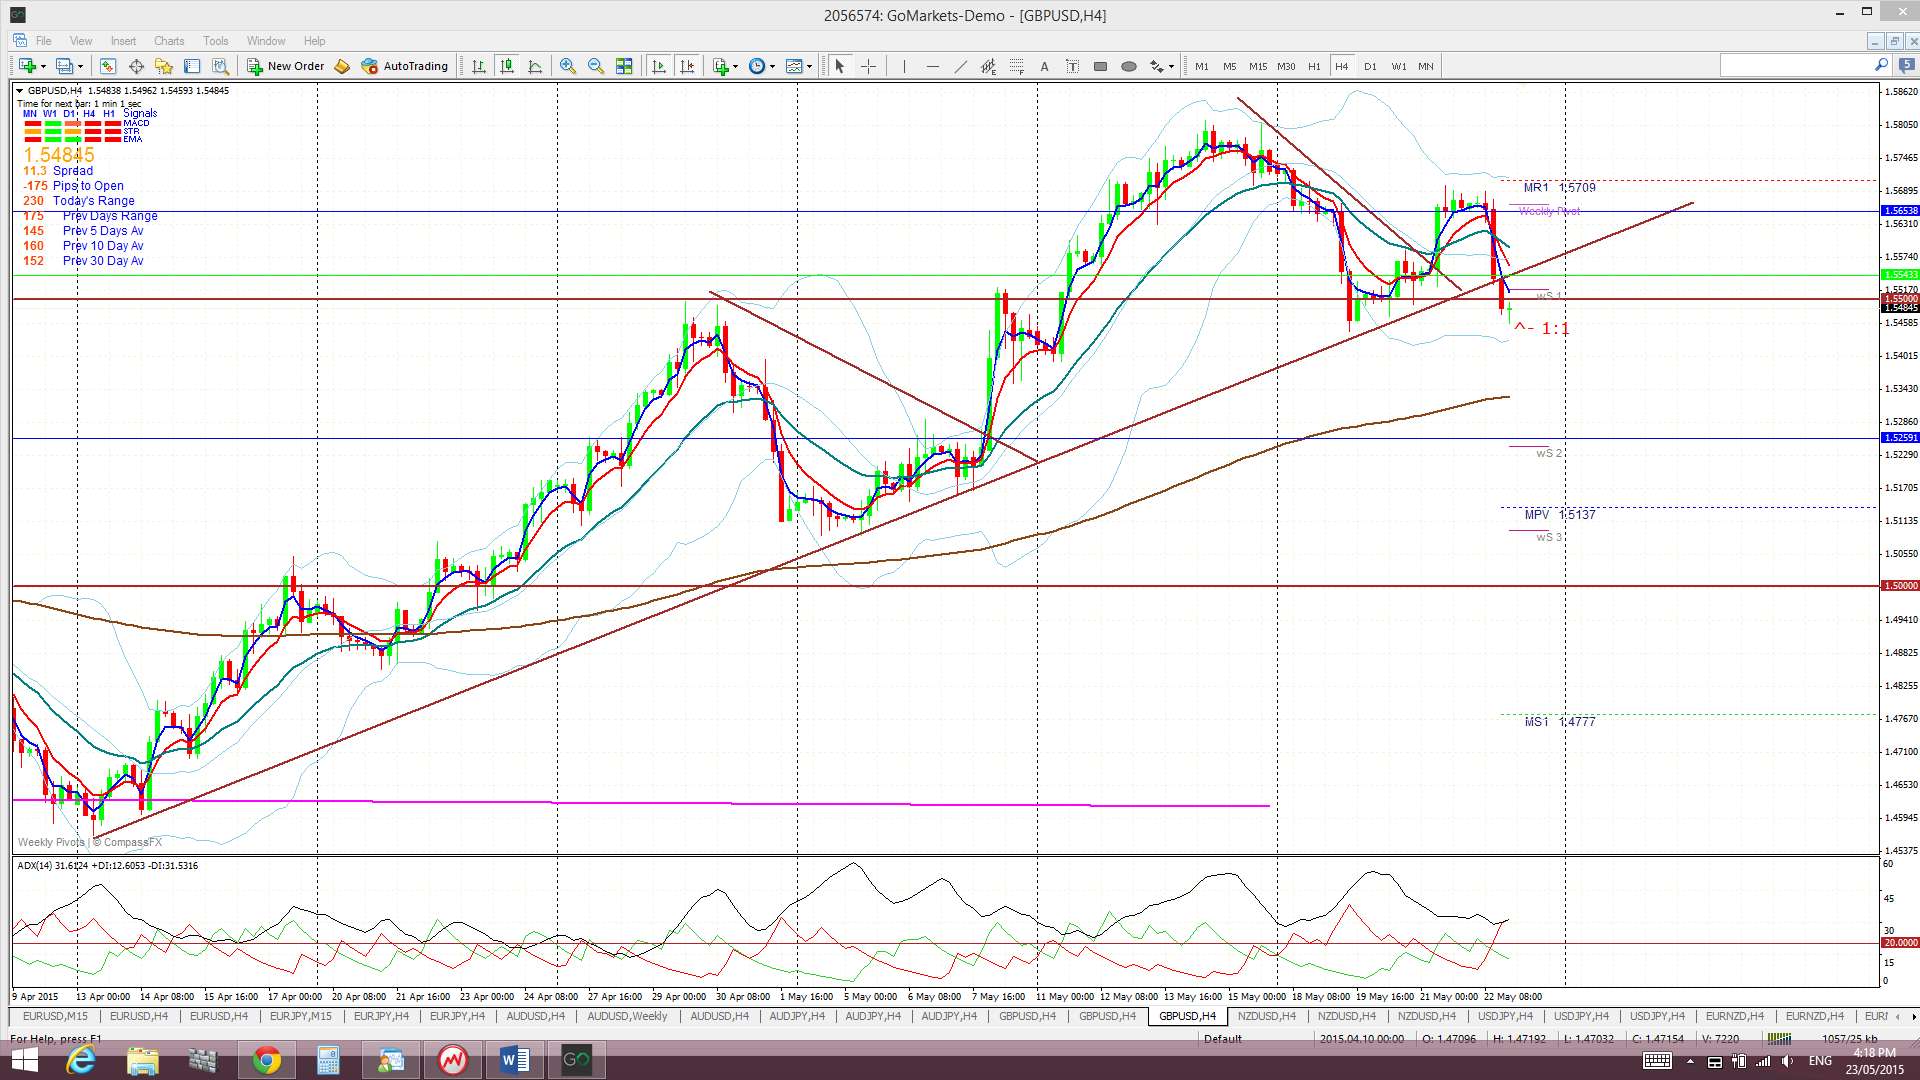
G/U: The Cable pulled back to test the 1.55 support level last week following disappointing GBP CPI but better than expected GBP Retail Sales data on Thursday saw this pair rally to break up and out from a recent triangle pattern. However, US$ strength returned on Friday following US CPI data and this took the Cable lower and to close the week below both the key 1.55 level and a 6-week support trend line. I had thought that the weekly chart’s bearish H&S was done and dusted but the weekly close back below 1.55 has helped to keep this alive for the time being.
Weekly chart H&S: There is a possible bearish H&S pattern forming on the weekly chart and the failure to continue above 1.55 is supporting this pattern for the time being. The height of the pattern is about 2,400 pips and suggests a similar move lower with any break and hold below the ‘neck line’. Recall that the GBP/USD printed a monthly close in March below 1.50, the first since June 2010. This bearish development supports the H&S pattern BUT we will need to see a close and hold below the ‘neck line’ to confirm any such bearish breakdown. I will also be watching the 1.55 level as any weekly close and hold above this would void this pattern for me.
Any bullish continuation back above 1.55 though would suggest a trip up to near the 50% fib of this swing low move might be in order as this is also near the weekly 200 EMA and the key 1.60 level.
Price is now trading in the bottom of Cloud on the 4hr and monthly charts, above the Cloud on the daily chart but below the Cloud on the weekly chart.
Apart from US$ sensitive data there is only Second Estimates GDP data scheduled for the GBP this week. Whilst last week’s negative CPI raised much concern the upbeat Retail Sales seemed to off-set that somewhat. However, any continued US$ strength will be hard to contend with here.
The weekly candle closed as a large bearish candle.
- I’m watching for any new TC signal on this pair and the 1.55 level.
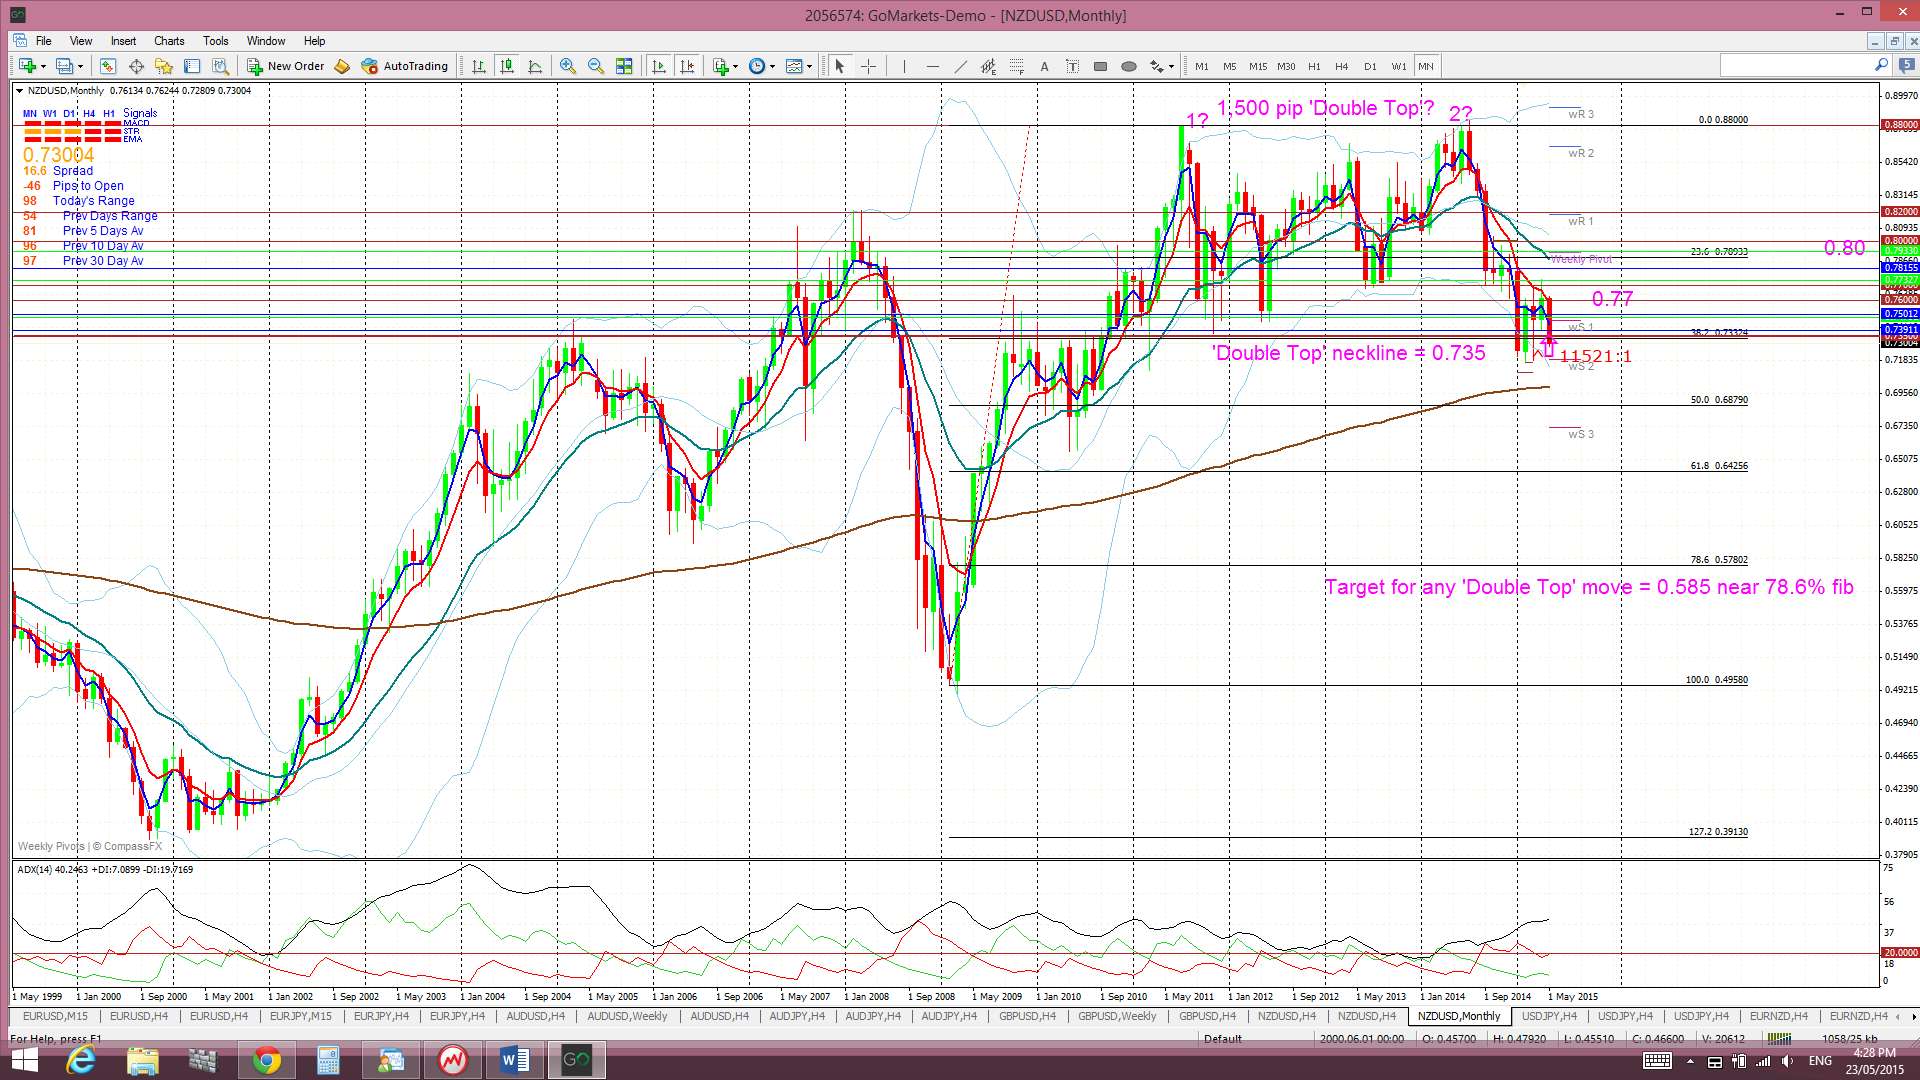
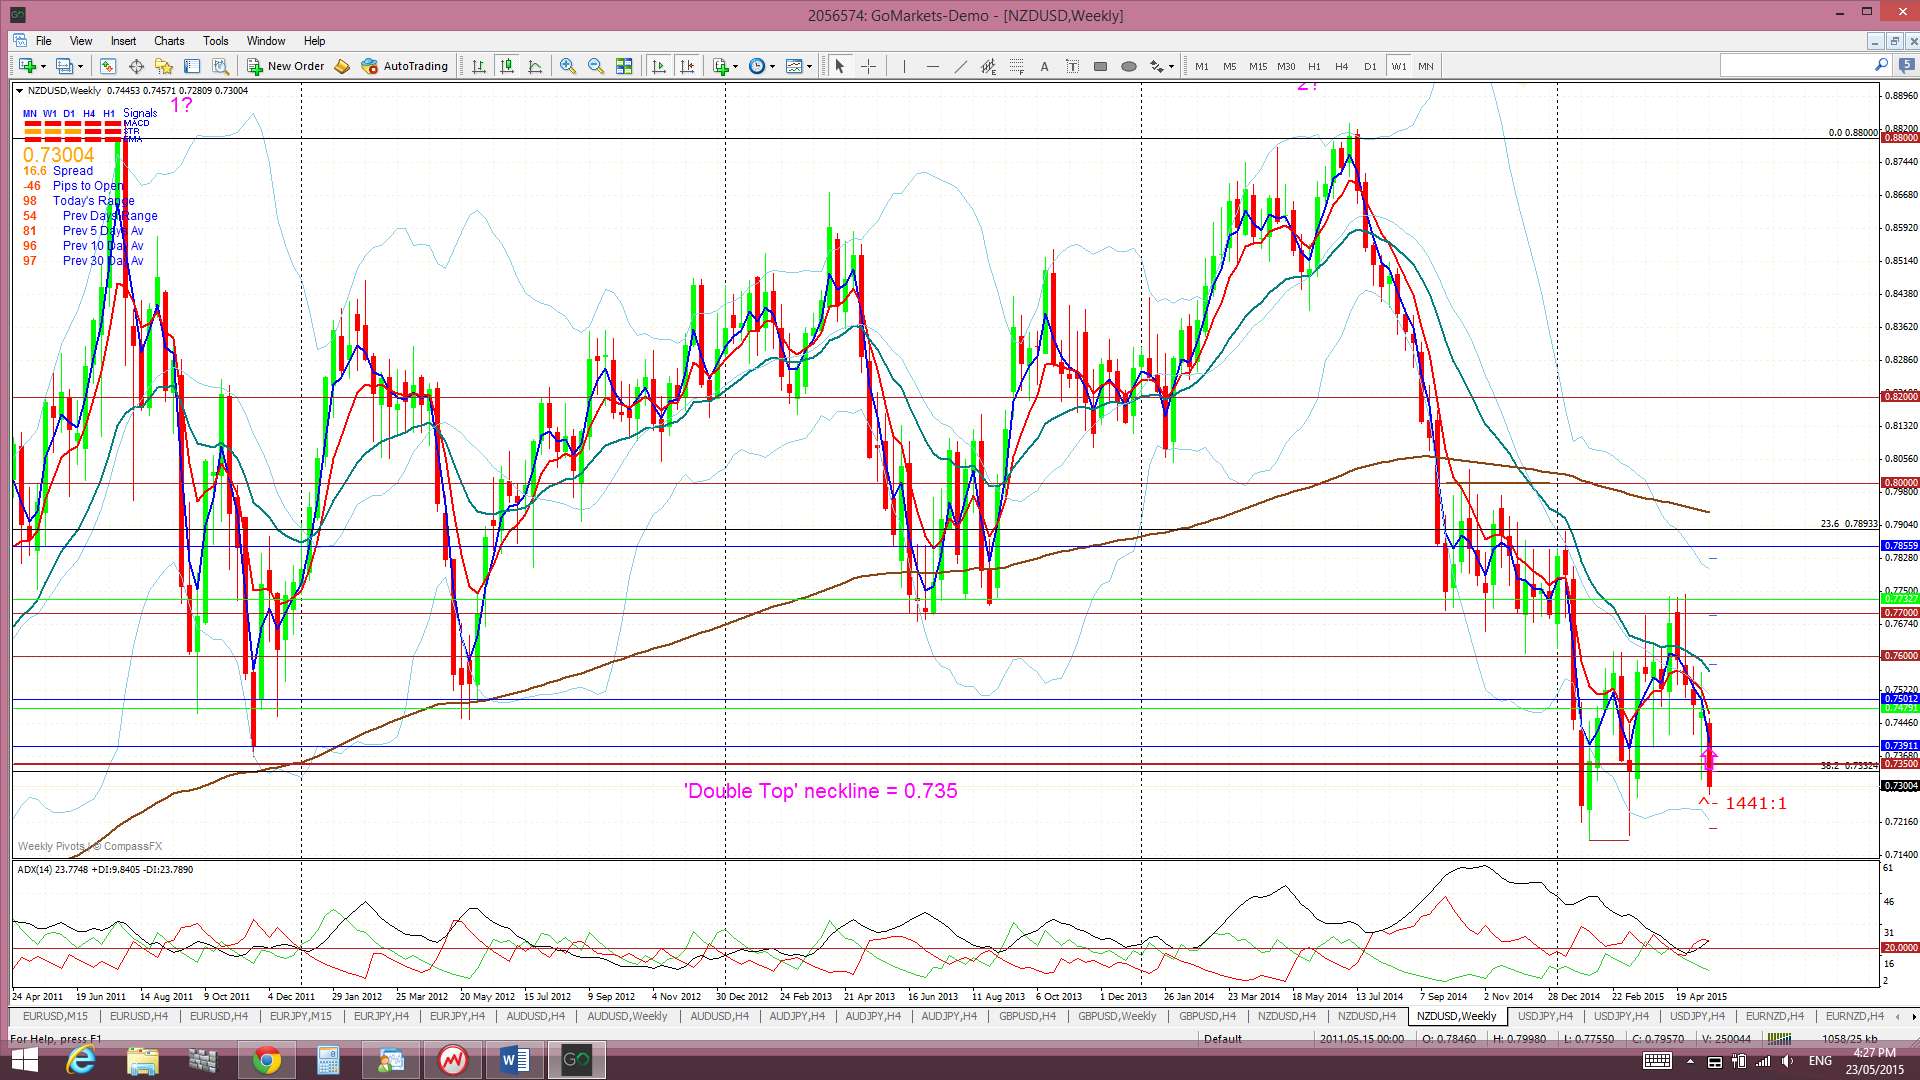
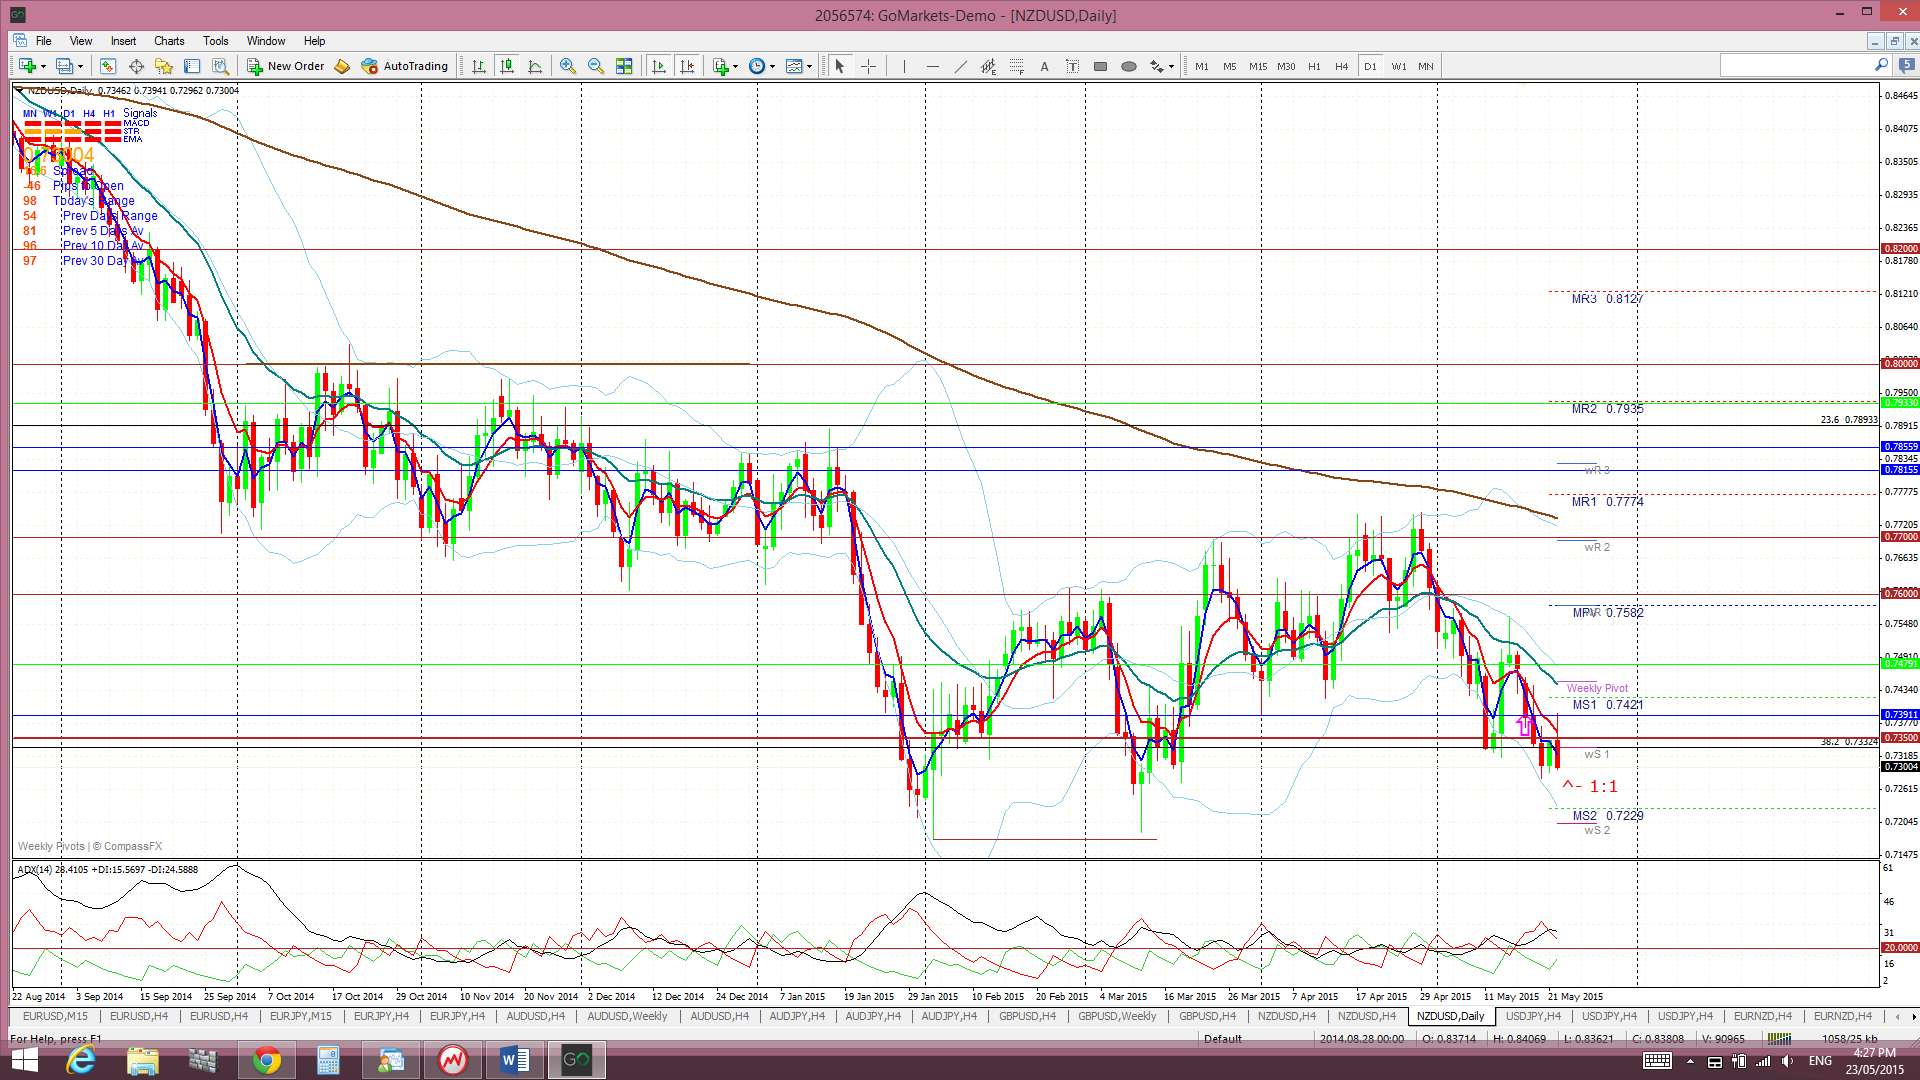
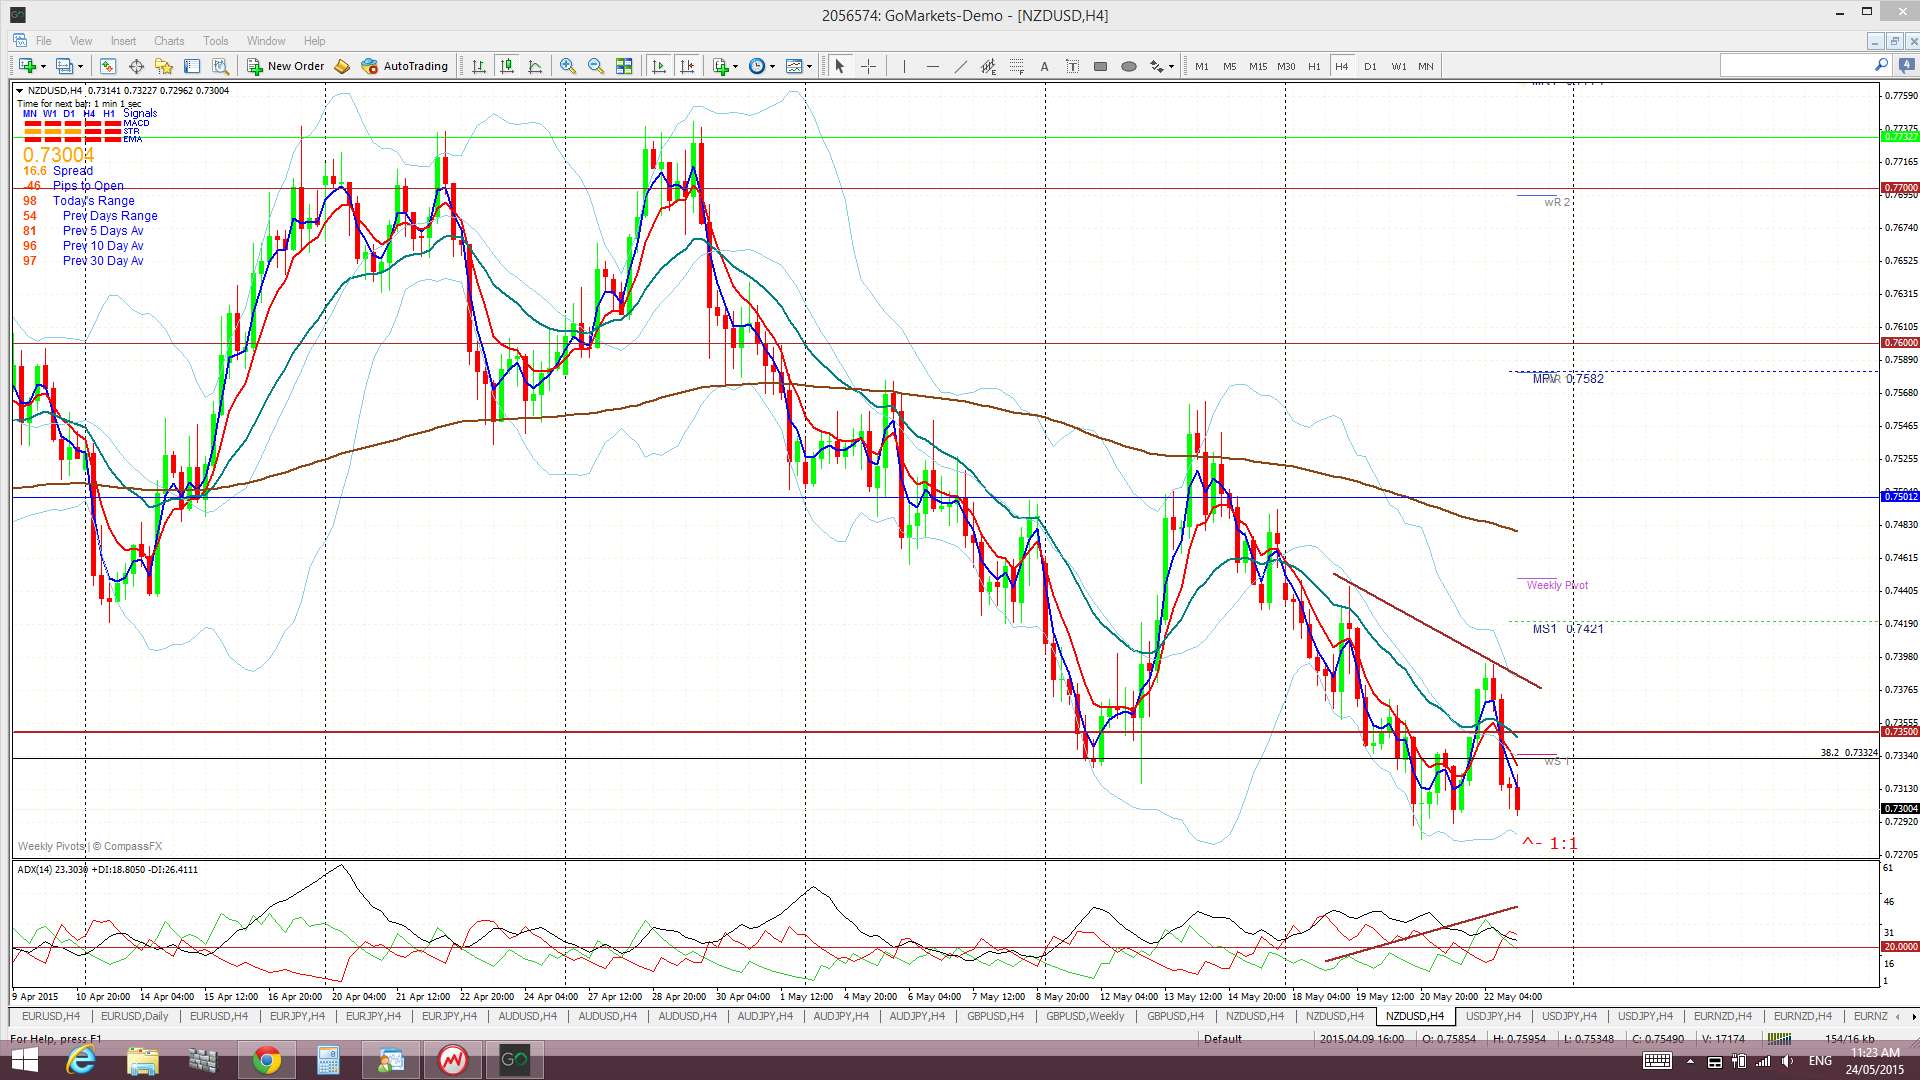
Kiwi: NZD/USD: The Kiwi chopped lower last week and after testing the 0.735 level again has now closed the week below this key S/R level. There is divergence evident on the 4hr chart between price and buying momentum though so SHORTs might need to be careful here.
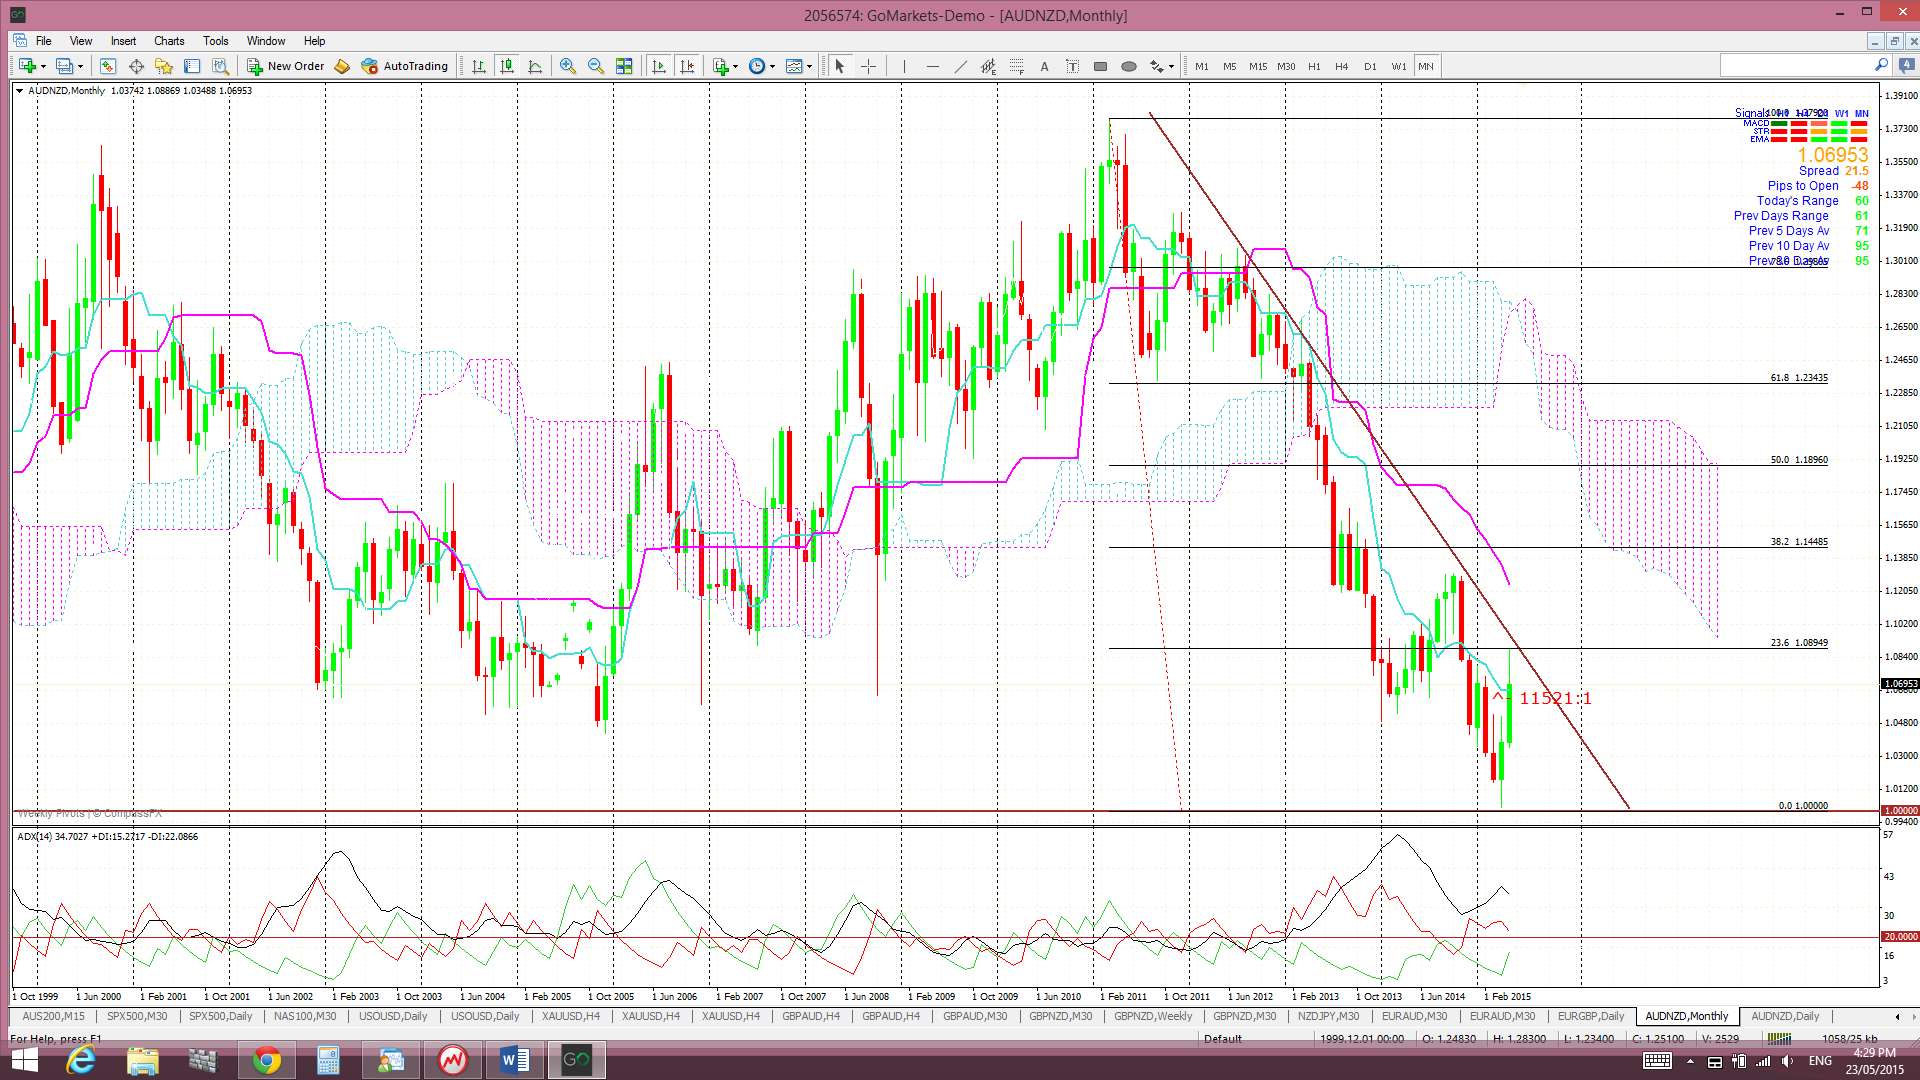
I still want to draw attention to the AUD/NZD monthly chart. The monthly candle closed for April as a bullish engulfing candle above parity and may suggest a reversal here although it is facing a 5-year bear trend line. This would sit quite reasonably for me if the US$ continues to weaken. Both the AUD and NZD are commodity currencies and would benefit from any continued US$ weakness. However, Australia has both ‘hard’ and ‘soft’ commodities whereas New Zealand has mostly ‘soft’ commodities. Thus, US$ weakness and a recovery with commodity pricing stands to add more support to Australia relative to New Zealand.
‘Double Top’ breakdown on Monthly chart? The monthly chart still reveals a possible ‘Double Top’ pattern with a neck line at 0.735 in the making. The monthly candle close below this level for January suggested a possible 2,000 pip bearish follow through move as this is the height of the ‘Double Top’ BUT there does not seem to be a hold below this key level JUST YET.
Price is trading below the Ichimoku Cloud on the 4hr, daily and weekly charts but in the middle of the Cloud on the monthly chart.
The weekly candle closed as a bearish engulfing candle.
- I’m watching for any new TC signal on this pair.
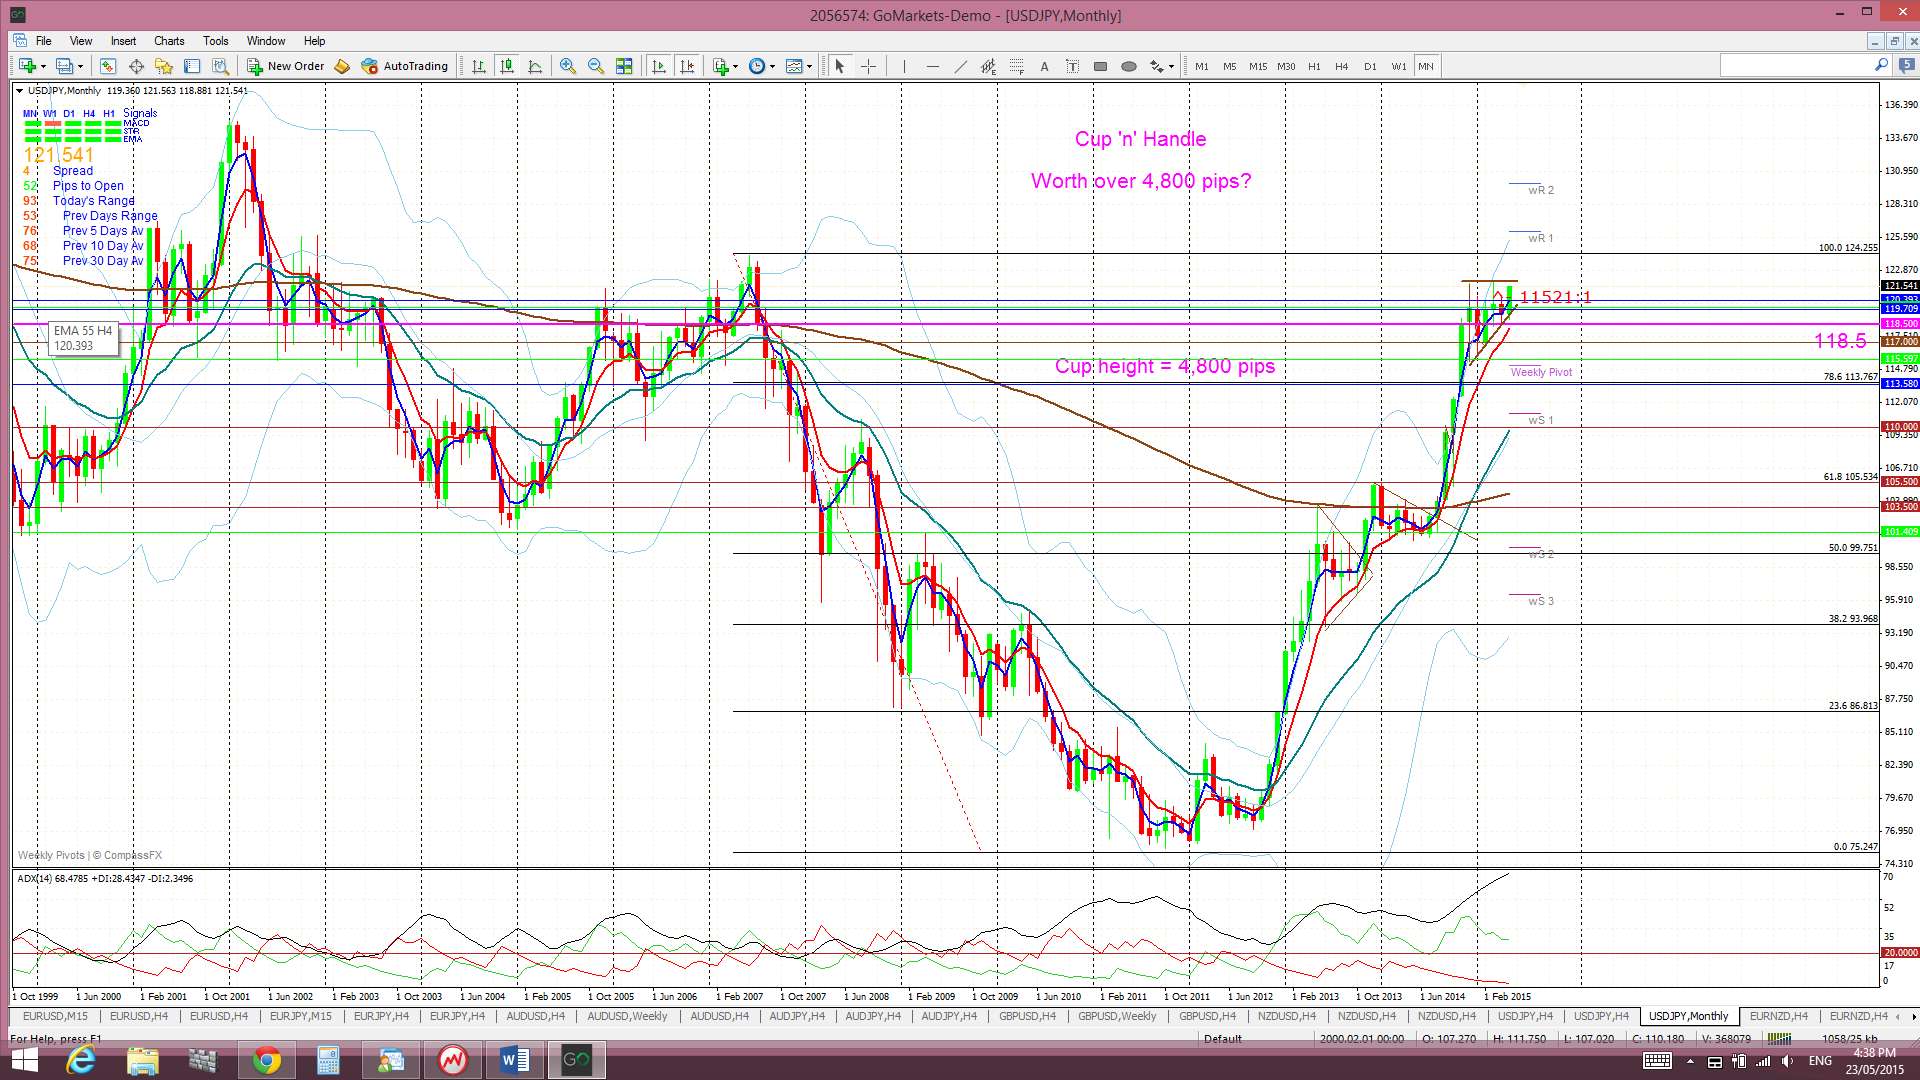
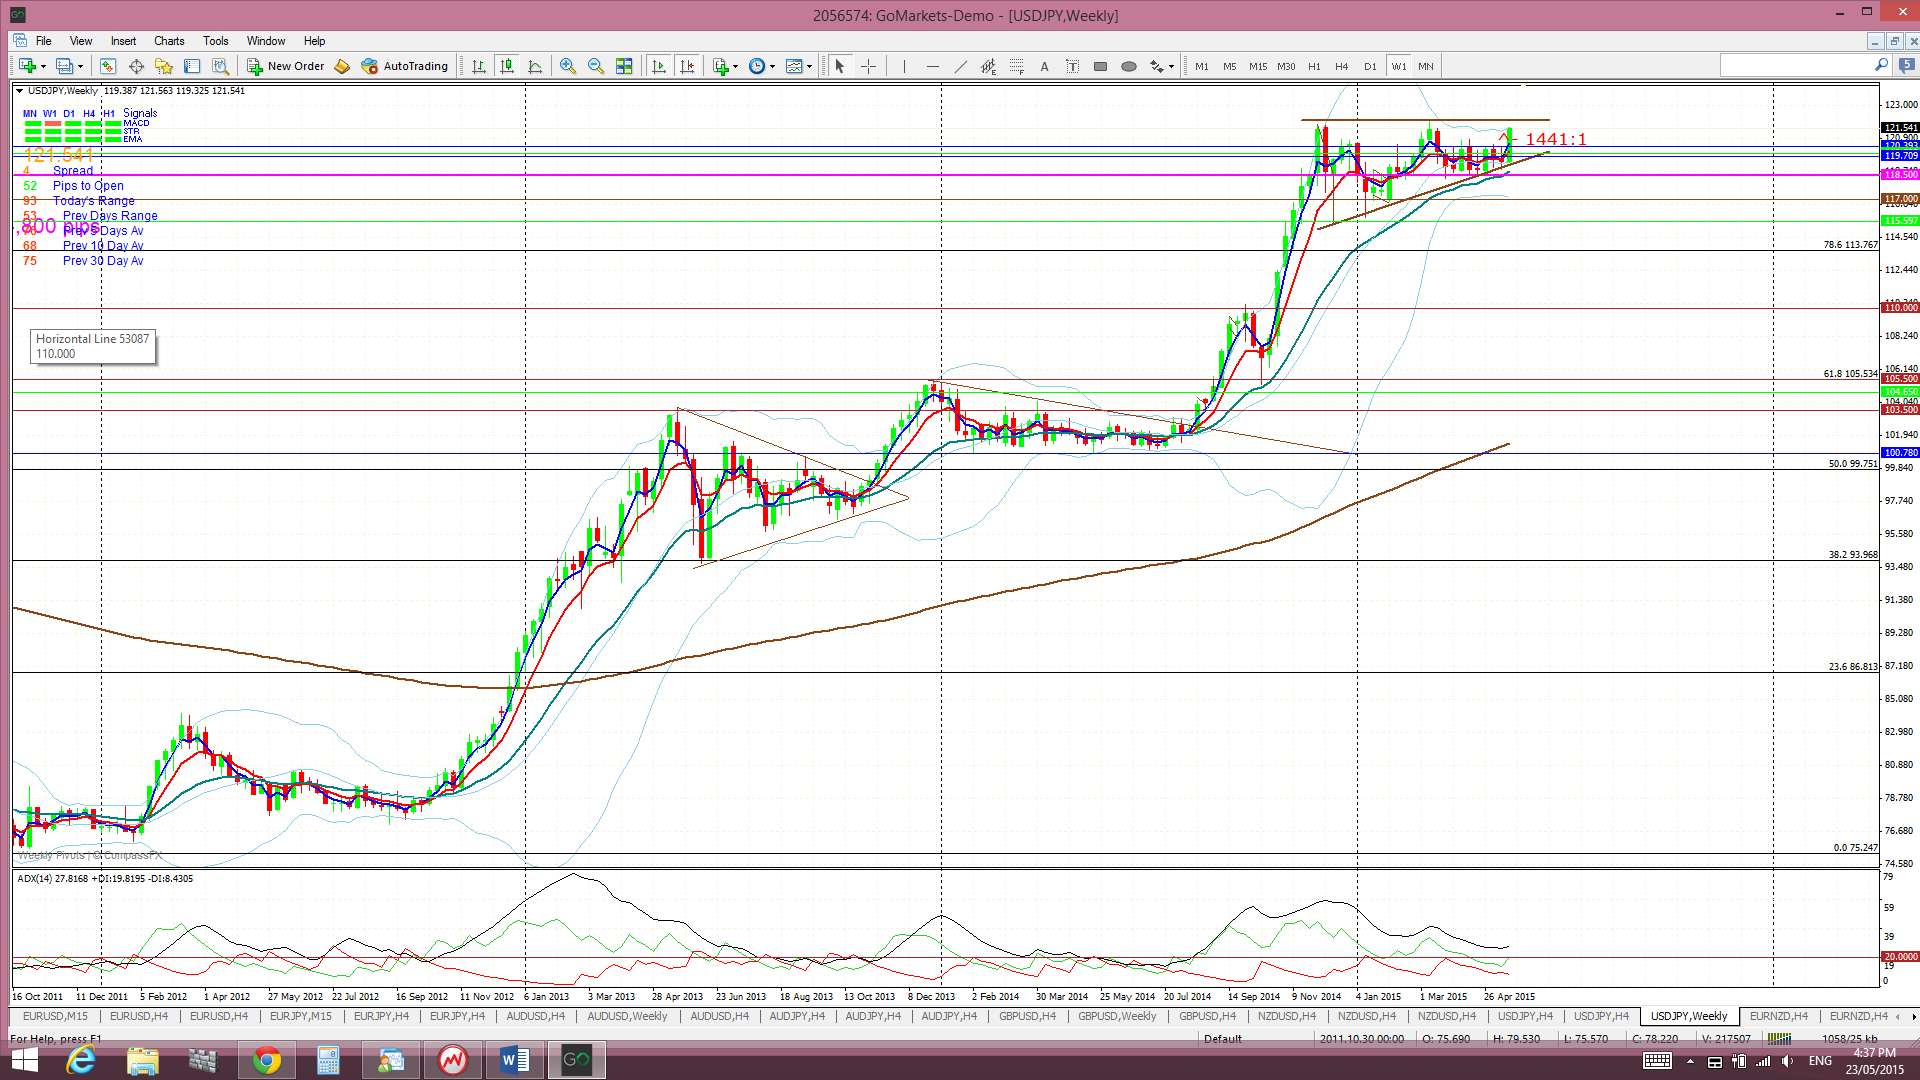
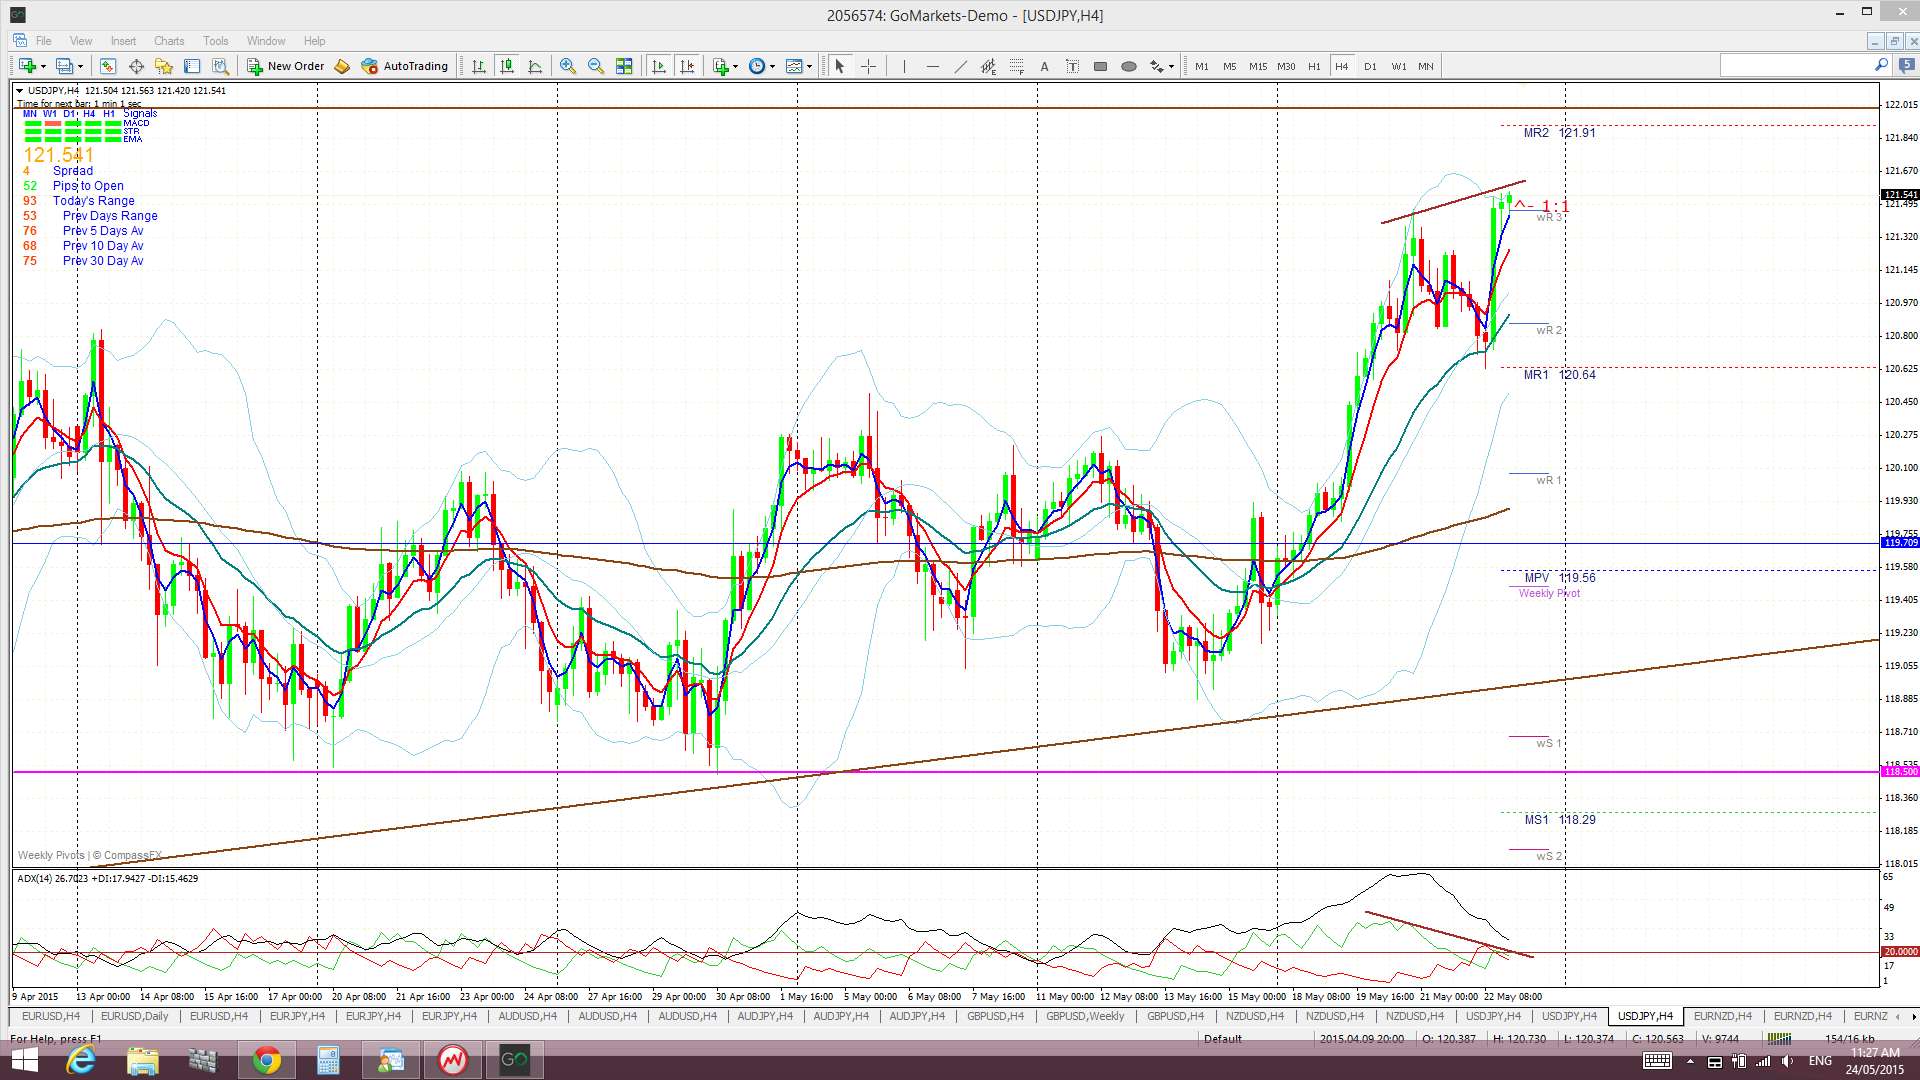
The Yen: U/J: The U/J seems to be finally waking up after ranging for much of the last 6 months. This pair rallied last week and moved up to within 50 pips of the 220 level; this level forms the top of the daily chart’s bullish ascending triangle which, in turn, forms the ‘Handle’ of a potential Cup ‘n’ Handle on the monthly chart. Caution might be needed at this upper region though now as some divergence between price and buying momentum is clearly evident on the 4hr chart.
Price is now trading above the Cloud on the 4hr, daily, weekly and monthly charts which is bullish. November 2013 was the first monthly candle close above the Ichimoku Cloud since mid-2007 and the bullish hold above the monthly Cloud continues to be noteworthy.
The weekly candle closed as a bullish ‘engulfing’ candle.
Monthly Chart Bullish Cup’ n’ Handle pattern: There looks to be a new bullish Cup ‘n’ Handle forming up on the monthly chart. The theory behind these patterns is that the height of the ‘Cup’ pattern is equivalent to the expected bullish move from the ‘handle’ breakout. The height of the Cup for the U/J weekly chart is around 4,800 pips.
- I’m watching for any new TC signal on this pair, the ‘Handle’ trend lines and the 220 level.
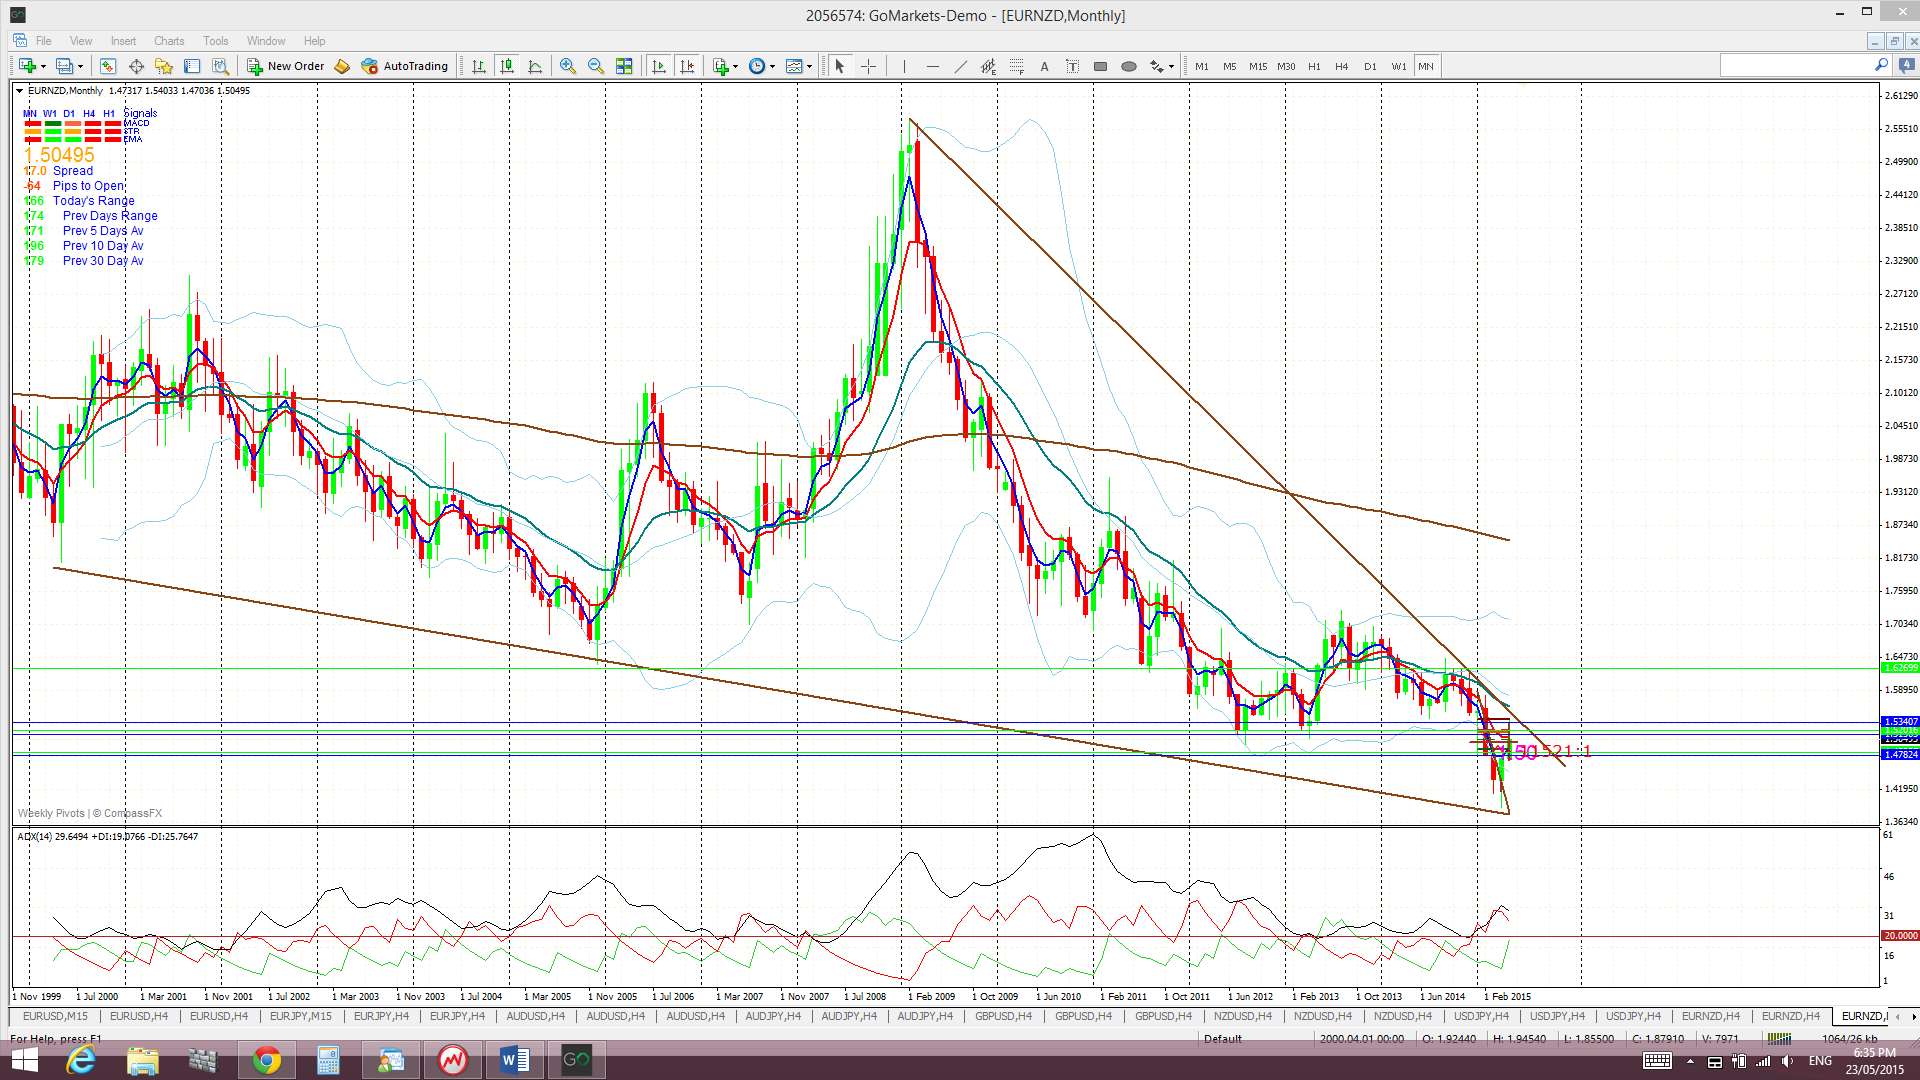
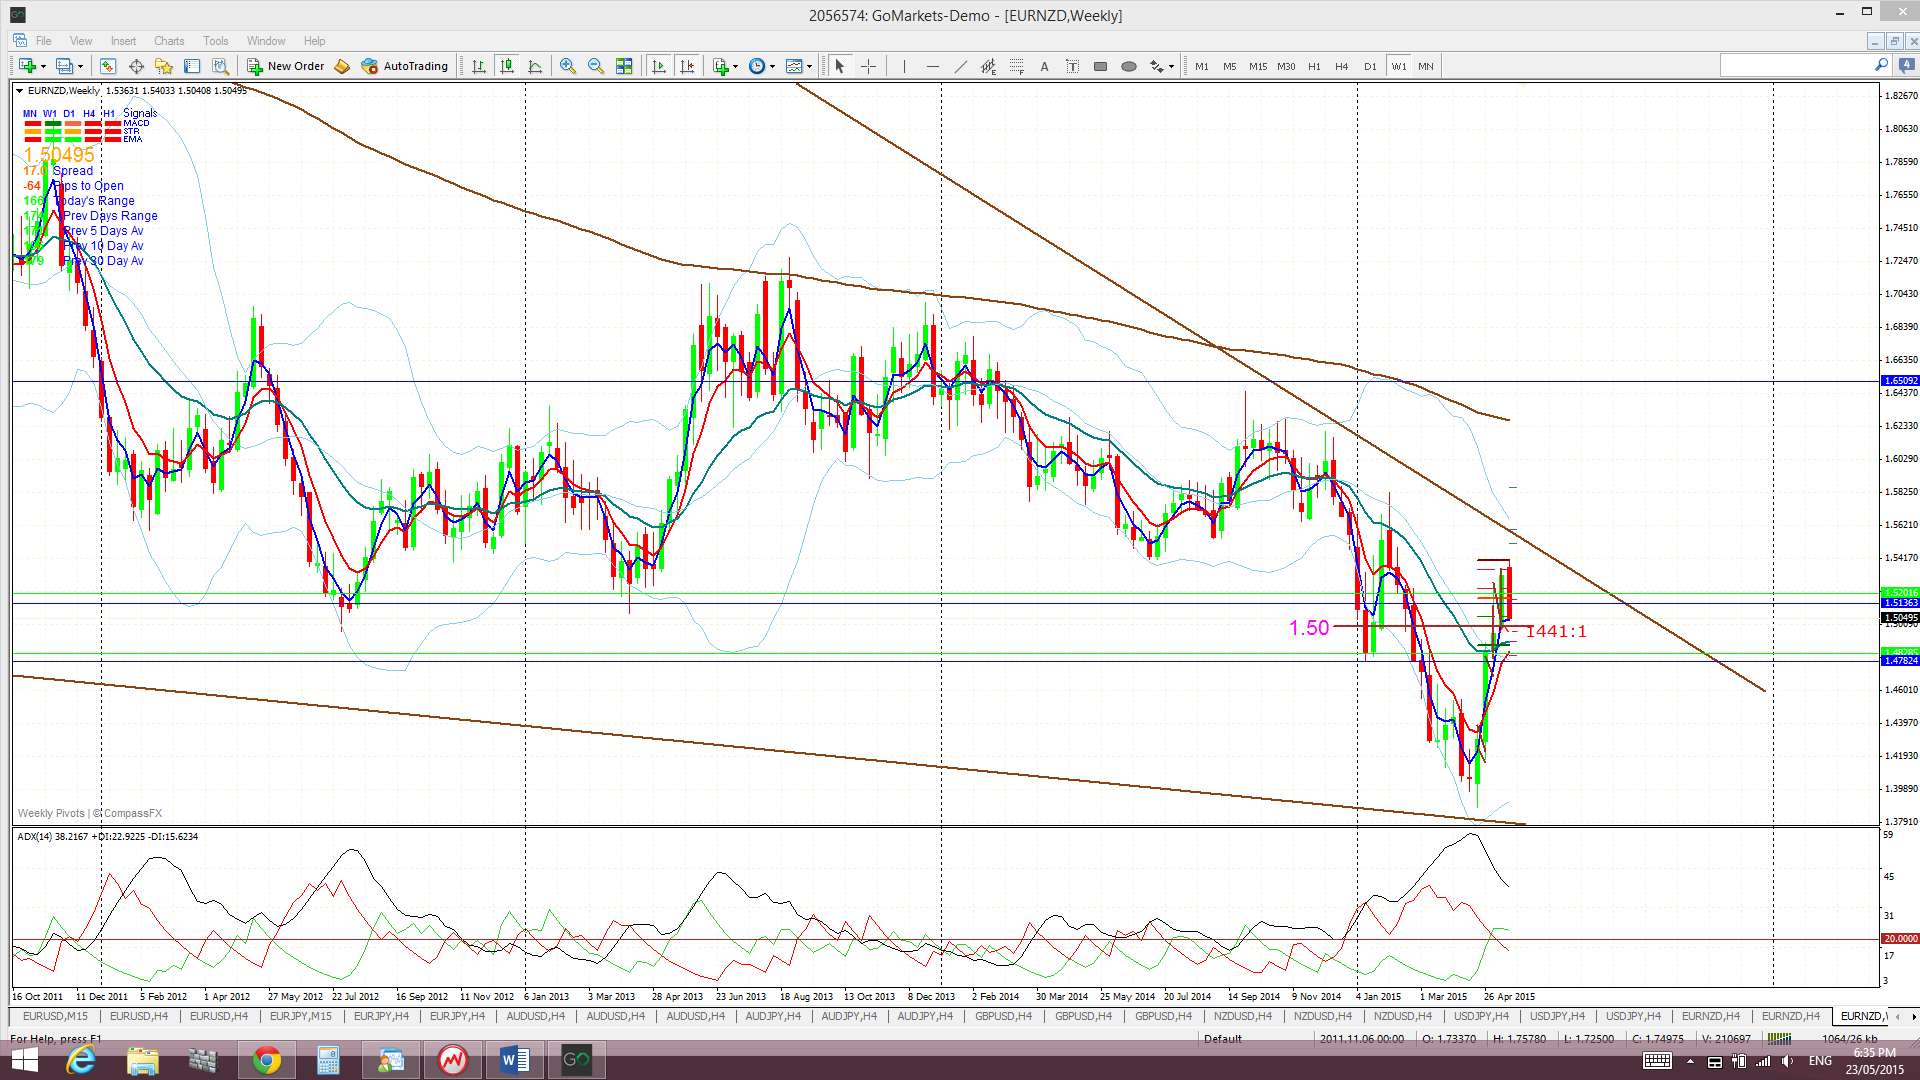
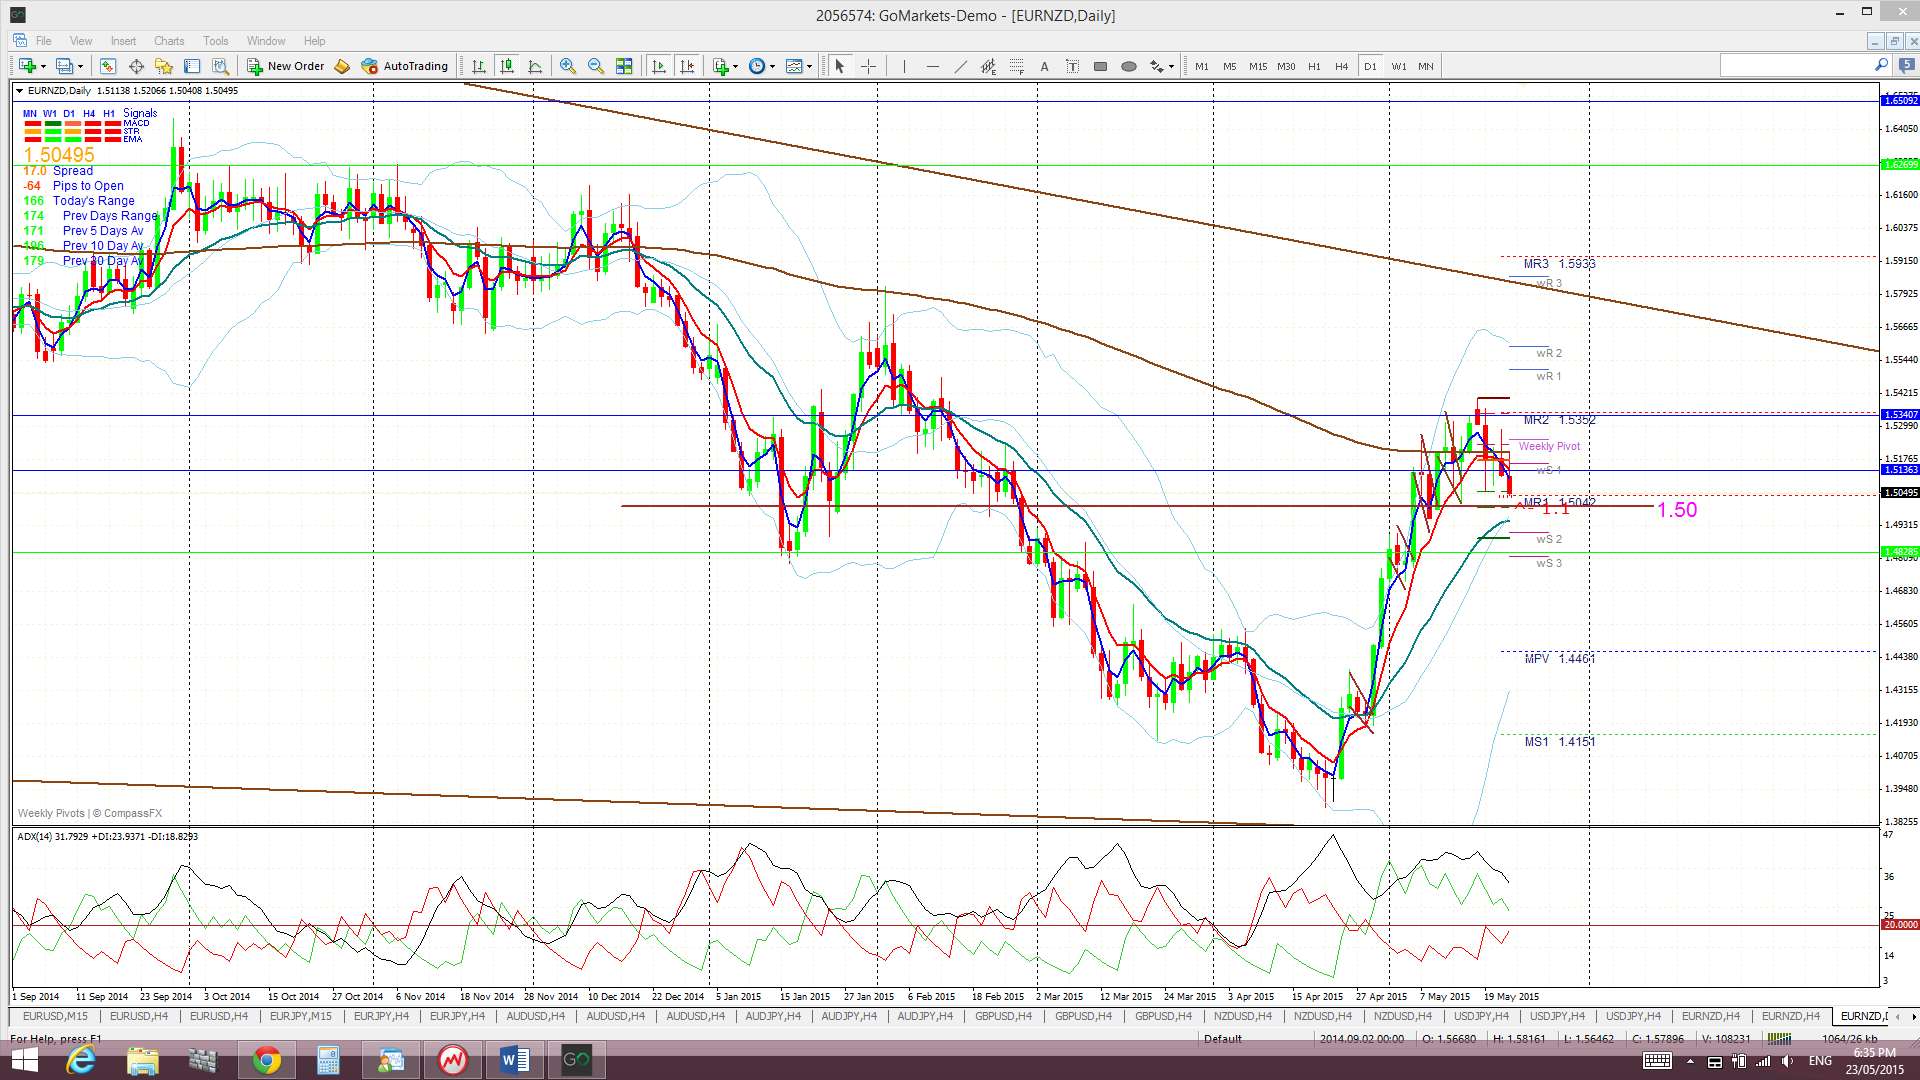
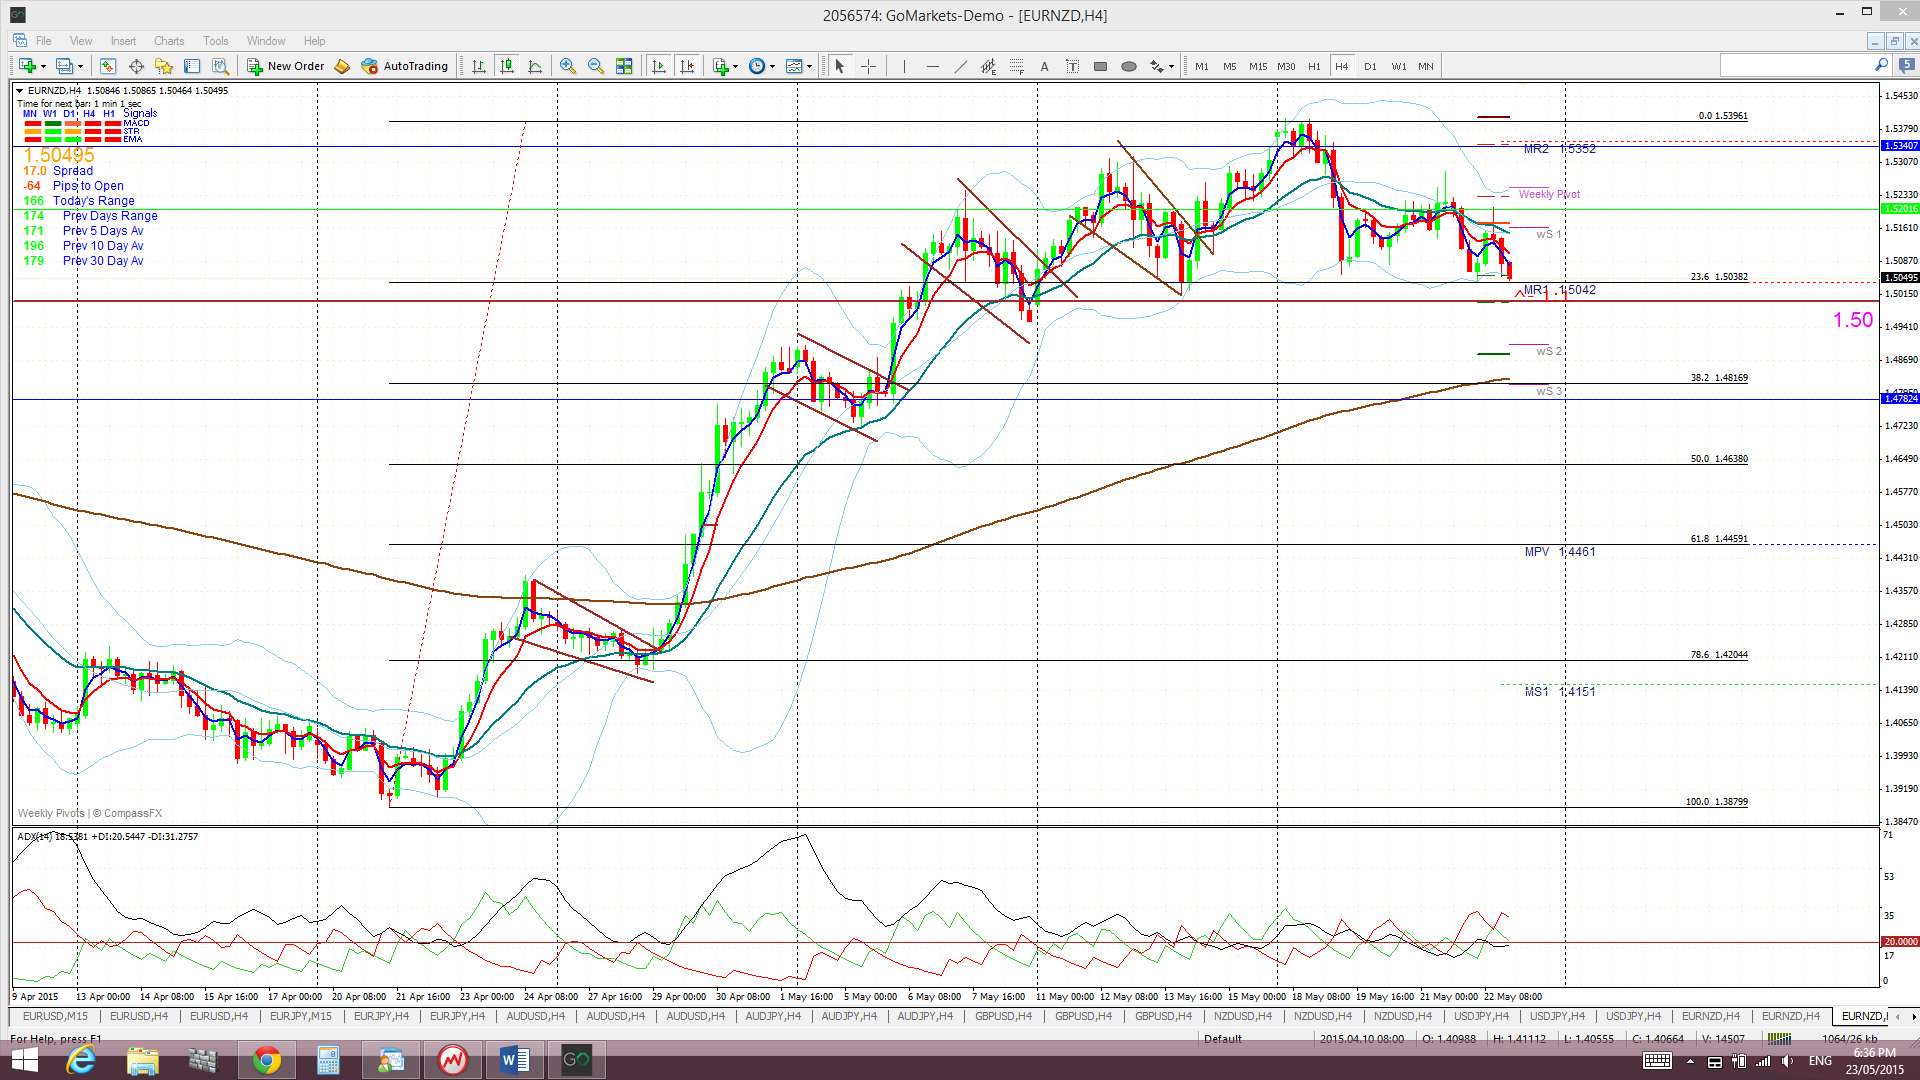
EUR/NZD: Price pulled back to chop along above the 1.50 support level last week and this level remains the focal point for me in the coming week. Traders need to keep in mind though that this pair remains trading within a monthly-chart bullish descending wedge.
Price is now trading below the Cloud on the 4hr chart, above the Cloud on the daily chart but below the Cloud on the weekly and monthly charts.
The weekly candle closed as a large bearish candle.
- I’m watching for any new TC signal and the 1.50 level.
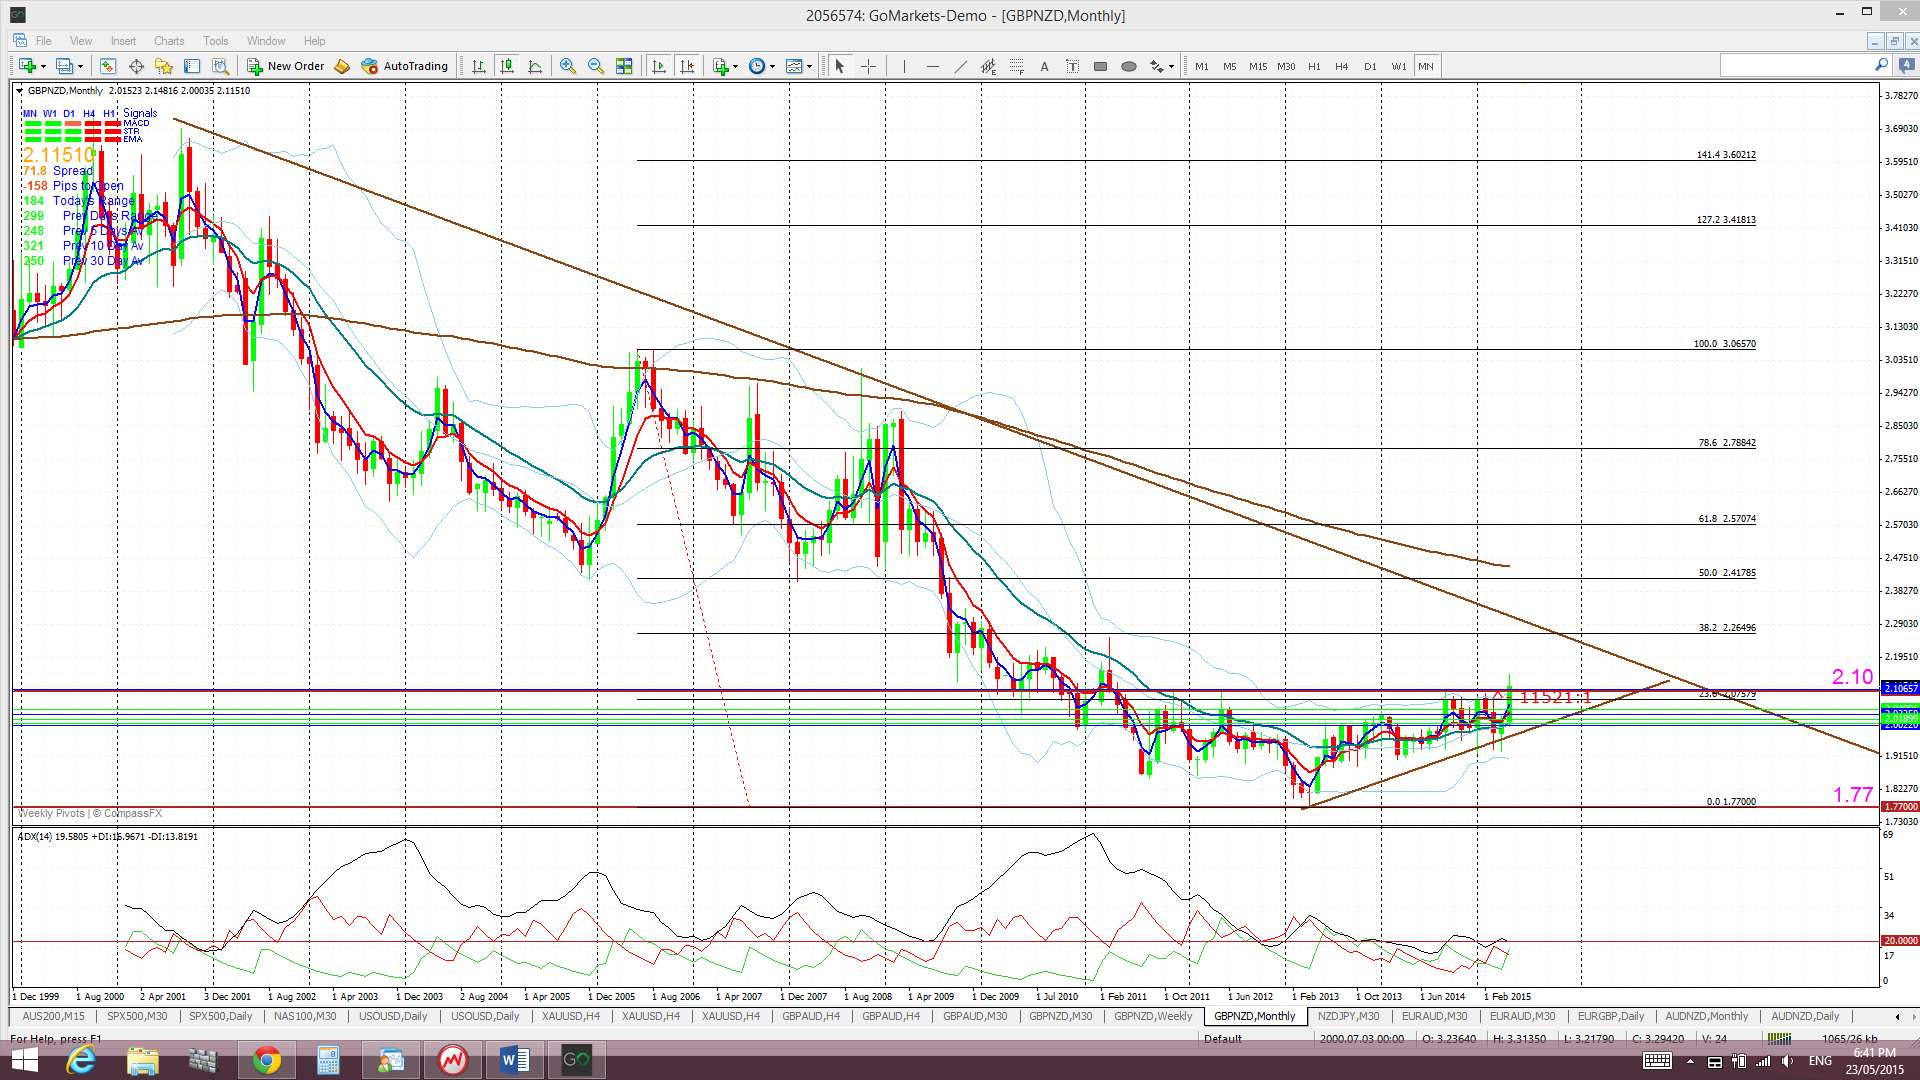
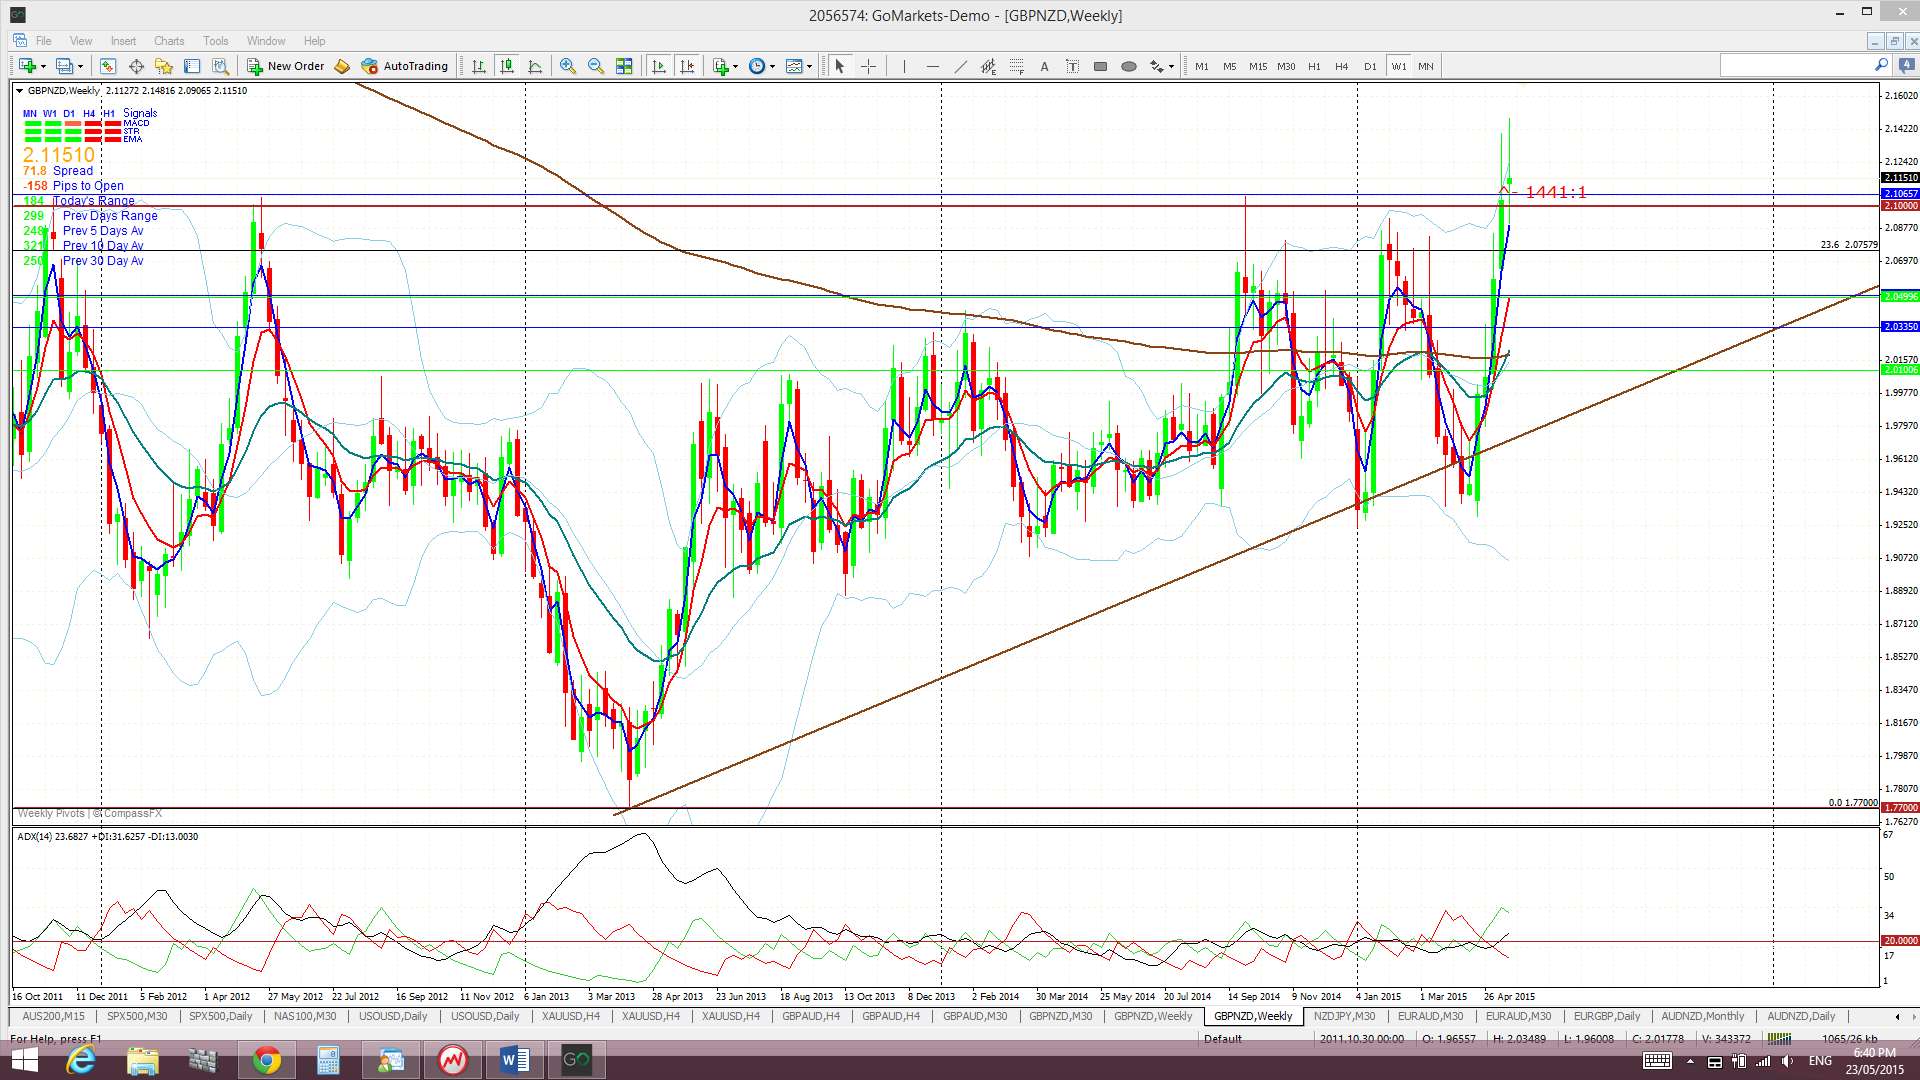
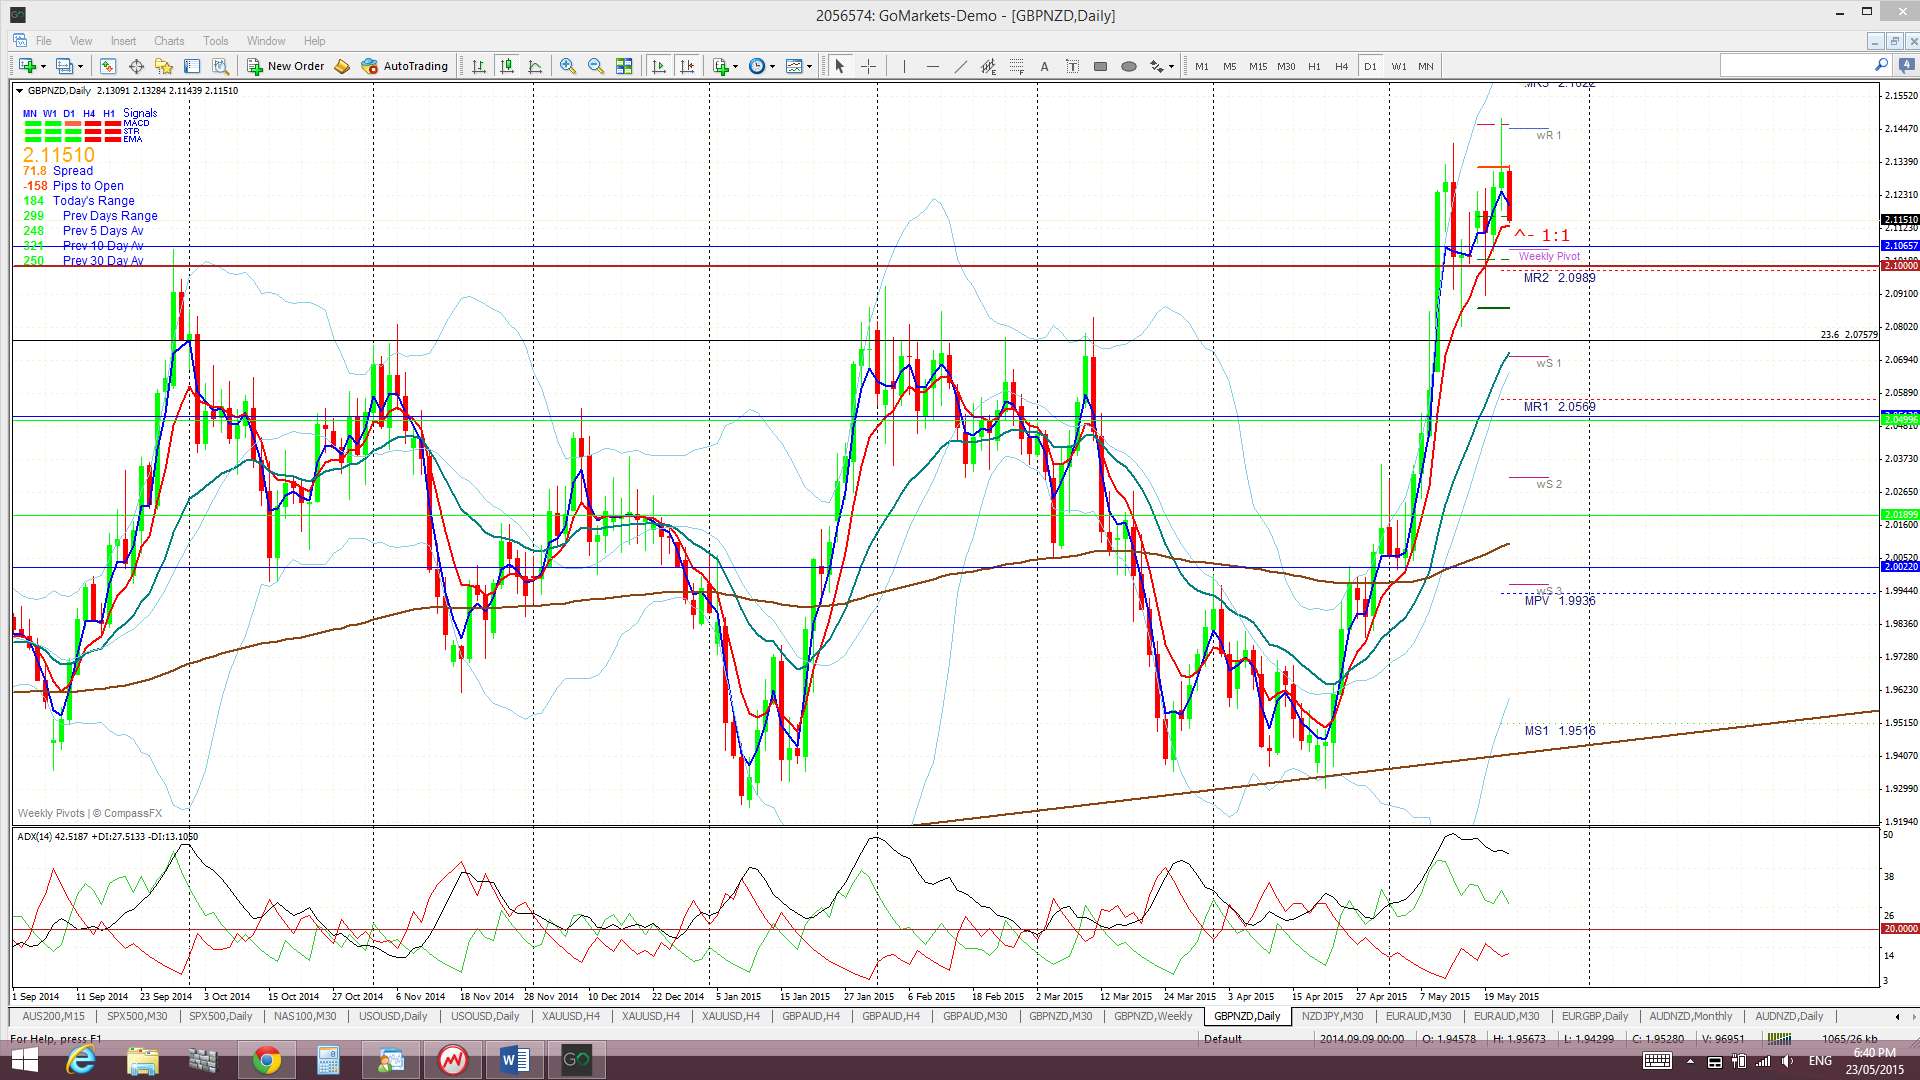
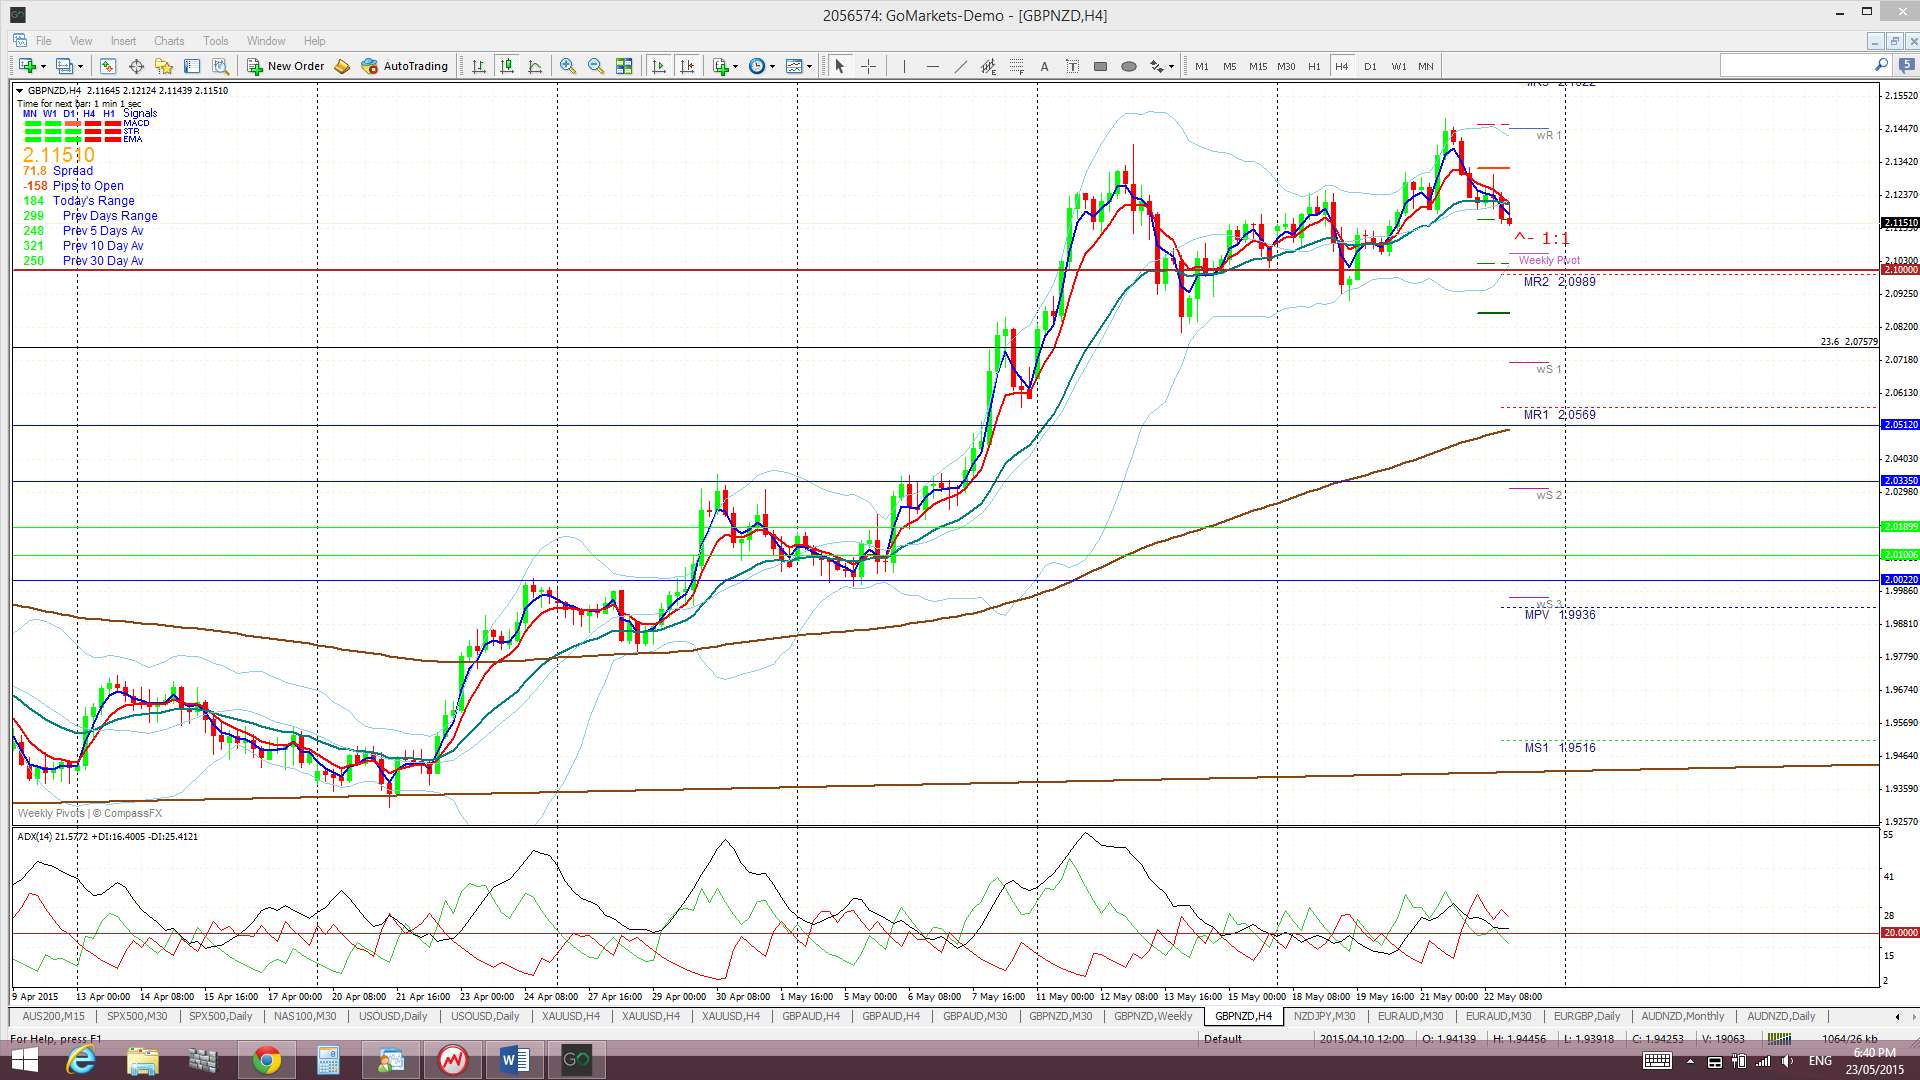
GBP/NZD: This will be an important week for this pair. A monthly close above the 2.10 level would be bullish but a failure at this resistance would suggest the potential for reversal. This pair has rallied hard of late though and has now made a second weekly close above this key 2.10 level. The 2.10 level forms the top of an ascending triangle on the monthly chart and so any monthly close above this level will be significant.
The GBP/NZD is trading above the Cloud on the 4hr, daily and weekly chart but is in the middle of the Cloud on the monthly chart.
The weekly candle closed as bullish coloured ‘Spinning Top’ reflecting some indecision at this key level.
- I’m watching for any new TC signal and the 2.10 level.
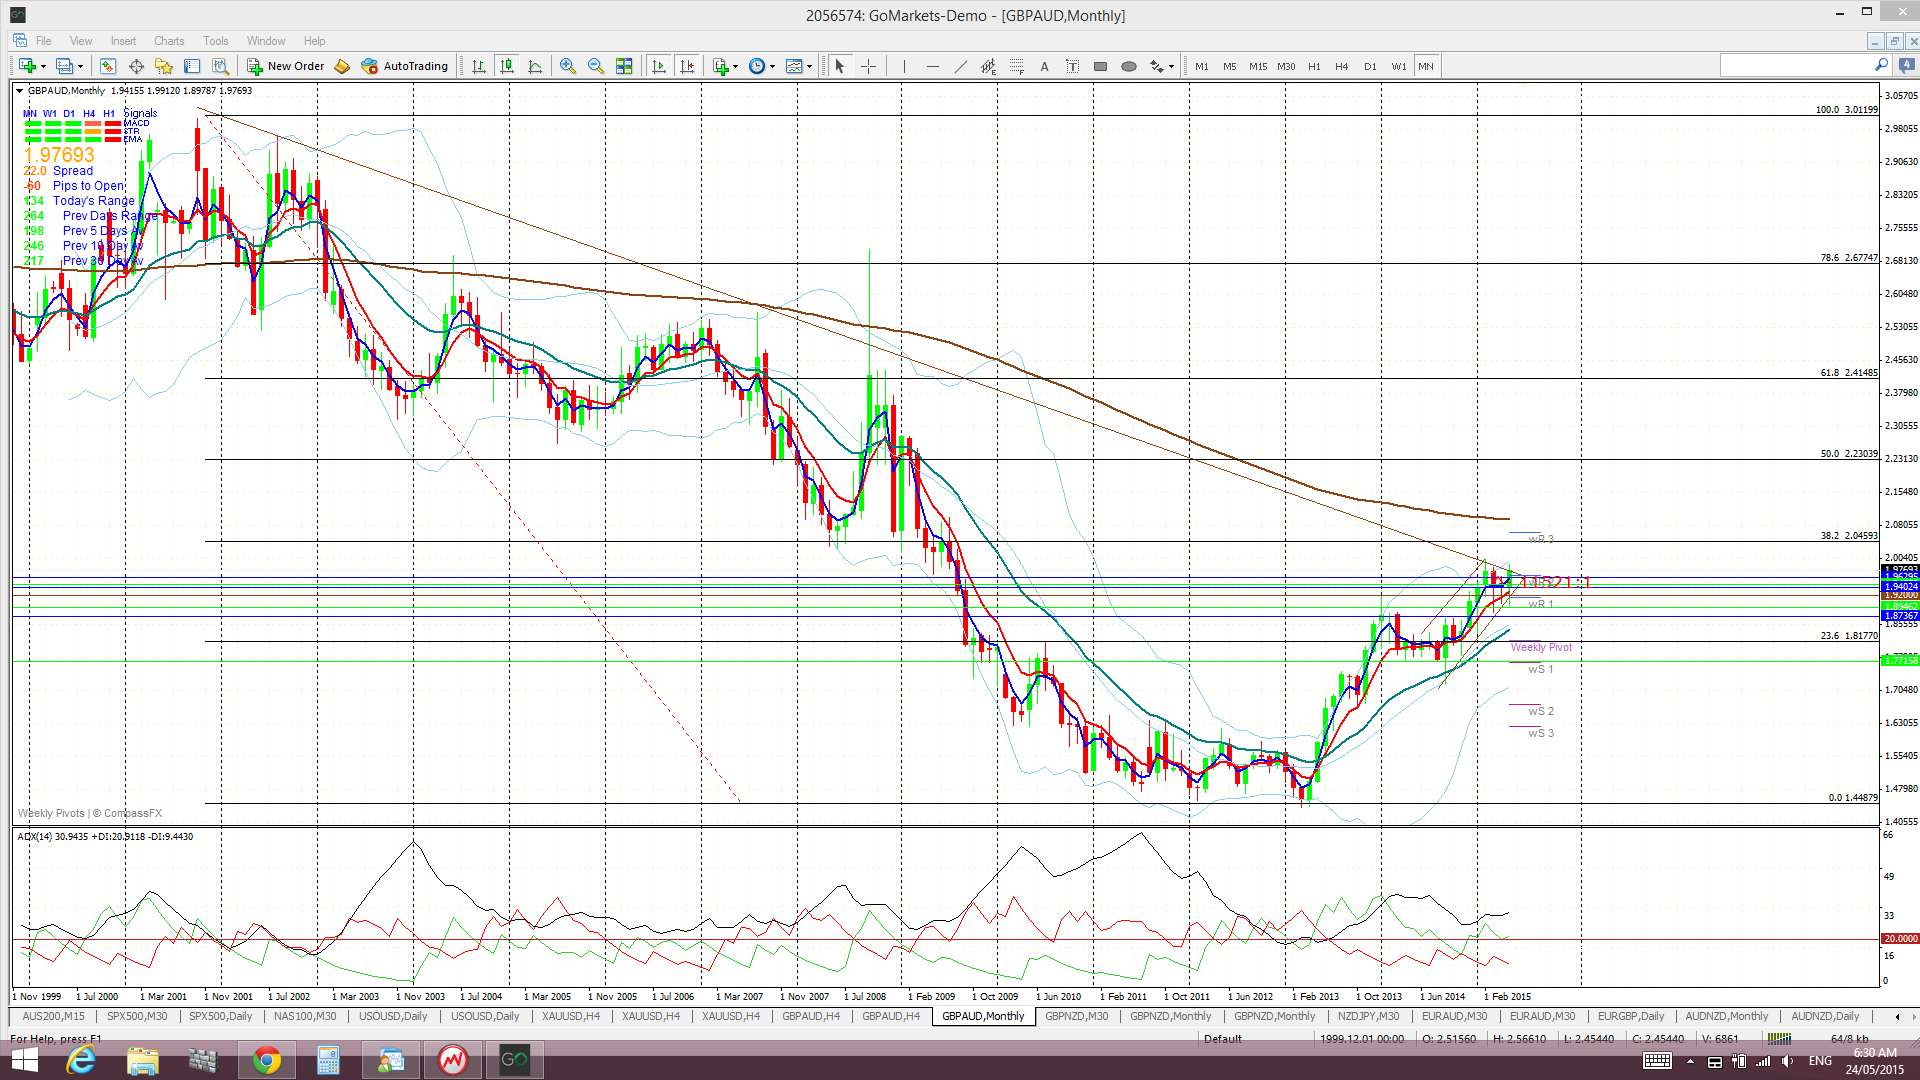
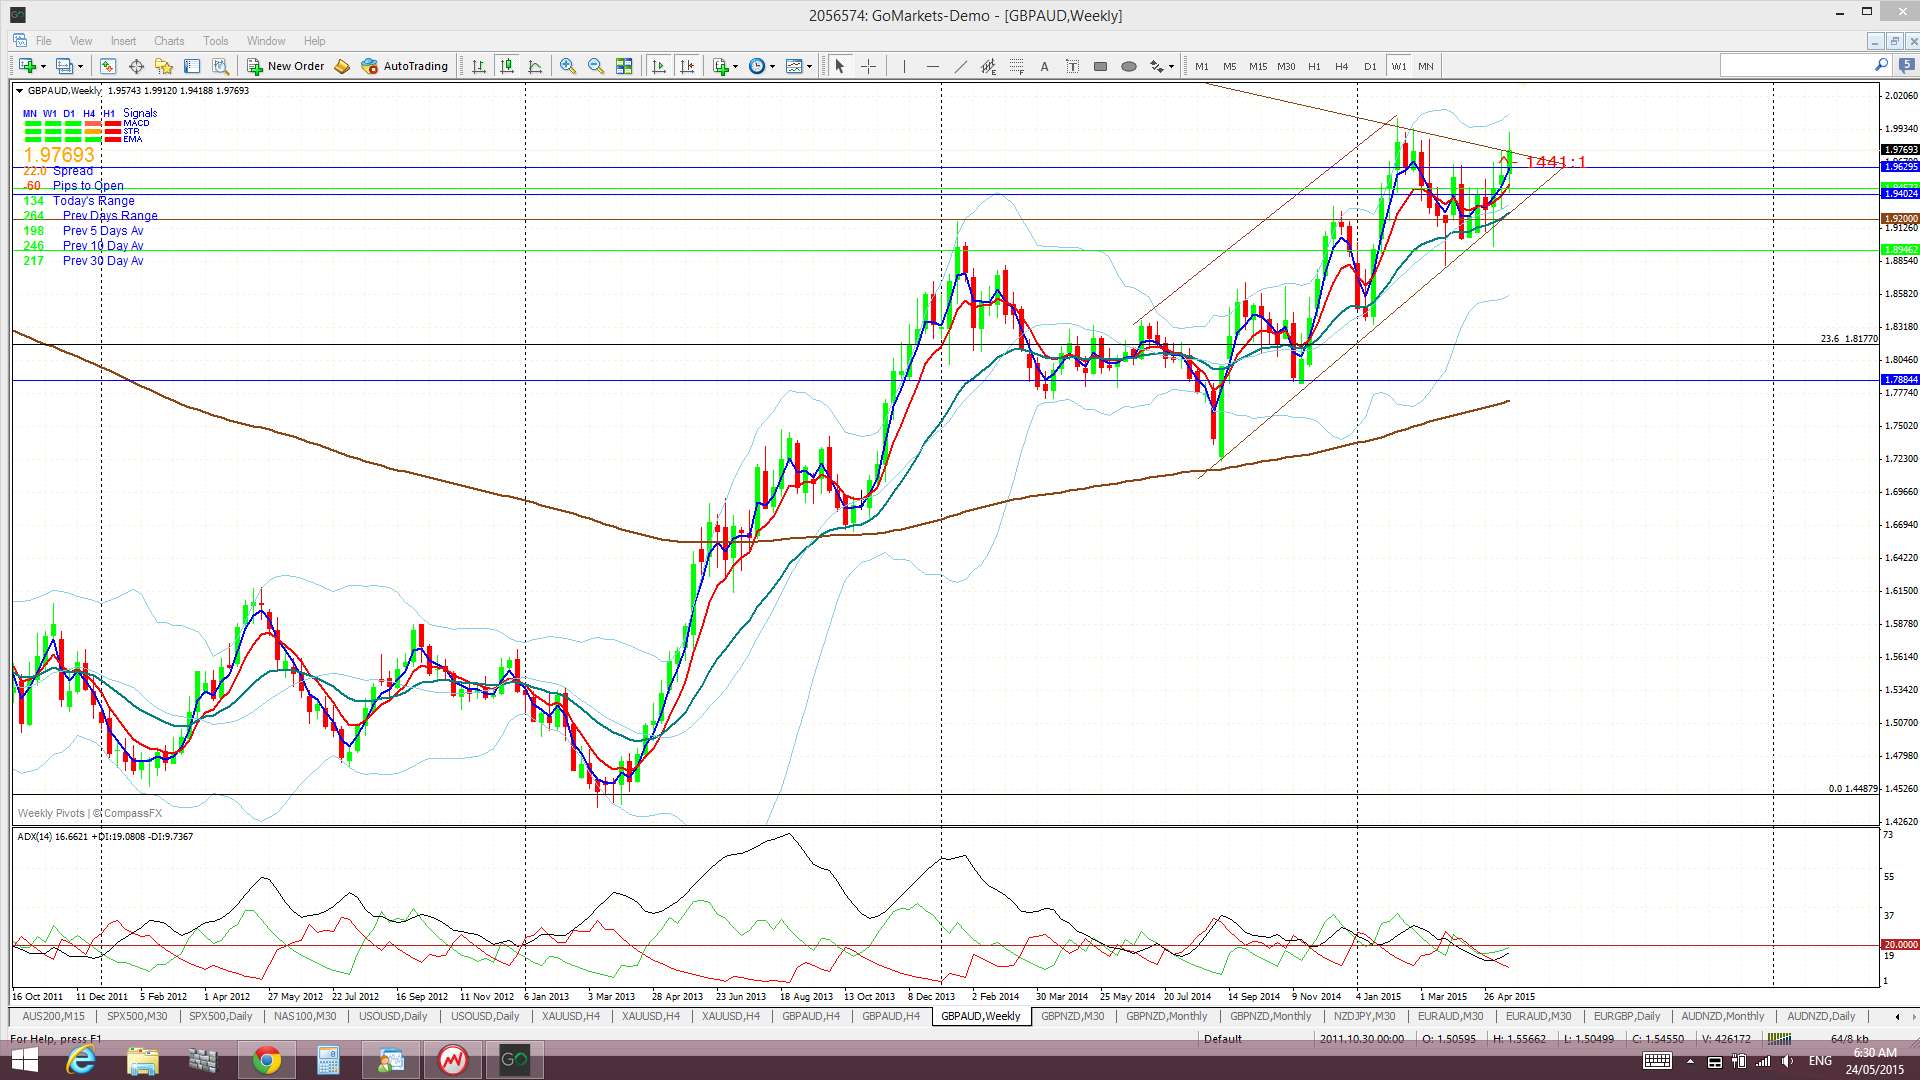
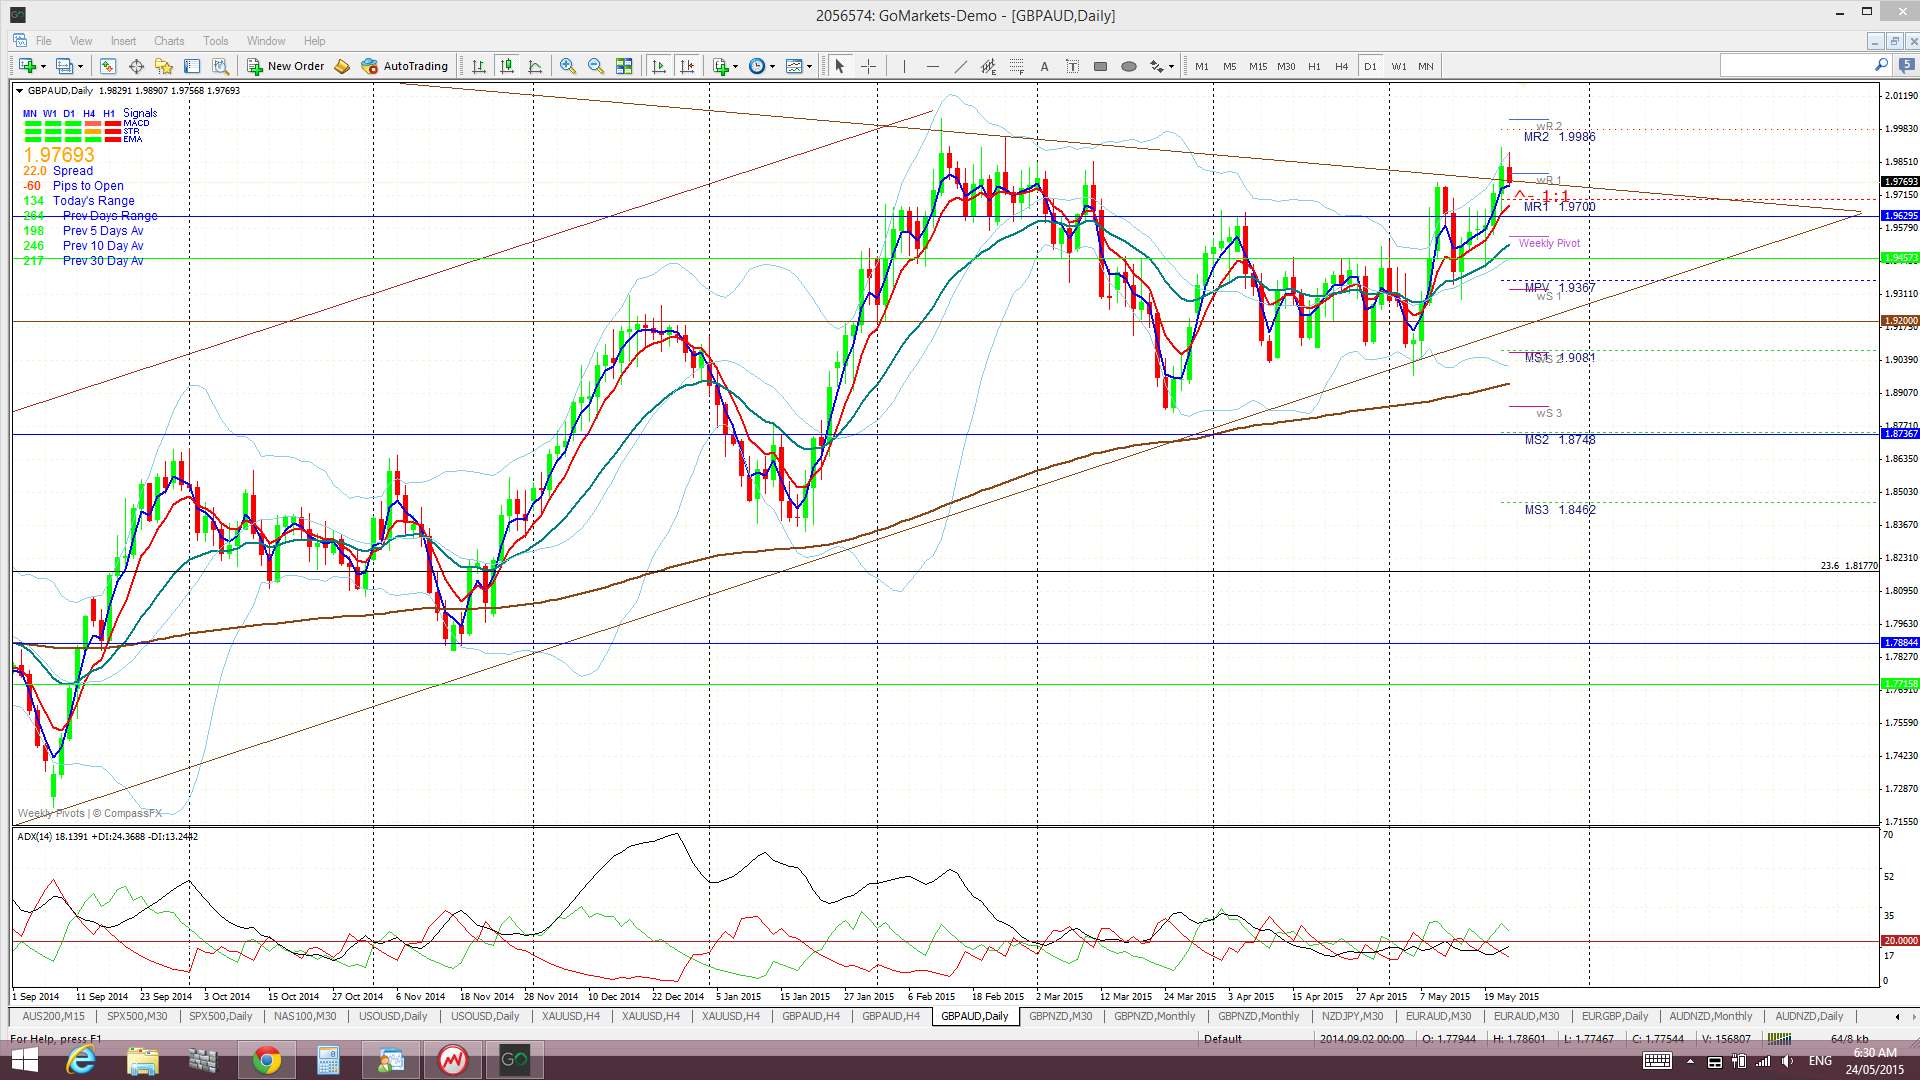
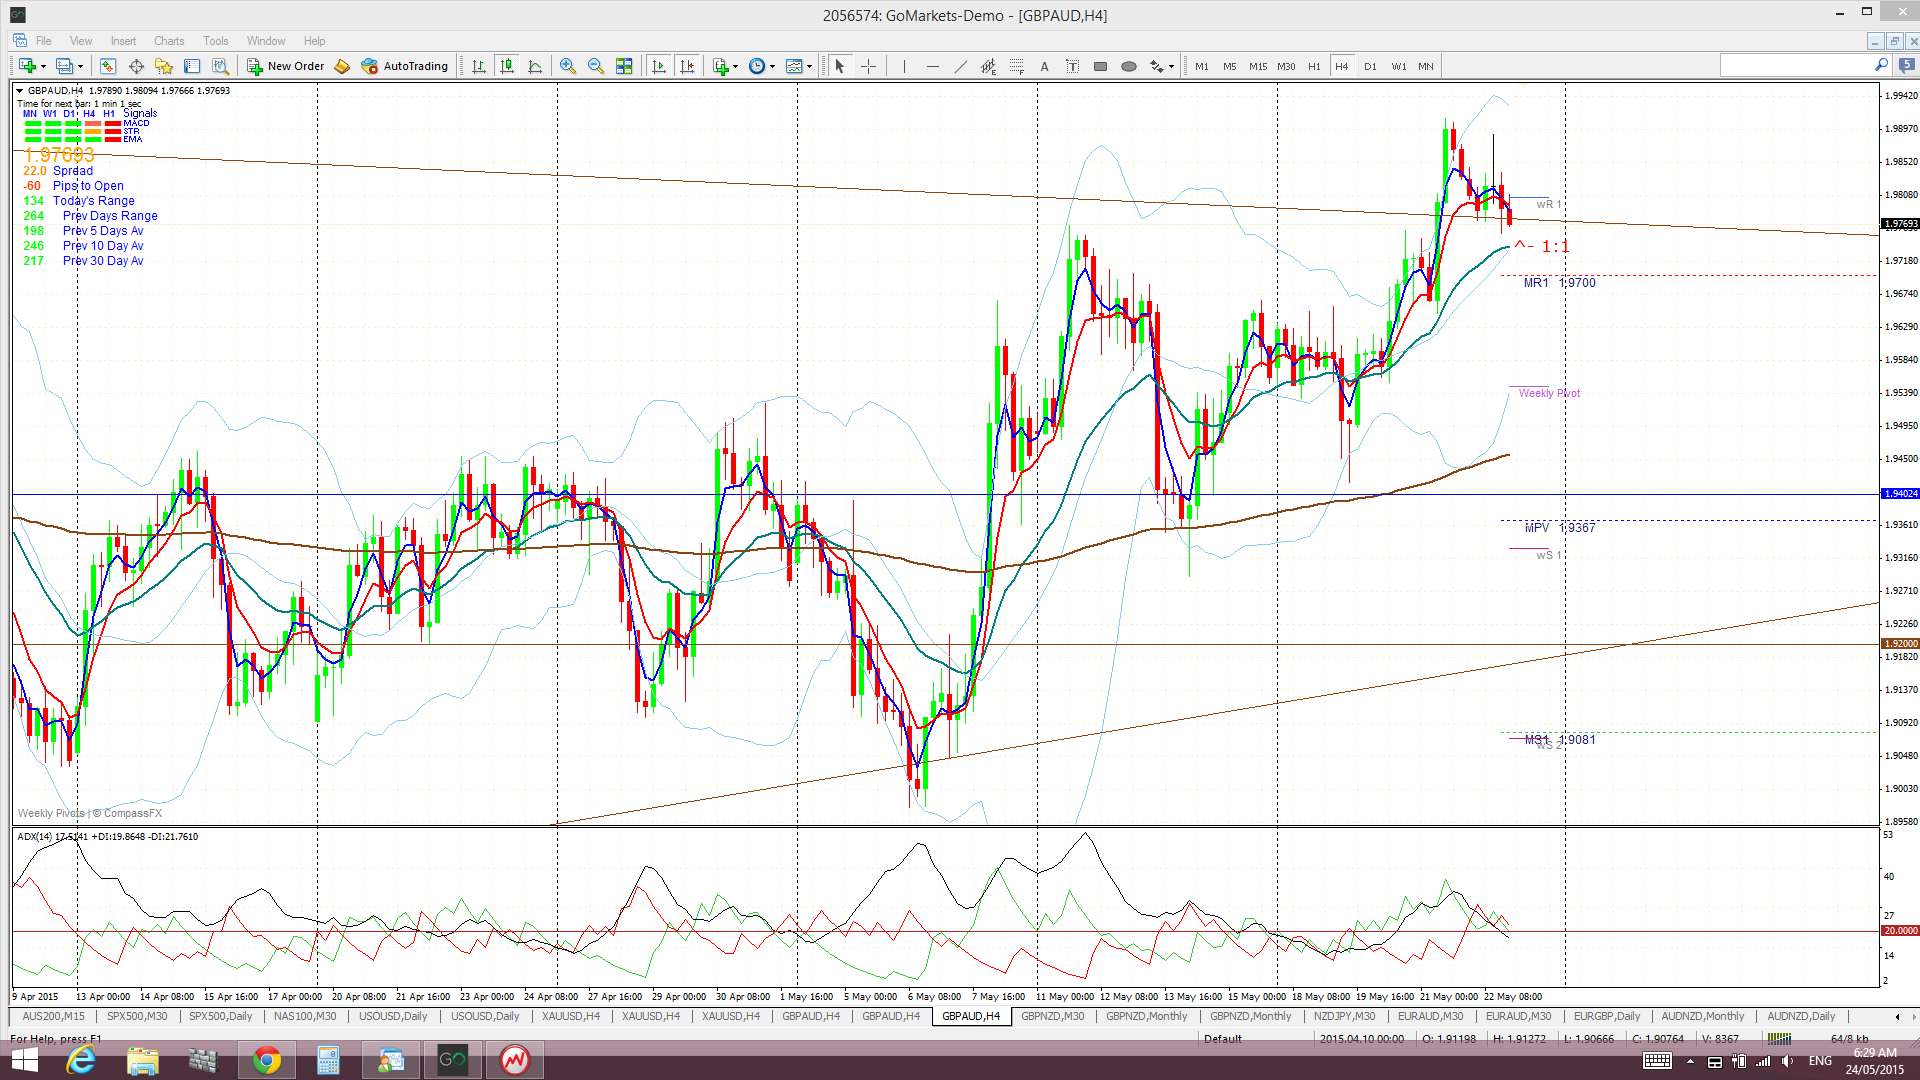
GBP/AUD: This pair is at an important cross-road as well now given that it has rallied up to test the monthly chart’s triangle trend line. A monthly break and hold above this trend line would mark a significant bullish shift and so next week’s monthly candle close will be an important one to watch.
Price is still trading above the Ichimoku Cloud on the 4hr, daily, weekly and monthly charts.
The weekly candle closed as a bullish candle.
- I’m watching for any new TC signal and the monthly chart’s bear trend line.
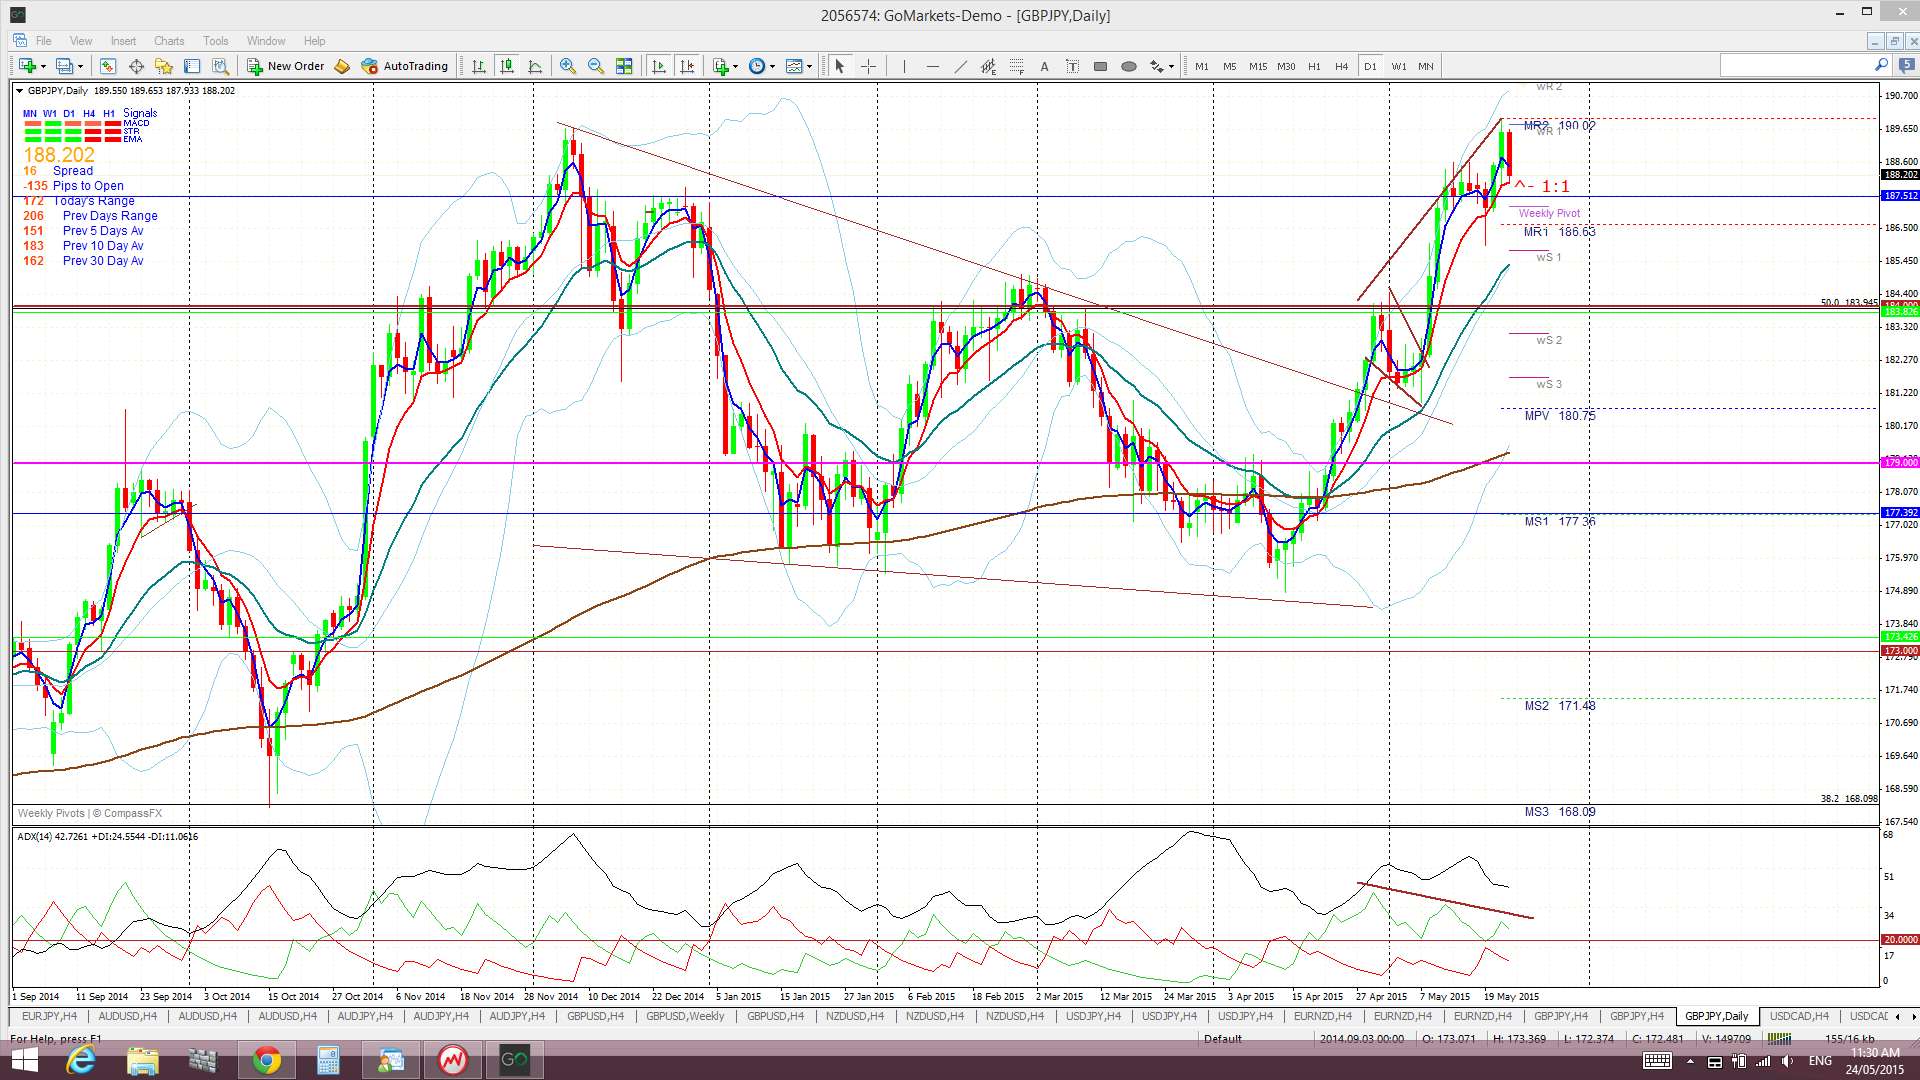
GBP/JPY daily: just a short note here. The ‘Double Top’ concern seems to have played out here. Also, note the divergence between price and buying momentum. A pull back to 184 might offer a great set up though!
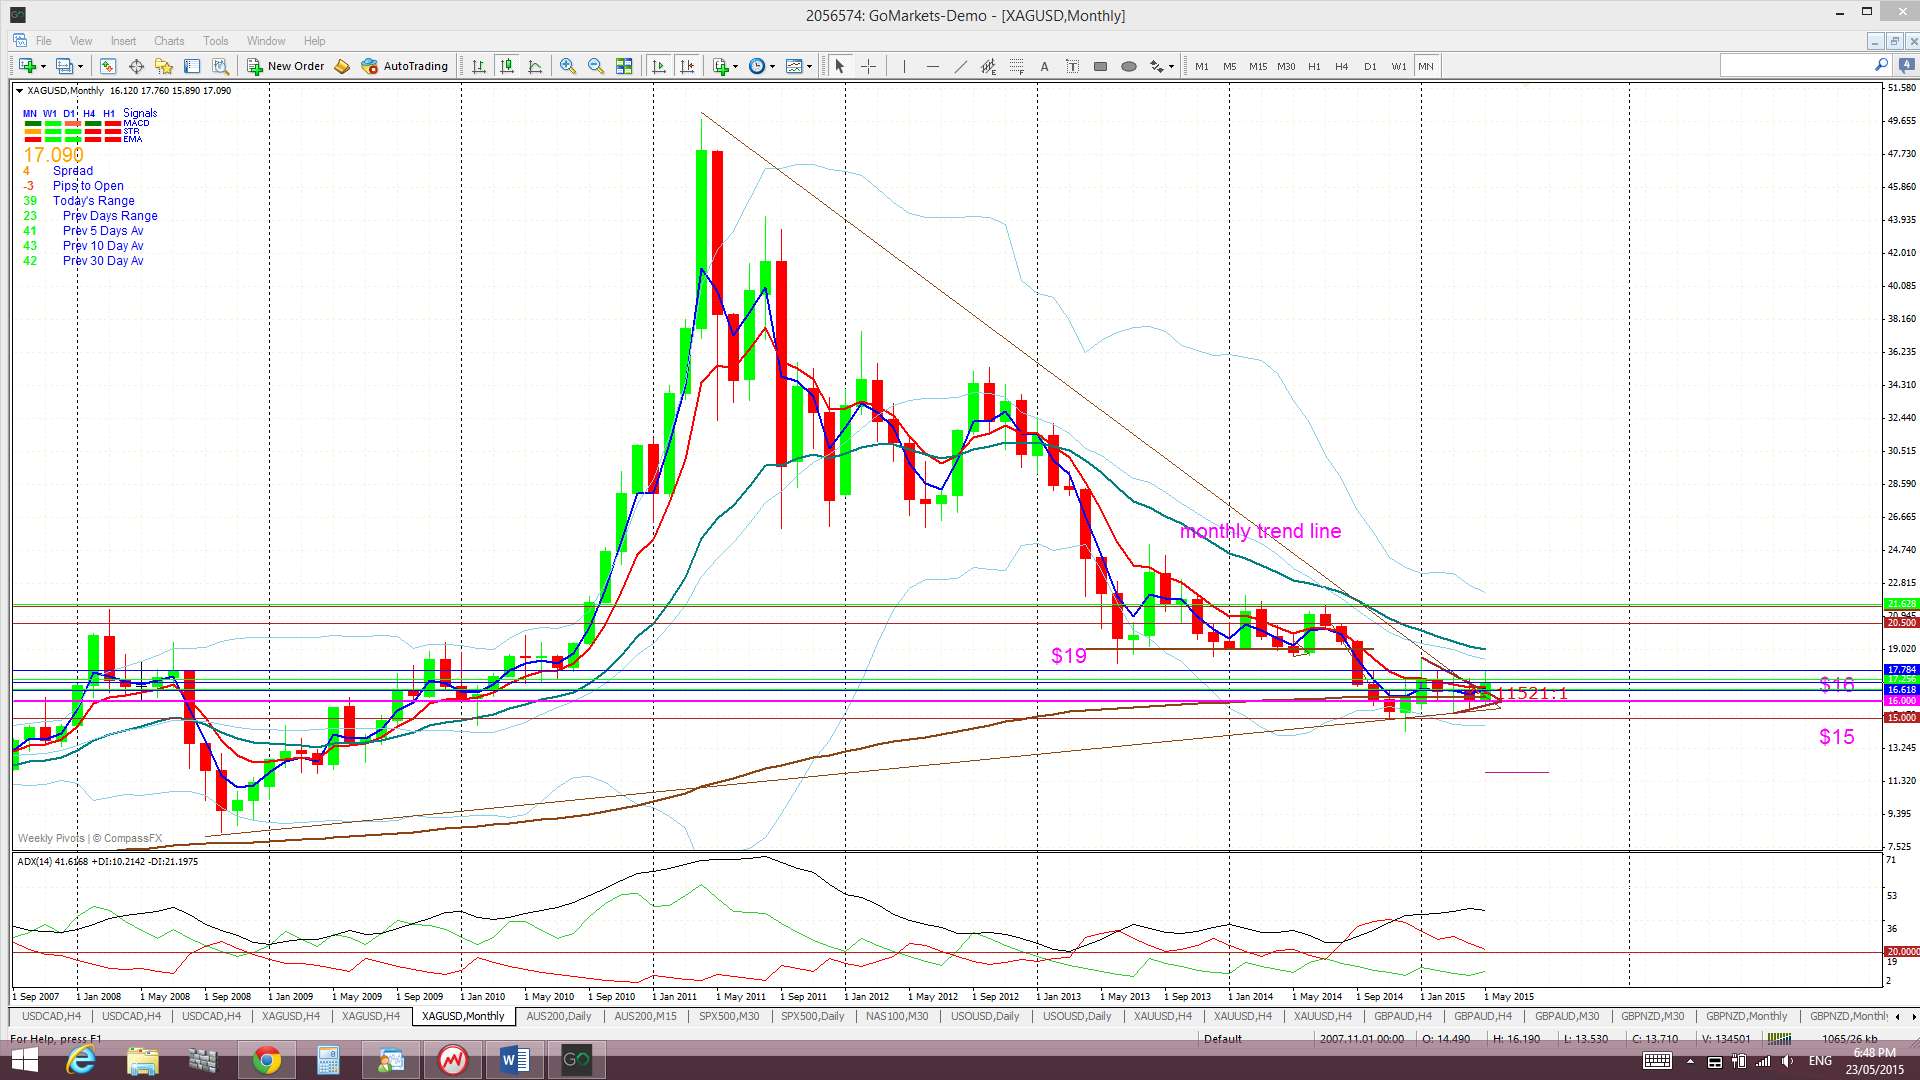
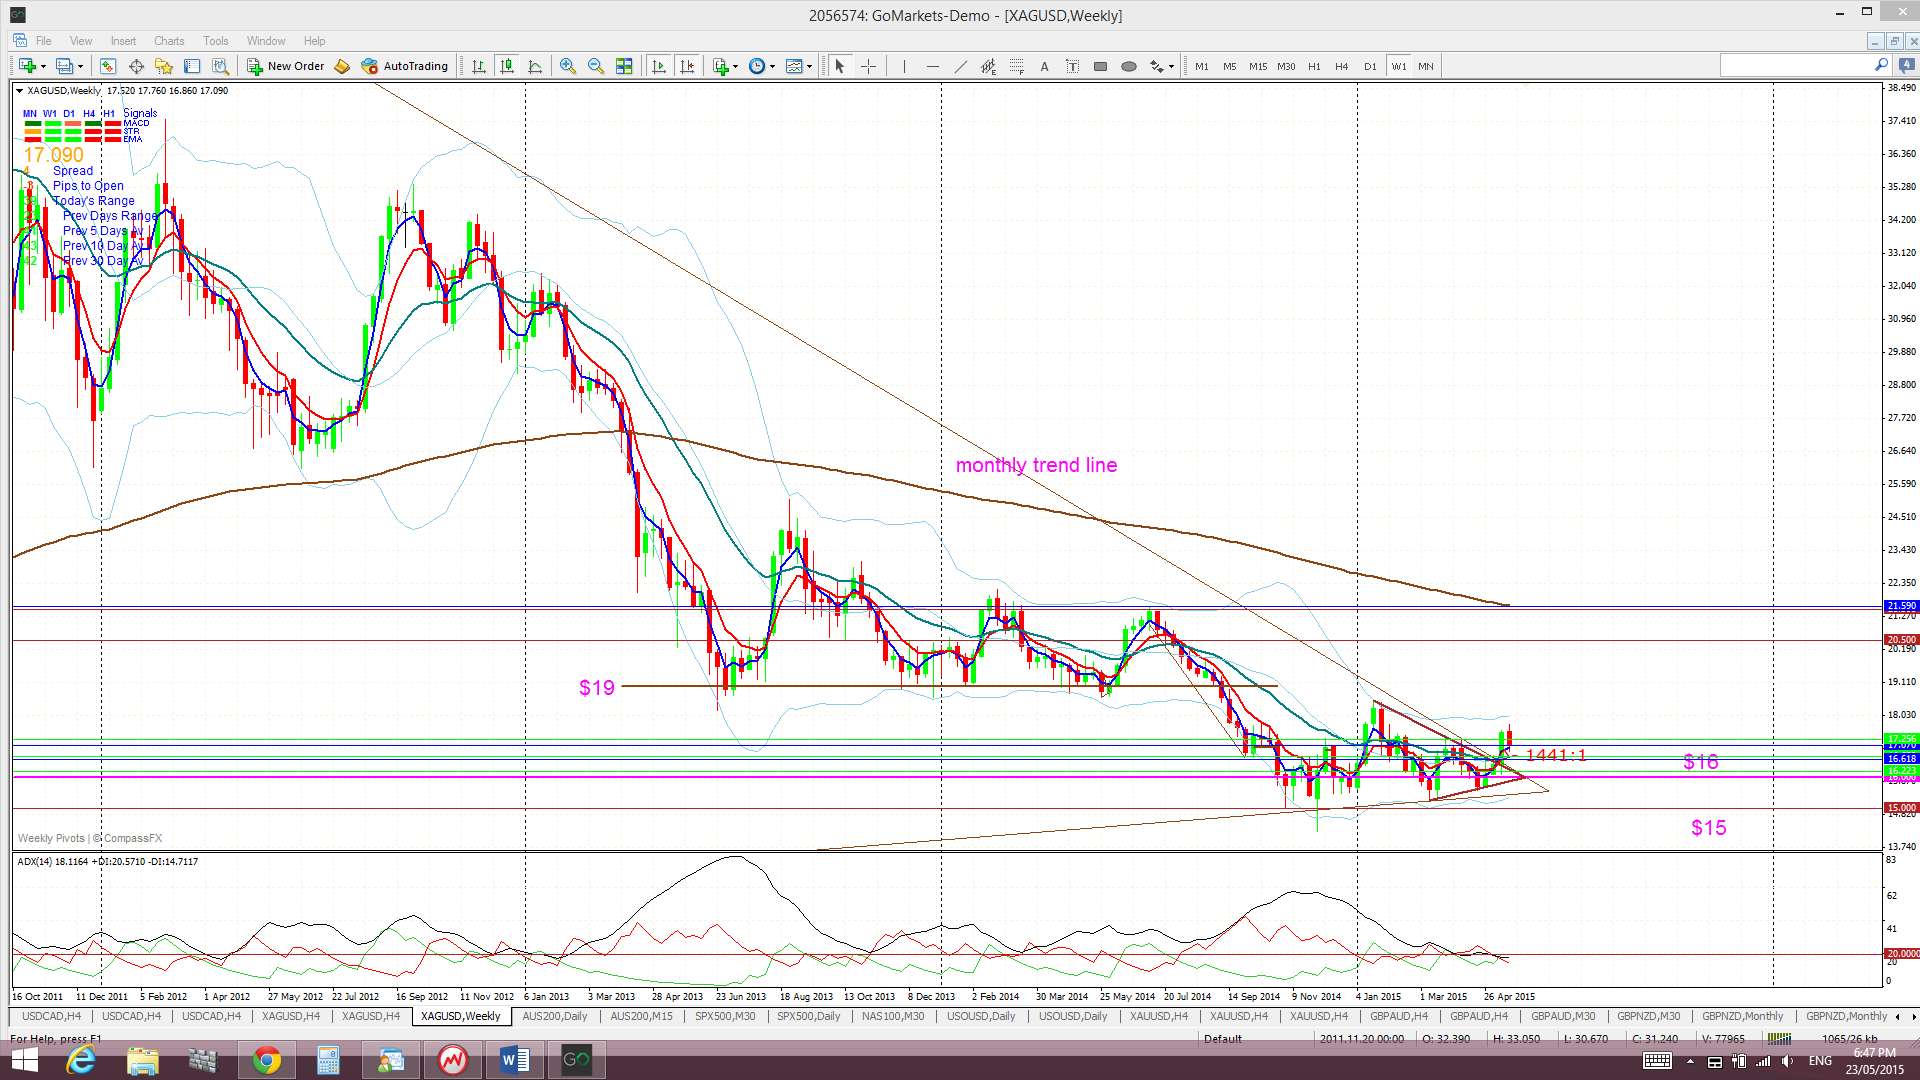
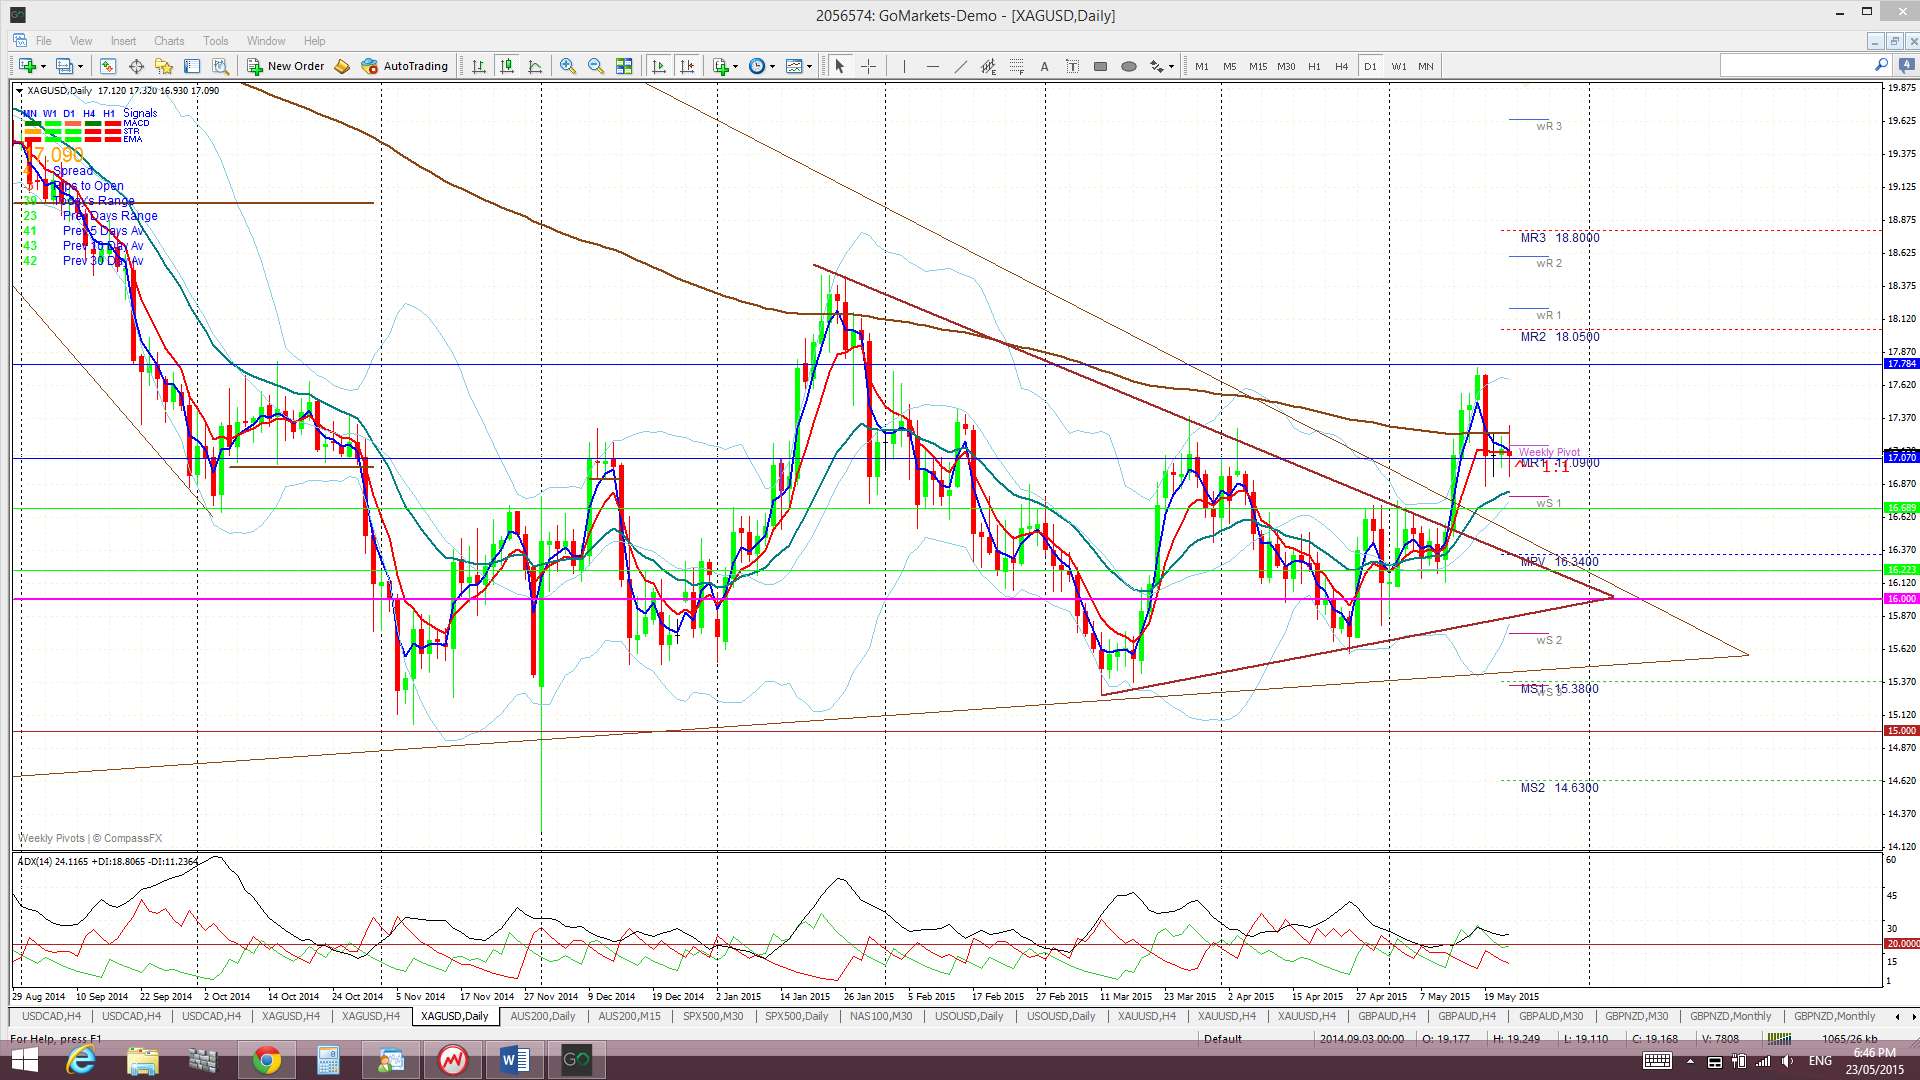
 Silver: This will be an important week for Silver too. The metal has made two weekly closes above a monthly bear trend line but a monthly close above this resistance needs to be seen to confirm any bullish breakout. The Silver rally stalled last week due to US$ strength and tested the 50% fib of the recent bull run which has, so far, held.
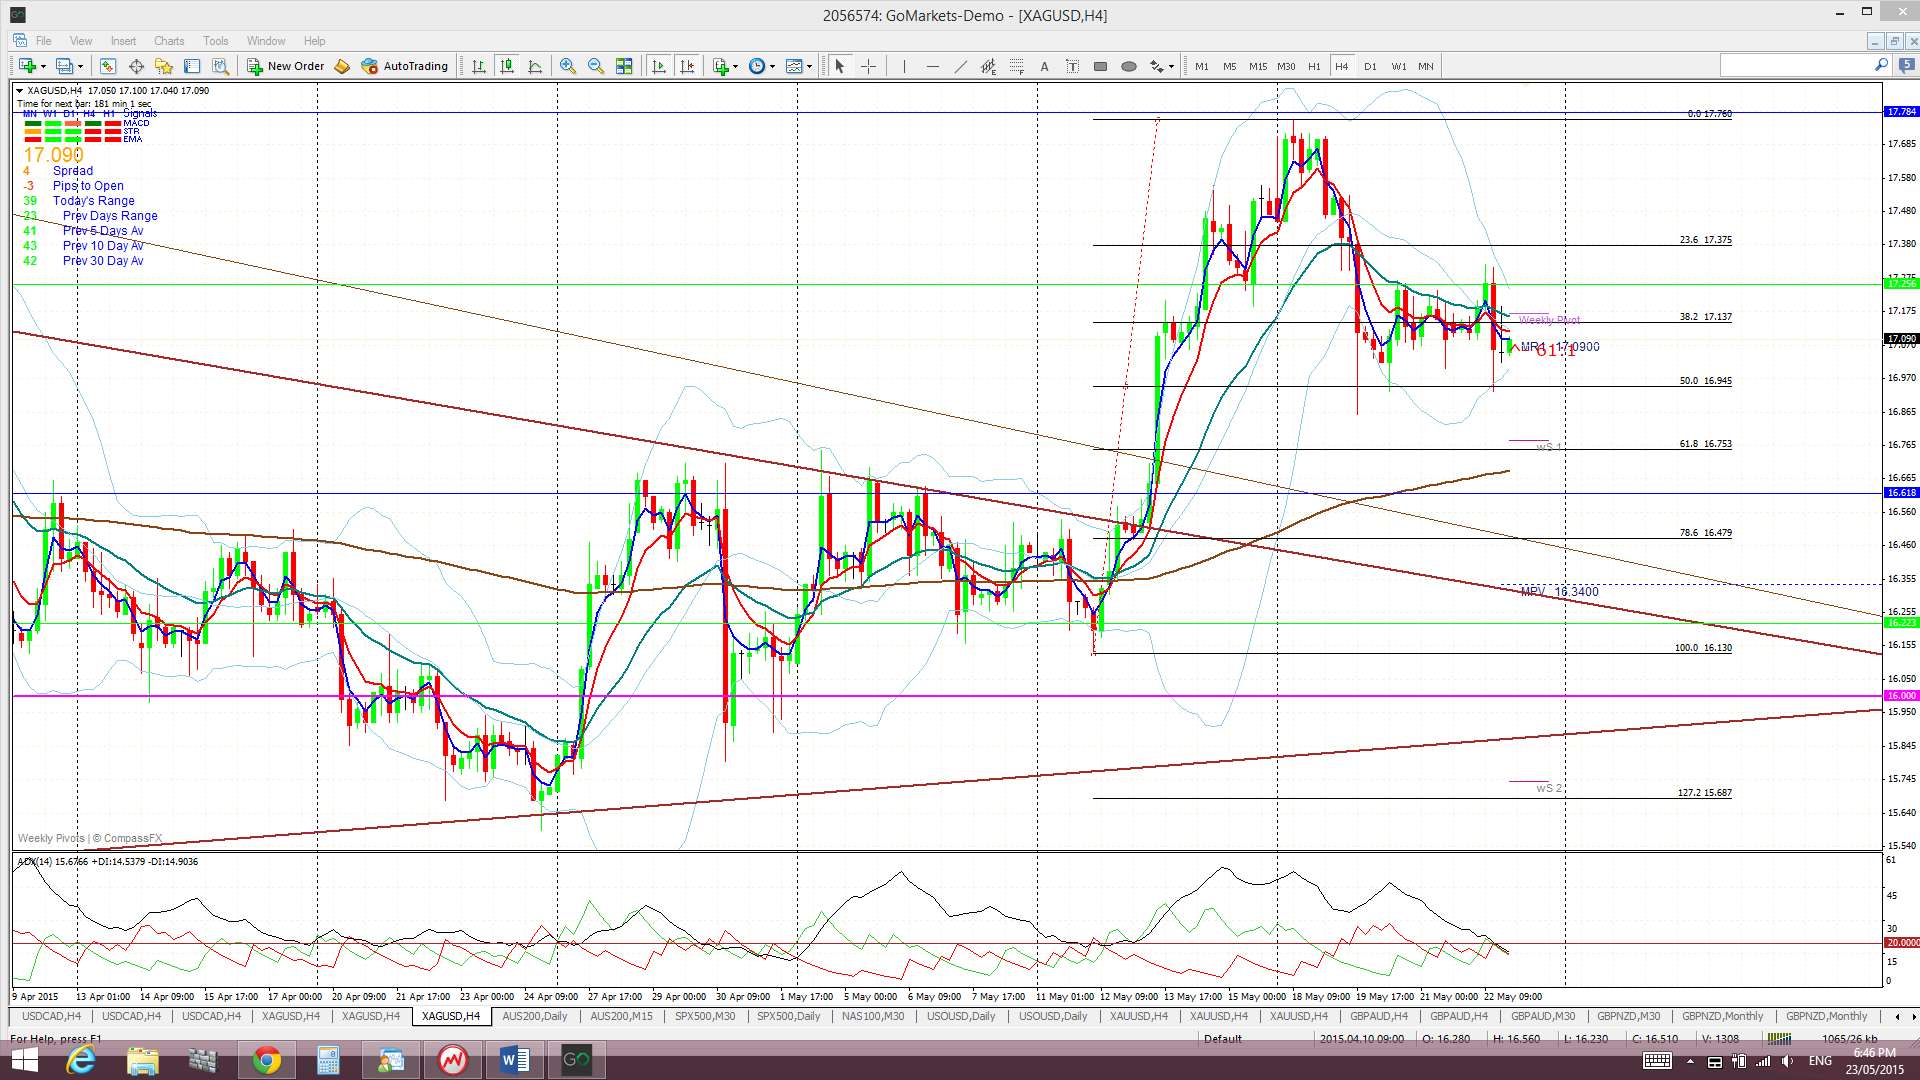
The weekly chart shows the triangle breakout and subsequent pull-back to test this broken trend line but it will be the next directional move that will be closely watched. Will the bullish breakout move continue after this test of trend line or fail? The fate of this breakout move will most likely rest in the fortunes of the US$ as any continued US$ strength would undermine this bullish Silver move.
Silver is trading in the Ichimoku Cloud on the 4hr, above the Cloud on the daily chart but below the Cloud on the weekly and monthly charts.
The weekly candle closed as a bearish coloured ‘inside’ candle reflecting the indecision here.
- I’m watching for any new TC signal, the $16 and $15 levels and the monthly chart’s triangle pattern.
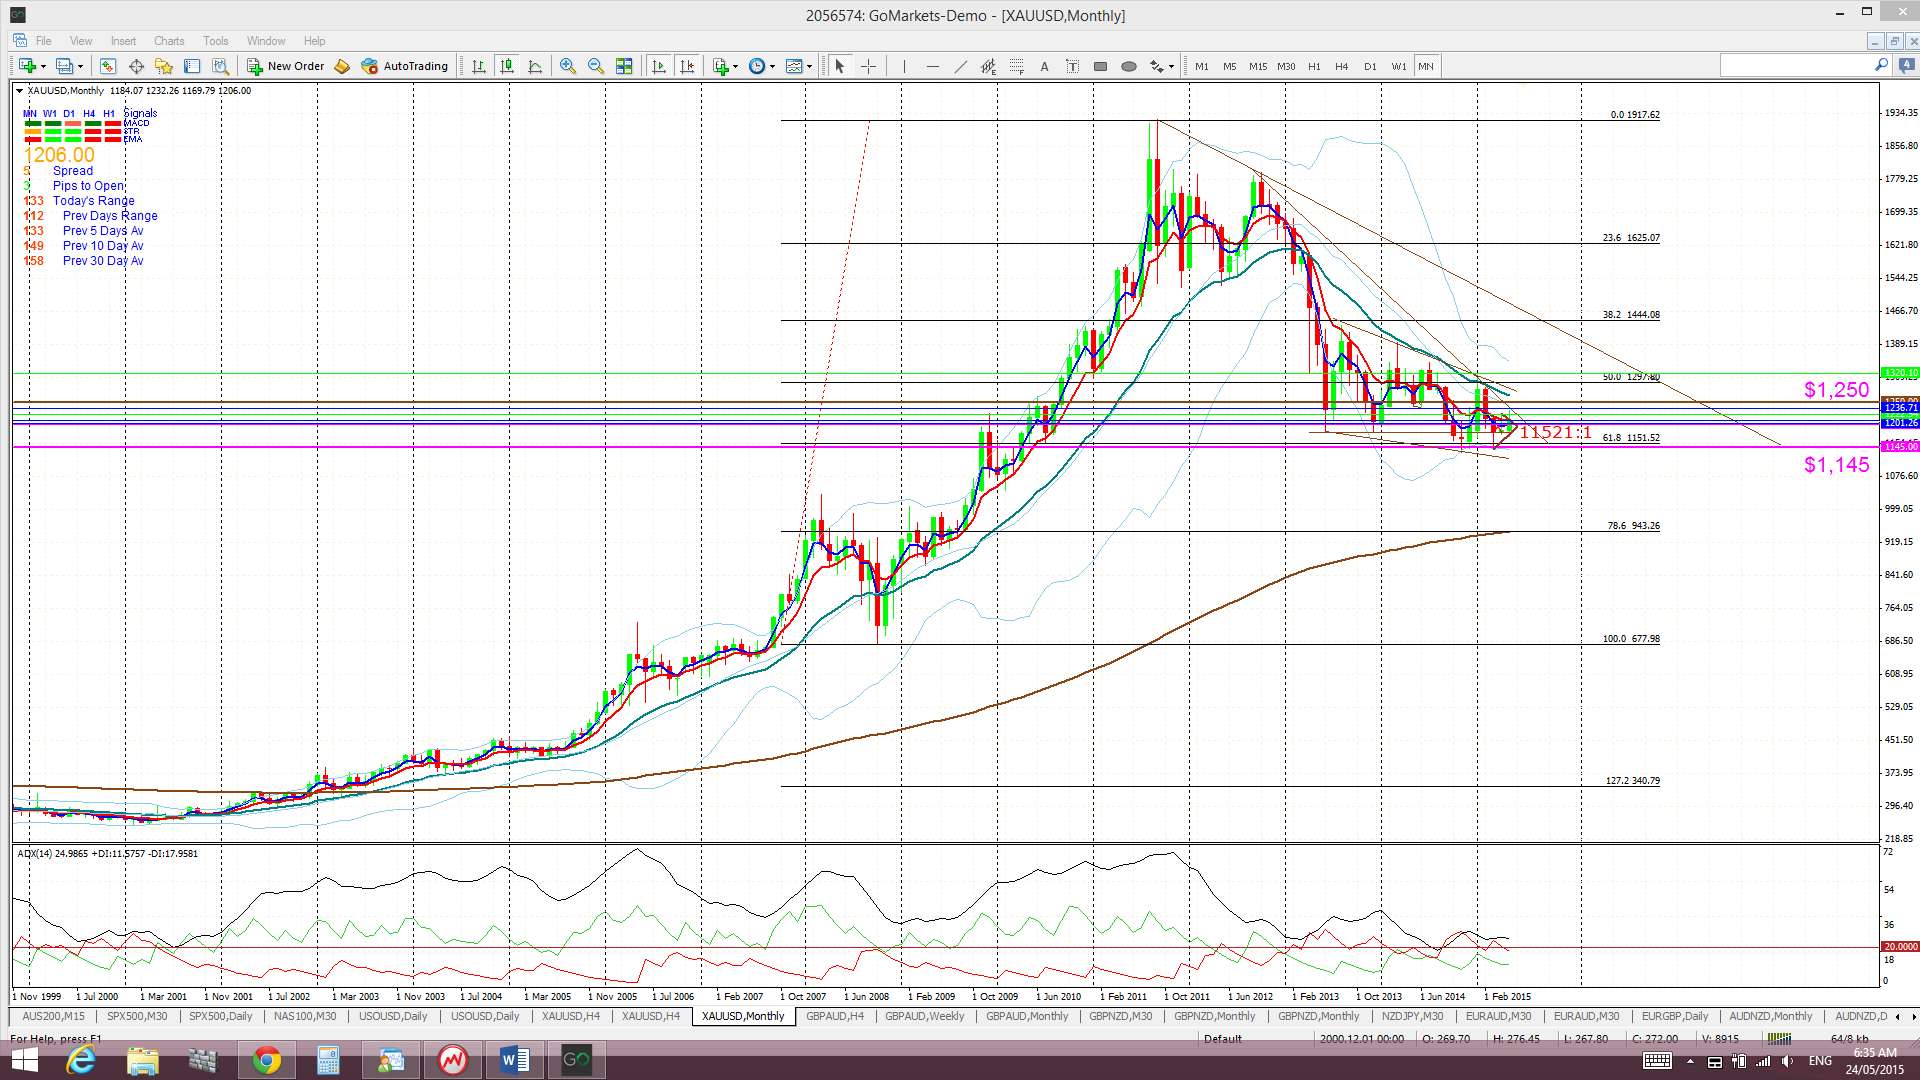
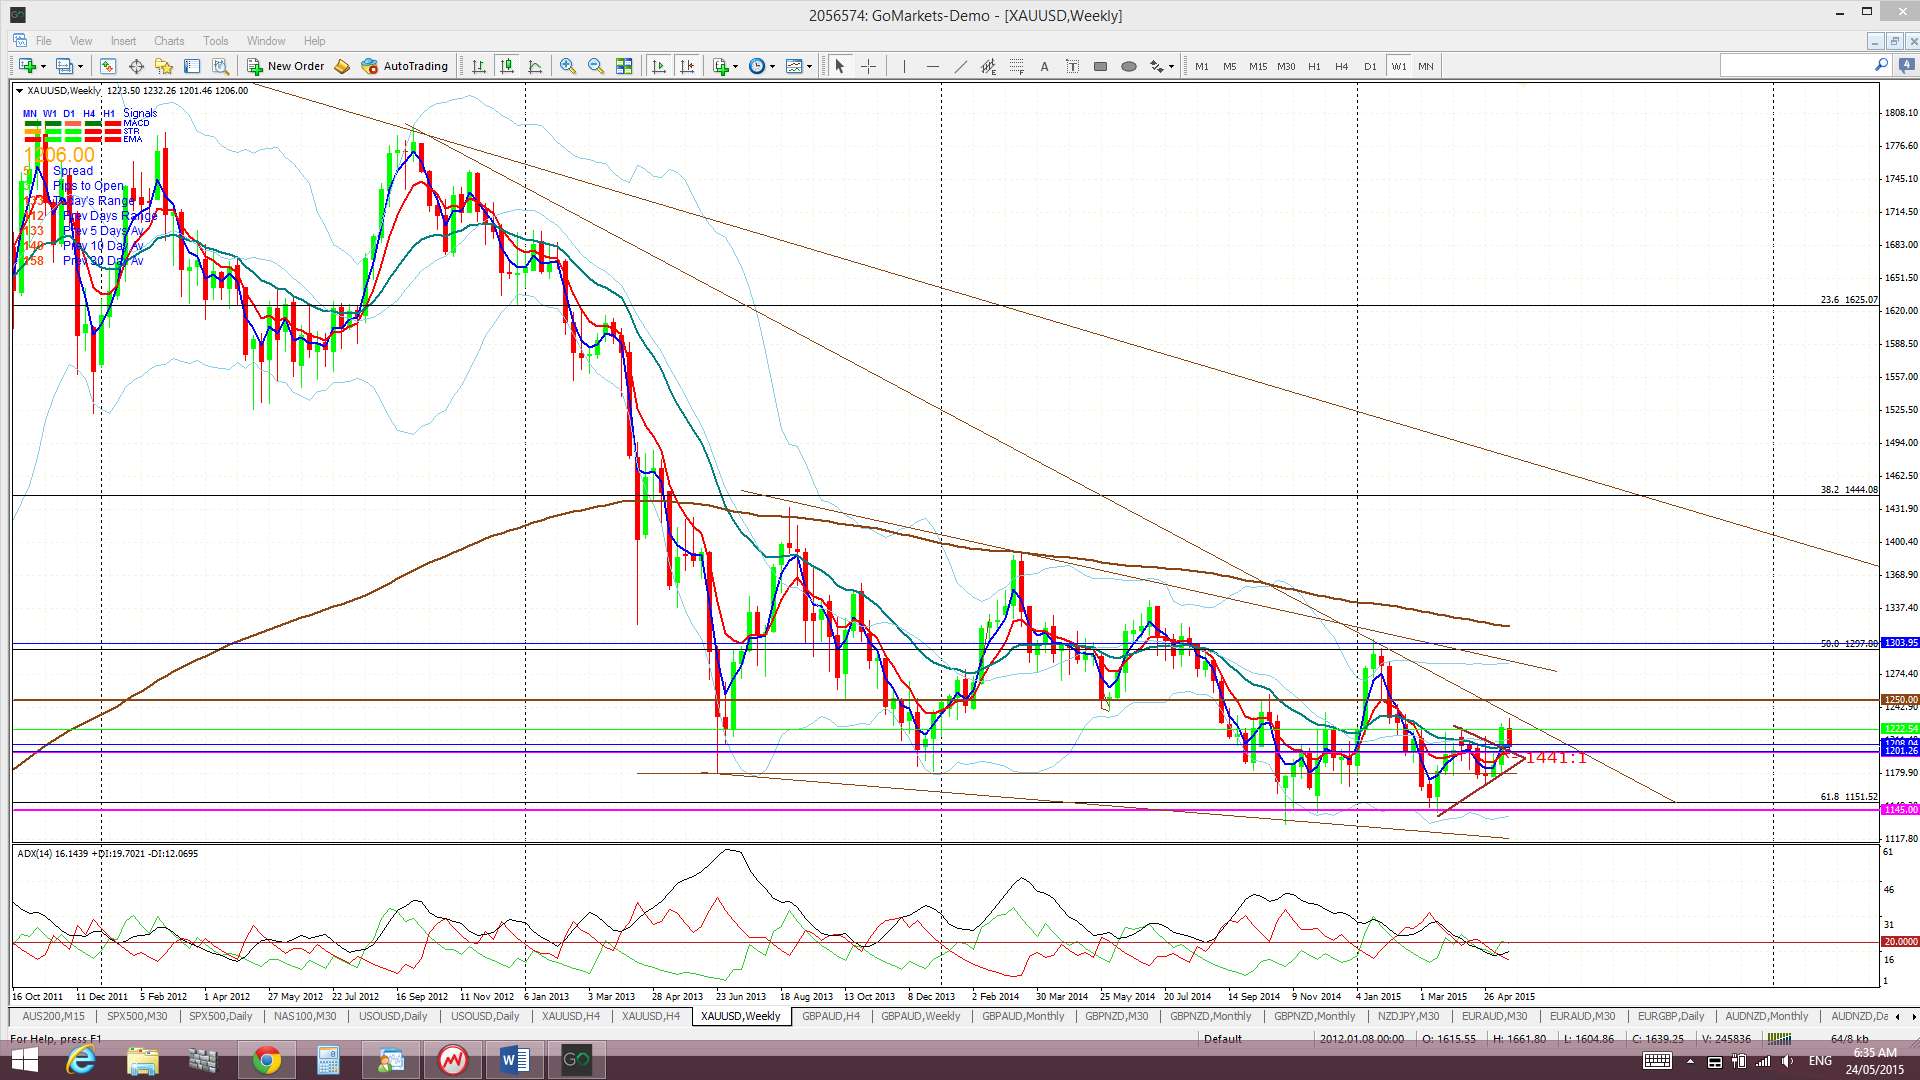
Gold: The recent Gold rally paused last week with US% strength as well. The metal has pulled back to test the 50% retracement fib of this recent bull run and the key $1,200 level. The weekly chart is the interesting one to check out here though. This chart shows a two+ year trend line just above current price and this is helping to form up a bullish descending wedge pattern. The success or otherwise here though will most likely be determined by the next directional move on the US$.
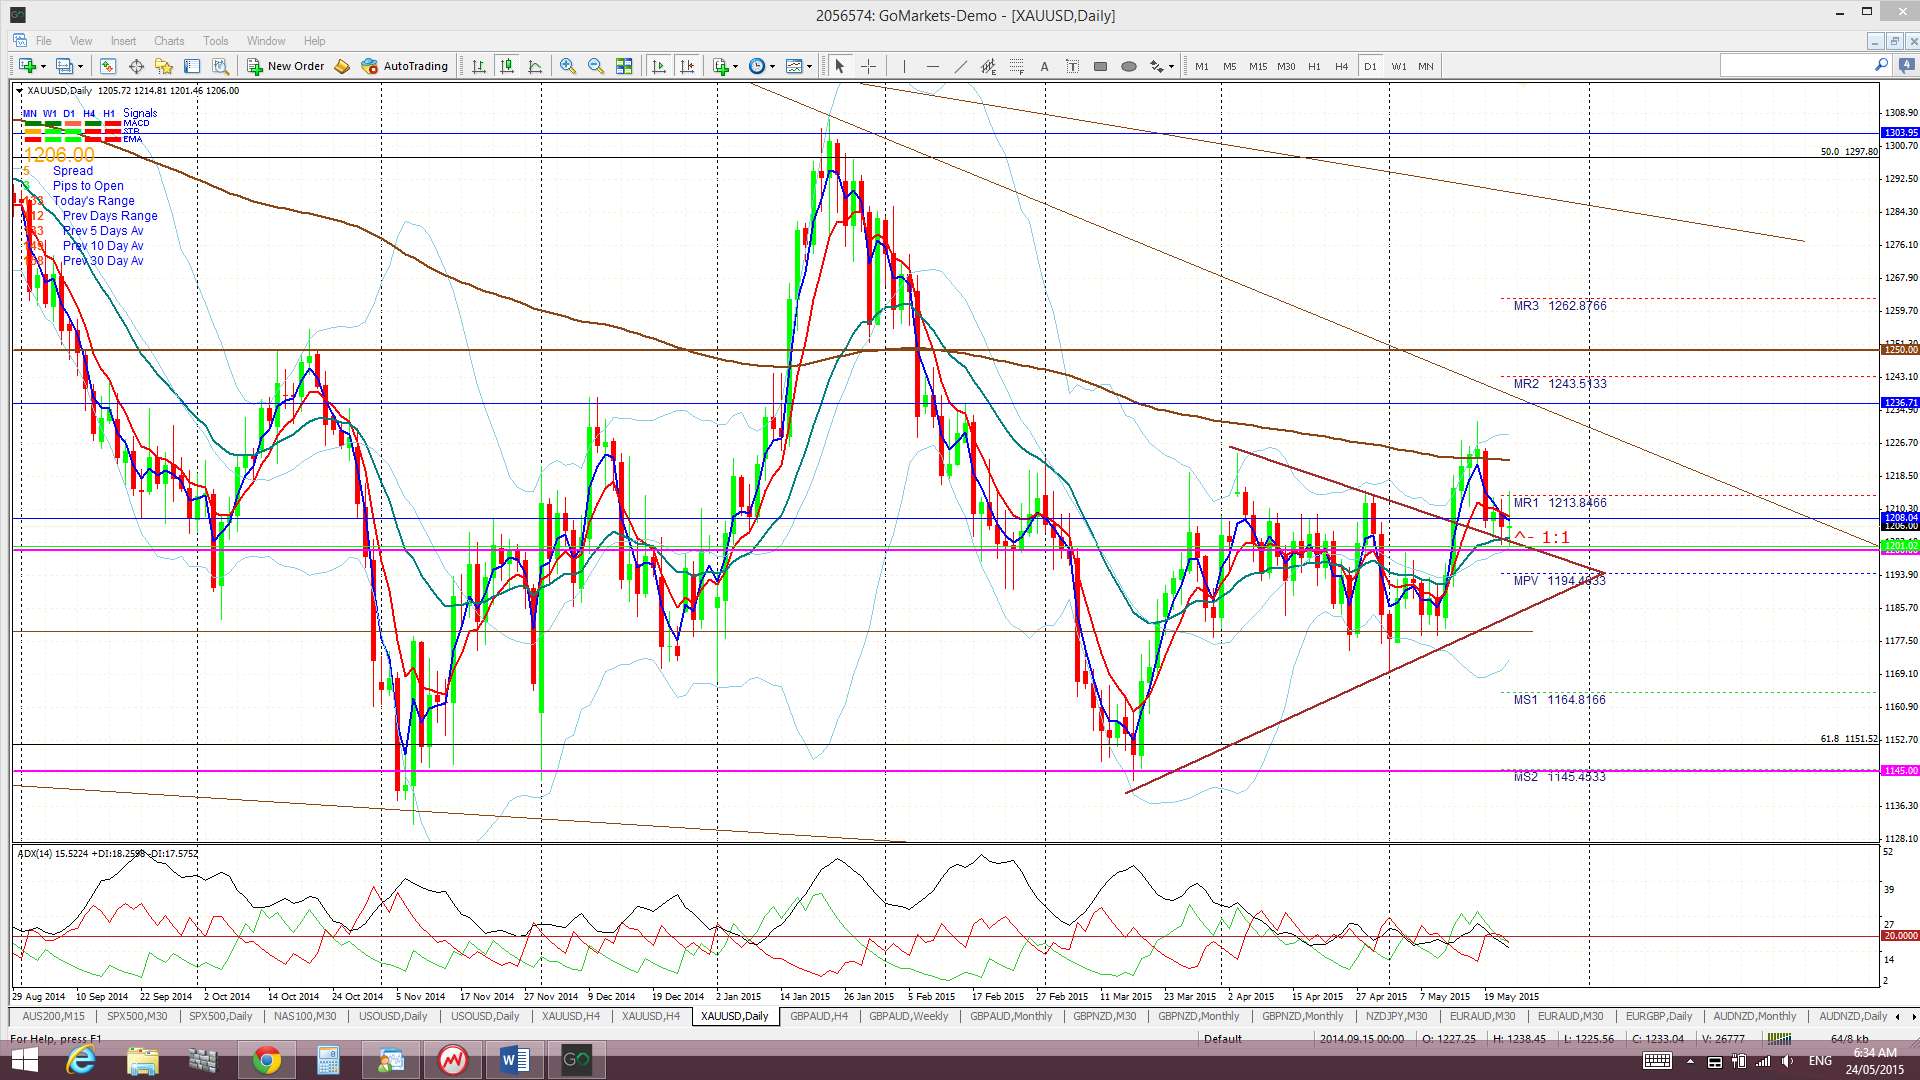
Gold does continue to hold above the 61.8% Fib retracement of the 2008-2011 bull run that is near $1,145 though. The daily, weekly and monthly charts show that Gold is really just chopping sideways above this 61.8% fib support and seems to be waiting for the next major move with the US$.
However, any new break and hold back below $1,145 would suggest a deeper pull back. Bearish targets below $1,145 include the $1,000 psychological level and, then, the 78.6% fib near $950.
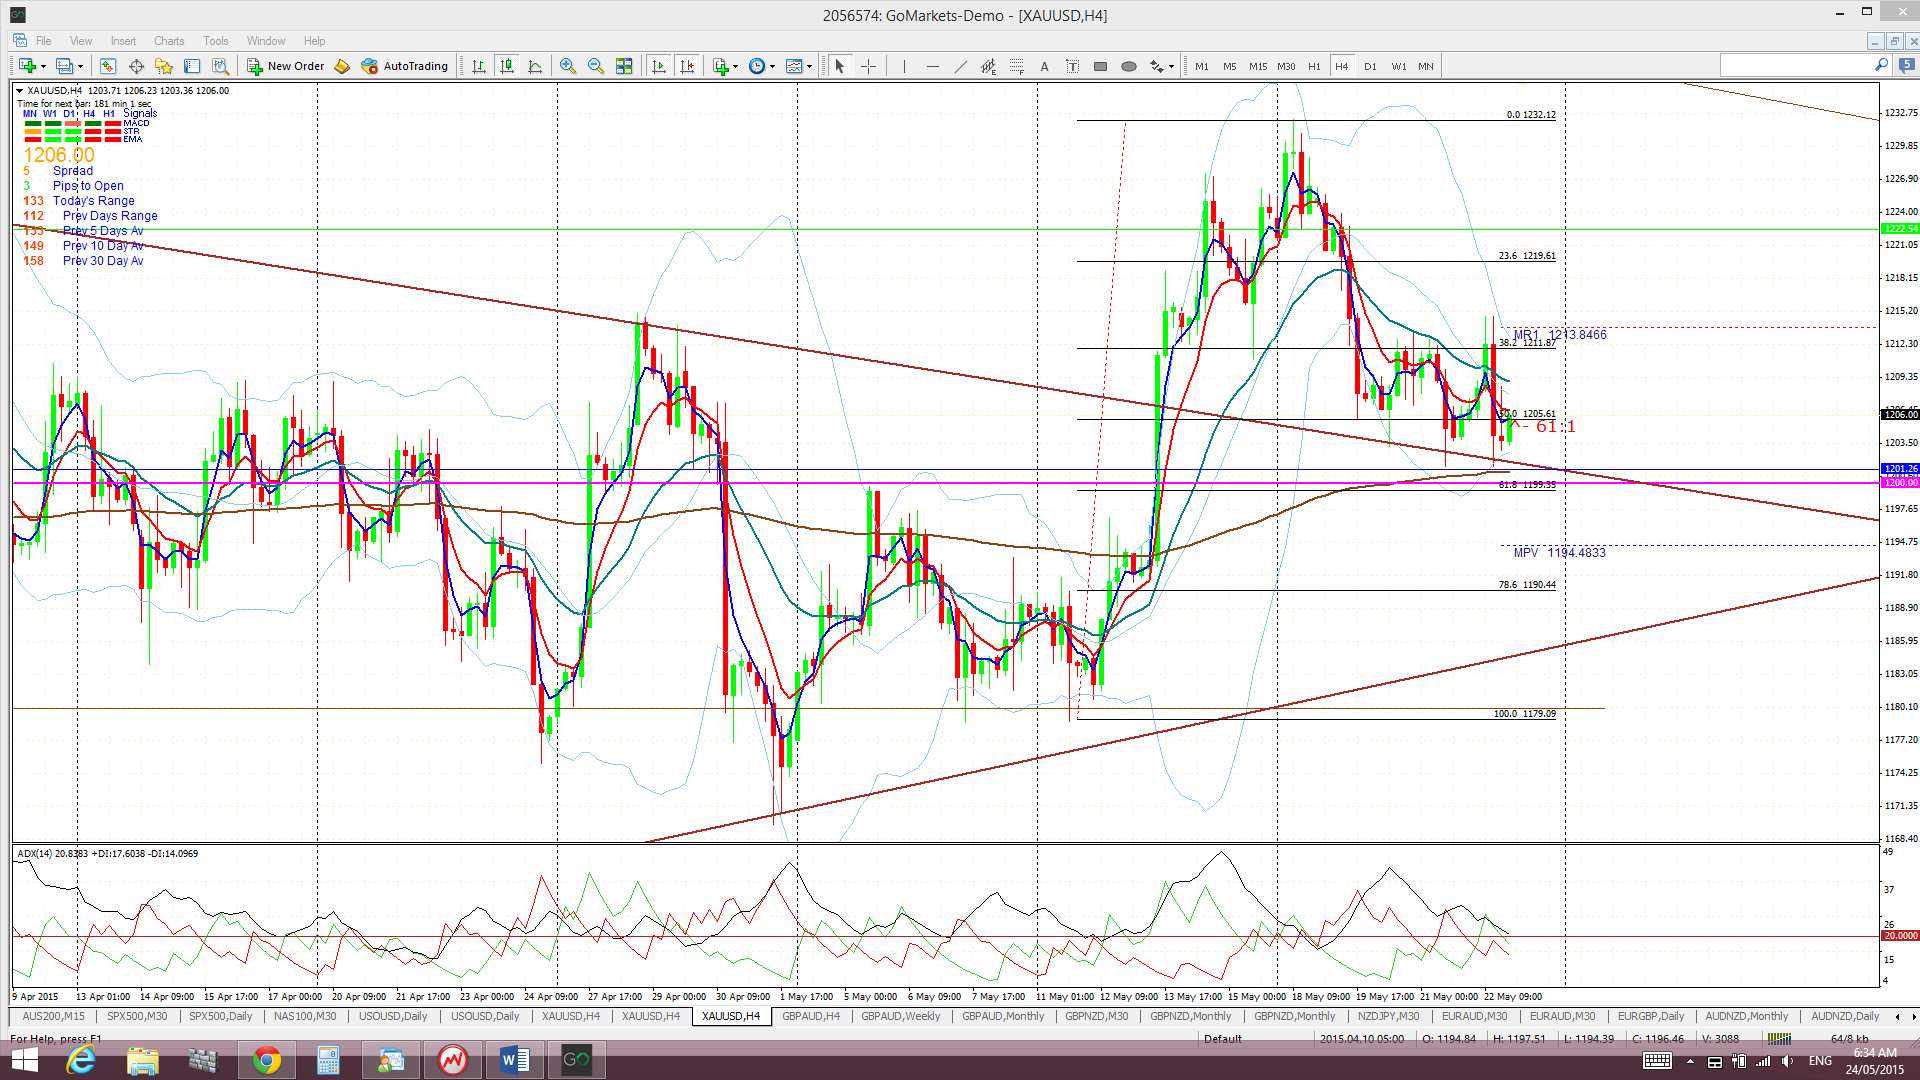
Gold is trading in the bottom of the Cloud on the 4hr chart, in the middle of the Cloud on the daily chart but below the Ichimoku Cloud on the weekly and monthly charts.
The weekly candle closed as a small bearish coloured ‘inside’ candle reflecting the indecision here.
- I’m watching for any new TC signal, the $1,200 level and the weekly chart’s bear trend line.
The post US interest rates? The question that’s still running this show. appeared first on www.forextell.com.