The US$ index remains range-bound within a Flag pattern, as does the EUR$ index, but tonight’s ECB news has the potential to trigger some movement on both indices. There are some key technical levels worth watching on the US$ with this ECB update and, then, into next week with the next major data item of the FOMC update.
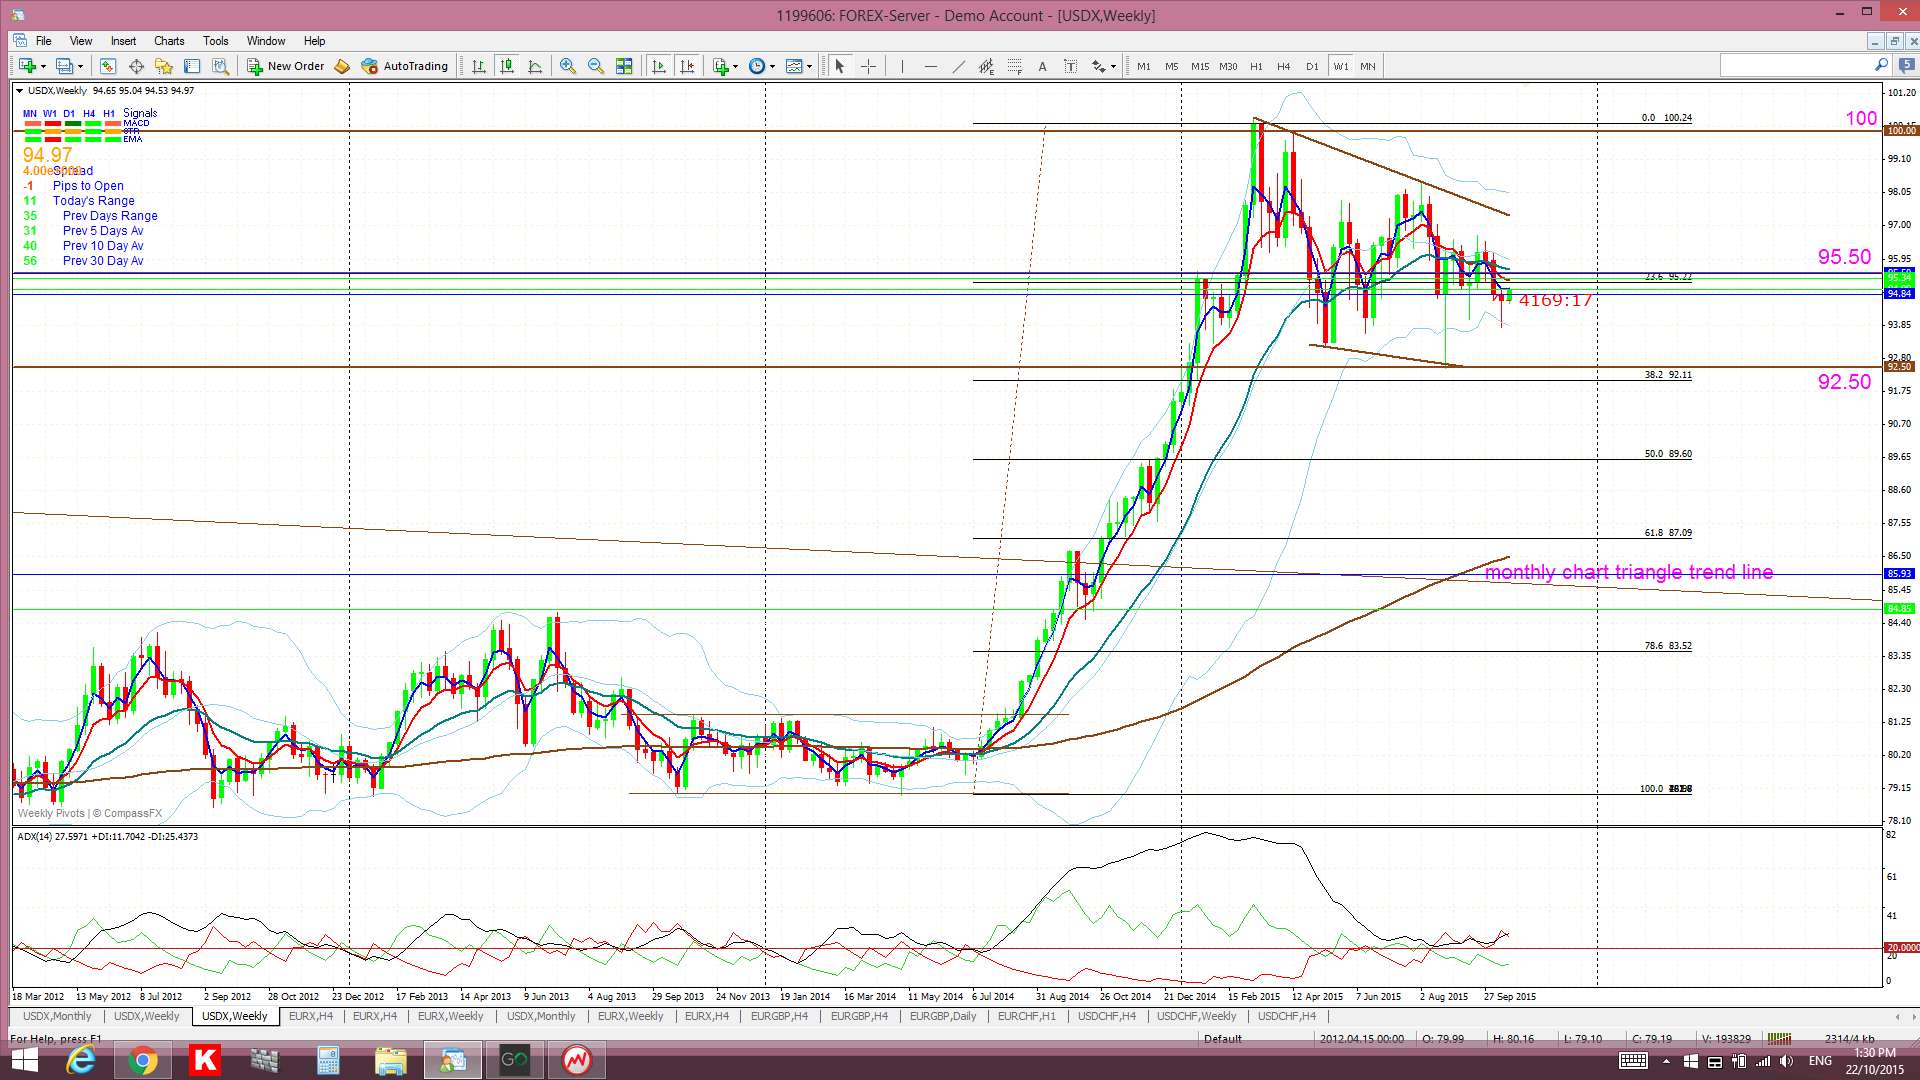
USDX weekly: the US$ index is trading just below the 95.50 level and this is the next upper resistance level to watch with today’s ECB update. Any break and hold back above 95.50 would then bring the upper Flag trend line followed by the 100 level into greater focus. Any respect of 95.50 and bearish momentum though will bring the lower Flag trend line and then 92.50 level into focus. The 92.50 level will be a crucial level for the index to try and hold. Many traders will look for a bounce up off this level but any break and hold below this could suggest a trip down to the 61.8% fib which is near the whole number 87 level, the weekly 200 EMA and the previously broken monthly-chart triangle trend line. Thus, quite a congested area:
USDX 4hr: It is worth noting that the 95.50 level, as well as being longer term S/R on the weekly and monthly charts, is rather important on the 4hr chart as well. The 95.50 level is up near the 61.8% fib of the recent swing low move and also near the 4hr 200 EMA making this a rather congested resistance zone on this time frame too. However, by inference, that would mean that any bullish close and hold back above this level would be a signal of some strength and of potential for further bullish follow through.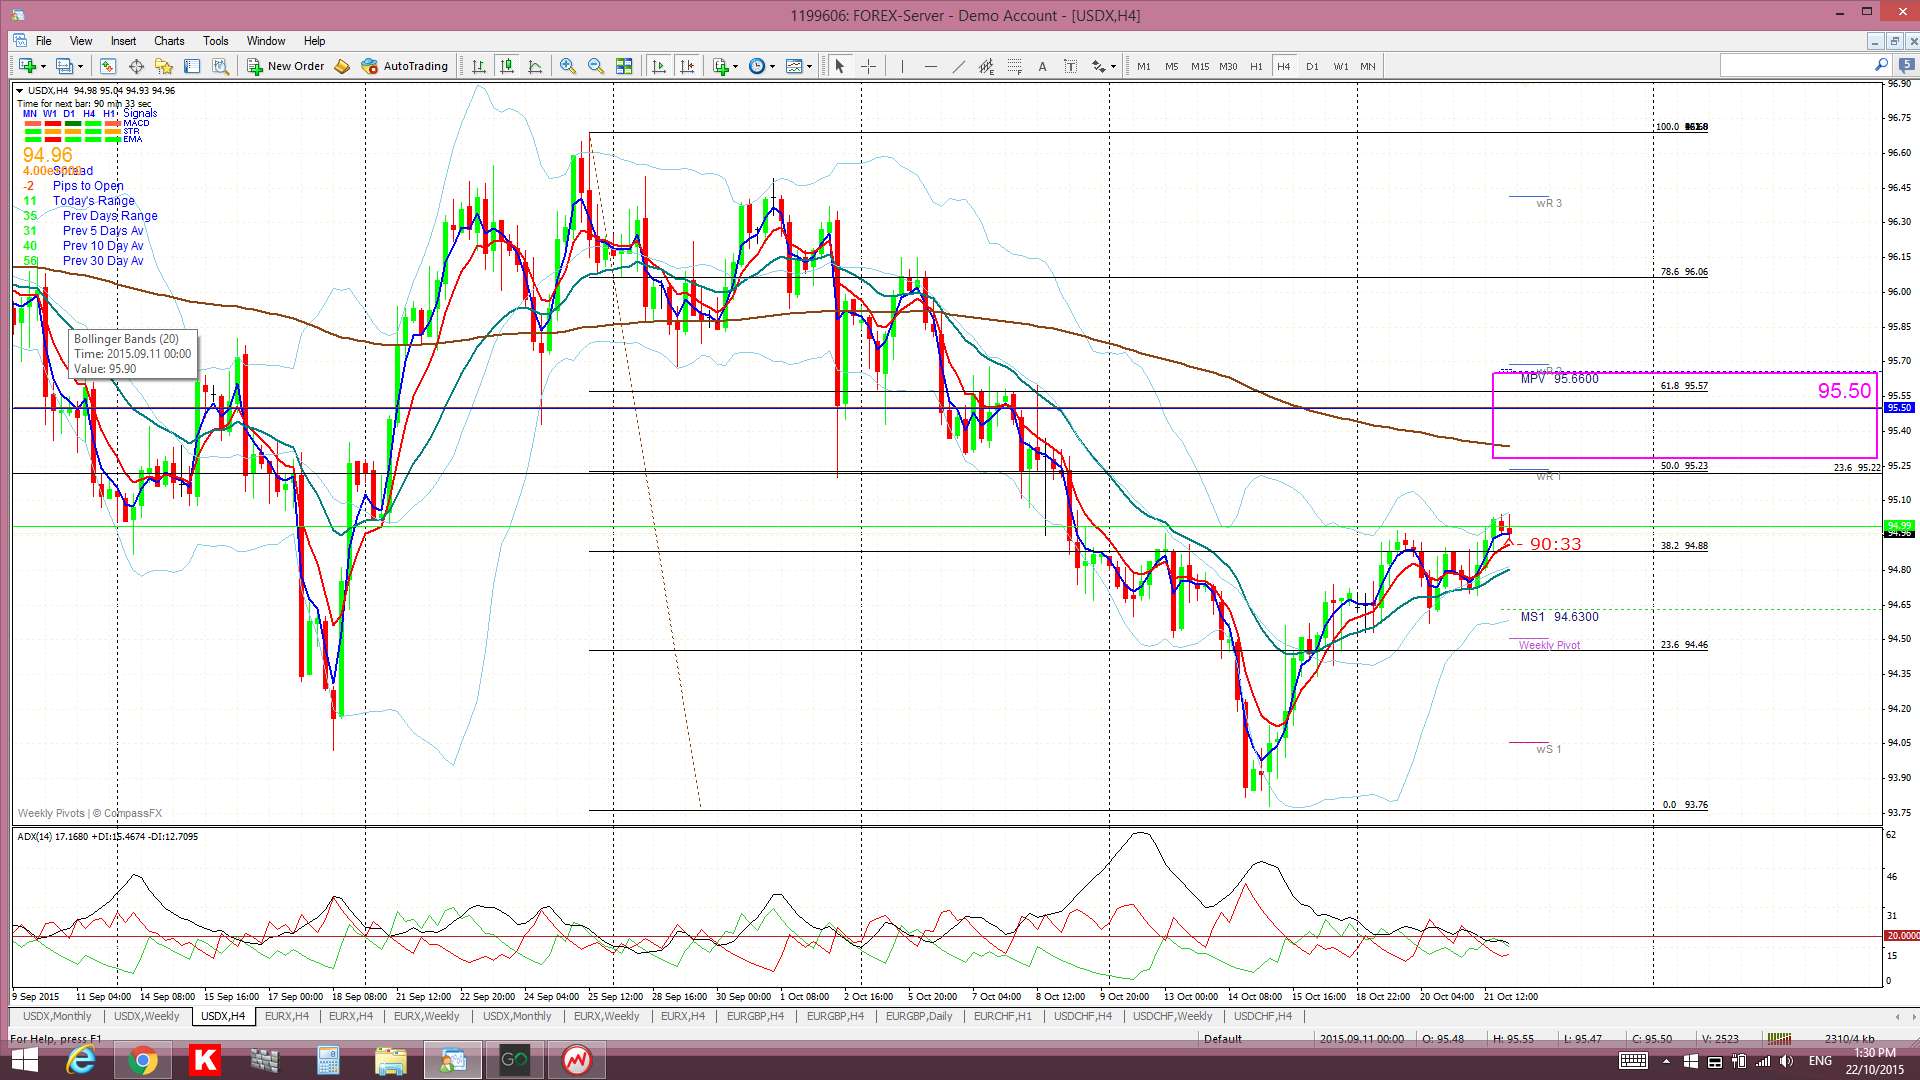
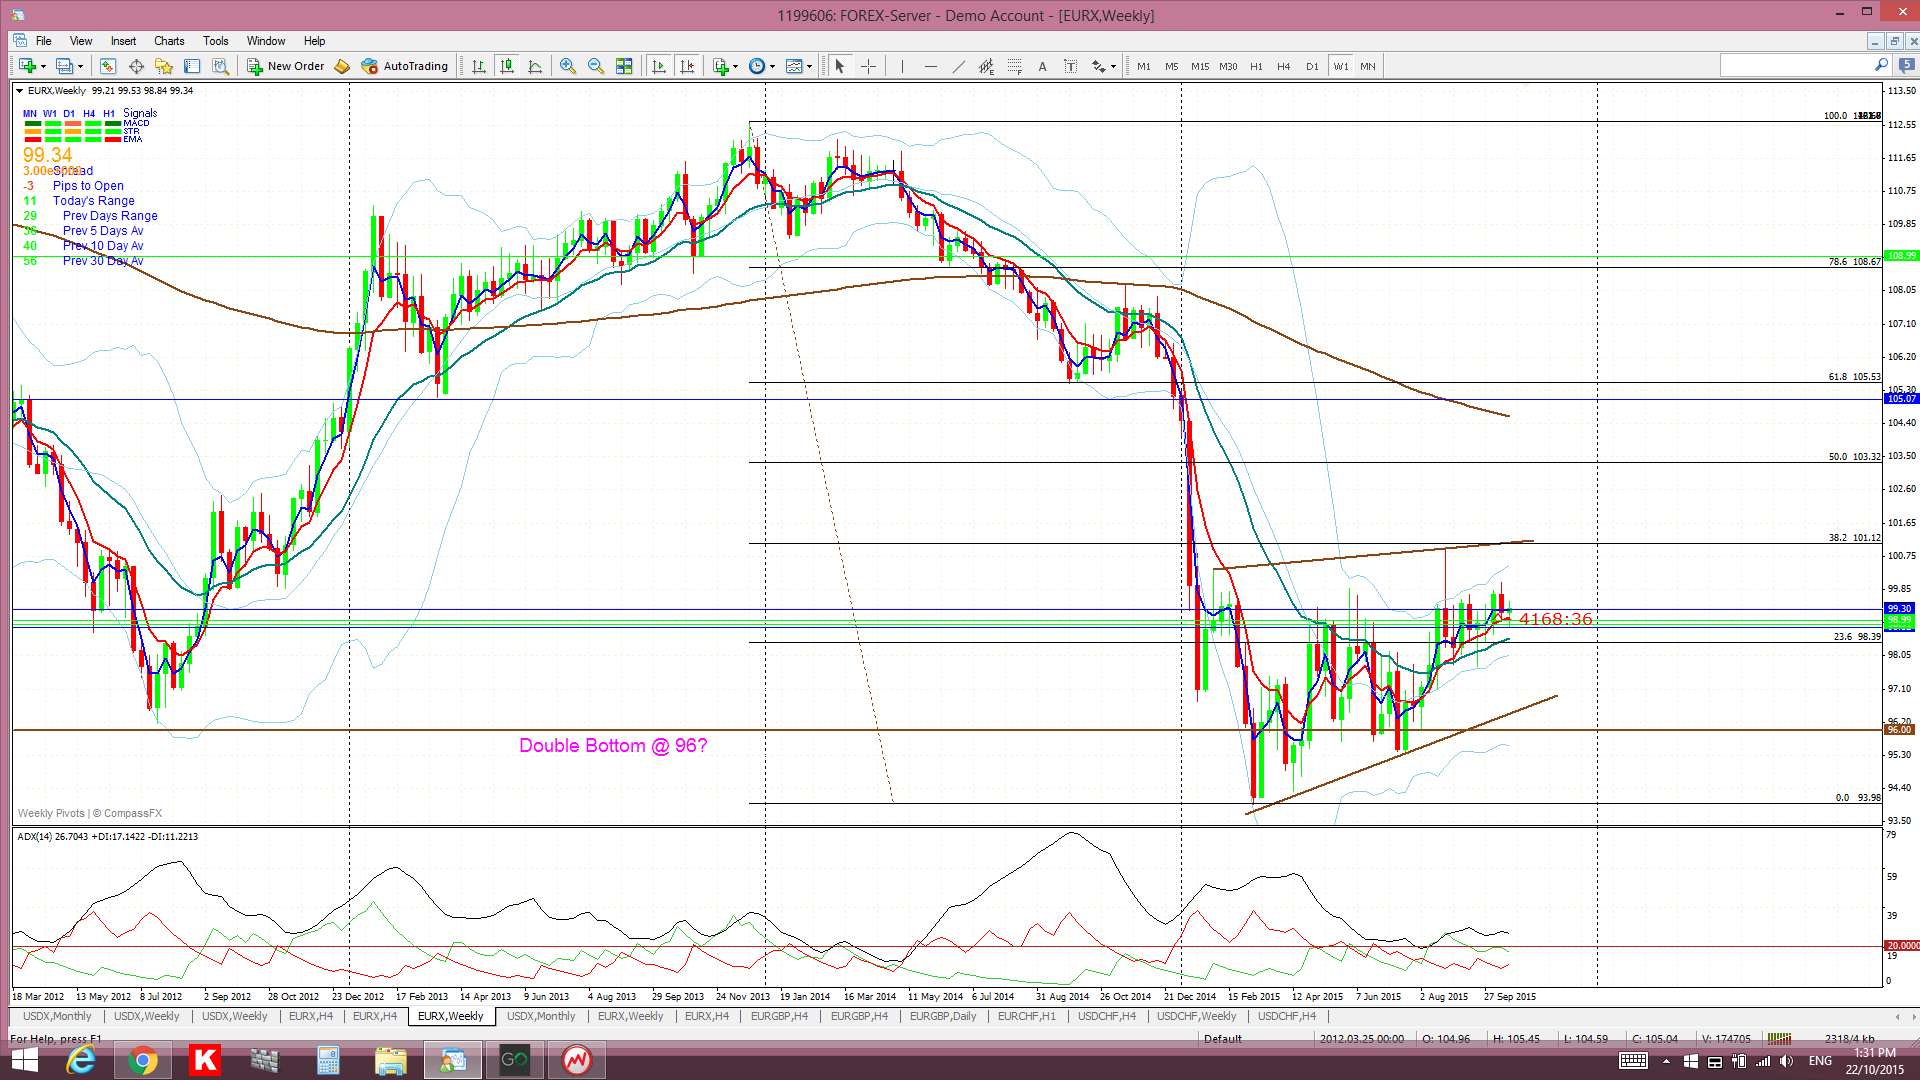
EURX weekly: this remains Flag-bound for now as well:
Summary: Today’s ECB and next week’s FOMC updates, although just two of many EUR and USD economically sensitive items, will be closely watched by traders to see what impact they have on the US$ and EUR$. The key technical levels to watch on the US$ include:
Resistance levels above current price:
- 95.50.
- upper Flag trend line.
- 100.
Support level below current price:
- 92.50.
- lower Flag trend line.
- 87: near the weekly chart’s 61.8% fib, weekly 200 EMA & previously broken trend line.
The post US$: levels to watch with today’s ECB & next week’s FOMC. appeared first on www.forextell.com.