USDX
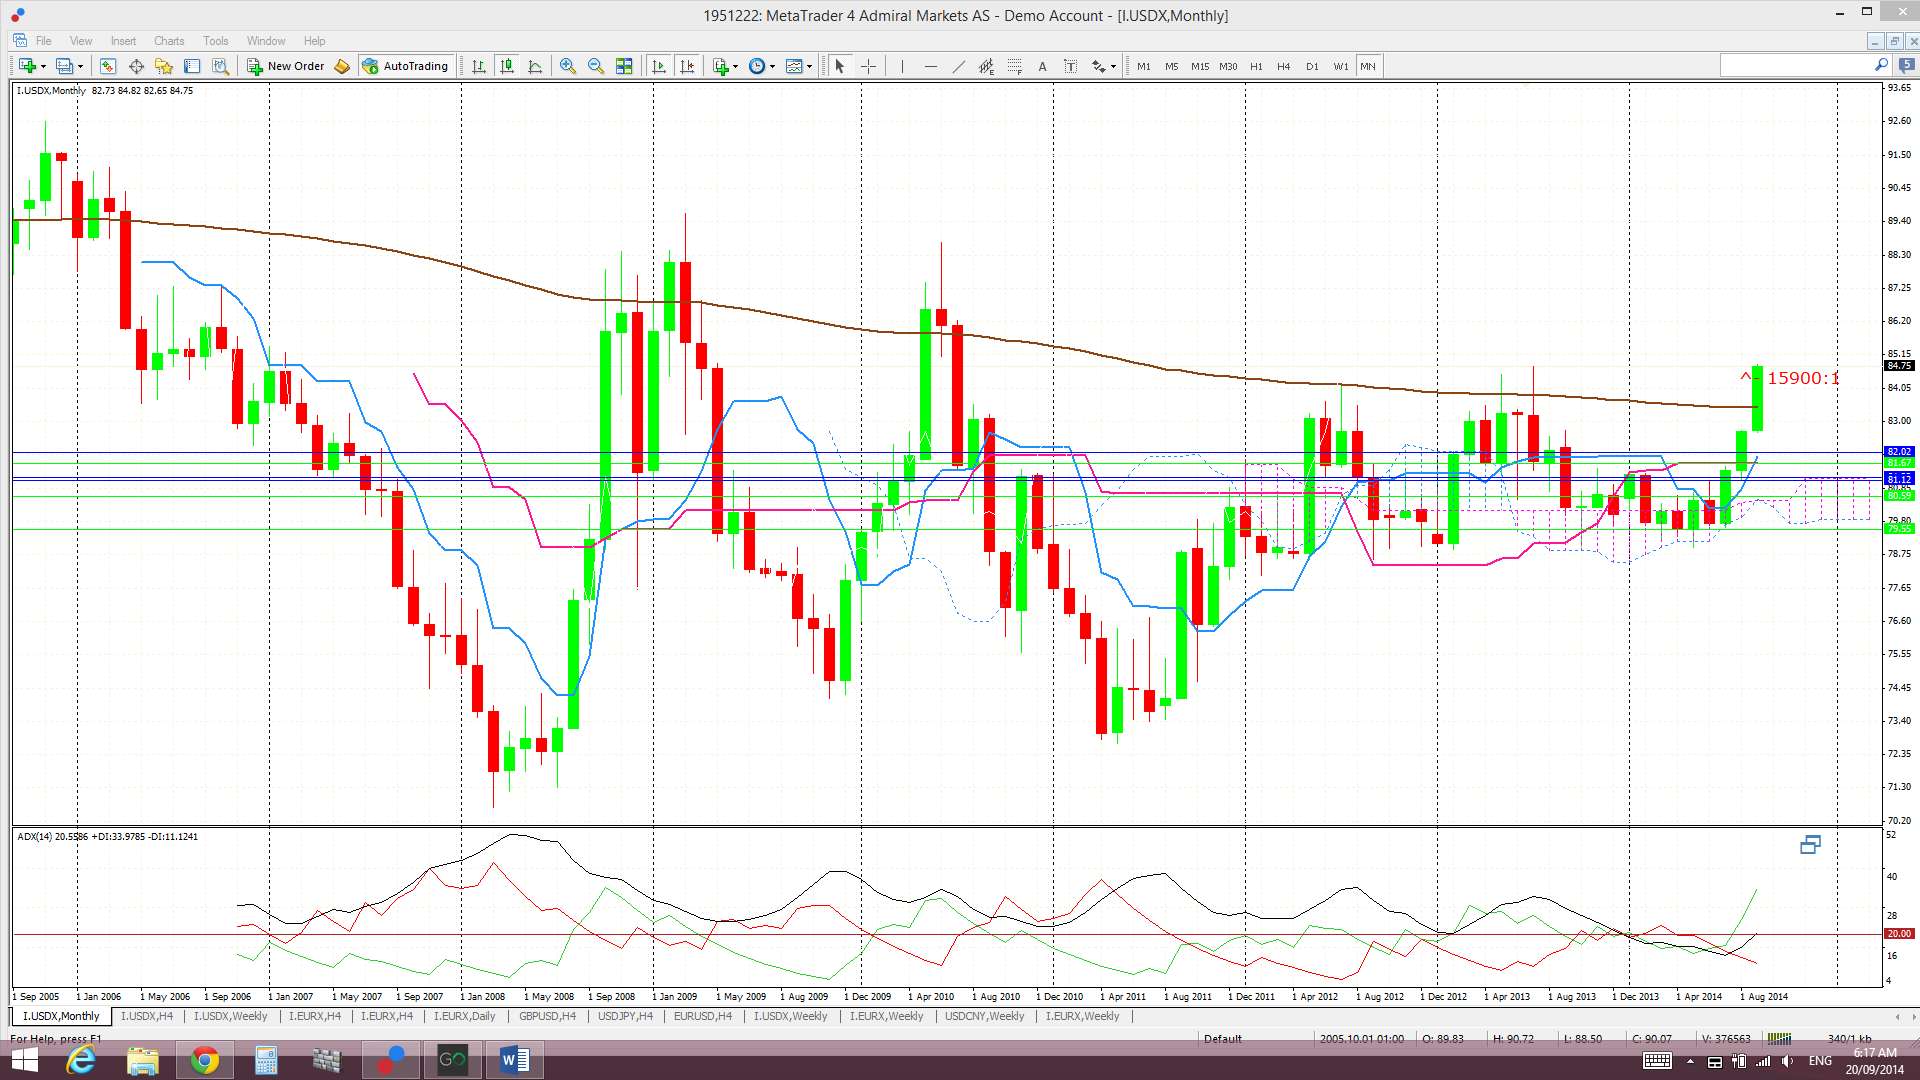
Monthly: The September candle is still large and bullish and above the resistance of the 61.8% fib of the last major swing bear move 2010-2011 and the monthly 200 EMA. It is still butting up against the next wave of major resistance from the 78.6% fib and the monthly chart’s bear triangle trend line which continues to give the chart a bearish ‘Triple Top’ appearance.

Monthly Ichimoku: The September candle is well above the monthly Cloud. The Cloud band has flipped to bullish and is starting to trend higher now. The monthly Cloud chart shows that, whilst the index had spent much of the last 3 years within or near the monthly Ichimoku Cloud, it has now broken well above the Cloud. Decent tending markets might return if this index can remain free of the monthly Cloud.
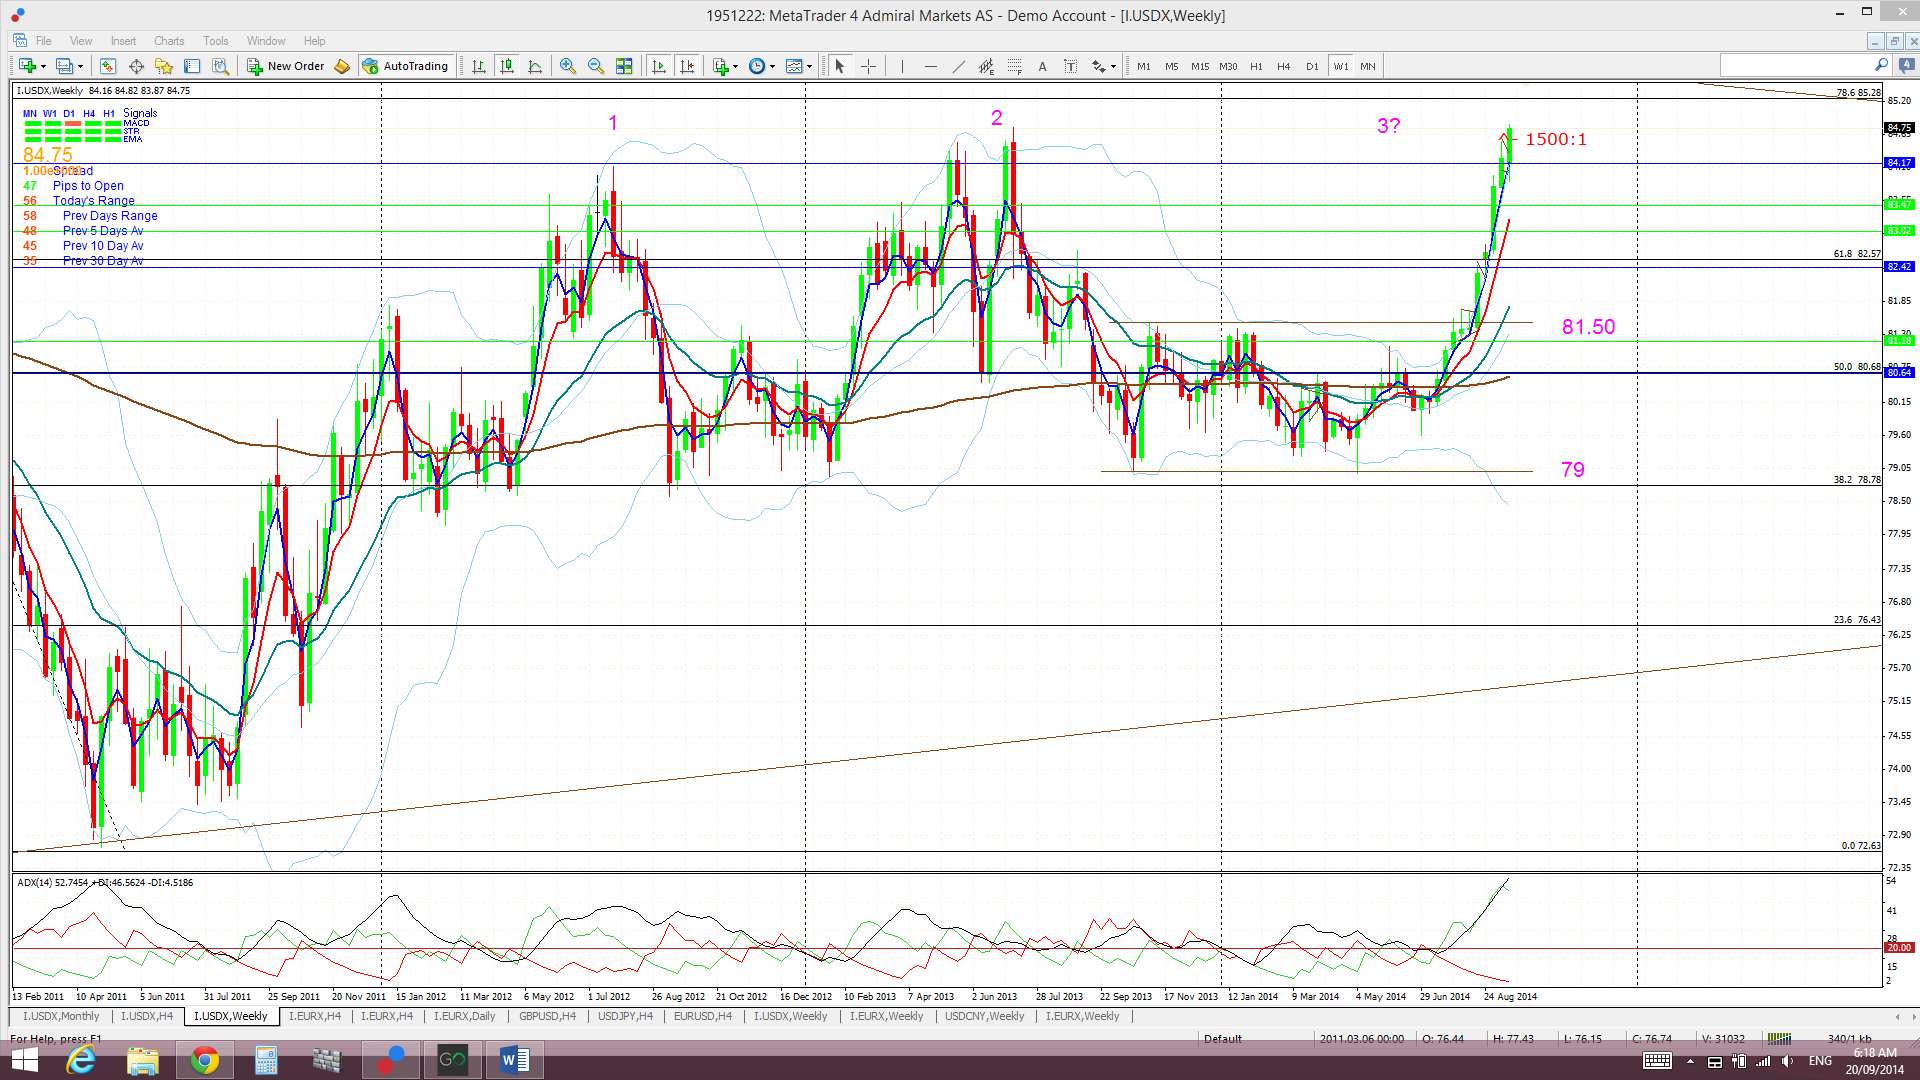
Weekly: The weekly candle closed as a bullish candle AND STILL ABOVE the key resistance of 81.50 (top of the recent trading channel), 82.50 (the 61.8% fib of the 2010-2011 bear move) and the monthly 200 EMA. It has also closed above the weekly candle highs set back in 20212 and 2013.
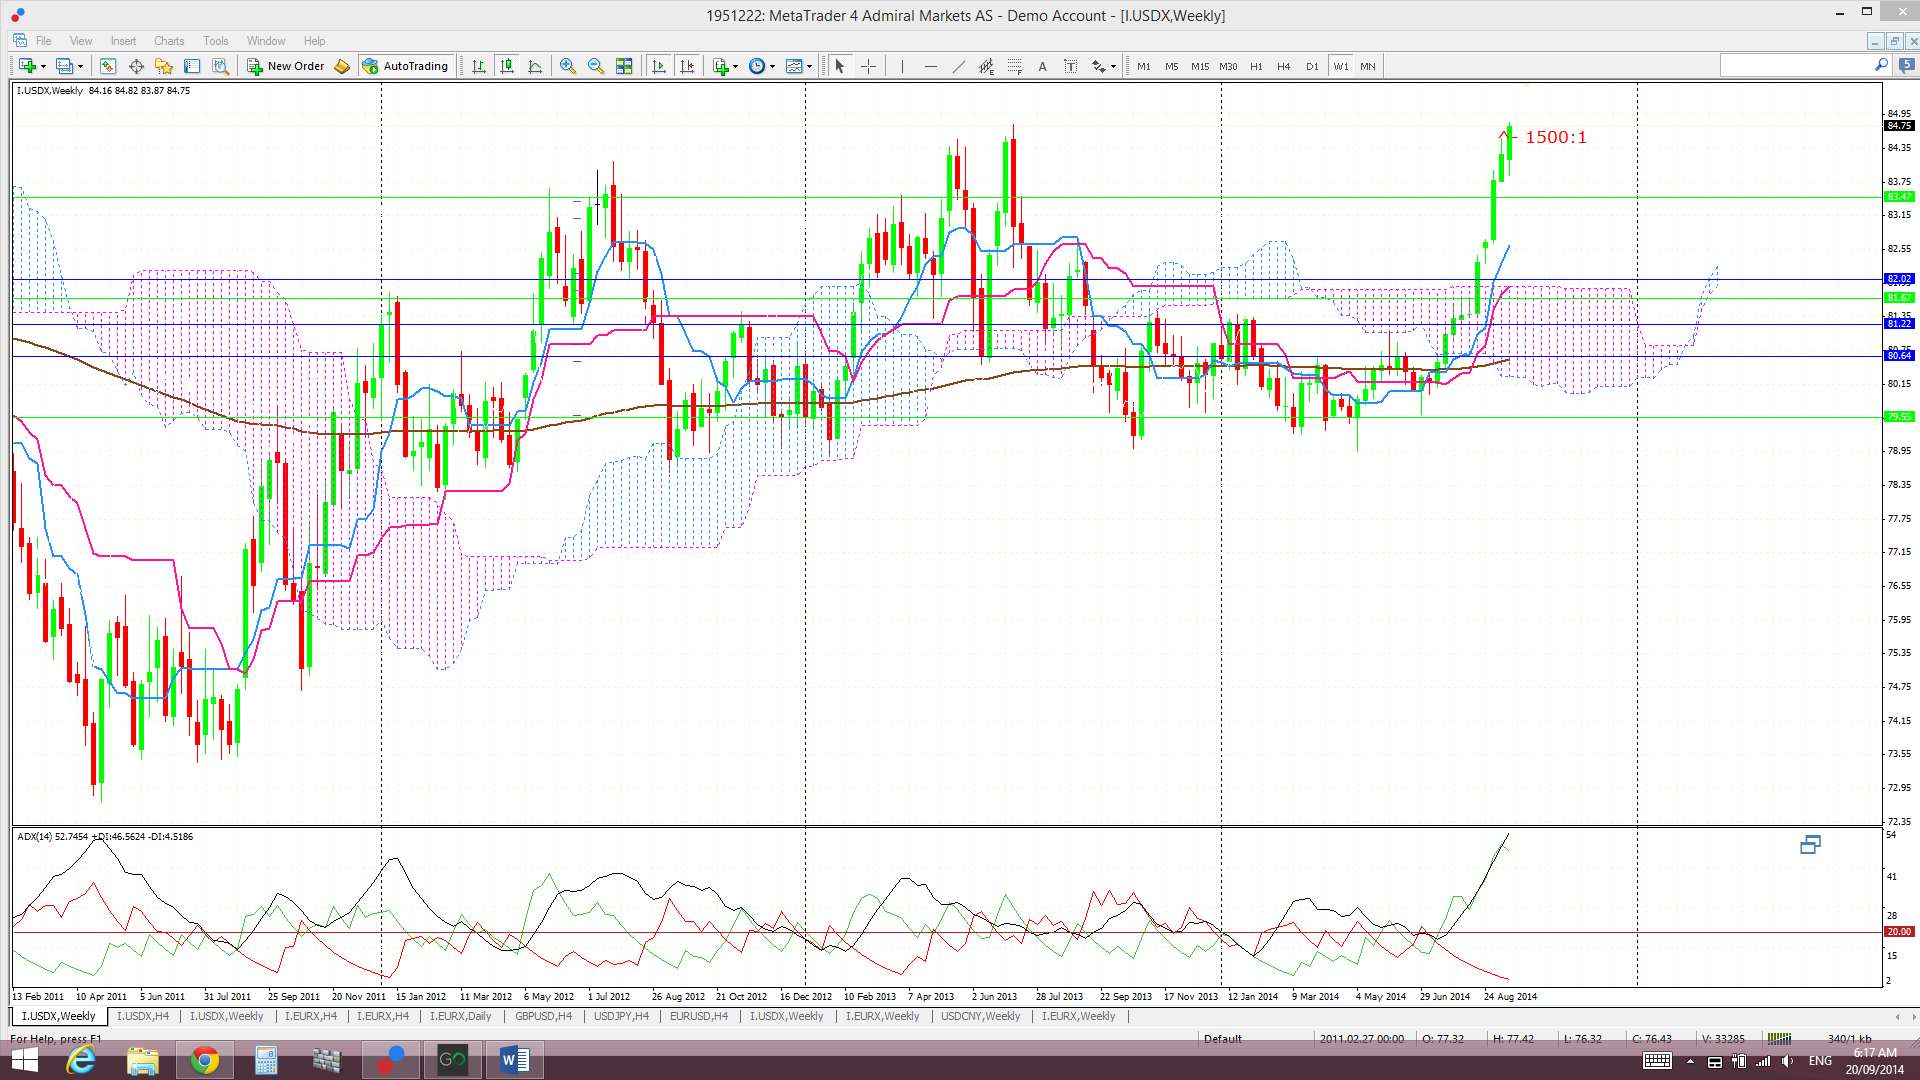
Weekly Ichimoku: Price is still trading ABOVE the weekly Cloud.
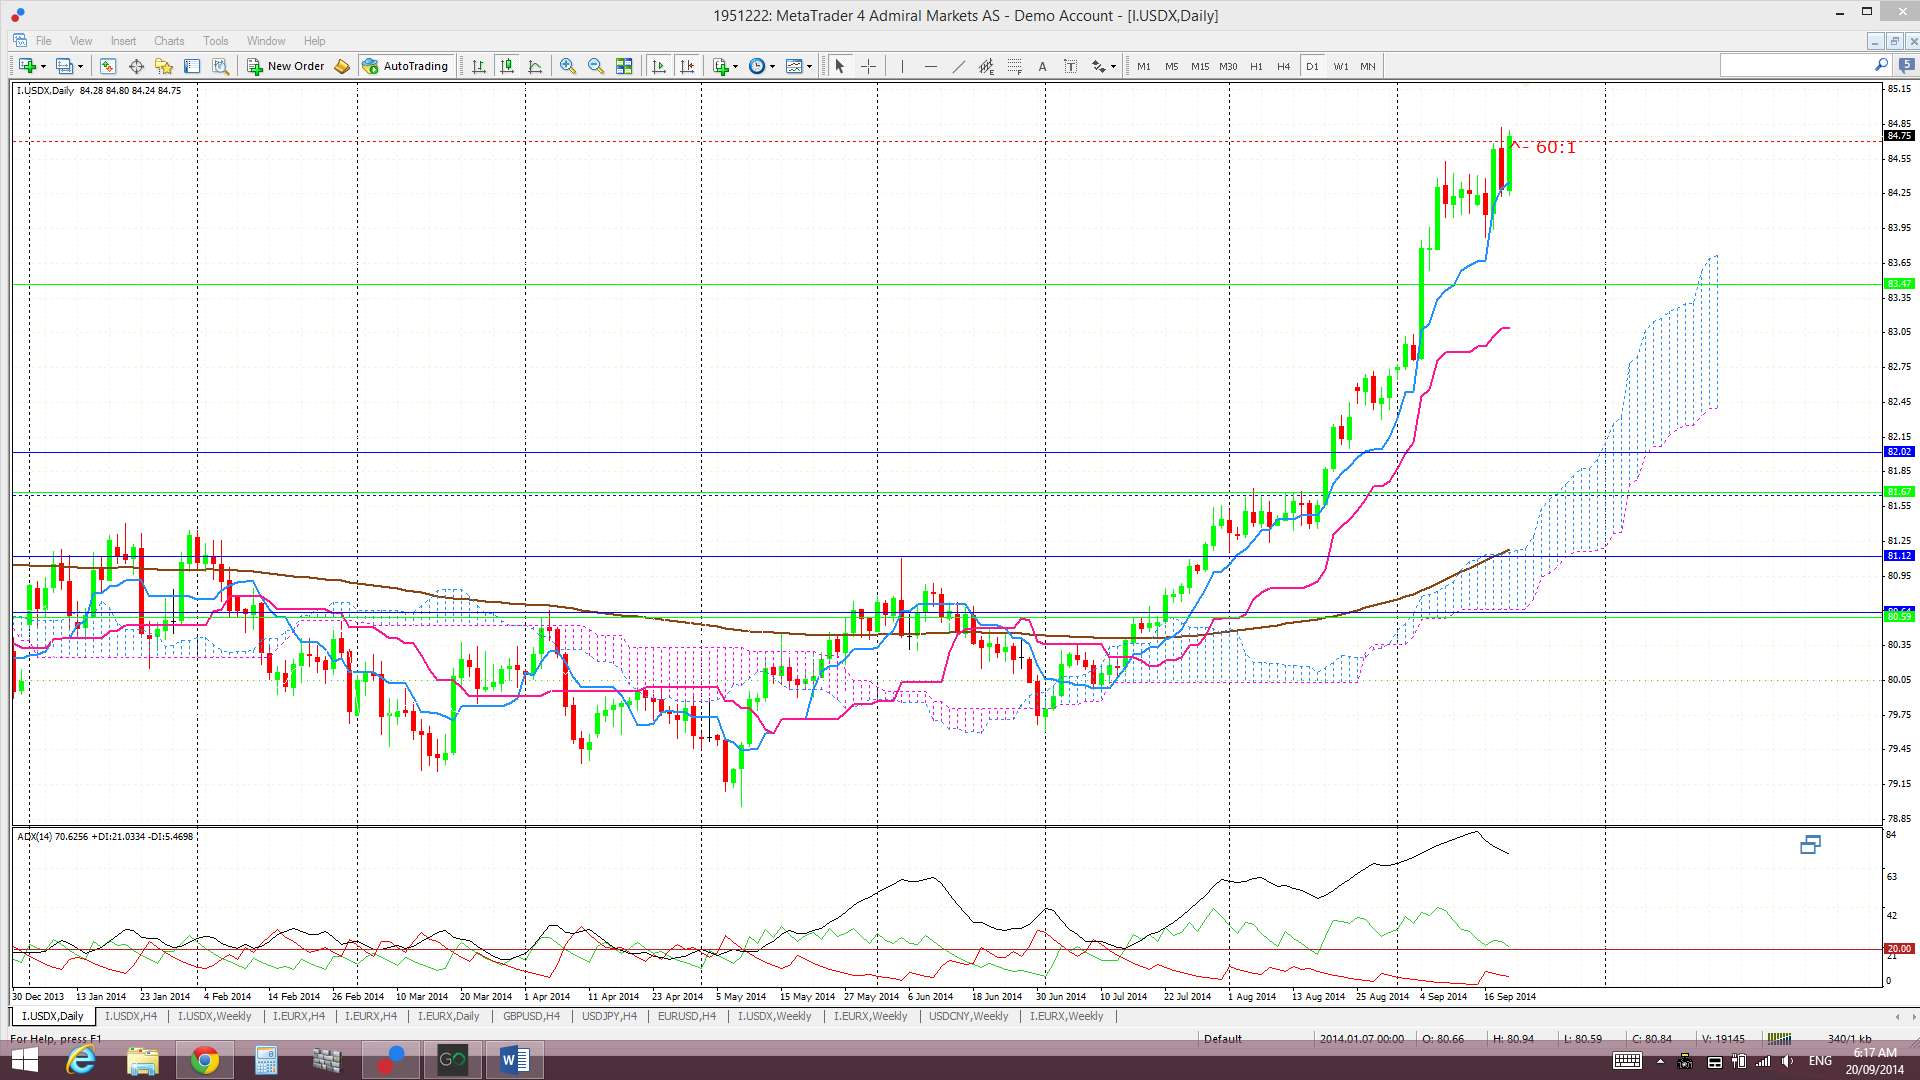
Daily: Price action chopped higher last week, with alternating bullish and bearish days, under the combined resistance of the 78.6% fib and the monthly chart’s bear triangle trend line. Note how a 61.8% fib pull back of this latest bull run would bring price back down to the 81.50 region though:
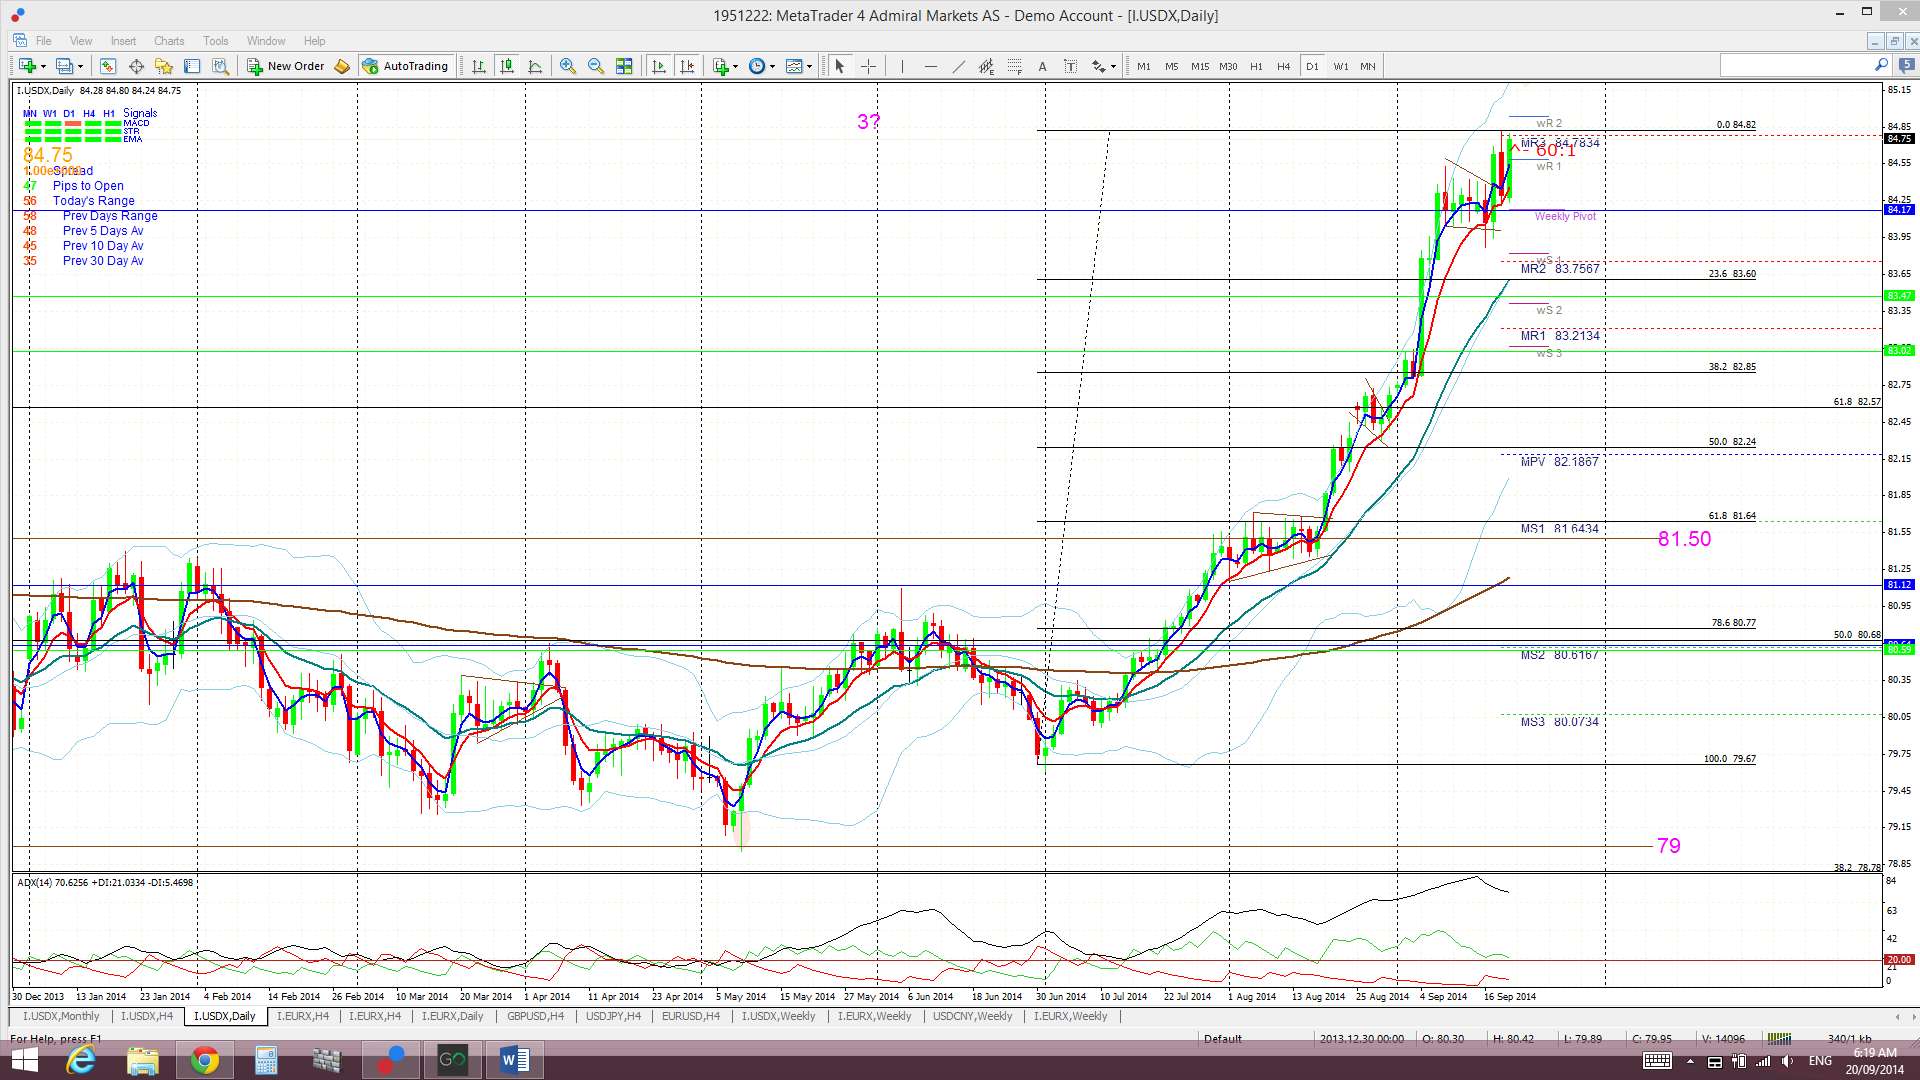
Daily Ichimoku Cloud chart: Price traded above the Cloud all week. Price is still well above the daily Cloud and some pull back here would not be out of order, even as part of a broader bullish continuation move.
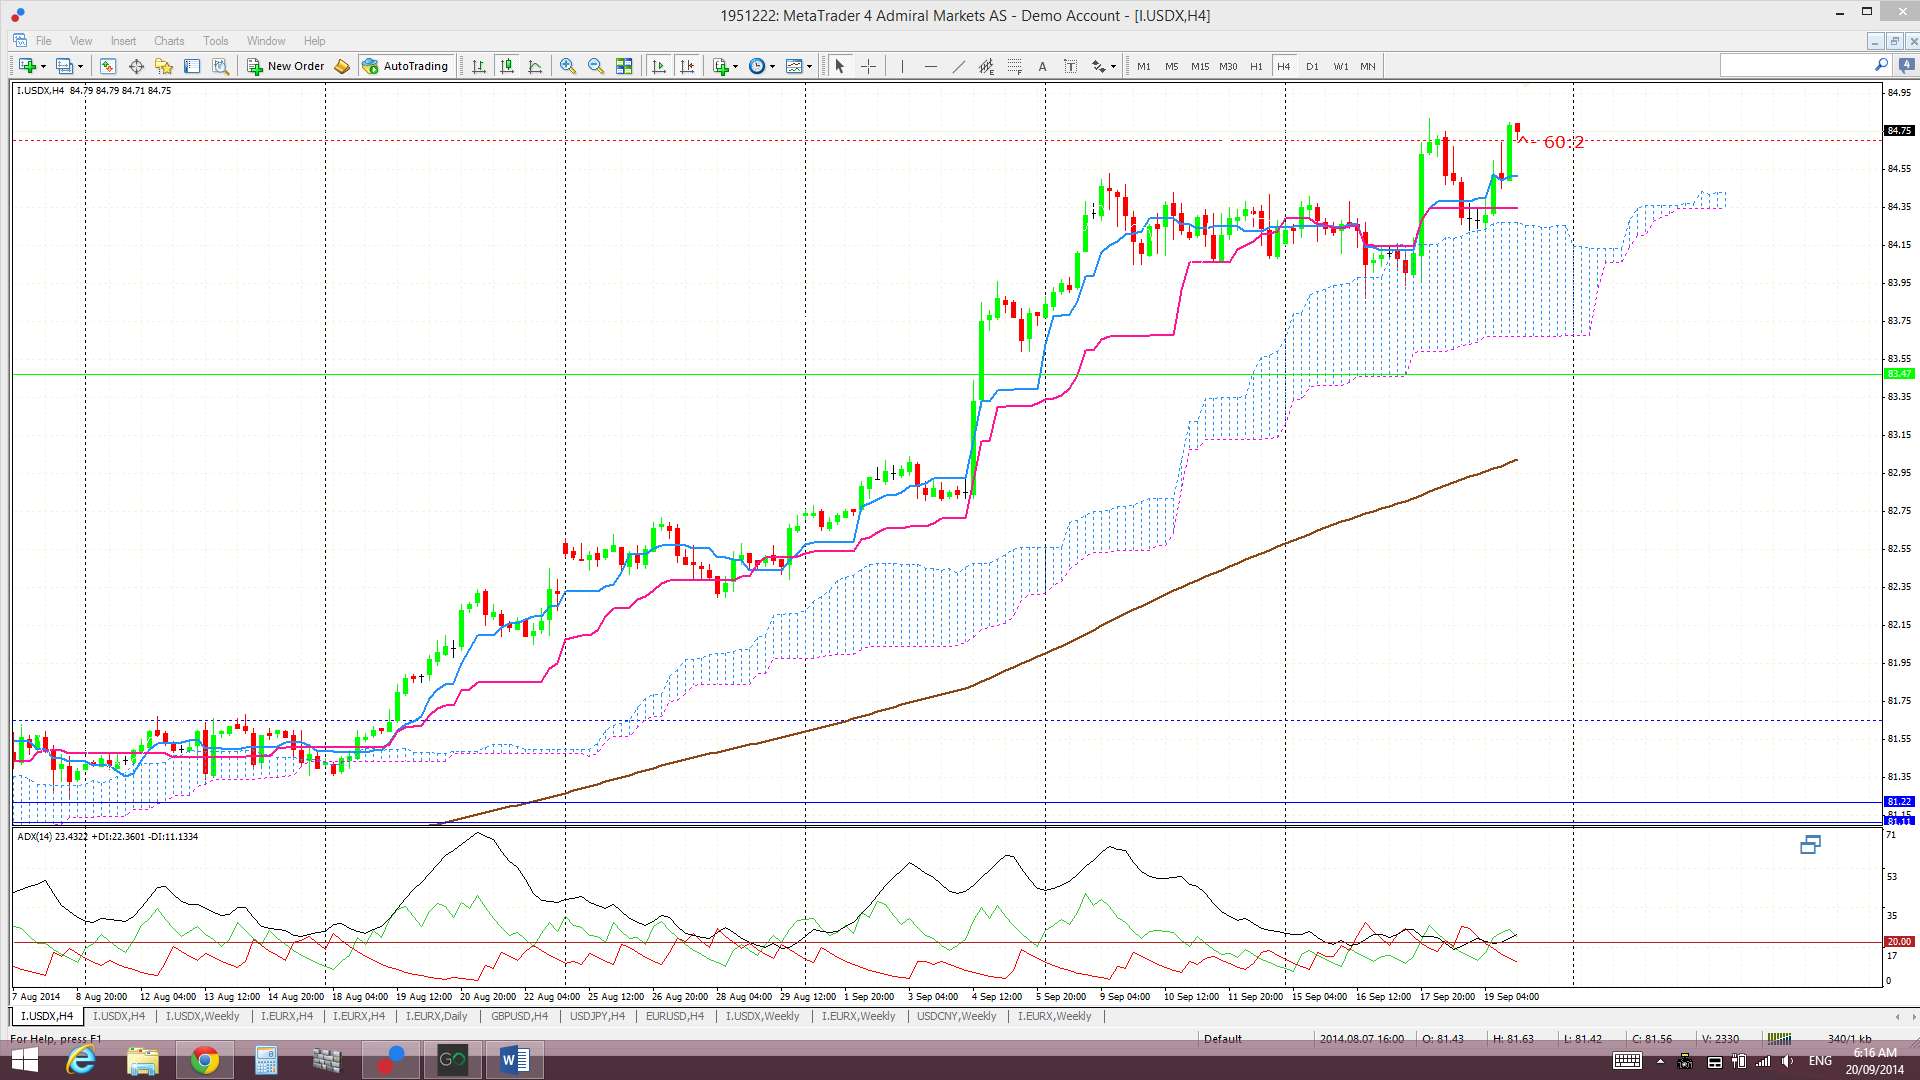
4hr: Price chopped higher last week after breaking out from the ‘Bull Flag’.

4hr Ichimoku Cloud chart: Price traded just above the Cloud for most of the week. This chart is still aligned with the daily chart and supports long USD trades.
EURX
Monthly: The September candle is now printing a bearish coloured candle with a long upper shadow but this chart has caught my eye this week though. I am seeing a possible bullish ‘inverse H&S’ pattern possibly starting to form up here. I say ‘possible’ as there is only the left ‘Shoulder’ and ‘Head’ at the moment so I would need to see a right ‘Shoulder’ form. This would require the EURX to fall further down to near the 103 level which is near the 23.6% fib of the 2008-2012 bear move. This 103 was a strong support region during 2009 and this gives the chart the left ‘Shoulder’ appearance:
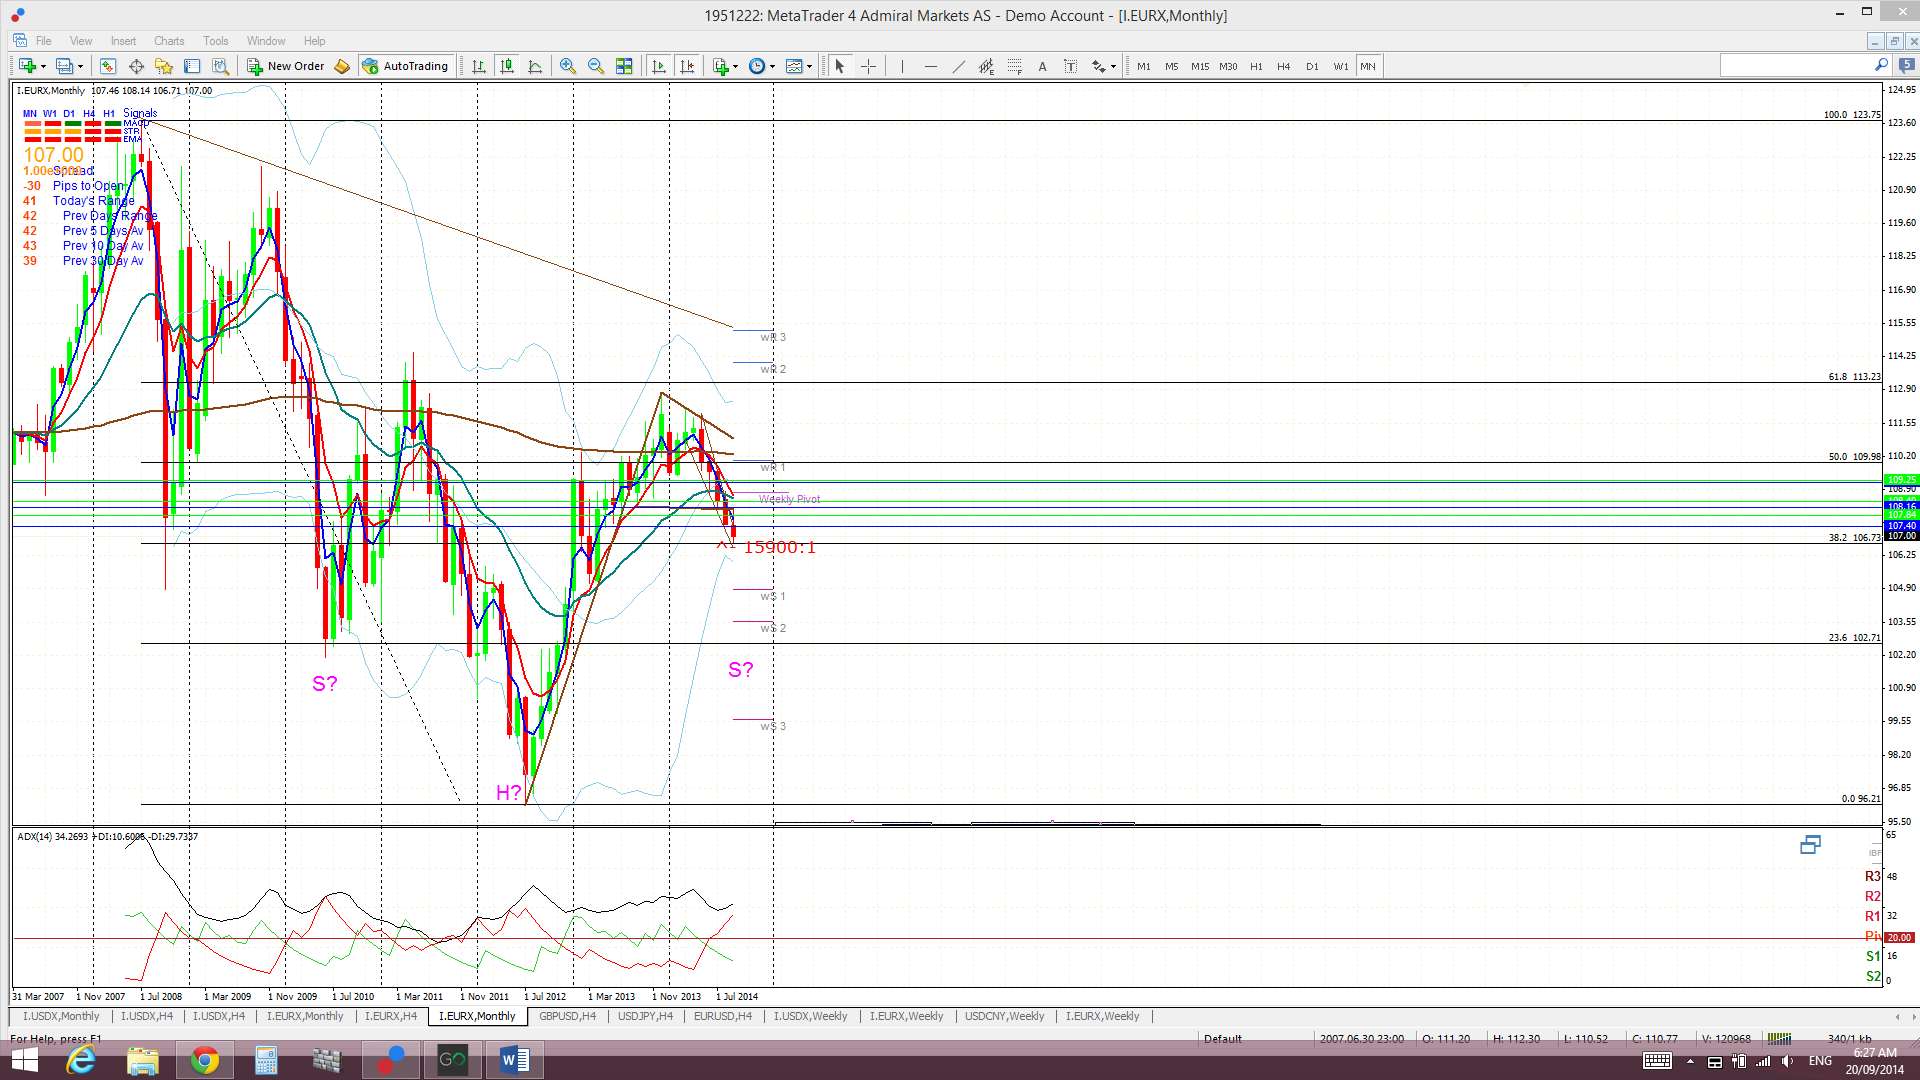
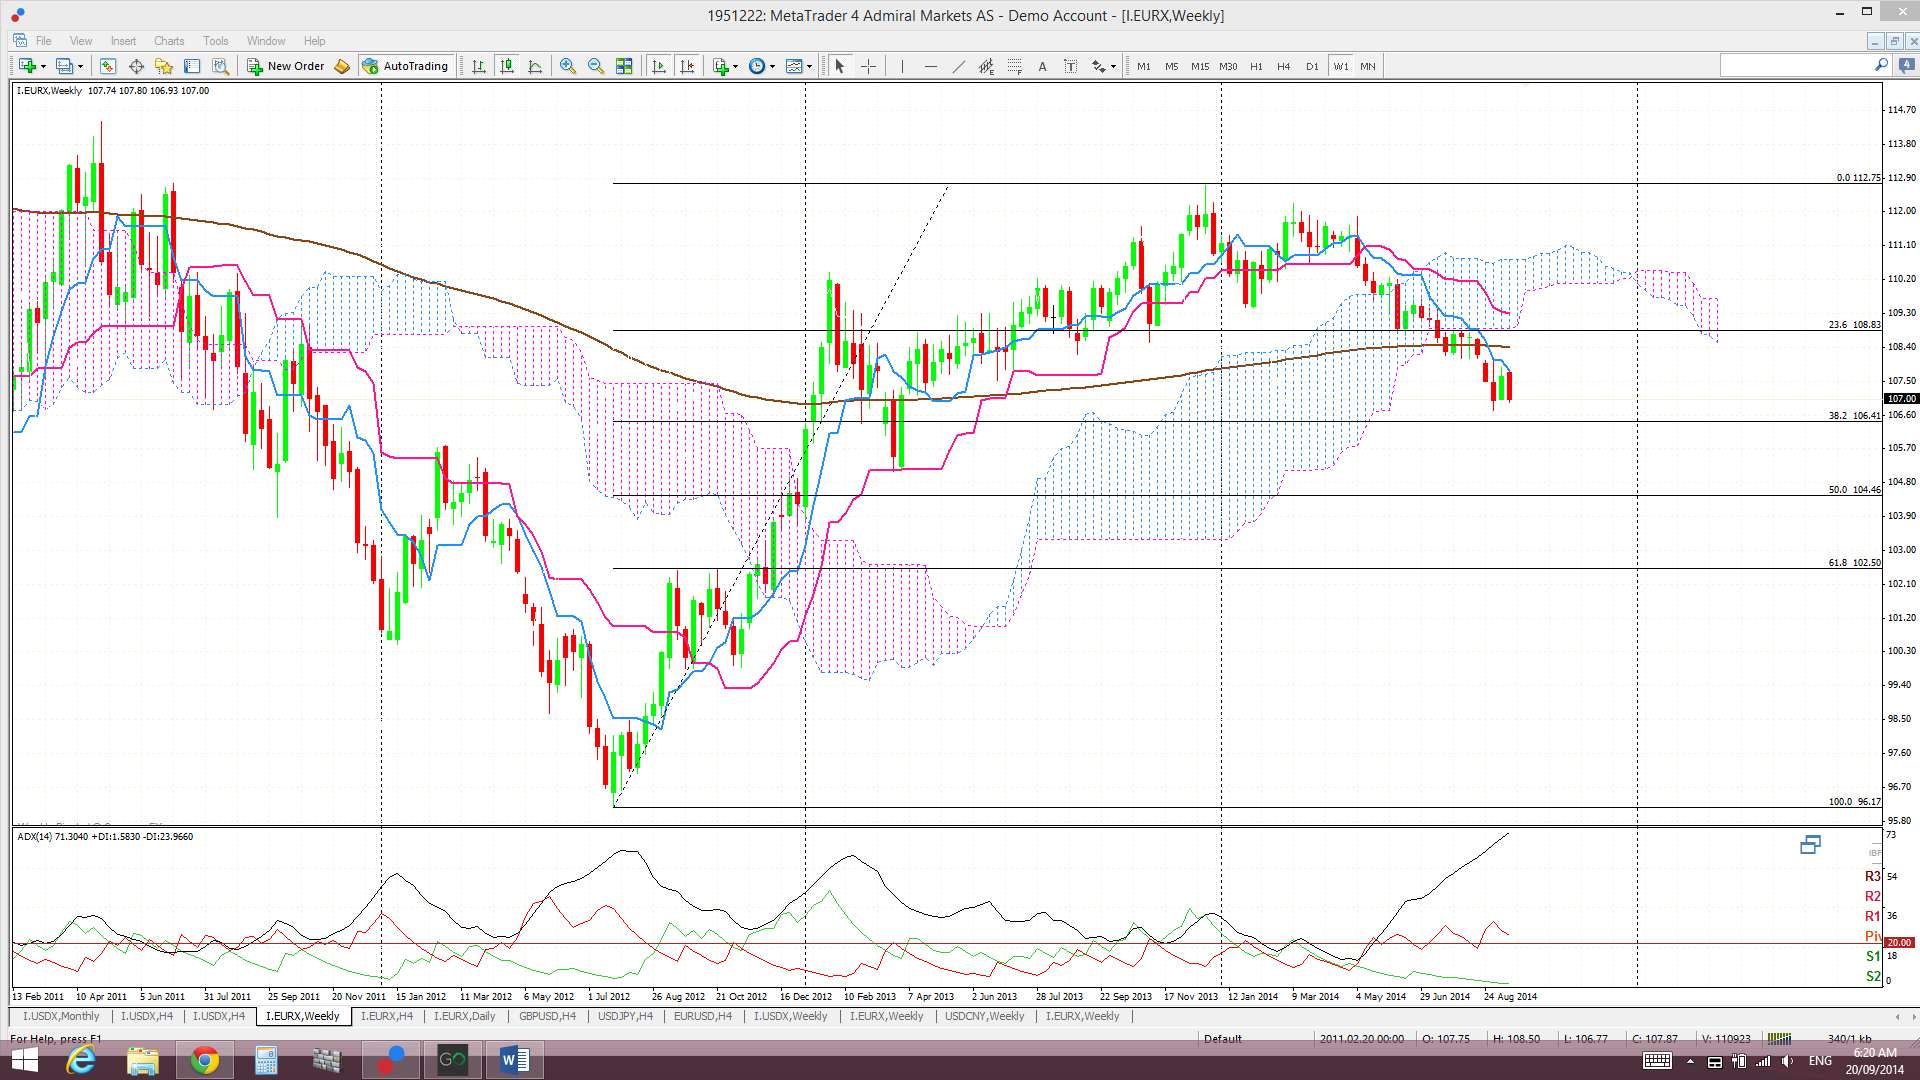
Monthly Ichimoku: The September candle is trading within the monthly Cloud. It is worth noting that the bottom of the monthly Cloud comes in near the 103 region. The bottom of any Ichimoku Cloud is a region that often offers support and this Cloud base might help support the EURX to form up the ‘Shoulder’ on the potential ‘inverse H&S pattern’. A case of confluence here!
Weekly: The weekly candle closed as a bearish engulfing candle and still below the support of the weekly 200 EMA, the 108.5 level and weekly chart support trend line. Putting fibs on the weekly chart for the 2012-2013 bull move presents an interesting feature. A 61.8% pull back, a popular fib target for pull backs, would bring the index down to the 103 region. This is exactly the same level that would help to form up the monthly chart’s inverse H&S pattern! I always like confluence and this is yet another example of this at work here!
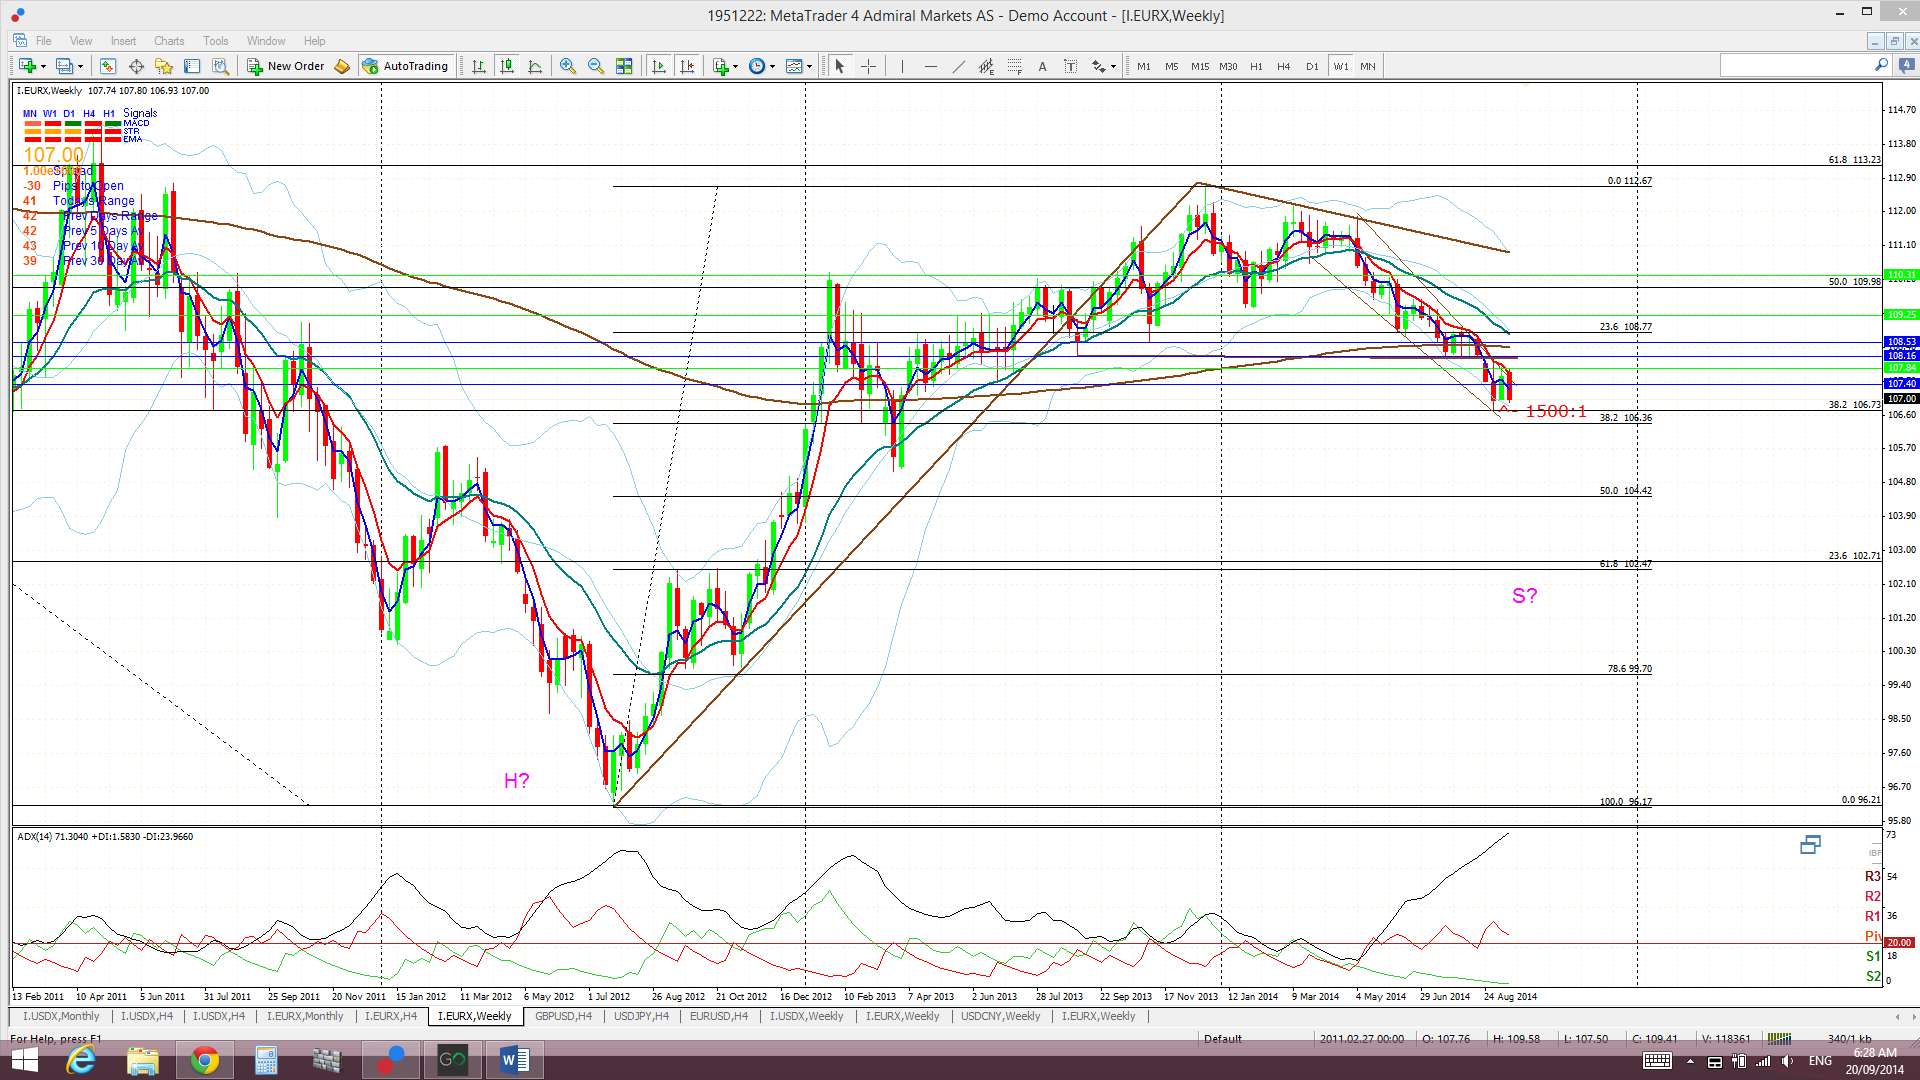
Weekly Ichimoku: Price is still trading below the weekly Cloud.
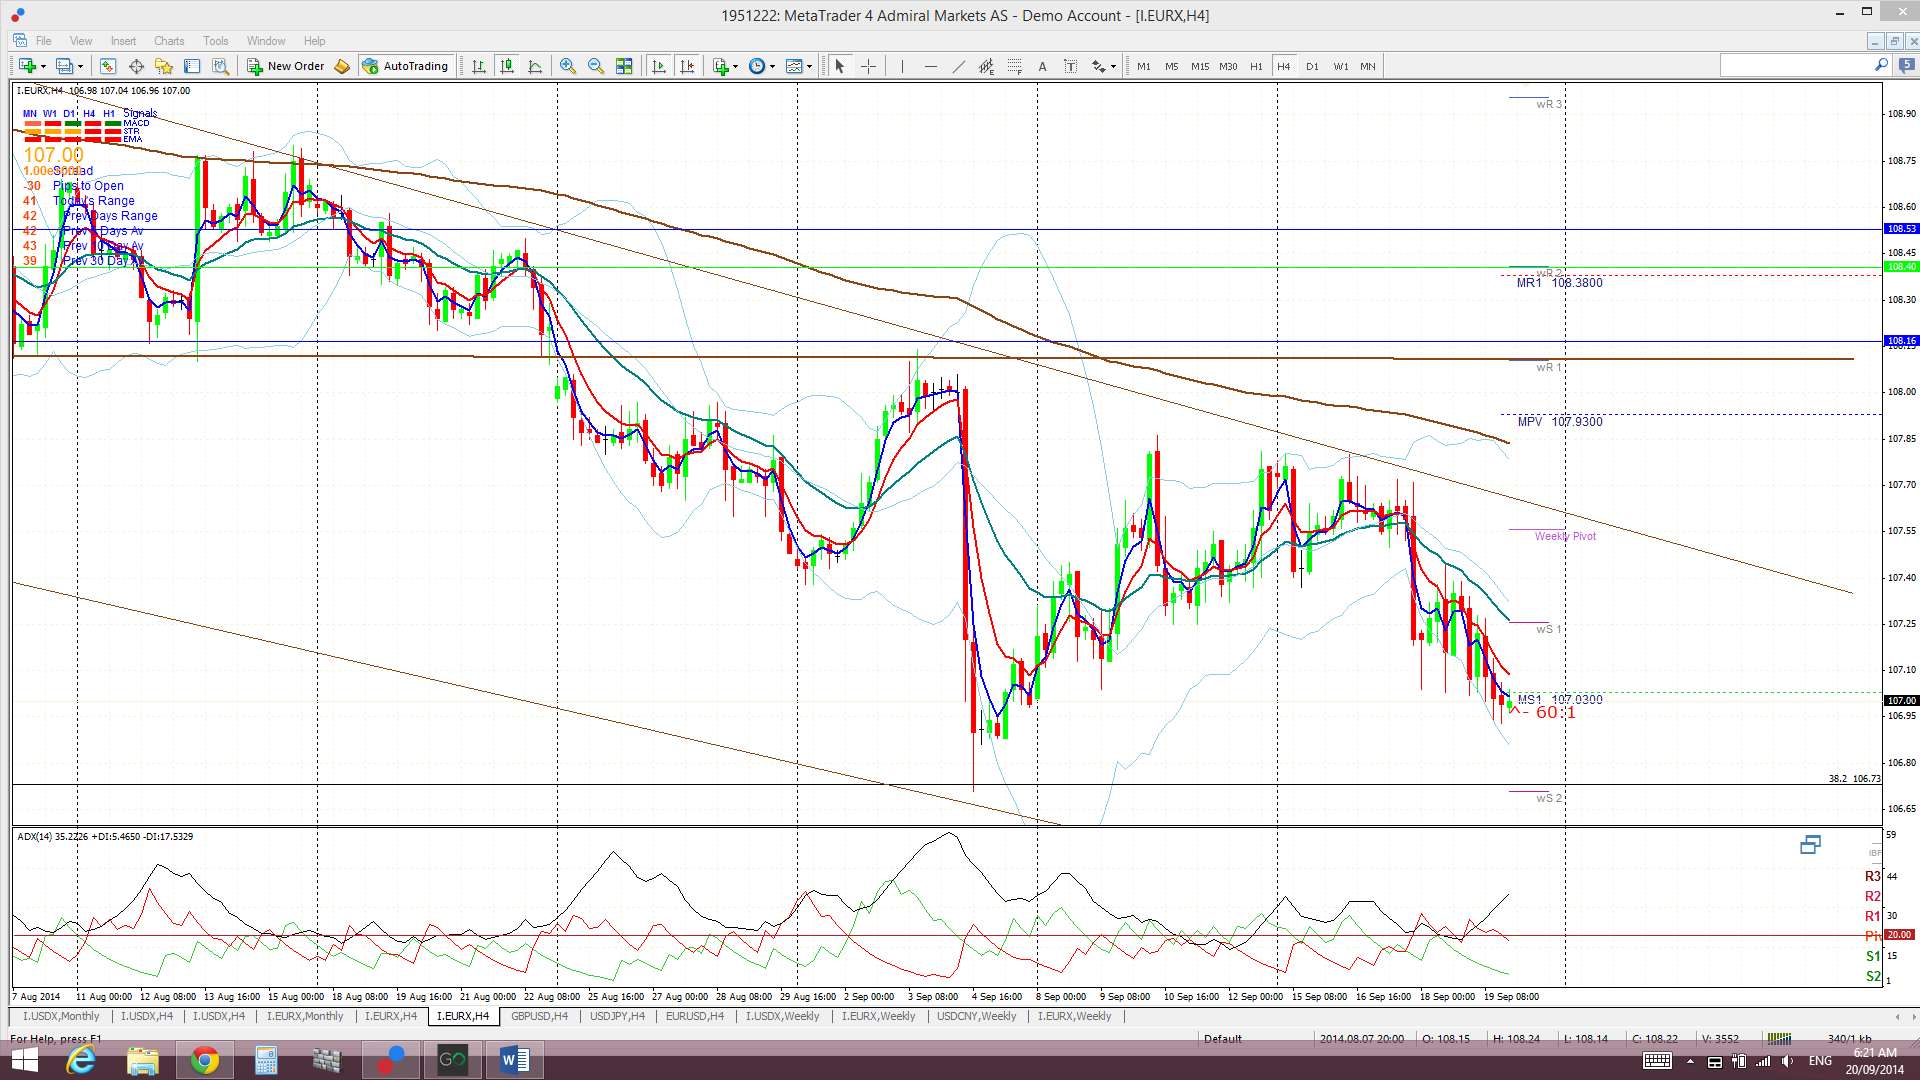
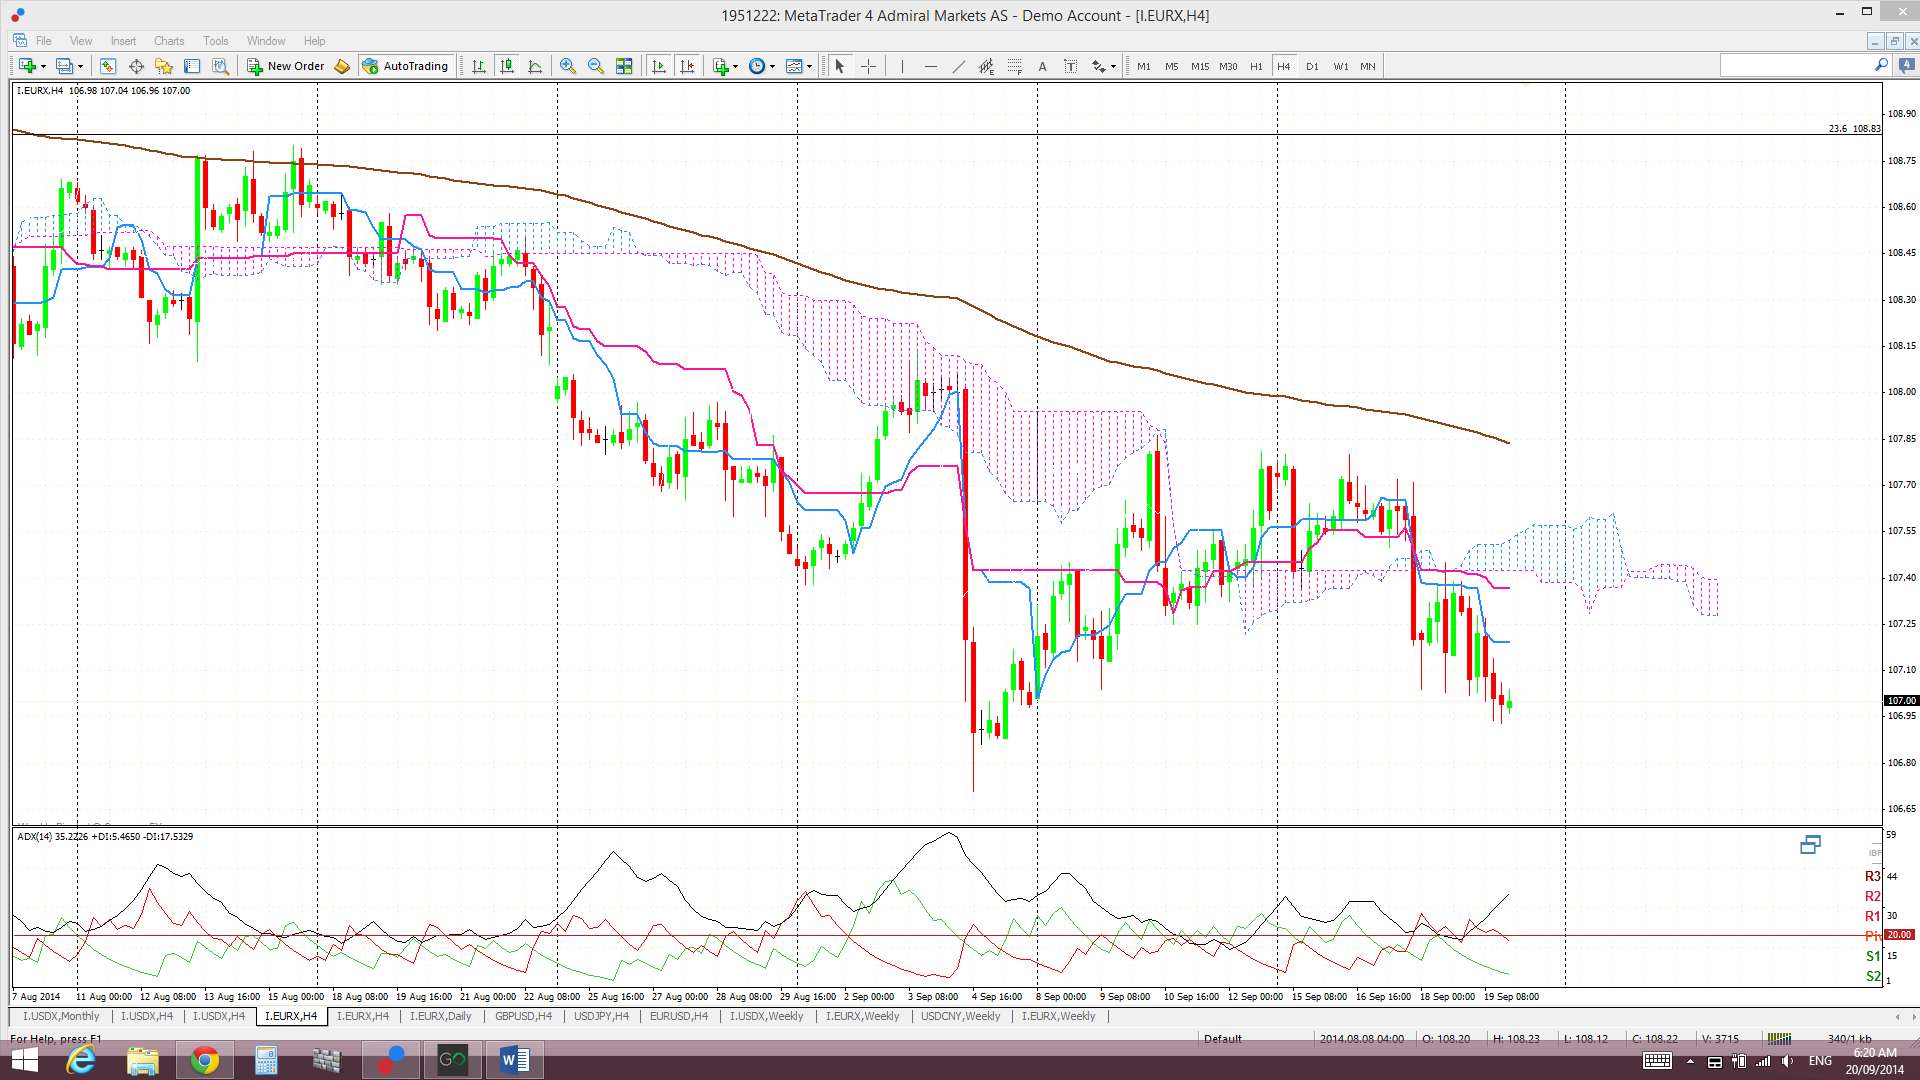
Daily: Price chopped lower last week with alternating bullish and bearish daily candles. The index is still trading within the descending channel/wedge pattern:
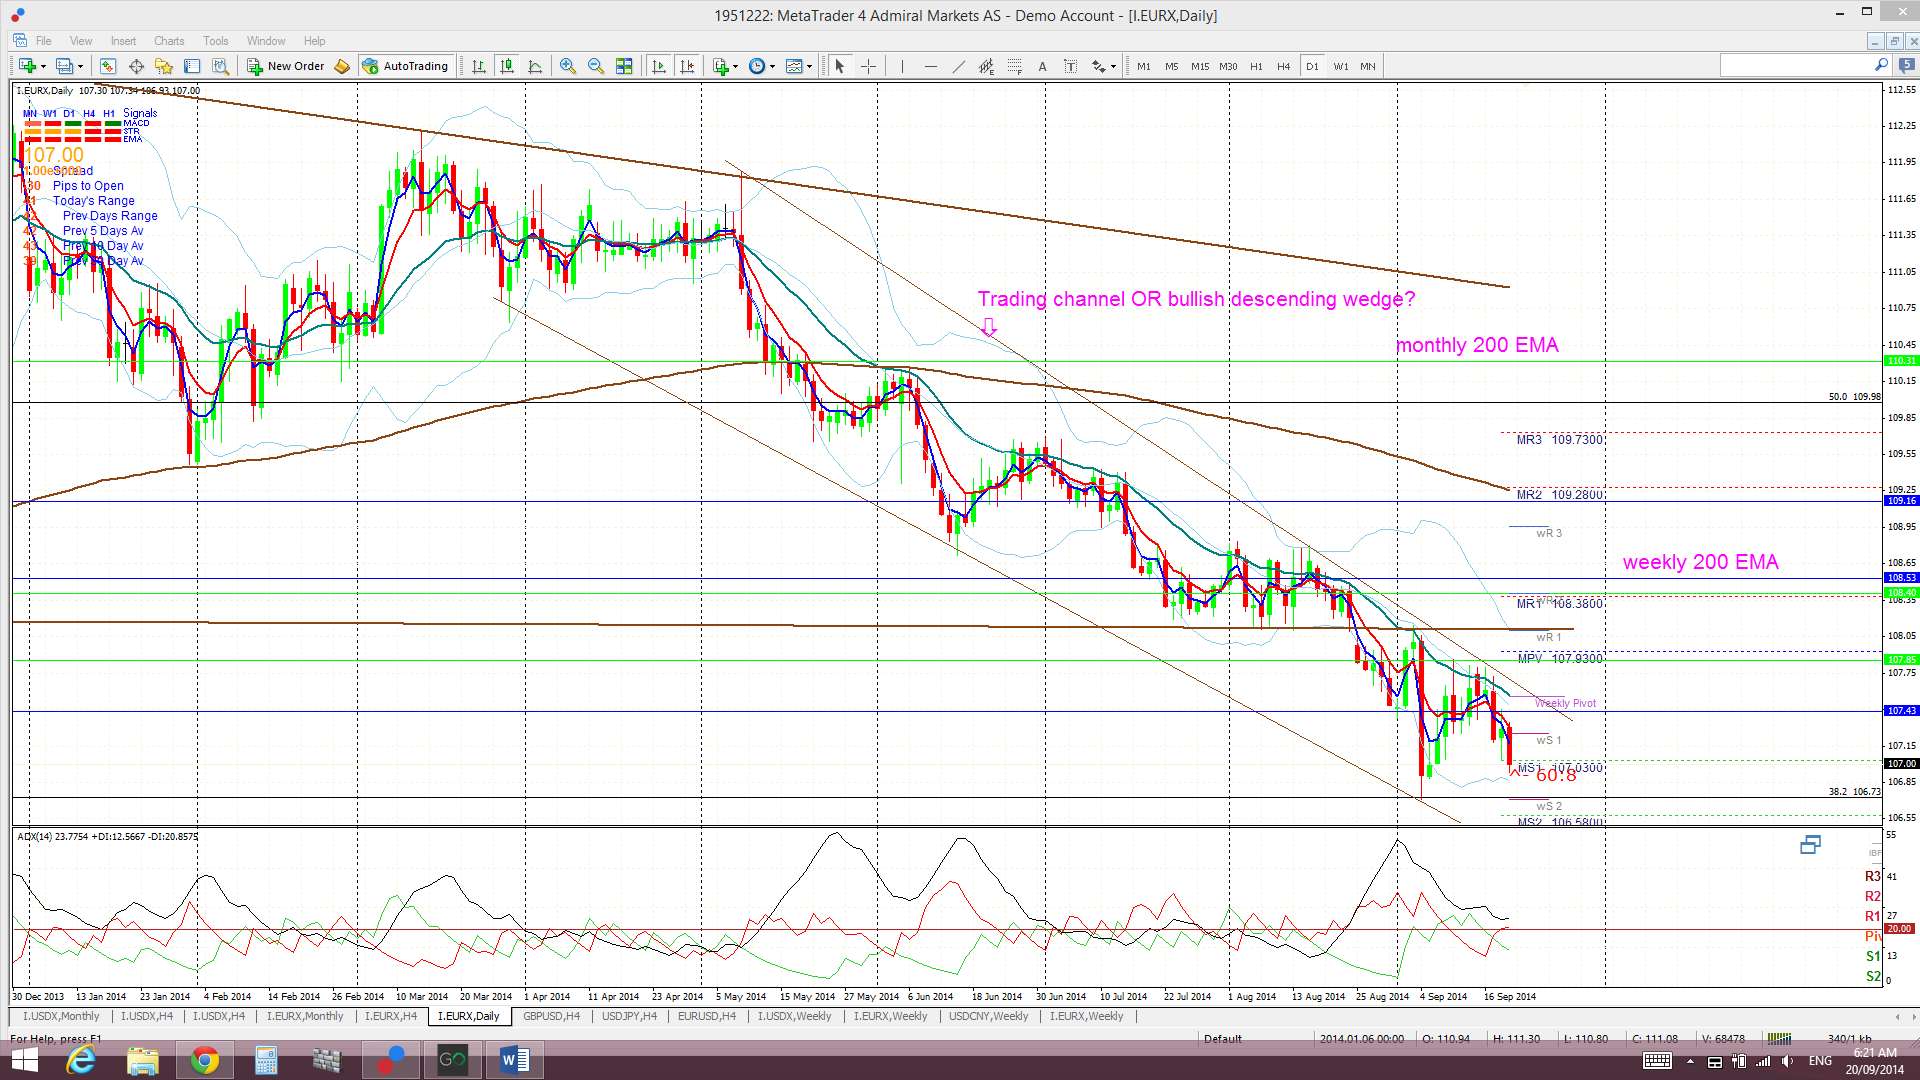
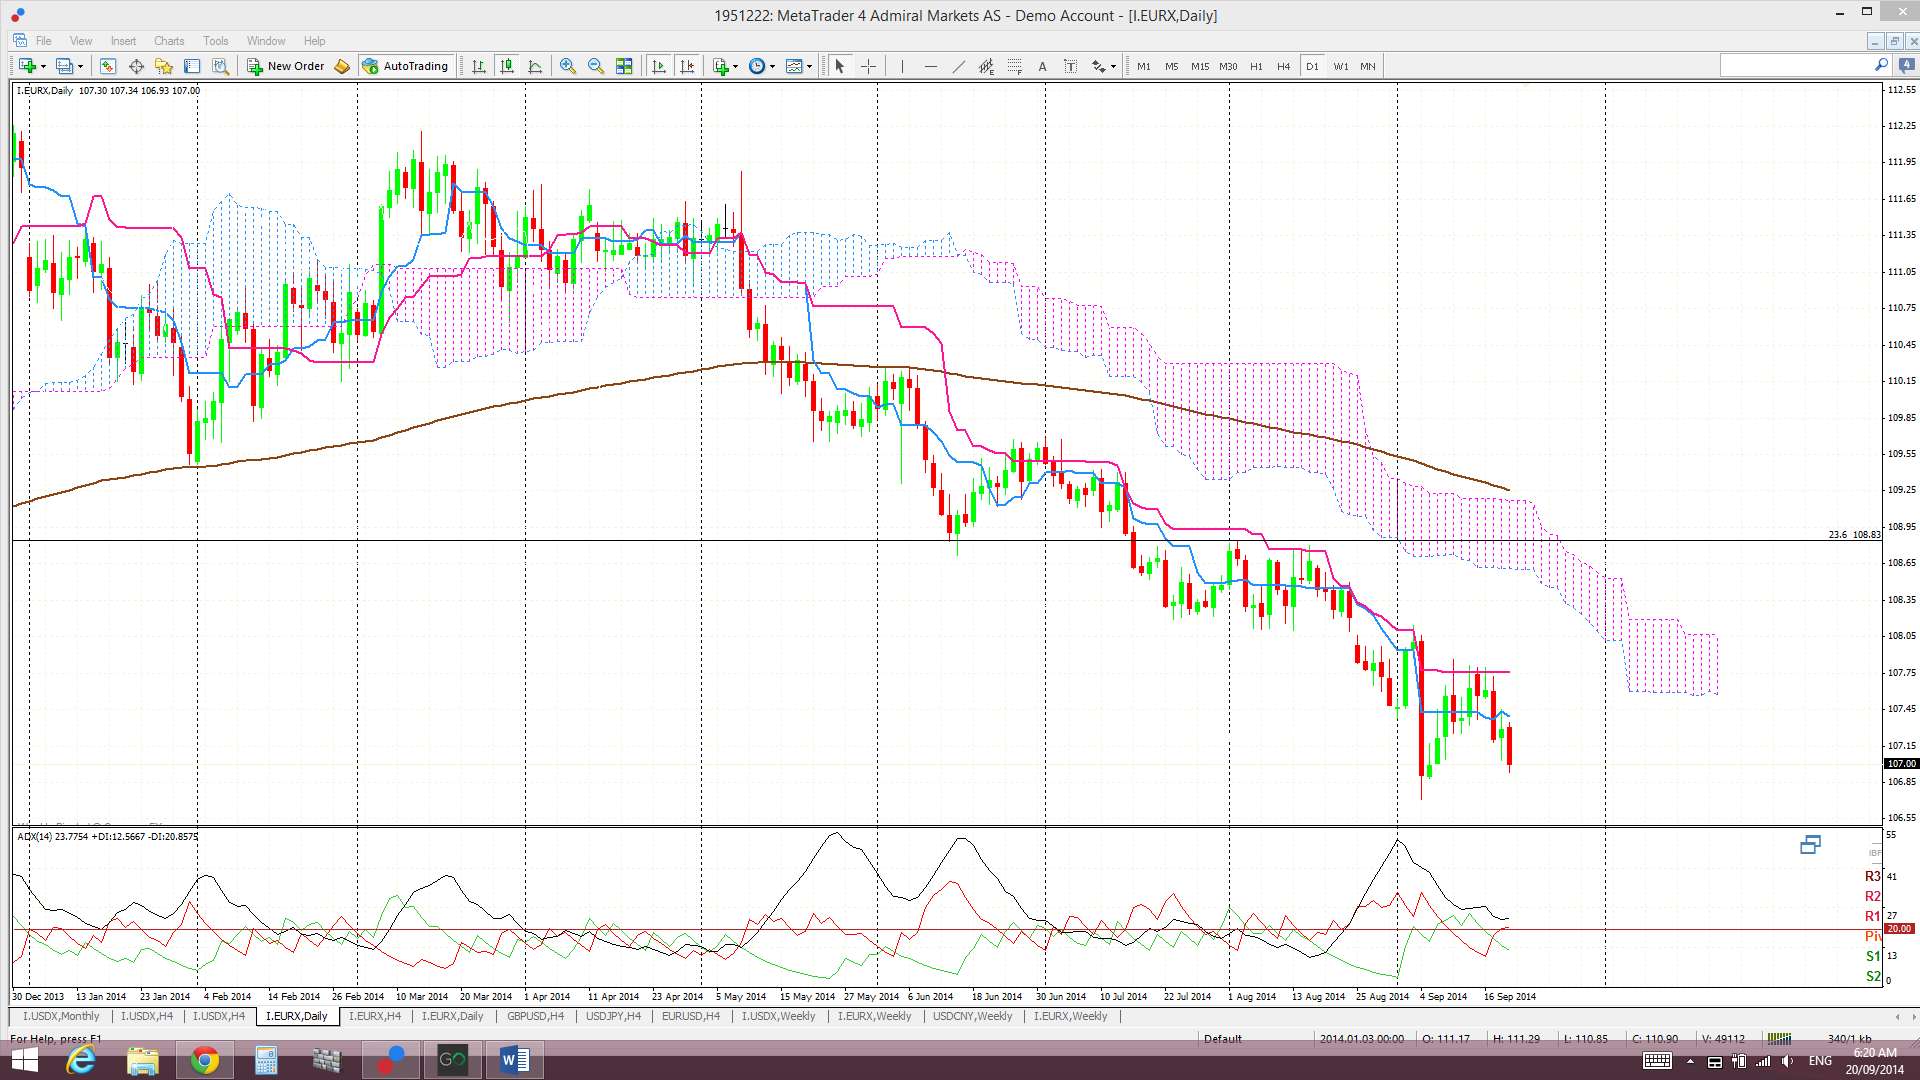
Daily Ichimoku Cloud chart: Price is still below the Cloud.
4 hr: Price chopped lower last week.
4 hr Ichimoku Cloud chart: The EURX drifted back below the Cloud last week. This chart is now aligned again with the daily chart and suggests short EUR.
Comments:
USDX: the USDX had another bullish week and continues to set more records. This is now the fifth week above 81.50, the fourth week above the 82.50 level (61.8% fib of the last major swing move being the 2010-2011 bear move) and the third week above the monthly 200 EMA. Last week also marks the highest weekly USDX close in over 4 years; since June 2010.
The monthly chart shows that the next main resistance ahead of the USDX is still up at the 85.50 area. This is the region of the 78.6% fib and the monthly chart’s triangle trend line and is proving to be considerable resistance as it has been on two prior occasions, back in 2012 and 2013, and this is giving the USDX chart a bearish ‘Triple Top’ appearance. I note there is also a weekly pivot resistance there as well. I still would not be surprised to see this index dip back down to test the 81.50 level again though, even if there is to be eventual bullish continuation. This was a major resistance level for the index and major levels often tend to be tested before any continuation so traders need to be wary of this possibility. This 81.50 level is still down near the 61.8 % fib of the recent bull move and adds weight to this region being a possible pull back target.
EURX: the EURX closed lower for the week and with a bearish engulfing candle. The index is still below the weekly Cloud, the 108.5 level, the weekly 200 EMA and the weekly support trend line. The main issue remains that divergence between the Eurozone and US economies continues to widen and, so, one would have to expect that this will continue to put pressure on the EURX.Â
I am on the lookout for a possible continued pull back down to the 103 region as this is:
- the 61.8% fib pull back of the latest bull move (2012-2013),
- the bottom of the monthly Ichimoku Cloud and
- it would also tie in with a possible ‘inverse H&S’ forming up on the monthly chart.
NB: I am away on holidays next weekend to watch our AFL team, the Swans, play in Melbourne’s AFL Grand Final. Updates will be brief and few from Friday-Monday.
Note: The analysis provided above is based purely on technical analysis of the current chart set ups. As always, Fundamental-style events, by way of any Ukraine, Euro zone or Middle East events and/or news announcements, continue to be unpredictable triggers for price movement on the indices. These events will always have the potential to undermine any technical analysis.
The post USDX higher BUT still under resistance: FX Indices Review 22/09/14 appeared first on www.forextell.com.