The FX pairs I monitor are mostly consolidating but Bitcoin has just broken through trend line support on increased Volume. IMHO, any hold above 8,000 for Bitcoin would be a very bullish signal. Watching for momentum-based trend line breakouts remains the way to go!
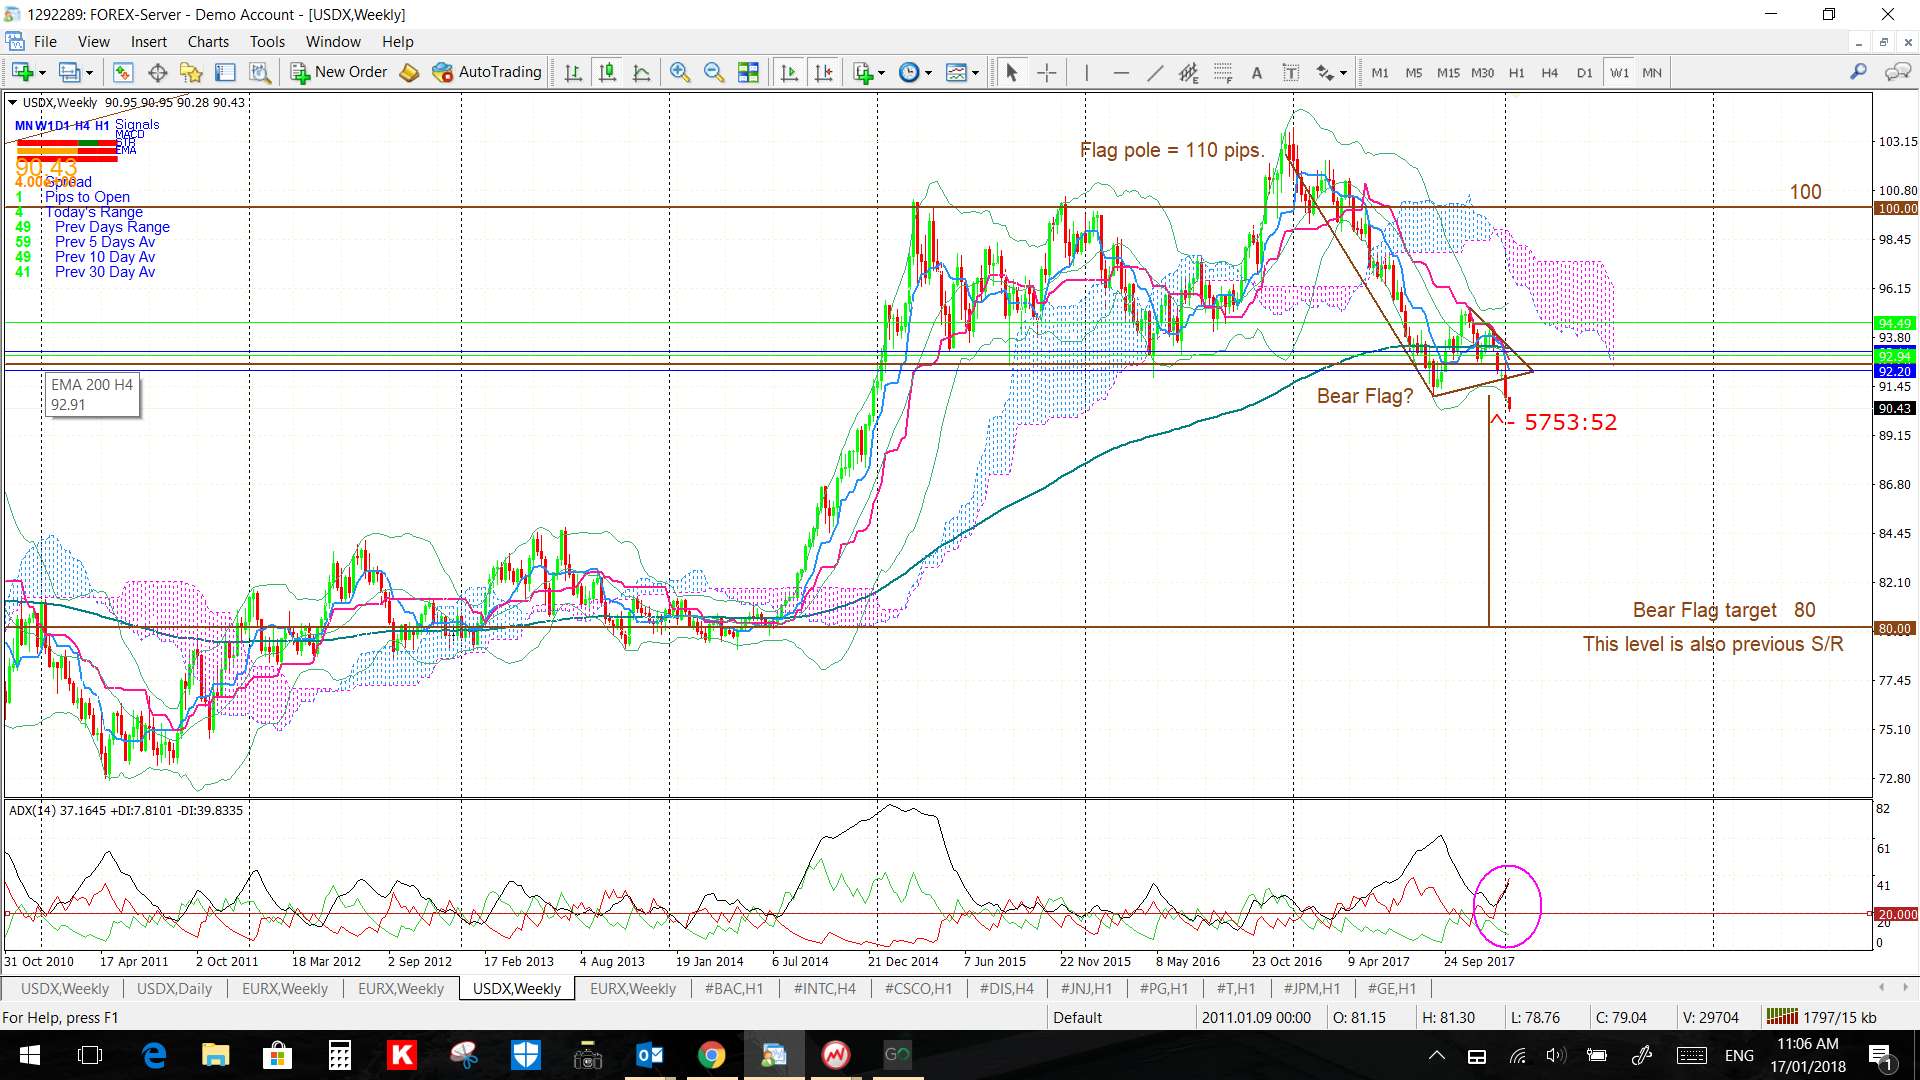
USDX weekly: still lower to start the week:
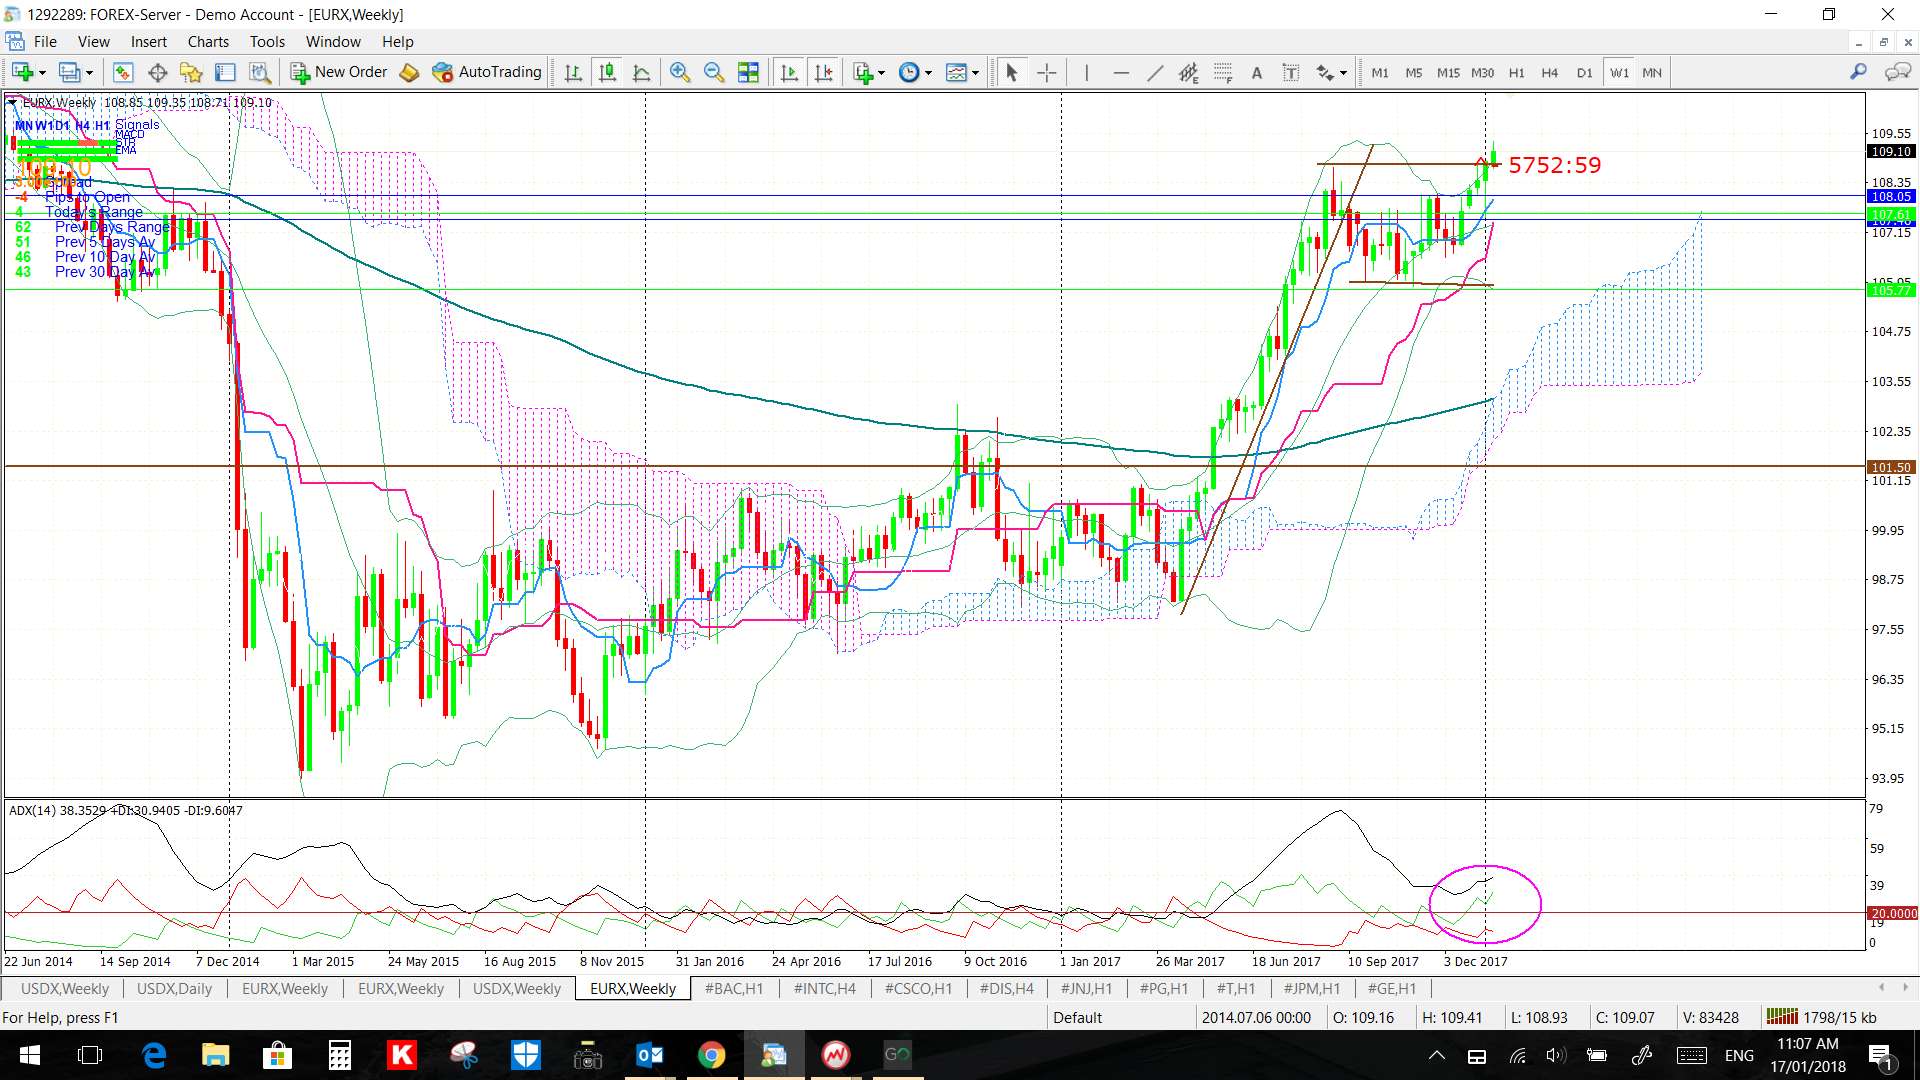
EURX weekly: watch to see if this Bull Flag gets going:
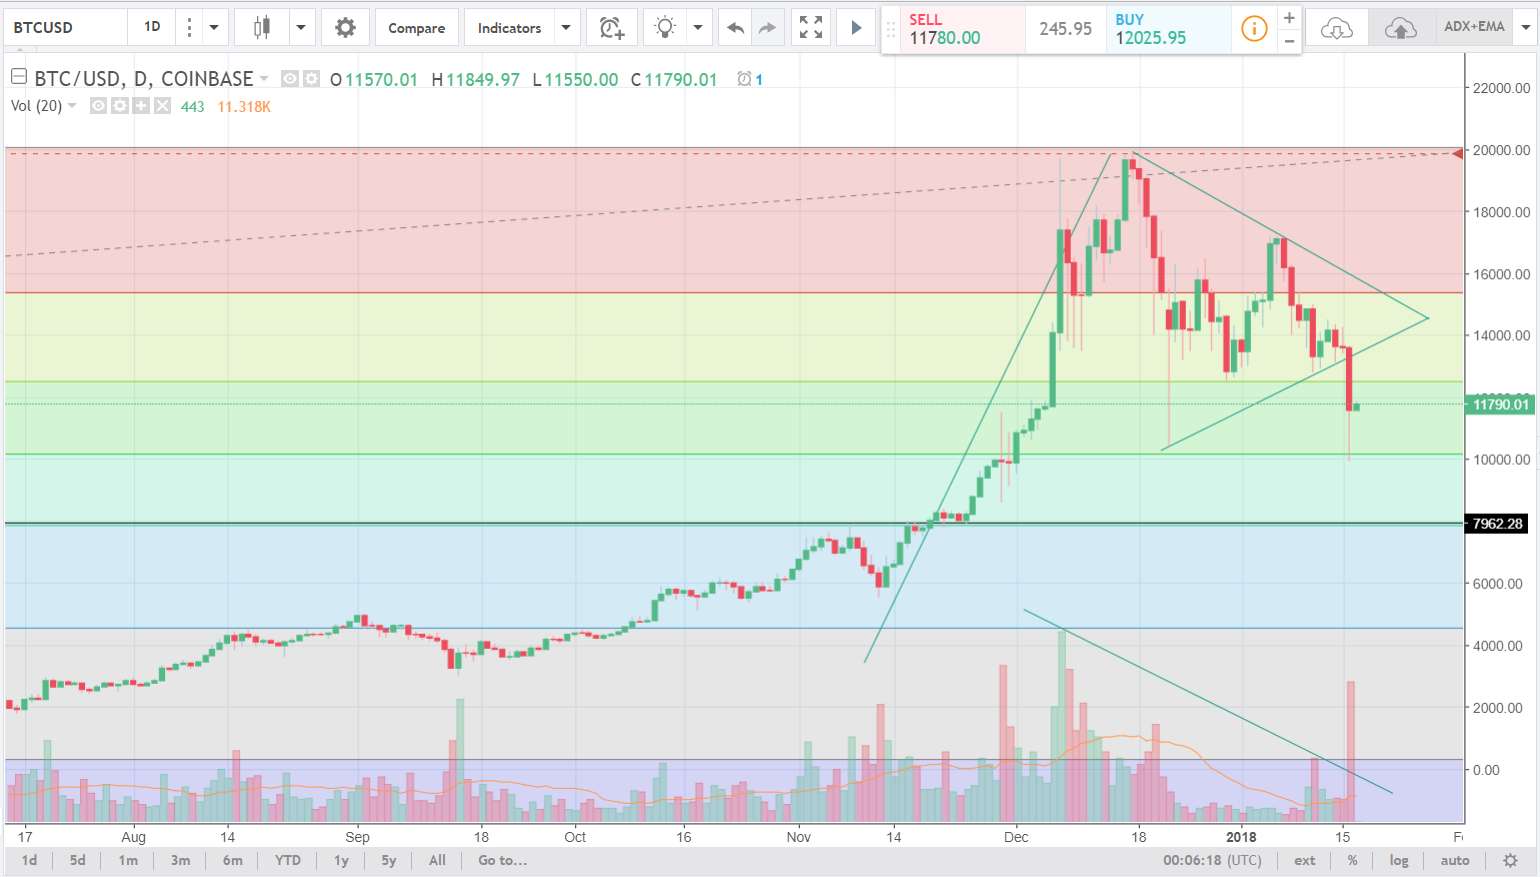
Bitcoin: BTC/USD: this has now broken down below trend line support on increased Volume. I’m watching for any test of the weekly 61.8% fib near 8,000:
BTC/USD daily: before and after breakdown shots:
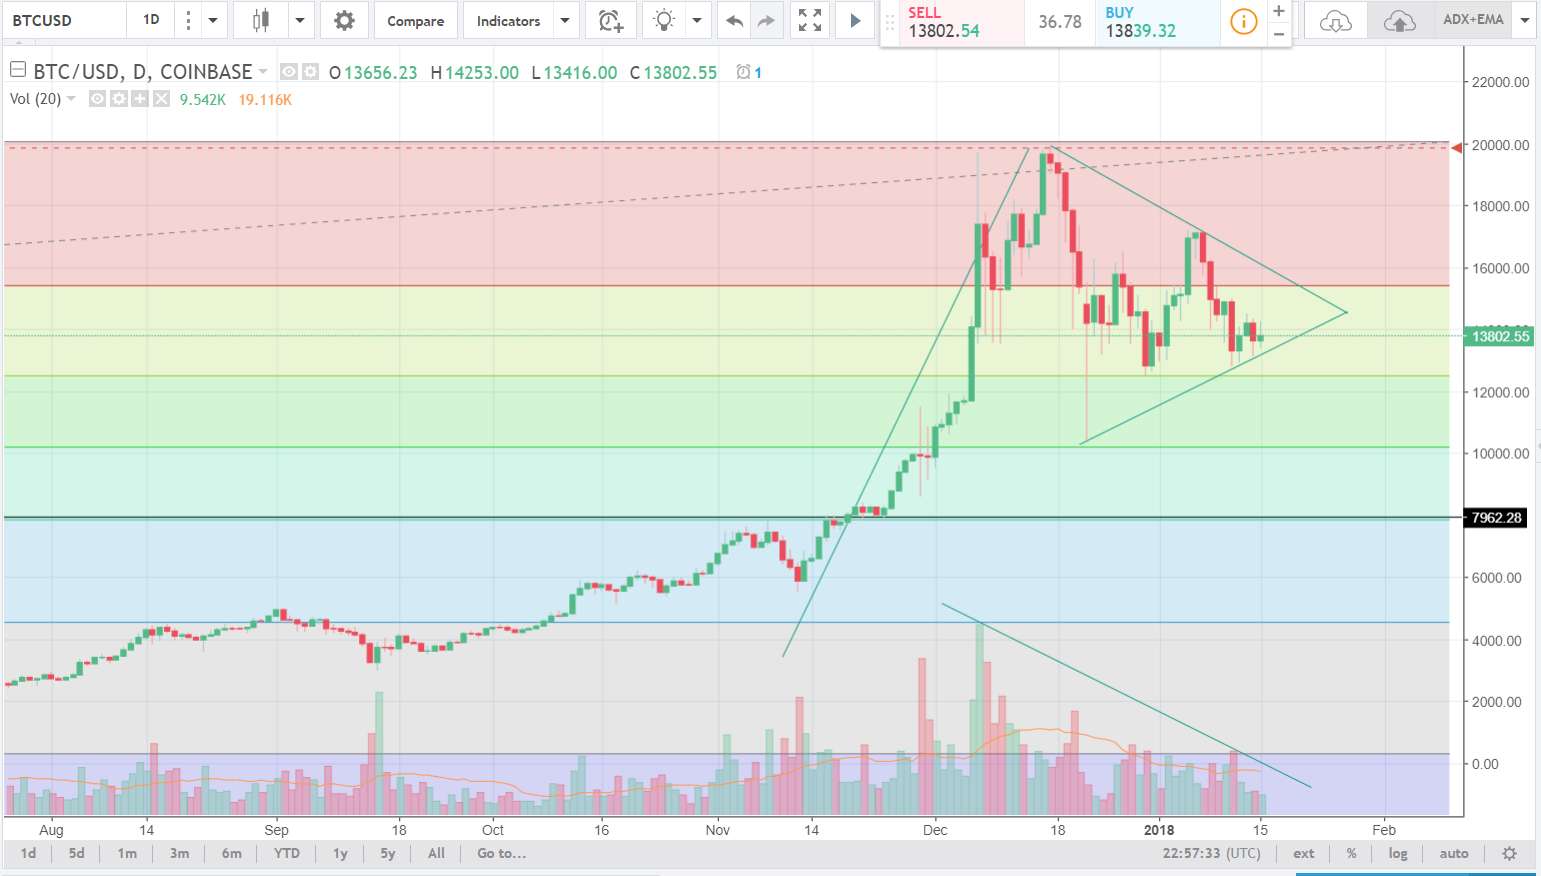
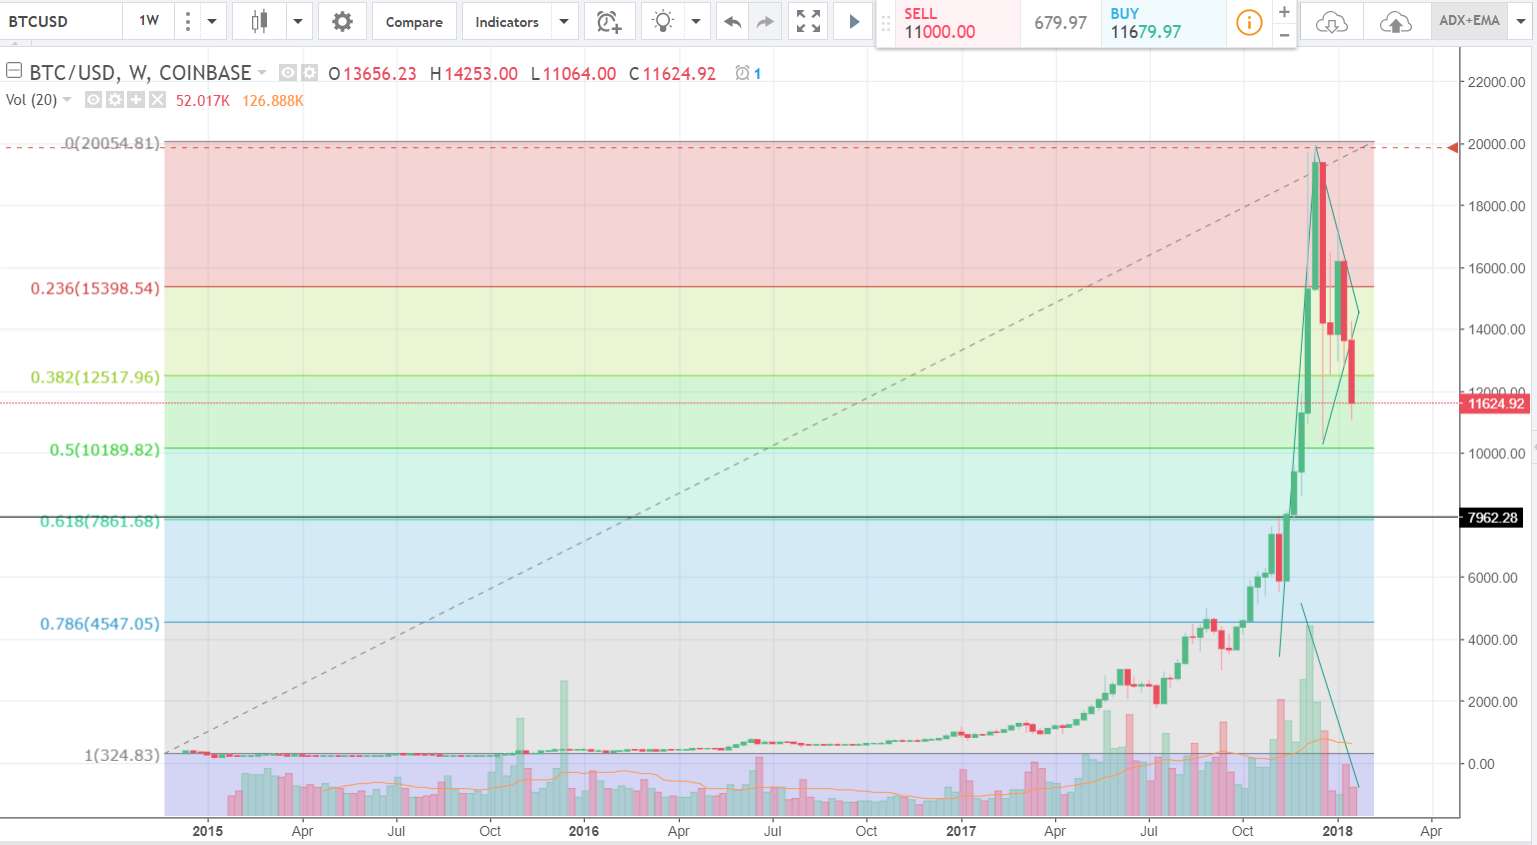
BTC/USD weekly: IMHO any test and hold of 8,000 would be a classic bull signal and the next move would form up part of a Wave 3 pattern within Elliott Wave parlance. These are generally strong thrust moves so this is worth watching for, especially if US$ weaknesses develops!
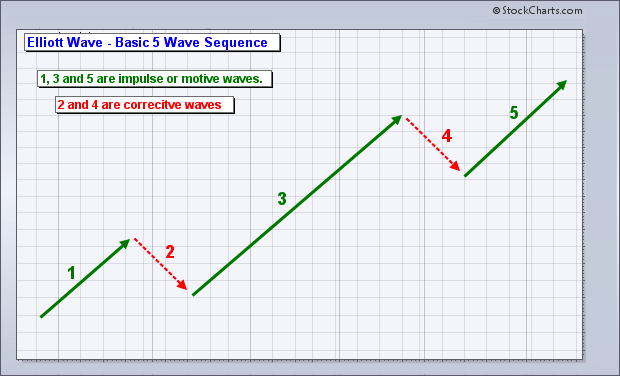
Elliott Wave patterns: the important feature to note here is the size of the Wave 3 pattern. This is what I will be looking for if the 8,000 level is tested and holds on BTC/USD:
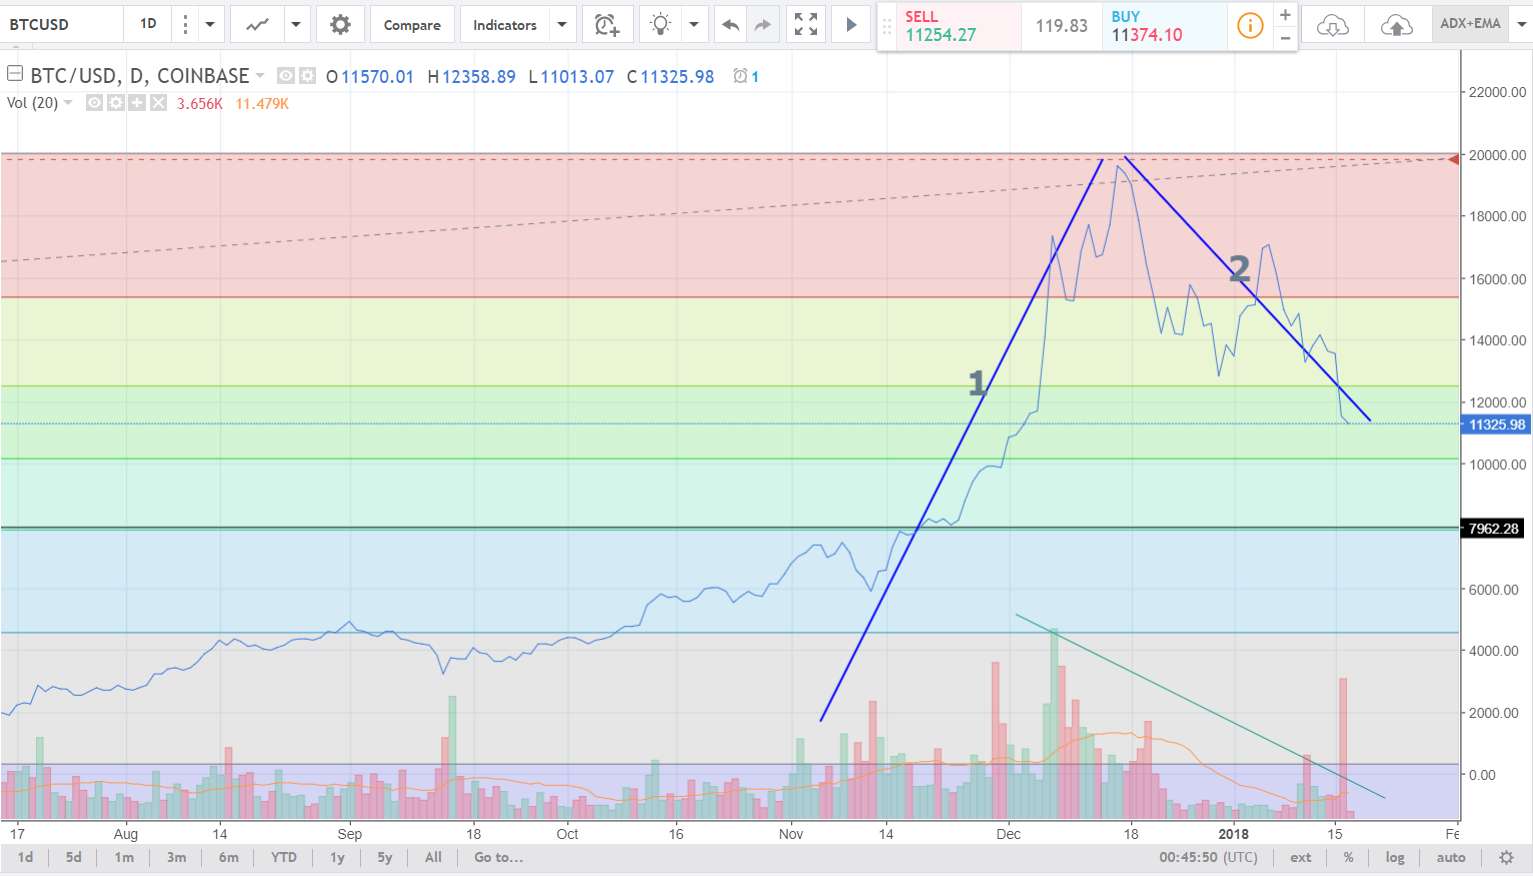
BTC/USD Elliott Wave pattern: are we seeing the Wave 1 and Wave 2 form up here at the moment on BTC/USD ? If so, better hold on to your hat and get ready for the possibility of a massive Wave 3!
Other Forex: for all of the following charts watch out for momentum-based trend line breakouts:
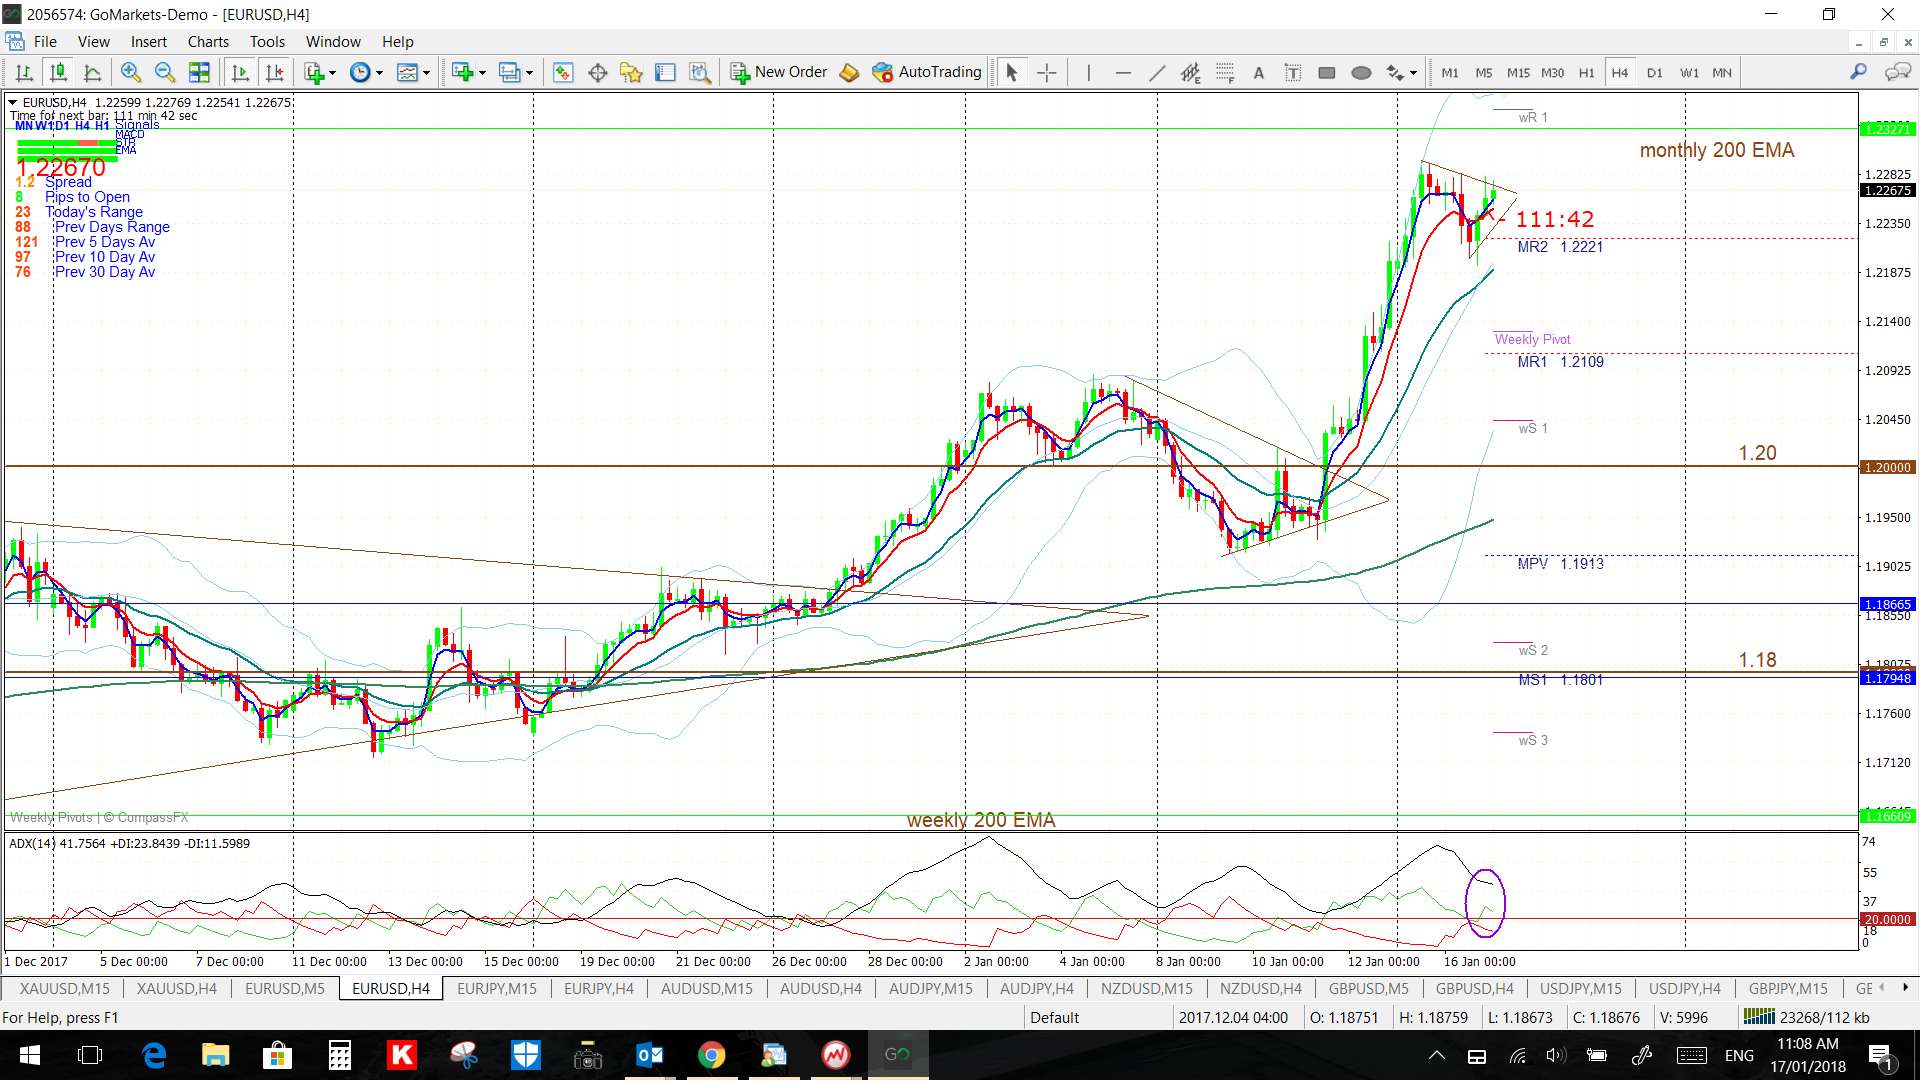
EUR/USD 4hr:
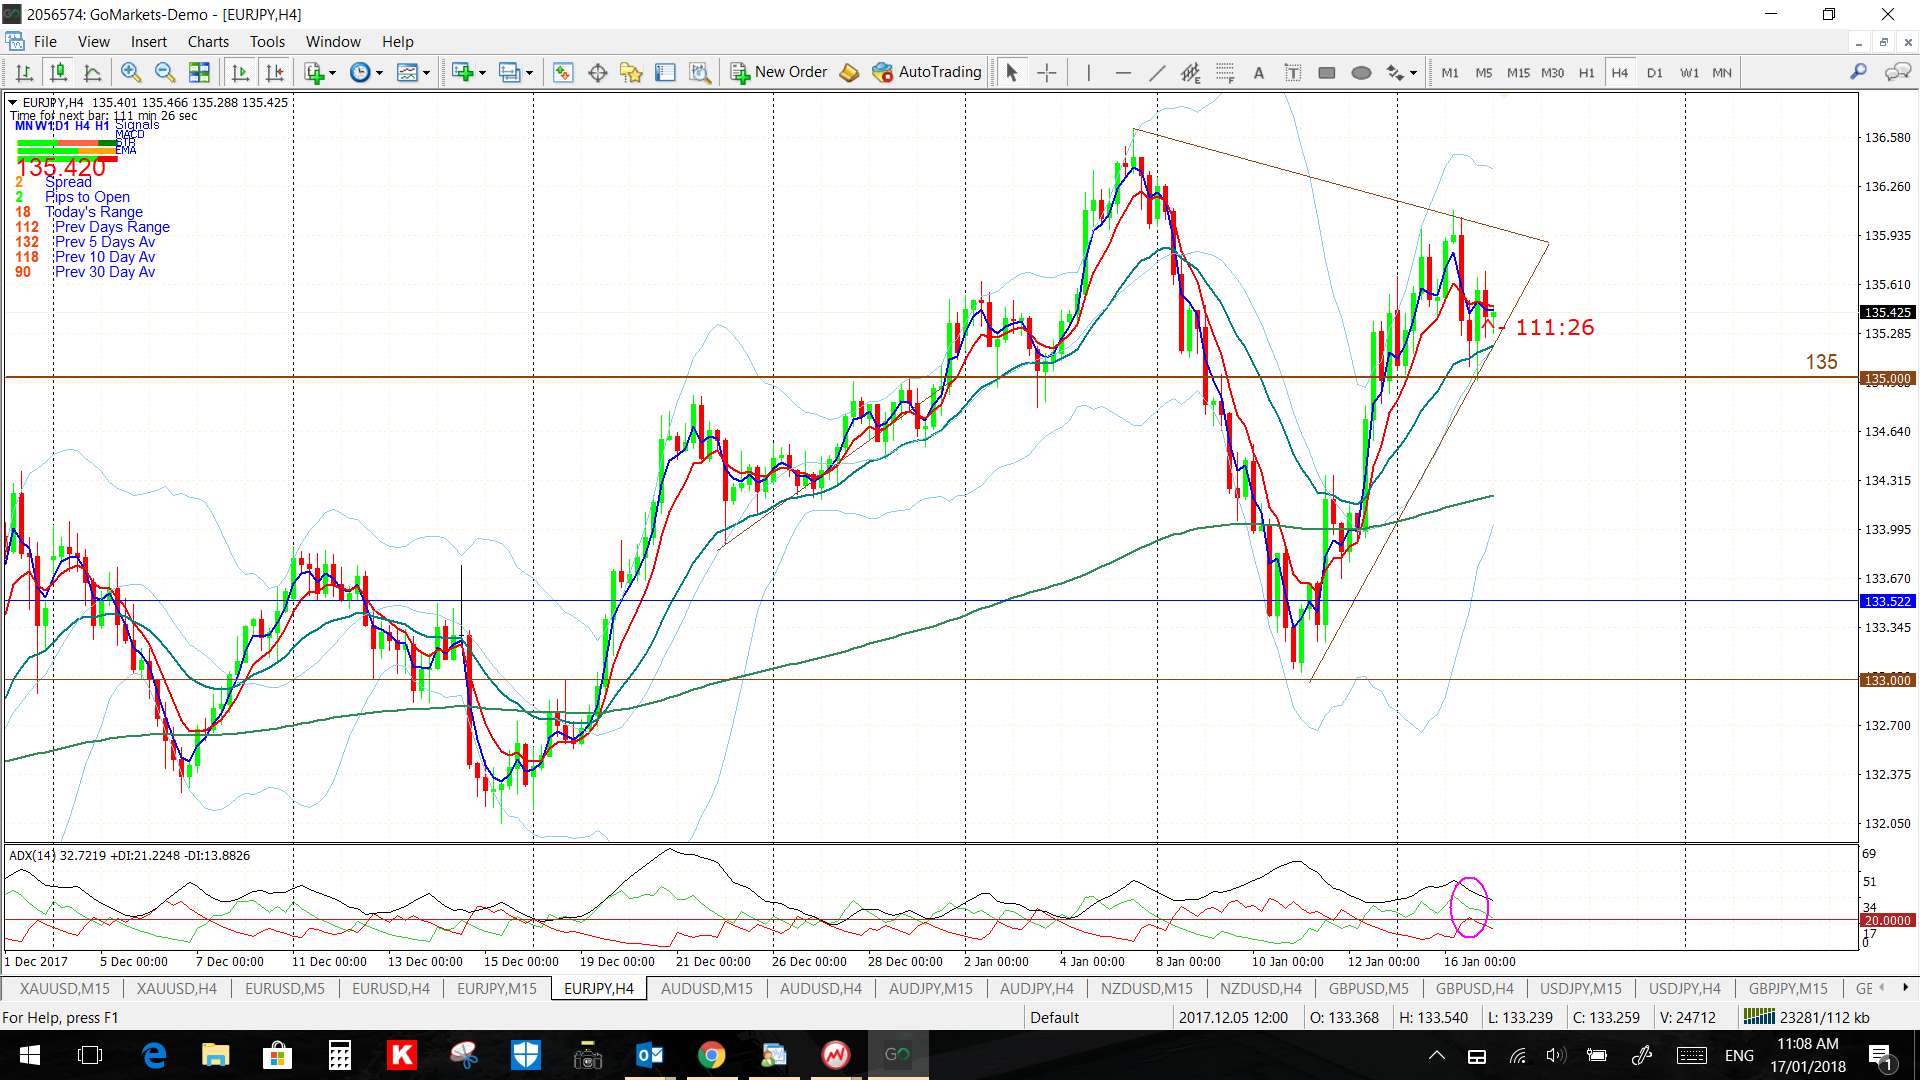
EUR/JPY 4hr:
AUD/USD 4hr:

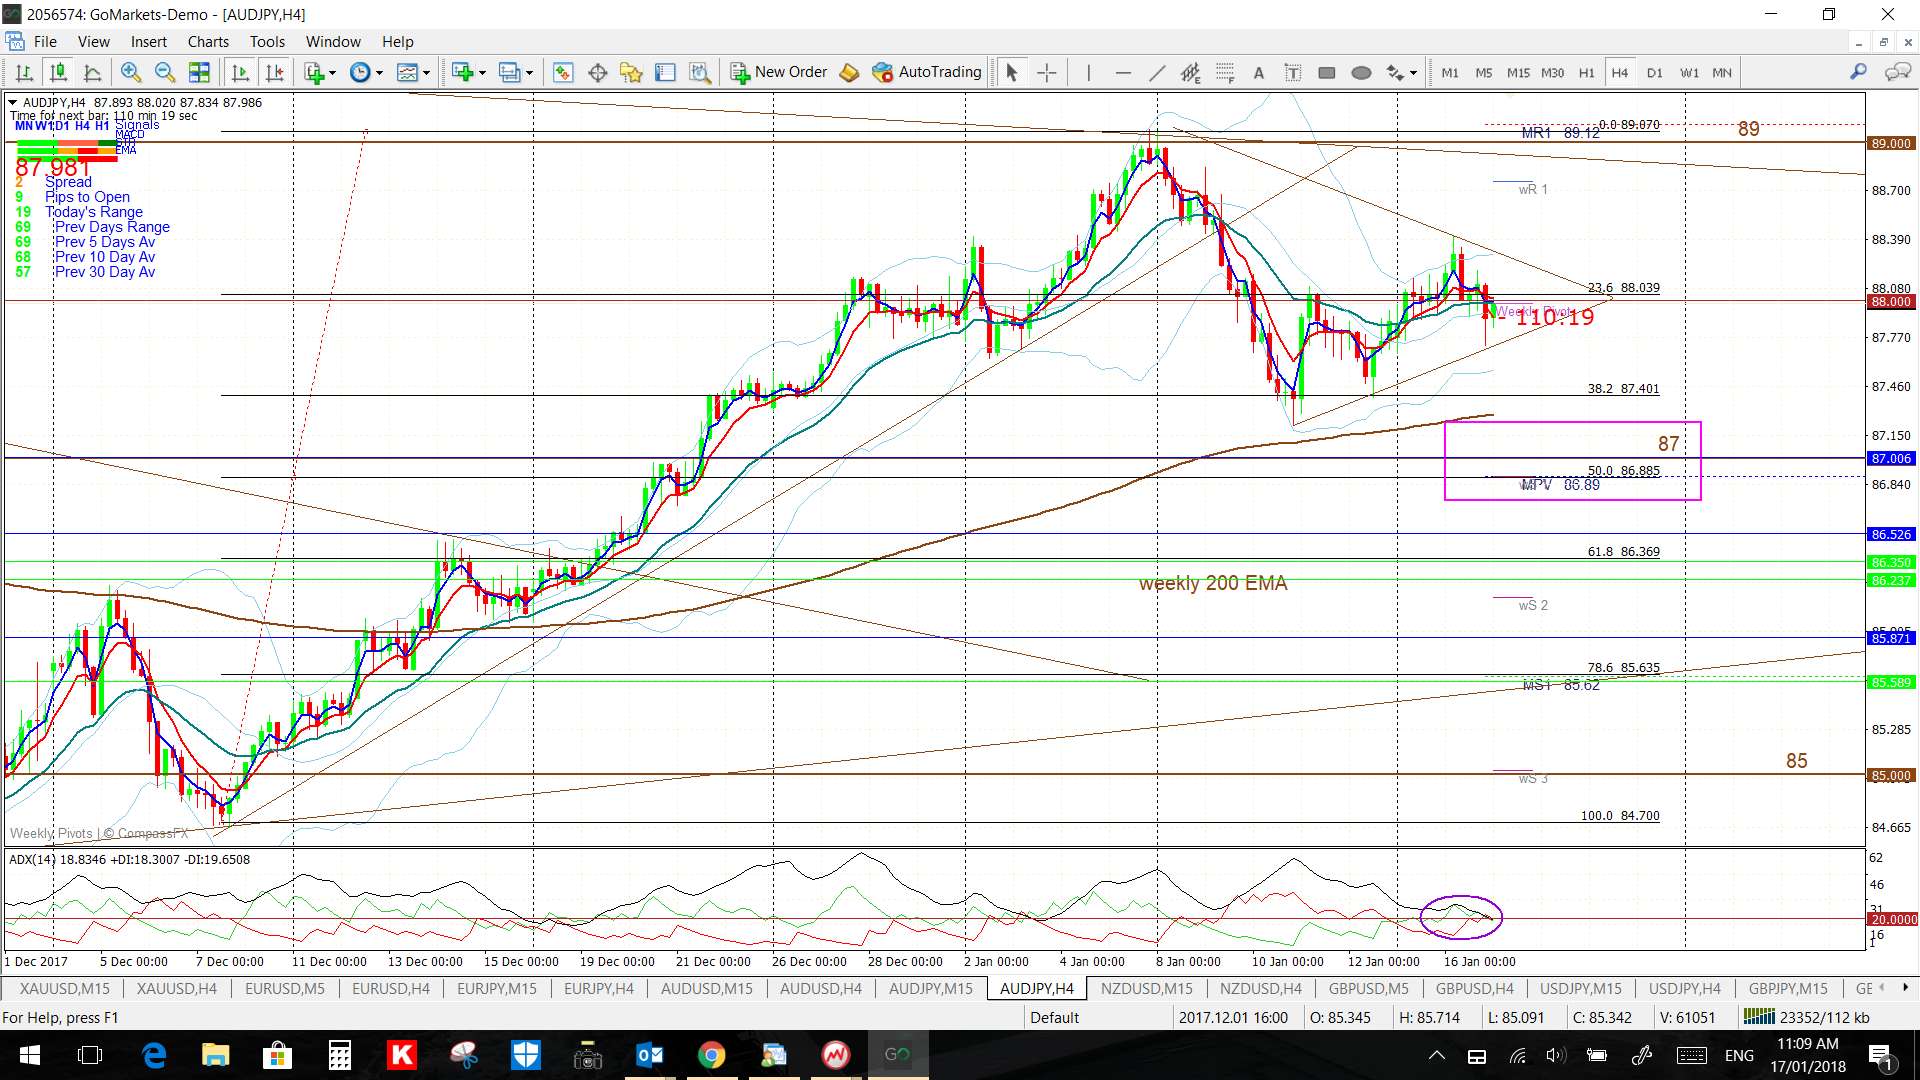
AUD/JPY 4hr:
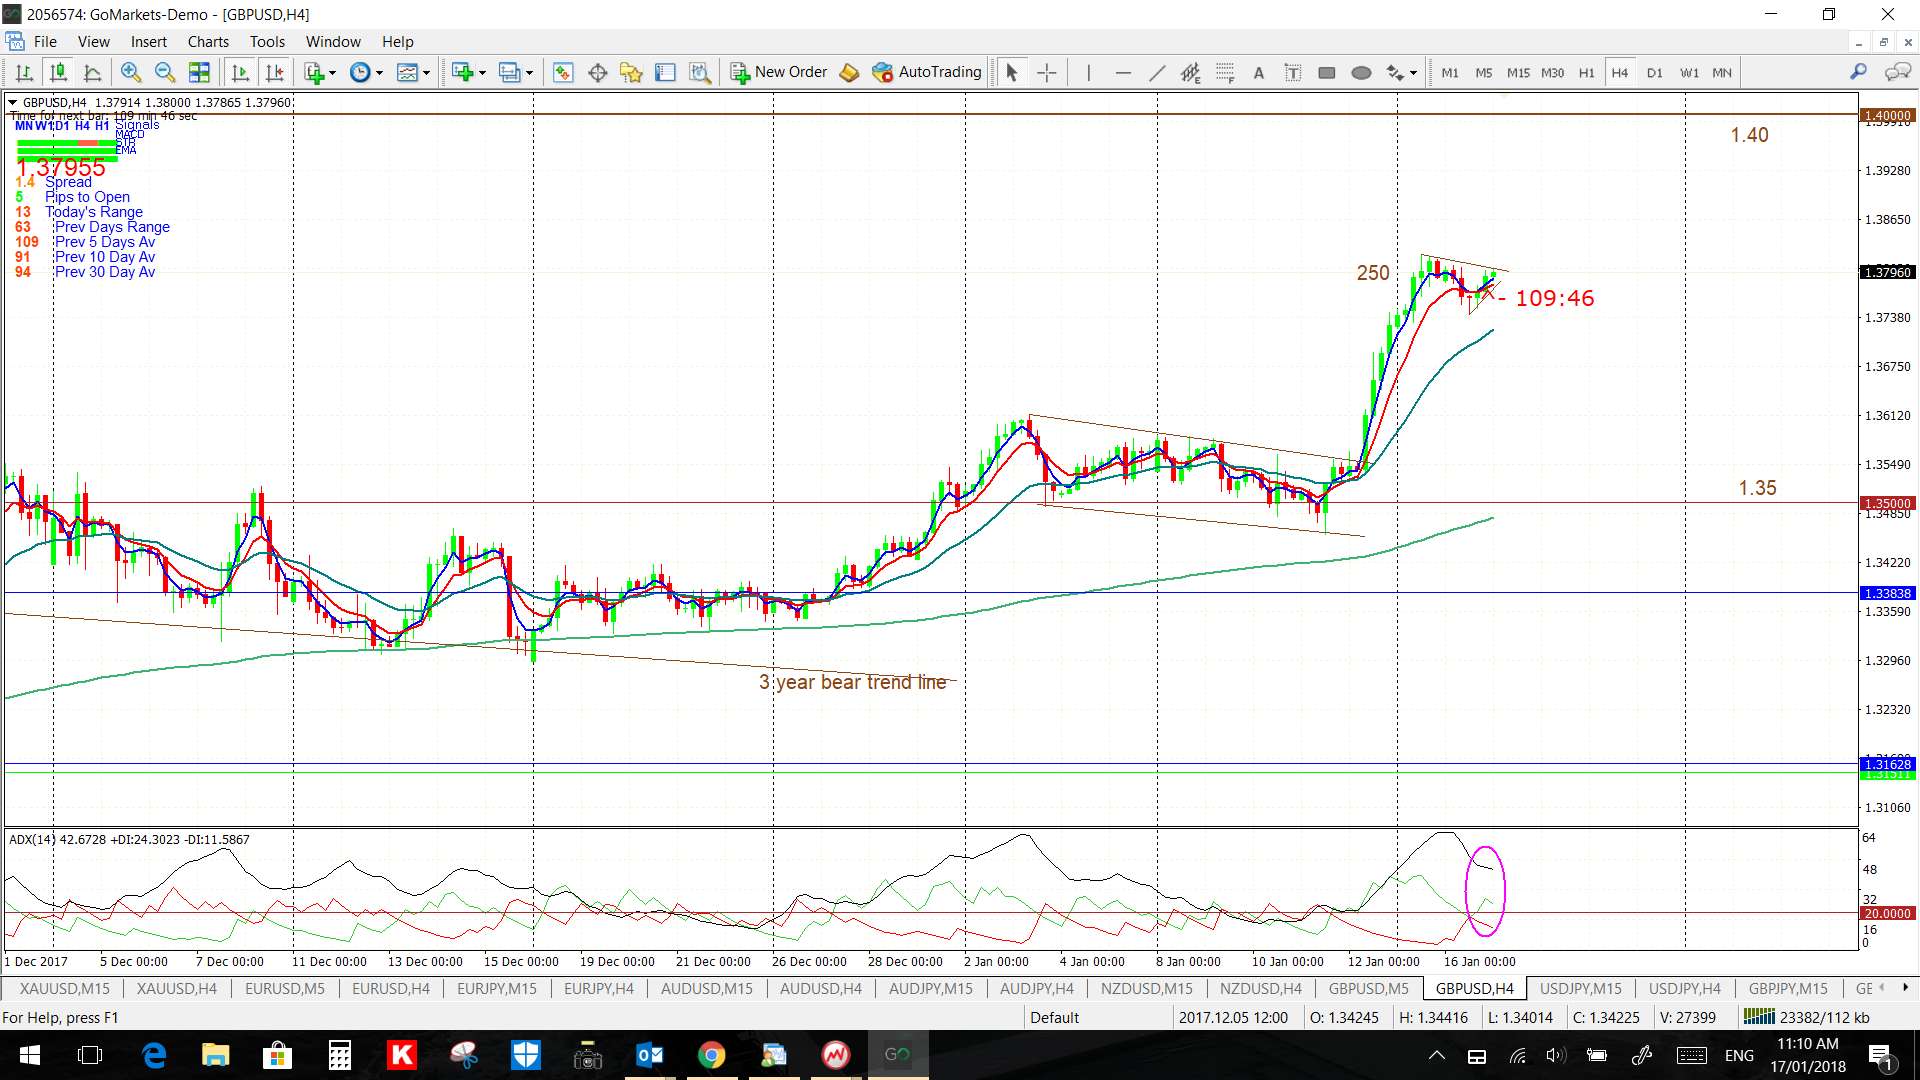
GBP/USD 4hr:
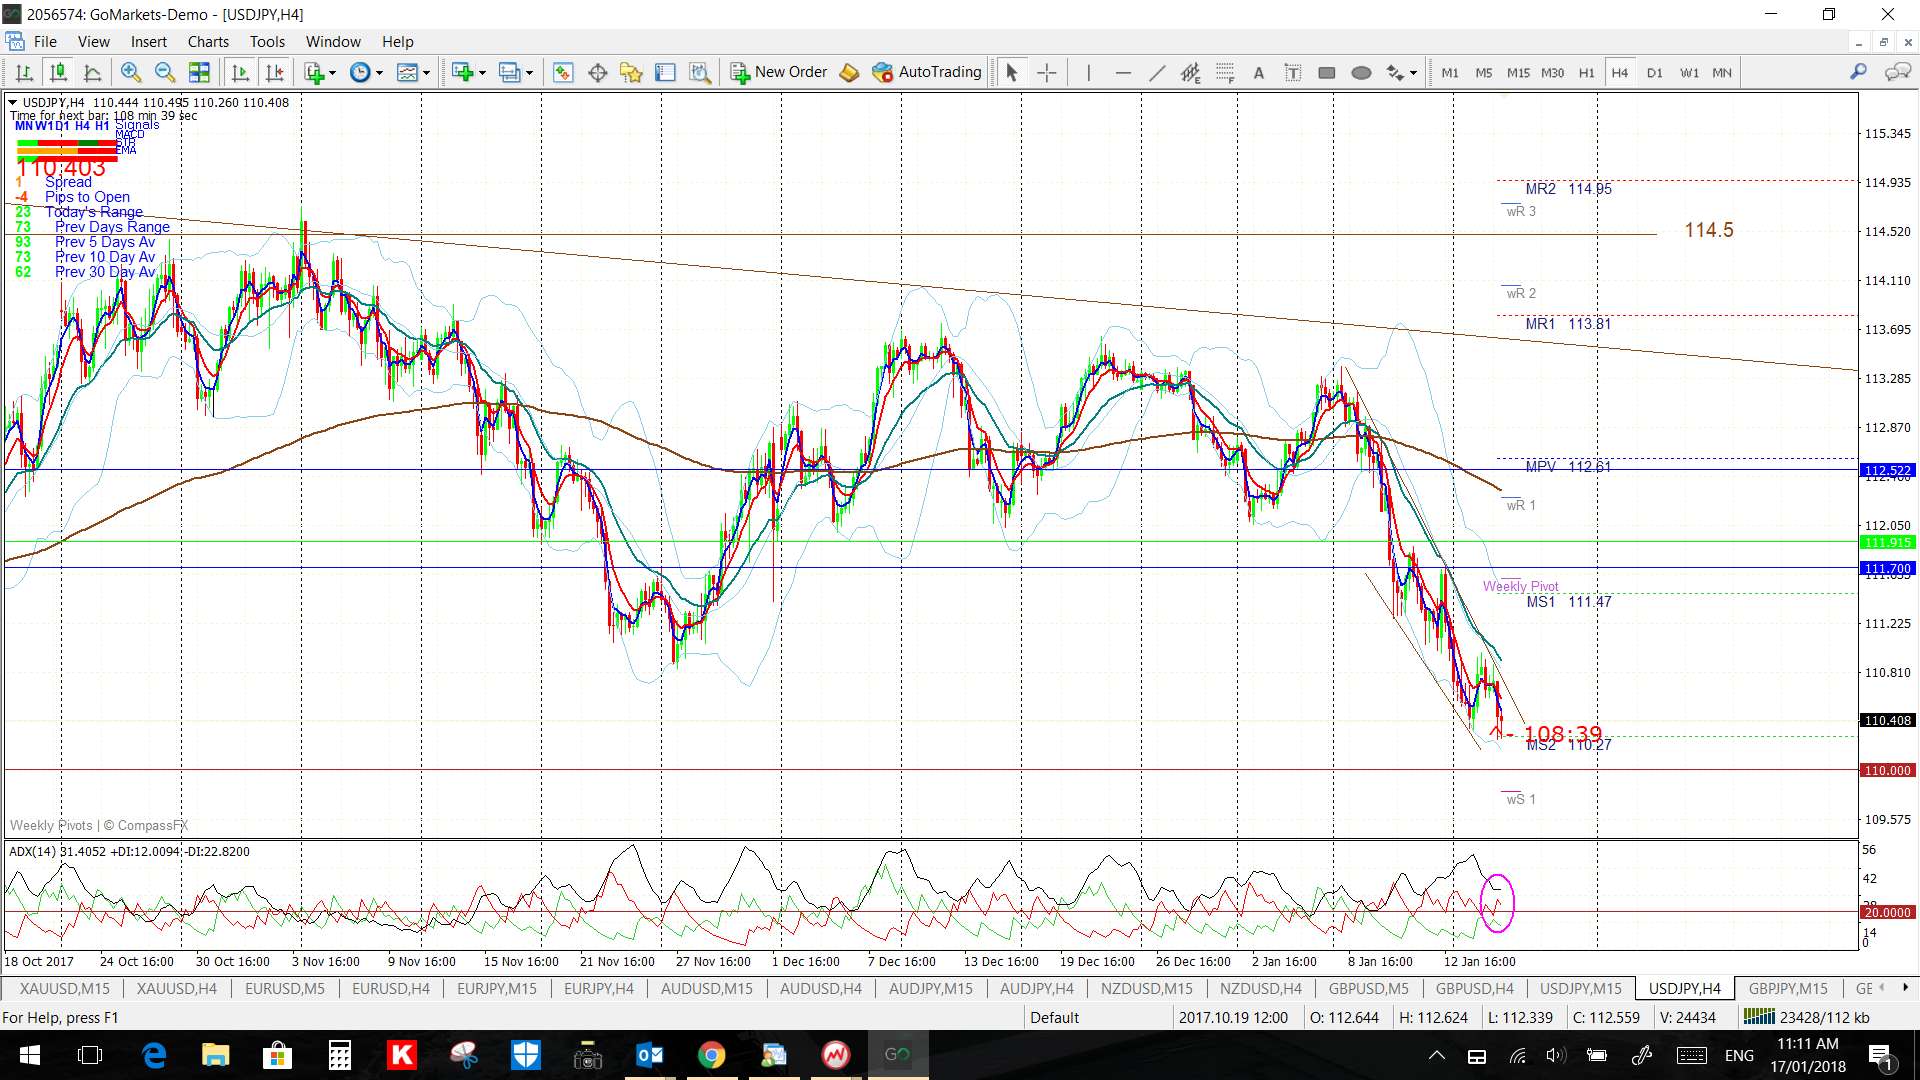
USD/JPY 4hr:
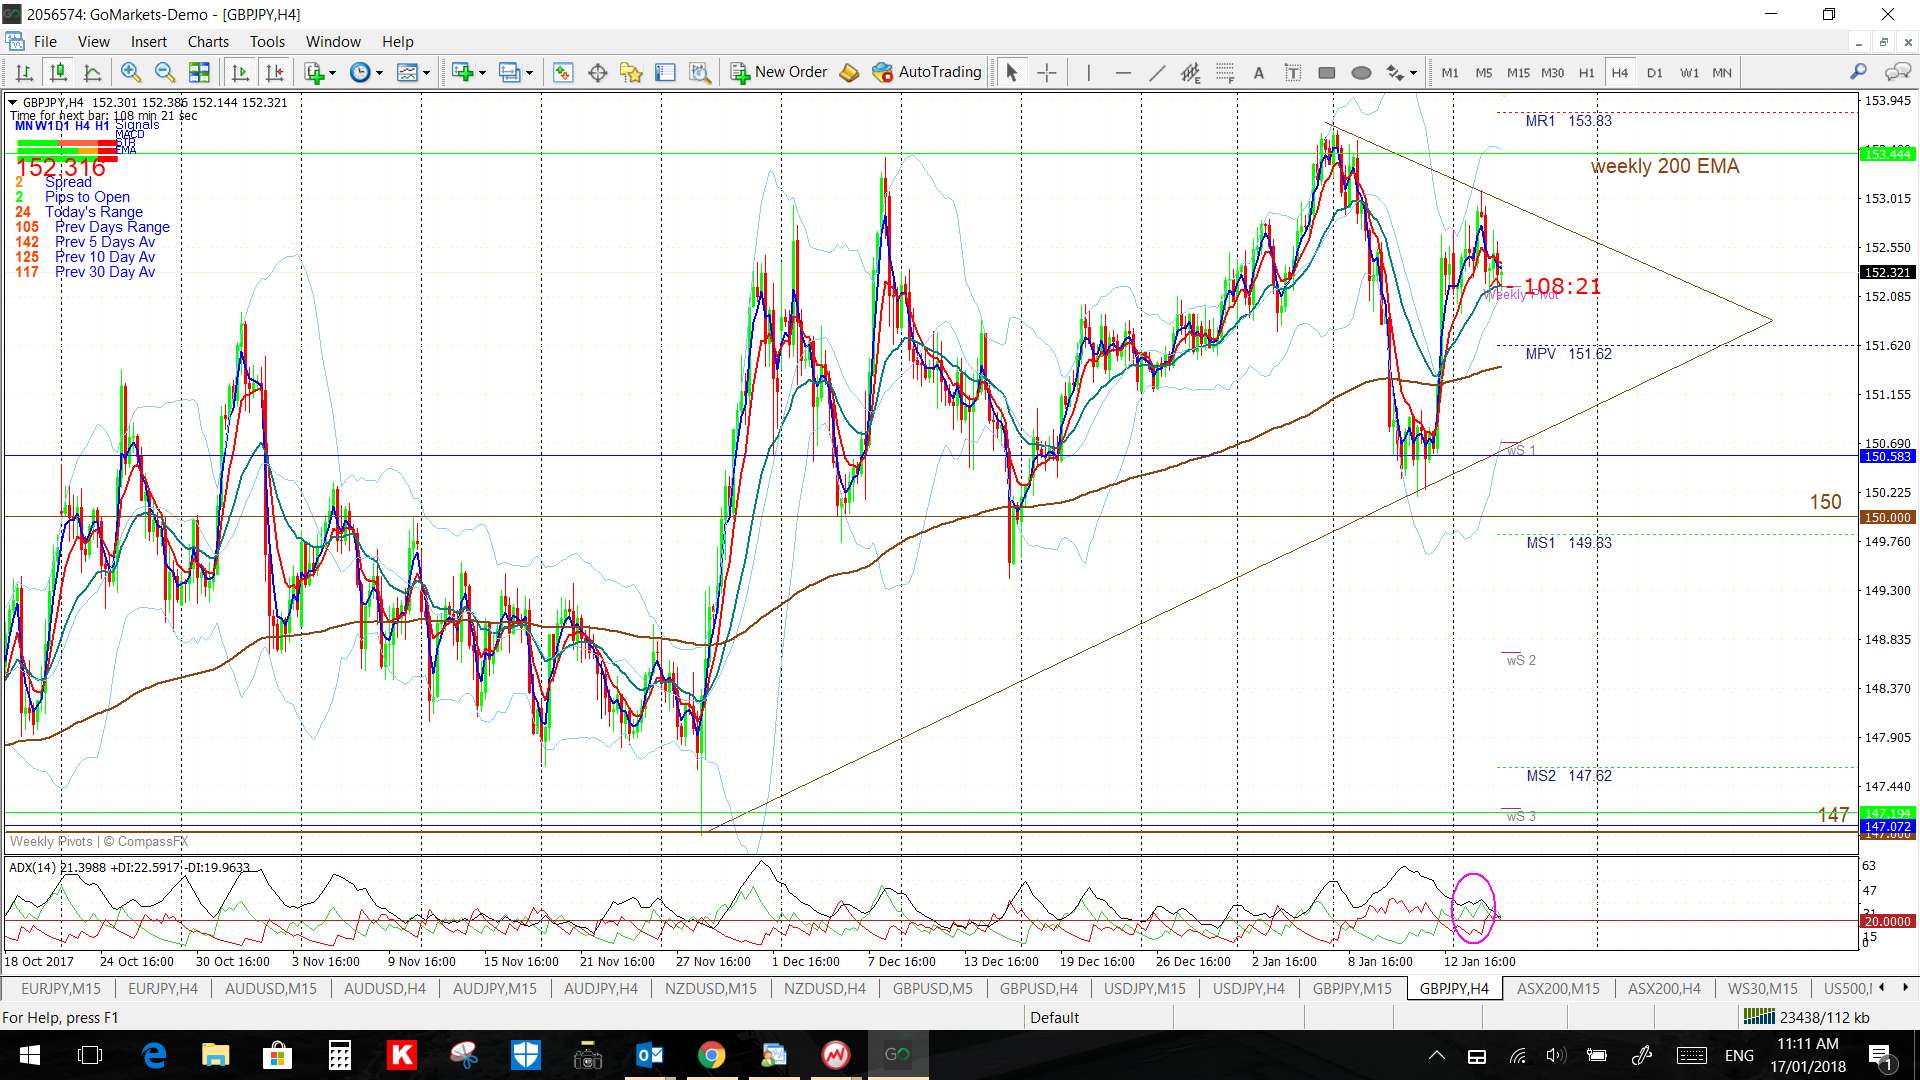
GBP/JPY 4hr:
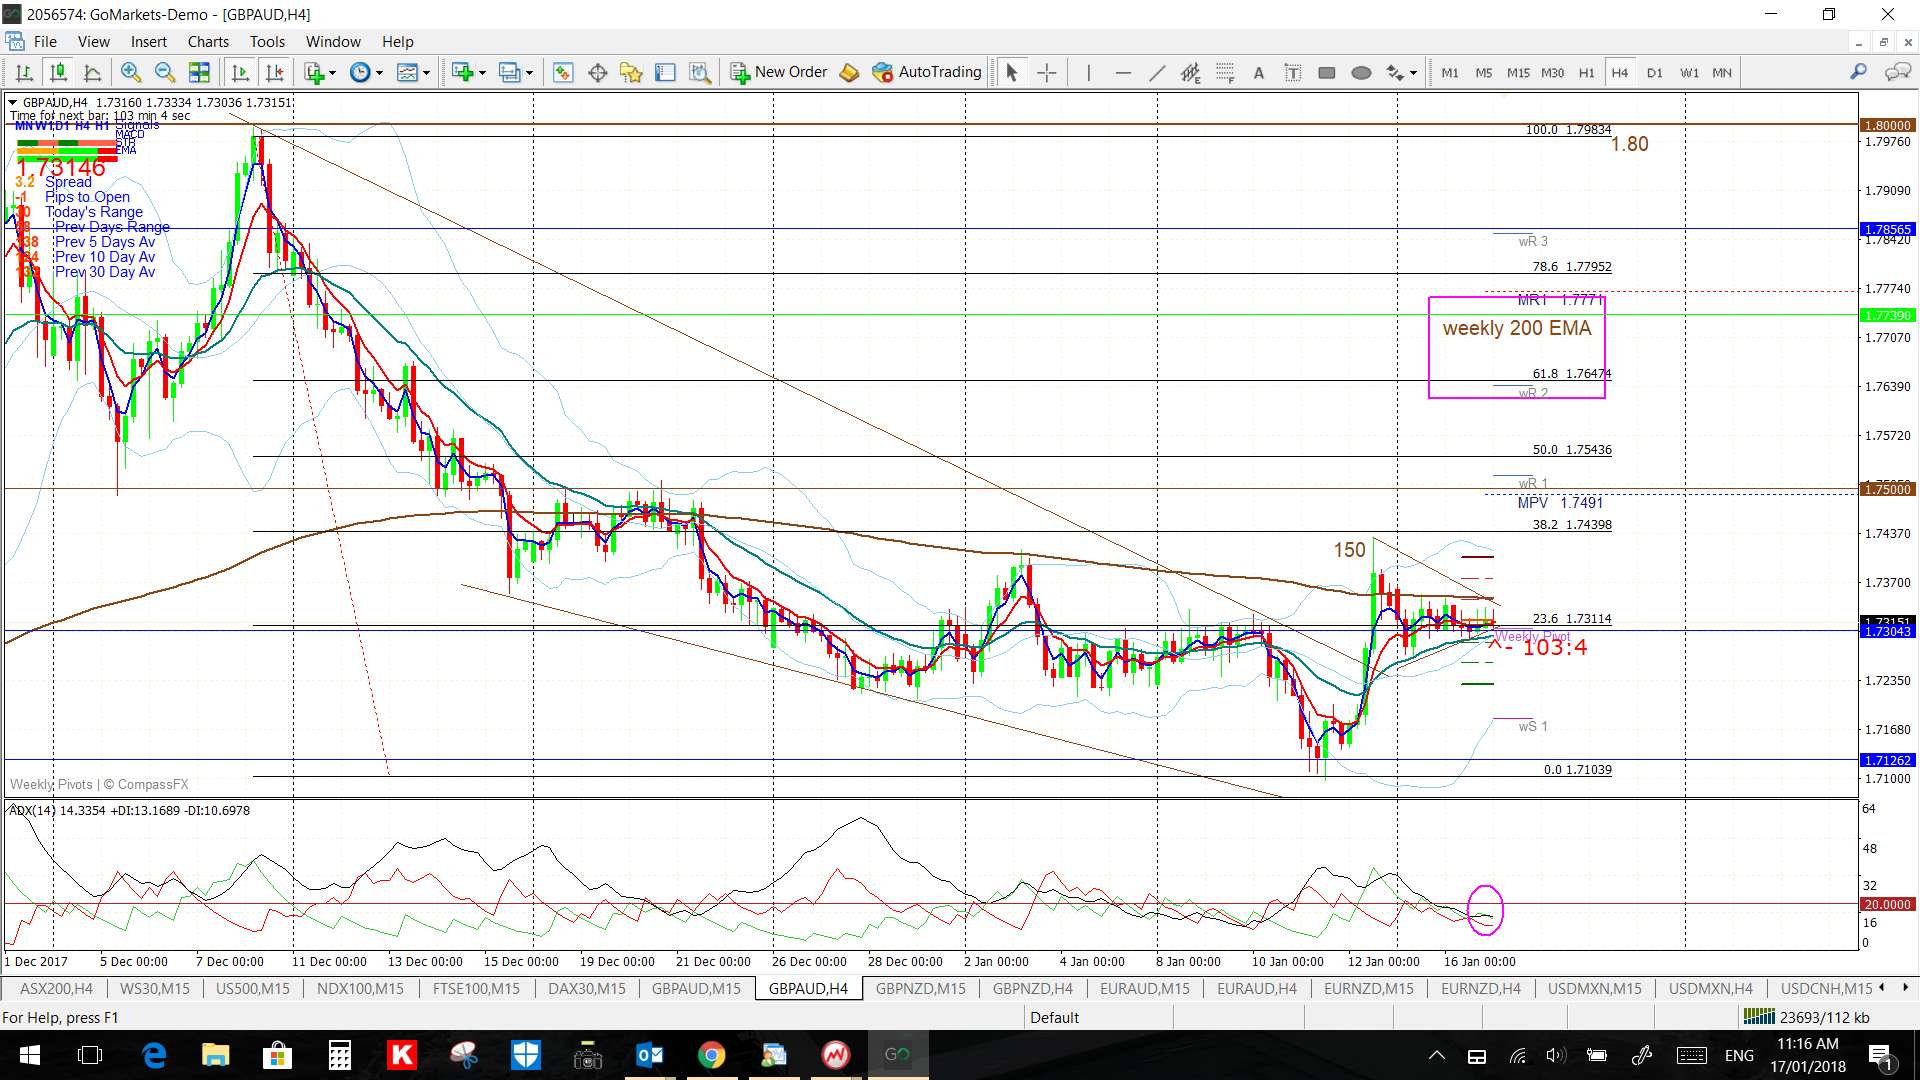
GBP/AUD 4hr:
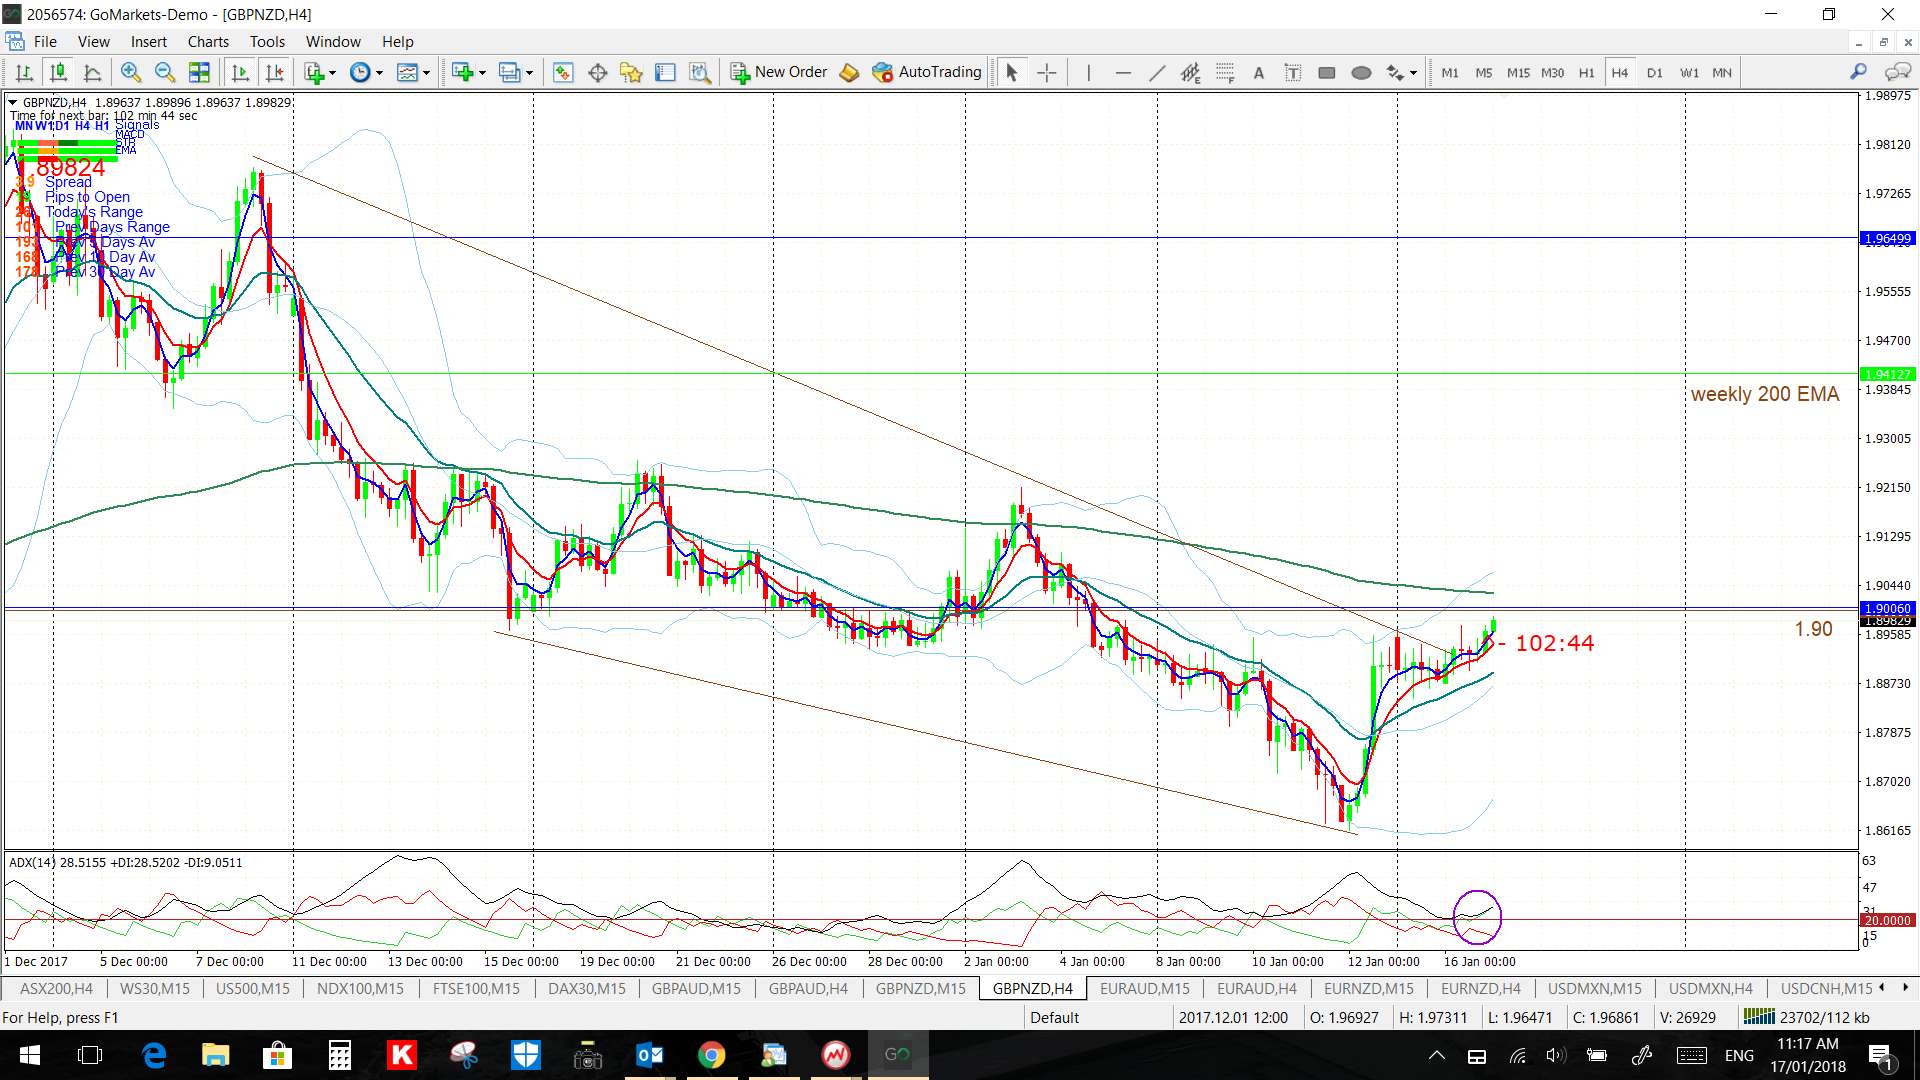
GBP/NZD 4hr:
EUR/AUD 4hr:
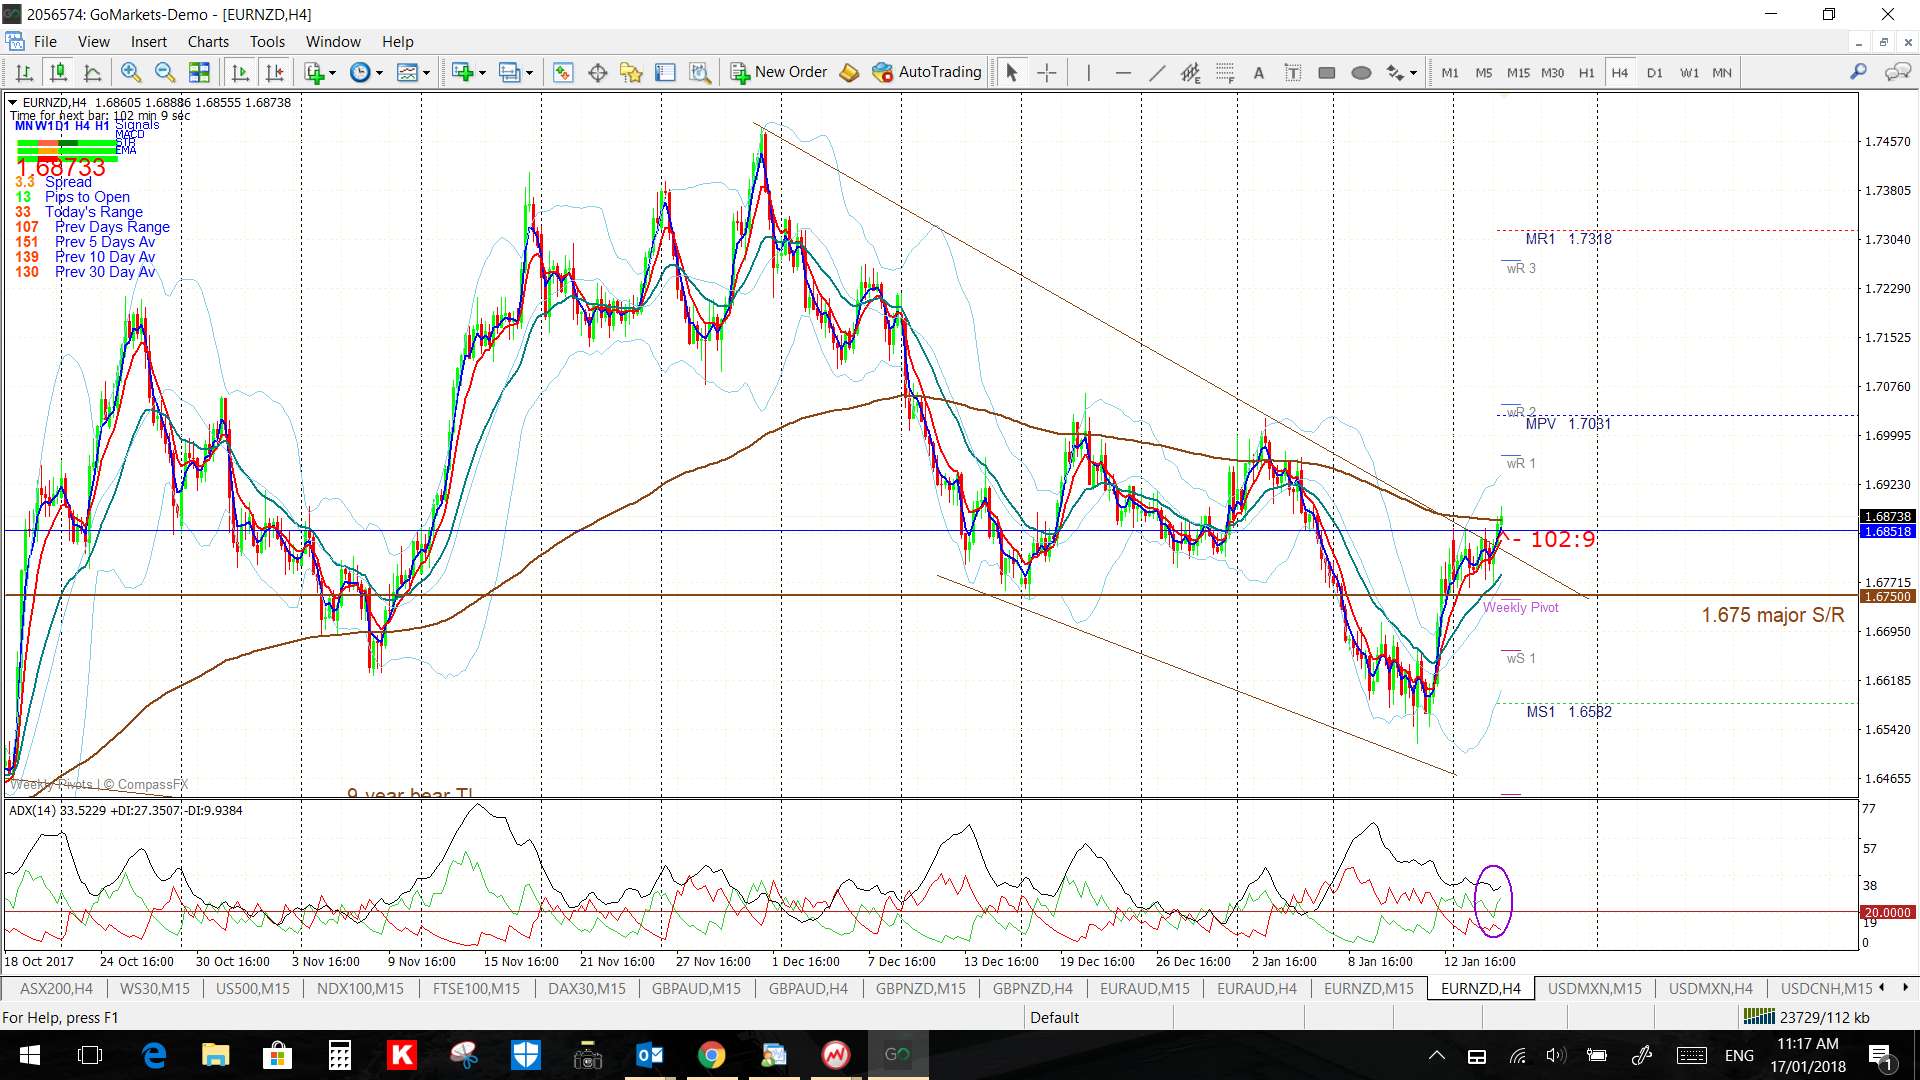
EUR/NZD 4hr:
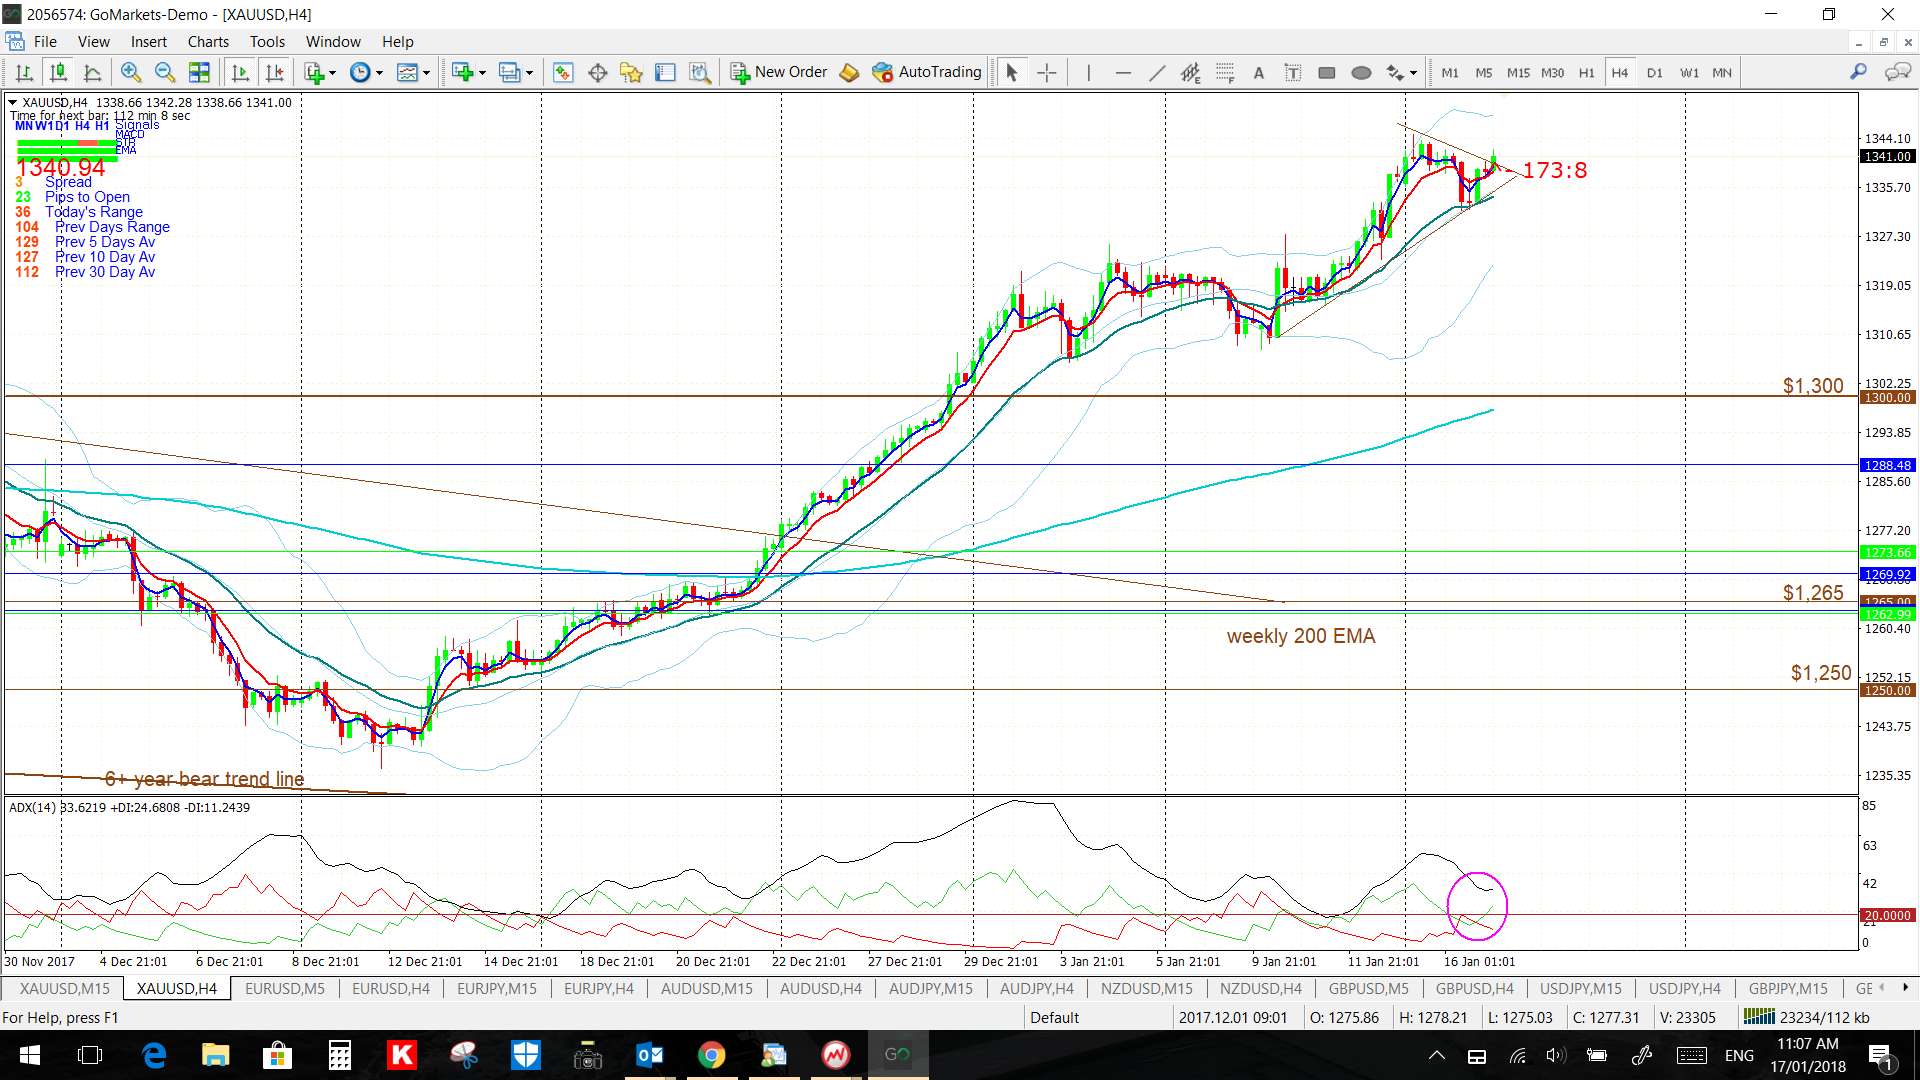
Gold 4hr:
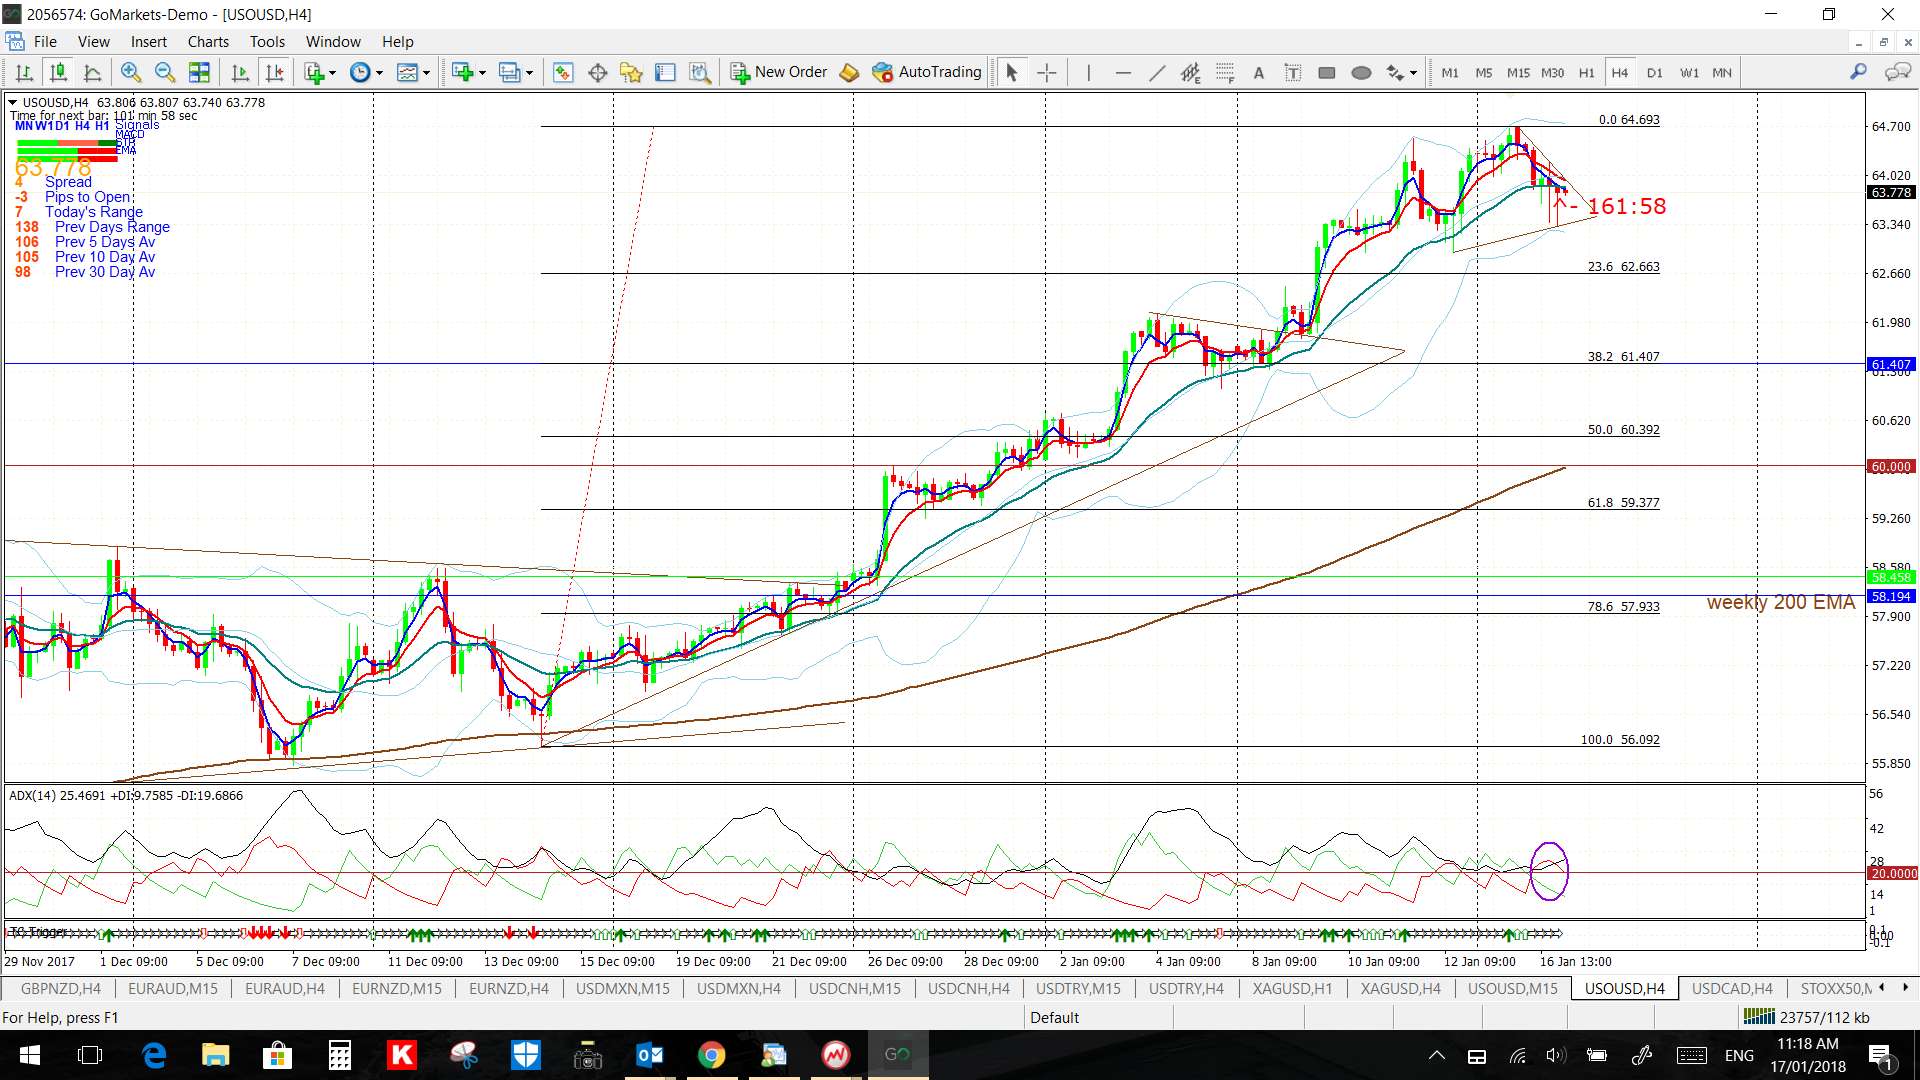
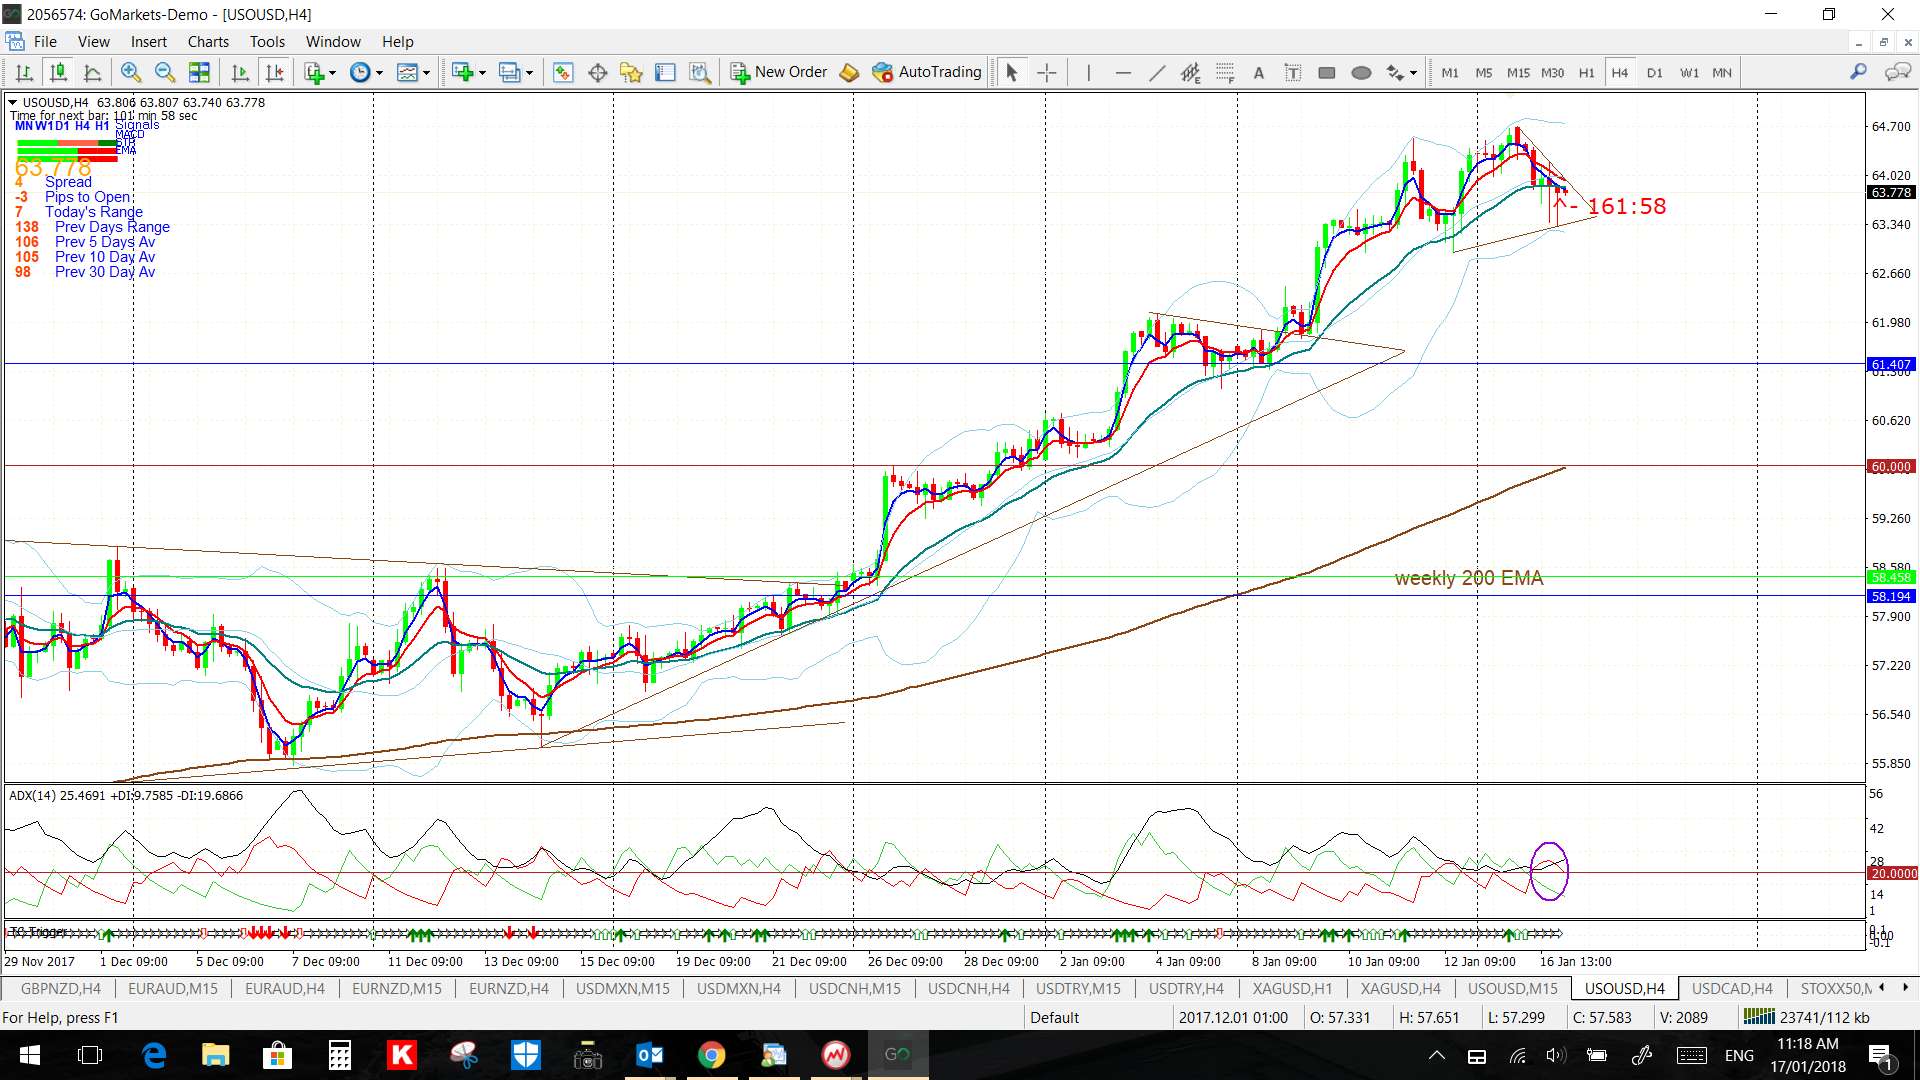
Oil 4hr:
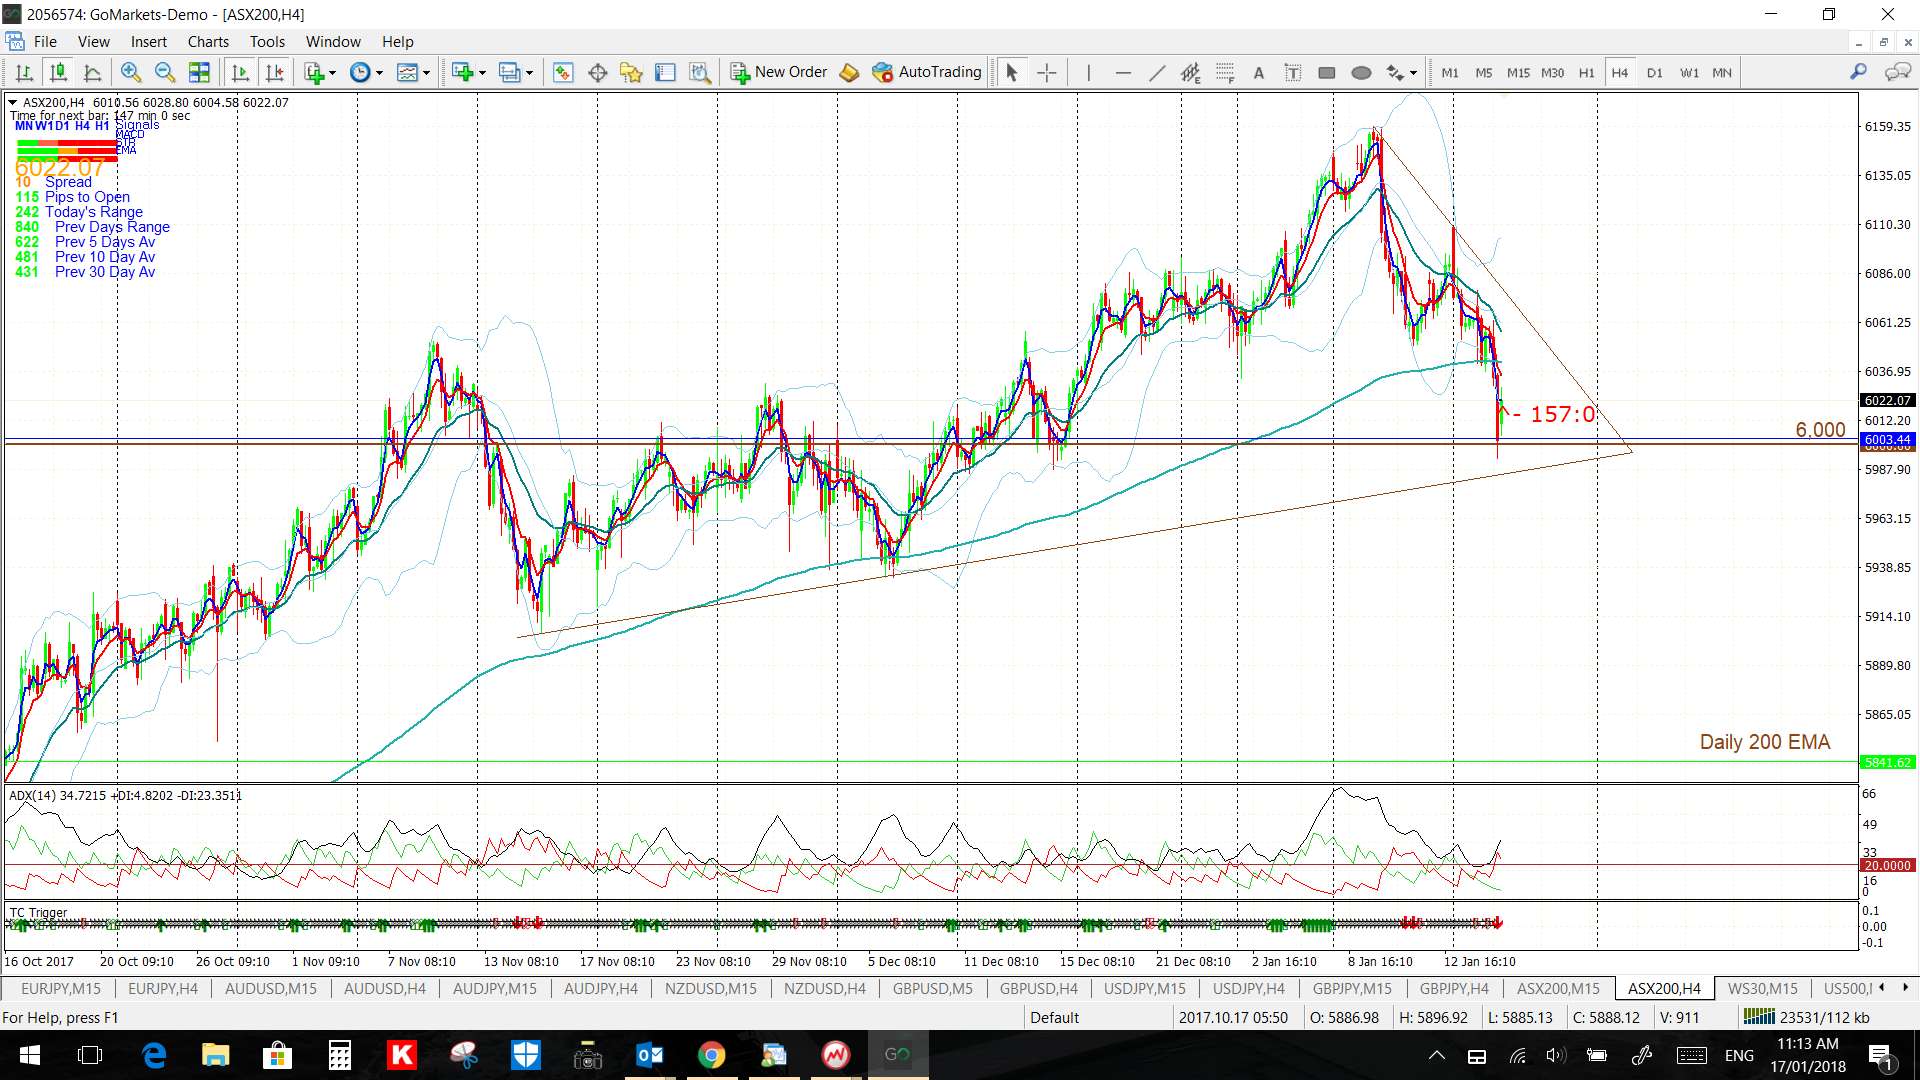
ASX-200 4hr: I had suggested I would expect a test of this major 6,000 level and we’ve now had that. So, where to from here? That is the big question! I’m looking for a hold and then continuation up to 6,800: